#data-science-and-ml
1 messages · Page 356 of 1
 lapis sequoia
 hollow sentinel
logModel = LogisticRegression()
param_grid = [

    {"penalty": ["11","12","elasticnet","none"],
    "C": np.logspace(-4,4,20),
    "solver": ["lgbfs", "newton-cg", "liblinear", "sag", "saga" ],
    "max_iter": [100,100,2500,5000]

    }

    #read hyperparameter stuff
    #https://youtu.be/pooXM9mM7FU


]

clf = GridSearchCV(logmodel, param_grid, cv=3, verbose = True, n_jobs = -1)
what am i missing here
---------------------------------------------------------------------------
NameError                                 Traceback (most recent call last)
<ipython-input-45-a320d8fc1cfc> in <module>
     15 ]
     16
---> 17 clf = GridSearchCV(logmodel, param_grid, cv=3, verbose = True, n_jobs = -1)

NameError: name 'logmodel' is not defined
 desert oar
capitalization @hollow sentinel
hollow sentinel
huh
desert oar
also doing a grid search over solvers or max_iter is not a great idea
desert oar
just because it's in a video doesn't make it a good idea
desert oar
i recommend using a book to learn machine learning, using videos to supplement the reading material, not as a primary source of knowledge
desert oar
which?
hollow sentinel
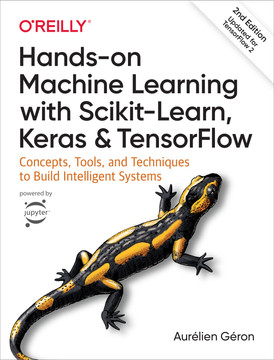
O’Reilly Online Learning
desert oar
ok sounds good
desert oar
other interesting options:
http://themlbook.com/
https://www.statlearning.com/

All you need to know about Machine Learning in a hundred pages. Supervised and unsupervised learning, support vector machines, neural networks, ensemble methods, gradient descent, cluster analysis and dimensionality reduction, autoencoders and transfer learning, feature engineering and hyperparameter tuning! Math, intuition, illustrations, all i...
An Introduction to Statistical Learning
desert oar
ISLR i think is in R
hollow sentinel
i've been reading thru a stats textbook
desert oar
but the 100 page one is python i think
desert oar
also i think the 100 page book is mostly "theory", im not sure if it has much code at all
desert oar
should be a good choice too, especially since it's pay-what-you-can
hollow sentinel

it's wild

they gave me a free pdf on their website
how much does probability play into machine learning?
desert oar
it's foundational knowledge
hollow sentinel
the hardest thing i found was bayes's theorem in probability but that made more sense once i watched a video and read more
desert oar
it depends on the problem you are solving of course, but imo a lot of business problems would be better solved by a carefully designed statistical probability model vs "machine learning"
hollow sentinel
there is also bayesian statistics
desert oar
yes, that is a whole other field but also useful
hollow sentinel
yeah i've been teaching myself stats A) bc i have a class in it next sem and B) i'm a business analytics major
desert oar
even when you are doing stuff like classifying images, having some understanding of stats can help you build better models, and more generally can help you design better systems
desert oar
e.g. you should know stuff about experiment design, sample selection, and hypothesis testing if you want to design good A/B experiments for a website
eventually yes, but not right away. you will probably hit a point where you don't really understand the math in a book or article, at which point you can start working on learning those parts
desert oar
as long as you know the basics and have good intuition for it, you should be ok
hollow sentinel
i have an internship incoming over the summer where i'm analyzing data for a company that blocks robo calls
so
this stuff should come in handy
desert oar
yeah cant hurt to refresh yourself on derivatives and matrix math
as well as making sure you are very comfortable w bayes theorem, conditional probability, and independence
desert oar
dont worry too much about learning about lots of differerent kinds of models
hollow sentinel
yep
the good news is that the prof liked that i used logistic regression and python
he never taught it in class
desert oar
understand linear regression, glms, and the basics of deep learning. that will serve you well
yep, logistic regression is a glm. good stuff
hollow sentinel
i think i'll be able to get through that stats textbook in time for the presentation
so i can explain logistic regression to the class
i'm almost on chapter 5 there are 8 chapters
i find stats interesting
desert oar
dont work too hard either. something is better than nothing, dont forget to go for a walk every day and sleep 8 hours a night
good that you find stats interesting. i bet you're going to be a very capable data scientist one day
hollow sentinel
oh yeah i actually do
50 minutes a day
to an hour and 15
i just use pomodoro
i find if i try to fit in 2 hours everything gets a bit too much and i slow down
making sure you have some fun in your life
is a good way to maintain your sanity
i have also been doing some algorithm/data structs stuff on the side for 50 minutes a day and things that i found complicated are a lot easier now
param_grid = [
 {'n_estimators': [3, 10, 30], 'max_features': [2, 4, 6, 8]},
 {'bootstrap': [False], 'n_estimators': [3, 10], 'max_features': [2, 3, 4]},
 ]

grid_search = GridSearchCV(lm, param_grid, cv =5, scoring = 'neg_mean_squared_error',
return_train_score=True)

grid_search.fit(X_train, y_train)
how do you do a pastebin again
!pastebin
 arctic wedgeBOT
Pasting large amounts of code
If your code is too long to fit in a codeblock in discord, you can paste your code here:
https://paste.pythondiscord.com/
After pasting your code, save it by clicking the floppy disk icon in the top right, or by typing ctrl + S. After doing that, the URL should change. Copy the URL and post it here so others can see it.
hollow sentinel
here's the error message
i'm not sure what these hyperparameters mean i was just going off the o'reilly code chunk
from sklearn.model_selection import GridSearchCV
param_grid = [
 {'n_estimators': [3, 10, 30], 'max_features': [2, 4, 6, 8]},
 {'bootstrap': [False], 'n_estimators': [3, 10], 'max_features': [2, 3, 4]},
 ]
forest_reg = RandomForestRegressor()
grid_search = GridSearchCV(forest_reg, param_grid, cv=5,
 scoring='neg_mean_squared_error',
return_train_score=True)
grid_search.fit(housing_prepared, housing_labels)
which is here
meh
idk what to do here
not sure what i'm missing
the error is that a pipeline is required
i don't get what to do
lapis sequoia
where i can start AI learning?
 odd meteor
hollow sentinel
```python
from sklearn.model_selection import GridSearchCV
param_grid = [
{'n_e...
odd meteor
hollow sentinel
```python
from sklearn.model_selection import GridSearchCV
param_grid = [
{'n_e...
I think it's a syntax error. For consistency, use only one curly bracket when setting your params grid dictionary.
It should only be at the beginning and at the end.
Fix it and try running it again
 dire finch
anyone know what its called to split single cell data into multiple booleans I have a cell called genre and movies can have multiple I want to split all into their own cells comedy true or false ...
 hollow stone
Anyone with some experience with the Statsmodels package that can lend a helping hand?
 serene scaffold
@hollow stone you're more likely to get help if you ask your actual question right away, rather than seeking out an expert
 sleek sentinel
Hi
I want to detect a language in very short text (for discord bot).
do you know which module is accurate enough?
hollow stone
@serene scaffold Sure thing, thanks for the pointer. I have fitted a model using https://www.statsmodels.org/dev/generated/statsmodels.regression.linear_model.OLS.fit.html and I'm now trying to use https://www.statsmodels.org/dev/generated/statsmodels.regression.linear_model.OLS.predict.html to get a prediction from said model. The model is fitted as following : model = smf.ols("ttme ~ mode + choice + invc + invt", data=modechoice).fit() and I get an error message saying NameError: name 'mode' is not defined . Long story short, I'm having trouble using the fit function and I don't find the documentation useful. This is the code I used to try to fit the model: predicted = model.predict(mode.params, [[1,1,70,90]])
hollow stone
hollow stone
<@!253696366952316929> Sure thing, thanks for the pointer. I have fitted a model...
Found it out, had to format it like this: predicted = model.predict({'mode': [1.0], 'choice': [1.0], 'invc':[70], 'invt':[90]}) , hint found here: https://github.com/statsmodels/statsmodels/issues/3987
GitHub
For the following script: import pandas as pd import statsmodels.formula.api as smf df = pd.DataFrame([[3, 0.030], [10, 0.060], [20, 0.120]], columns=['BSA', 'Absorbance&...
 frank light
sleek sentinel
I want to detect a language in very short text (for discord bot).
do you know wh...
frank light
sleek sentinel
I want to detect a language in very short text (for discord bot).
do you know wh...
in practice i find pycld2 really good and really fast (also note, pycld2 is often a better choice than cld3)
sleek sentinel
I will get
 quiet vault
So I have a multiclass problem. Here is a sample of the y_train after using the to_categorial function
[0. 0. 0. 0. 0. 0. 0. 0. 0. 0. 0. 1. 0.]
As you can see its just 0s and 1 one for the correct class
Now here is the predictions that I am getting
[1.8044574e-04, 3.3567458e-01, 2.6127091e-04, 7.3967298e-04, 1.3769721e-02
7.5341013e-05, 8.6443753e-05, 5.7786465e-01, 2.5509848e-04, 2.3692481e-02
4.6489198e-02, 7.3789188e-04, 1.7312799e-04]
As you can see there are many things that are over 1
what is the reason for this?
 grave frost
hollow sentinel
here's the error message
grave frost
hollow sentinel
here's the error message
Seem's like what it says; max_features is not a valid hyperparameter. Seeing the docs, they don't mention it so probably its in a different sklearn version (check your book ig) or perhaps its a typo 🤷♂️
 hollow hearth
Still super new to data science and am just starting to tinker with pandas. Is anyone available to grab a help channel and talk me through something?
serene scaffold
@hollow hearth go ahead and just say your pandas question here. Be sure to share everything in a copy-and-pastable way (no screenshots)
df.head().to_dict() is probably the best way to share a dataframe sample.
hollow hearth
Should I do the code to get to where I am as well? Or just the current df that I am working with
Sorry, new here!
serene scaffold
@hollow hearth I would start with the current dataframe and a brief explanation of what you want to have happen to it
!code
arctic wedgeBOT
Here's how to format Python code on Discord:
```py
print('Hello world!')
```
These are backticks, not quotes. Check this out if you can't find the backtick key.
serene scaffold
And by "current dataframe" I mean at the point in your code where you don't know what to do next.
Btw I'm on mobile so idk how much I can help
I can possibly get my laptop
hollow hearth
[{'grade_level': '3',
  'name': 'Michael Bluth',
  'on_level': True,
  'student_id': 1,
  'test_date': '2018-09-03',
  'text_level': 79,
  'text_level_max': 80,
  'text_level_min': 78},
 {'grade_level': '5',
  'name': 'Lucille Austero',
  'on_level': True,
  'student_id': 2,
  'test_date': '2018-03-03',
  'text_level': 84,
  'text_level_max': 86,
  'text_level_min': 84},
 {'grade_level': '4',
  'name': 'Maeby Funke',
  'on_level': True,
  'student_id': 3,
  'test_date': '2018-09-05',
  'text_level': 82,
  'text_level_max': 83,
  'text_level_min': 81},
 {'grade_level': '5',
  'name': 'Robert Loblaw',
  'on_level': False,
  'student_id': 4,
  'test_date': '2018-09-06',
  'text_level': 80,
  'text_level_max': 86,
  'text_level_min': 84},
 {'grade_level': '2',
  'name': 'Ann Veal',
  'on_level': True,
  'student_id': 5,
  'test_date': '2018-09-06',
  'text_level': 76,
  'text_level_max': 77,
  'text_level_min': 75}]
Every entry here has an on_level value of either True or False. I am looking to count the total entries per grade_level, and then calculate the percentage of on_level values that are True. For example, grade_level 2 has two entries total, one that is True and one that is False - so I would want to get .50% or 50% to show up
Looks like it was cut off, but in what got pasted grade_level 5 has both a true and false value
serene scaffold
One sec
hollow hearth
I have been trying to break out of the dataframe and just iterate over what I have, but I am just stuck in general. I ran (reading_levels_and_benchmarks is the DF name):
reading_levels_and_benchmarks.groupby('grade_level')['on_level'].value_counts()
to get:
grade_level  on_level
2            False       1
             True        1
3            False       1
             True        1
4            True        1
5            False       2
             True        2
which is getting kinda close to what I am going for, I just am not versed enough in pandas and/or numpy to finish lol 😦
serene scaffold
@hollow hearth looks like you've already made a lot of progress
hollow hearth
@serene scaffold thanks! it's been a slow but steady process
serene scaffold
Discord is updating on my laptop
hollow hearth
Thank you for taking a look - i really appreciate it!
serene scaffold
hollow hearth
Thank you for taking a look - i really appreciate it!
In [9]: df.groupby('grade_level')['on_level'].value_counts(normalize=True)
Out[9]:
grade_level  on_level
2            True        1.0
3            True        1.0
4            True        1.0
5            False       0.5
             True        0.5
Is this more along the lines of what you wanted?
hollow hearth
wow actually yes
serene scaffold
oops
In [13]: df.groupby('grade_level')['on_level'].value_counts(normalize=True).unstack().fillna(0)
Out[13]:
on_level     False  True
grade_level
2              0.0    1.0
3              0.0    1.0
4              0.0    1.0
5              0.5    0.5
This
hollow hearth
Basically just make it print out to look like this:
grade_level | percent_reading_on_GL
| 2         + ?%                   |
| 3         + ?%                    |
| 4         + ?%                    |
| 5         + ?%                    |
+-----------+----------------------+
is what you really want just the percent that are true?
hollow hearth
Yep - just the true %
serene scaffold
ohh let me see
serene scaffold
hollow hearth
Basically just make it print out to look like this:
```py
grade_level | percent_...
while it might not be immediately obvious, True and False are 1 and 0, respectively
In [14]: df.groupby('grade_level')['on_level'].mean()
Out[14]:
grade_level
2    1.0
3    1.0
4    1.0
5    0.5
Name: on_level, dtype: float64
Treating them as such, taking the mean does the same thing
hollow hearth
Man, kinda wanna pound my head on my desk lol. I was overthinking big time
serene scaffold
hollow hearth
Man, kinda wanna pound my head on my desk lol. I was overthinking big time
it will be okay
hollow hearth
So this
df.groupby('grade_level')['on_level'].mean()
is just saying group by the grade_level's average on_level?
serene scaffold
hollow hearth
So this
```py
df.groupby('grade_level')['on_level'].mean()
```
is just saying g...
"take the mean of on_level grouped by grade_level"
hollow hearth
ahh gotcha
Gonna finish this question up, I MIGHT have another question in a sec
thank you again, means a ton!
serene scaffold
You are welcome 💚
hollow hearth
Is there a way to label the mean column?
serene scaffold
hollow hearth
Is there a way to label the mean column?
in what context?
hollow hearth
so the columns would appear as 'grade_level' and something like 'percent_on_level' or something like that
Not a huge deal if not, more just curious
serene scaffold
hollow hearth
so the columns would appear as 'grade_level' and something like 'percent_on_leve...
In [23]: print(df.groupby('grade_level')['on_level'].mean().rename('precent_on_level').to_markdown())
|   grade_level |   precent_on_level |
|--------------:|-------------------:|
|             2 |                1   |
|             3 |                1   |
|             4 |                1   |
|             5 |                0.5 |
 hollow hearth
@serene scaffold now back to the original DF - I want to pull the student_id and name where on_level is false. Is where() the best way to go about that? I keep thinking in SQL terminology lol
serene scaffold
Sounds like you basically want one minus the values in the dataframe we made?
hollow hearth
Kinda :
{'grade_level': '5',
  'name': 'Robert Loblaw',
  'on_level': False,
  'student_id': 4,
  'test_date': '2018-09-06',
  'text_level': 80,
  'text_level_max': 86,
  'text_level_min': 84}
In this one's case I want to the output to be:
student_id | name
4            Robert Loblaw
There are many libraries that can do this. Langdetect library is pretty good for language detection.
pip install the library and have fun with it 😊
 serene scaffold
@hollow hearth sounds like you can just select those columns
And print it
Also you can make student_id the index
hollow hearth
Got it with:
reading_levels_and_benchmarks.loc[reading_levels_and_benchmarks['on_level'] == False, ['student_id', 'name']]
😄
serene scaffold
hollow hearth
Got it with:
```py
reading_levels_and_benchmarks.loc[reading_levels_and_benchmar...
Instead of blah == False do ~blah
serene scaffold
It negates a series
Same as the not keyword, but does it to everything in the series/dataframe
serene scaffold
💚💚💚💚
hollow hearth
Any recommendations for a solid overview course / video series on pandas/numpy? Or would you just recommend doing random projects like this
serene scaffold
@hollow hearth uhhhh. Just keep doing stuff without using for loops
And eventually you figure it out
serene scaffold
@hollow hearth you too! Punch a Nazi!
 wheat ice
pandas people, difference between boolean mask filtering & using df.query?
 upbeat dove
If I'm making a neural net from scratch, is it better to use sigmoid or tanh to get a number between 0 and 1?
Or something else?
(like ReLU)
serene scaffold
wheat ice
pandas people, difference between boolean mask filtering & using `df.query`?
since query is a function call, it can't be used in assignment expressions like df.loc[df[blah] == foo] = bar
 austere swift
upbeat dove
If I'm making a neural net from scratch, is it better to use sigmoid or tanh to ...
austere swift
upbeat dove
If I'm making a neural net from scratch, is it better to use sigmoid or tanh to ...
tanh goes between -1 and 1
and relu is pretty much just min(0, x) so it's not actually putting it between 0 and 1 its just putting the floor at 0
sigmoid is the only one you mentioned that would go between 0 and 1
upbeat dove
austere swift
tanh goes between -1 and 1
Ah, Ive seen it is used but it had / 2 + 0.5
 ripe forge
wheat ice
pandas people, difference between boolean mask filtering & using `df.query`?
ripe forge
wheat ice
pandas people, difference between boolean mask filtering & using `df.query`?
I'd suggest don't use the query interface, use Boolean mask. Bit more verbose perhaps but you'll always know exactly what's happening
wheat ice
there's also something i've seen some suggest before, using np.logical_or <<< something like this? instead of df.loc[(condition1) | (condition2)]
 modest timber
hey, how could I plot big array of numpy by rows


I try to get muliplot of all single row
 humble nimbus
Anybody every use window functions in Pyspark? I'm creating a window but I want to apply a filter before calculating the avg of a column.
Currently I have this
w = Window.partitionBy("id")

df = df.withColumn("avg_amount_loans_previous", F.avg("loan_amount").over(w))
And I tried something like this but it's returning a TypeError: 'Column' object is not callable
df = df.withColumn("avg_amount_loans_previous", F.avg("loan_amount").over(w).filter(df.loan_date < col("loan_date")))
 lethal flame
def batonPass(friends, time):
    # Write your code here

    array = []

    if friends > time:
        array.append(time-1)
        array.append(time)

    elif friends < time:
        array.append(time+1)
        array.append(time)
``` whats wrong with this codeIs it bad with short text
from langdetect import detect, DetectorFactory, detect_langs

my_string = "Bonjour"

DetectorFactory.seed = 42

print(detect_langs(my_string))```result: [hr:0.5714256316621137, fr:0.42857100983623975]
same with "Hello"
odd meteor
sleek sentinel
Is it bad with short text
I haven't used it on a single word before but I've used it on short and long sentences and it performed pretty great. It only performed woefully when I tried it with my native African language which is ( Igbo).
sleek sentinel
okay, but the problem is that on discord we send this kind of short text 😦
like hello, hi etc...
odd meteor
sleek sentinel
same with "Hello"
What's the probability score(s) of detected language(s) when you tried it on "Hello"?
Try increasing it to 3 letter sentence and guage its performance.
Like I said before, there are many libraries that can also detect languages. You might wanna try checking other libraries then compare and contrast
odd meteor
sleek sentinel
like hello, hi etc...
Are you building a Bot? 😀 If you're specifically worried about little words like hi, hello, hey and other casual greetings, then you need not worry much about it.
Increase it a sentence not just single word greetings.
Can you try
"Hey, good morning"
sleek sentinel
odd meteor
Are you building a Bot? 😀 If you're specifically worried about little words lik...
yes
You mean start detecting from 2 words or more?
odd meteor
sleek sentinel
You mean start detecting from 2 words or more?
Yes. Essentially, try nudge up the number of words a bit. Use it on sentences not single words.
sleek sentinel
okay, but sometimes there is "hi xD"
then it is true that it is a solution, but the problem is that it will not translate words like hello etc
and I know that people are going to hold it against me :p
odd meteor
sleek sentinel
okay, but sometimes there is "hi xD"
The more the words or the longer the sentence, the less ambiguous it'll become for langdetect to pick up the underlying language used.
More Data = Better Performance 🤝
odd meteor
sleek sentinel
and I know that people are going to hold it against me :p
Langdetect isn't the only library though. Try out others and see if they'll give better result.
The only issue I've had with langdetect is that, the dataset used to pretrain the model behind langdetect is certainly not robust enough to capture African languages very well.
sleek sentinel
okay^^
 wind pollen
hey i know this is probably somehting obvious im missing but would any of you know why there are two brackets here?

this is from the pytorch introduction tutorial here https://pytorch.org/tutorials/beginner/basics/buildmodel_tutorial.html
 dusk iris
So currently i have a piece of software that is looking for an object on the video feed by calculating the Contours and estimating which of the found contours is the object i need.
Now is there any way to sort of 'focus' on that part of frame where the object is found, so i could save that piece as an separate image
 lone pumice
hi, does anyone know if there's a way to check if jupyterlab has been opened by a client in a browser? Like the jupyter server is remote and I want to shut down the server if no client has opened jupyterlab in their browser in some time.
(p.s. i dont know which channel to ask this in so asking it here)
 humble salmon
 teal mortar
use plt.subplots(1, 2)
teal mortar
use plt.subplots(1, 2)
okay thank youuu
hollow sentinel
>>> from sklearn import svm, datasets
>>> from sklearn.model_selection import GridSearchCV
>>> iris = datasets.load_iris()
>>> parameters = {'kernel':('linear', 'rbf'), 'C':[1, 10]}
>>> svc = svm.SVC()
>>> clf = GridSearchCV(svc, parameters)
>>> clf.fit(iris.data, iris.target)
GridSearchCV(estimator=SVC(),
             param_grid={'C': [1, 10], 'kernel': ('linear', 'rbf')})
>>> sorted(clf.cv_results_.keys())
['mean_fit_time', 'mean_score_time', 'mean_test_score',...
 'param_C', 'param_kernel', 'params',...
 'rank_test_score', 'split0_test_score',...
 'split2_test_score', ...
 'std_fit_time', 'std_score_time', 'std_test_score']
here's the doc sample code from scikit learn
for gridsearch CV
lm = LogisticRegression()
scores = cross_val_score(lm,X_train,y_train,scoring="r2",cv=5)
scores

from sklearn.model_selection import GridSearchCV
parameters = {'kernel':('linear', 'rbf'), 'C':[1, 10]}

clf = GridSearchCV(lm, parameters)

clf.fit(X_train, y_train)

GridSearchCV(estimator=LogisticRegression(),
             param_grid={'C': [1, 10], 'kernel': ('linear', 'rbf')})
here is my code for using grid search CV w logistic regression
!pastebin
arctic wedgeBOT
Pasting large amounts of code
If your code is too long to fit in a codeblock in discord, you can paste your code here:
https://paste.pythondiscord.com/
After pasting your code, save it by clicking the floppy disk icon in the top right, or by typing ctrl + S. After doing that, the URL should change. Copy the URL and post it here so others can see it.
hollow sentinel
here is the error message
is grid search CV just incompatible with logistic regression
hm let me try something else
ok i think i did it
hollow sentinel
dumb question
how much does distributions like binomial distribution, geometric distribution, and poisson distribution, etc. play a role in data science?

is this n on top of x thing in the binomial distribution just mathematical notation
3 trials, 2 successes?
 calm thicket
it means nCx
calm thicket
you forgot the x! factorial on the bottom, but yeah
calm thicket
n choose x, yeah
 pastel valley
in classifications with 3 classes it is standard to use confusion matrix for evaluation? it can tell which is the class the model perform worst right?
serene scaffold
pastel valley
in classifications with 3 classes it is standard to use confusion matrix for eva...
you can use a confusion matrix for that, yes
hollow sentinel
is confusion matrix like
a stats topic
or is it like a machine learning/data science topic
bc i'm looking for it in my stats textbook and it's not there
oh it's a classification thing
i remember looking at it in class w the true positive, true negative, false positive, false negative
 vague fern
Why does linear regression model require a 2D data set always and not 1D
grave frost
vague fern
Why does linear regression model require a 2D data set always and not 1D
because
what
...you can't plot a point with a single value?
lapis sequoia
hollow sentinel
bc i'm looking for it in my stats textbook and it's not there
I think it should be put in data science since it's heavily associated with classification.
lapis sequoia
vague fern
Why does linear regression model require a 2D data set always and not 1D
Uhm no?
Say
We have just one feature as
1 3 5 7...
And y as
2 4 6 8....
You can find w and b as [1] and 1 so
y = X.WT + b
lapis sequoia
vague fern
Why does linear regression model require a 2D data set always and not 1D
Also nitpicking in your question, i think you meant atleast 2d.
Or if I'm wrong please lemme know😄
pastel valley
serene scaffold
you can use a confusion matrix for that, yes
oh nice nice thank you sir
pastel valley
hollow sentinel
i remember looking at it in class w the true positive, true negative, false posi...
yes its that thing i see in websites
hollow sentinel
lapis sequoia
I think it should be put in data science since it's heavily associated with clas...
Got it
 stark kiln
Thank god
@lapis sequoia @lapis sequoia
We can come here to chat silently
and also @ebon geyser
stark kiln
I mean we love ai
lapis sequoia
I will not like to chat here
stark kiln
Or we head off to python general
stark kiln
Ok I said if the argument rose I would leave so bye for 10 mins
lapis sequoia
stark kiln
<@456226577798135808> <@456226577798135808>
?
lapis sequoia
stark kiln
I mean we love ai

 dry tangle
Hello folks,
I'm trying to develop a simple computer vision program that will determine whether or not an image is a driver's license. Any advice on the best way to do this quickly and accurately?
serene scaffold
@dry tangle is there a dataset of drivers license images available?
Also, if you're not already familiar with image processing, I would drop the expectation that this is going to come together quickly.
 honest crag
hello i'm a bgginer at datascience I wanted to know if the method Nearest Neighbors is effectif even if the frequency of NaN data is high ?
serene scaffold
honest crag
hello i'm a bgginer at datascience I wanted to know if the method Nearest Neighb...
NaN data in what sense? How many features do you have?
honest crag
serene scaffold
NaN data in what sense? How many features do you have?
null, empty values for NaN

 serene scaffold
@honest crag interesting. How many missing values does each row have, on average?
honest crag
serene scaffold
<@361184063173951498> interesting. How many missing values does each row have, o...
how do I do that ?
serene scaffold
@honest crag change the axis for your mean calculation
teal mortar
honest crag
how do I do that ?
or replace missing values with median
serene scaffold
@teal mortar that's imputation. It's not a solution to the question he was asking in that message.
honest crag
serene scaffold
<@361184063173951498> change the axis for your mean calculation
like that ?
 serene scaffold
@honest crag yeah! Can you then take the mean of that? Just chain another call to .mean()
honest crag
serene scaffold
<@361184063173951498> yeah! Can you then take the mean of that? Just chain anoth...
 serene scaffold
@honest crag okay, so on average, each row is missing 40% of the features. That seems ungood
honest crag
serene scaffold
<@361184063173951498> okay, so on average, each row is missing 40% of the featur...
I see is there a methods that can fit with this case ? imputation ? as proposed by heiz
serene scaffold
You can use nanmean and fillna to replace @honest crag
teal mortar
honest crag
I see is there a methods that can fit with this case ? imputation ? as proposed ...
I would also try deleting rows which have > 50% of data missing, before doing imputation
honest crag
hmm okay i'll think about all of this guys thanks for your time it's was helpfull
honest crag
teal mortar
I would also try deleting rows which have > 50% of data missing, before doing i...
is deleting rows the last option when we analyze data ?
teal mortar
honest crag
is deleting rows the last option when we analyze data ?
depends on the data, could work if get like 2000 samples of complete data into validation set, and experiment with imputation
see what works best
what type of data it is? blood analyses?
though no, has fiber in it
honest crag
teal mortar
see what works best
food
serene scaffold
teal mortar
though no, has fiber in it
Speak for your own blood
teal mortar
😄
serene scaffold
🩸
teal mortar
honest crag
is deleting rows the last option when we analyze data ?
in that case you can get less restricted, and delete less data and make more imputation
but I would go with clean valid set of couple of thousands of samples and experiment
 tribal oracle
Hey, I'm stuck with pandas, i'm trying to transform a simple dic to DataFrame
df = pd.DataFrame(data=df,index=[0])
but my index is overriding other docs, how can i make it so it'll grow with the file size
serene scaffold
@tribal oracle I don't follow. Is df a dict before this?
Also what is index=[0] intended to do?
 median fulcrum
Quick question: what can be considered nlp? Is using spacy and classifying people/cities already an nlp use?
serene scaffold
@median fulcrum it can be? What are the classes
median fulcrum
serene scaffold
<@758034911641862304> it can be? What are the classes
like this

I think it's nlp
serene scaffold
That's named entity recognition
median fulcrum
serene scaffold
That's named entity recognition
oh
serene scaffold
And yes, it's part of nlp
upbeat dove
I'm a bit confused how you would go about making a neural network that can play chess because each chess position has completely different moves
Wait nvm I think I found a way
Would it just be to have one output neuron as the score?
pastel valley
yo guys what does the activations do on my cnn model?
there is like ReLU , sigmoid and softmax what does it do to the images?
or pixel values of the images
 stray quest
I just spent an hour debugging code.... Couldn't figure out why it wouldn't work....
Turns out I entered x="returns_2018" instead of x="return_2018".... the "s" made all the difference...
😿
pastel valley
if i pip install tensorflow does keras being installed together with it?
 waxen jewel
would this be the place to ask OCR related questions maybe?
teal mortar
pastel valley
there is like ReLU , sigmoid and softmax what does it do to the images?
activation functions brings non-liniarity to the neurons, otherwise all neural network would work as one neuron, in your case ReLU is rectified linear unit, it computes max(0, value), if value is below zero you get 0 as output value of your neuron, otherwise it returns the value itself
sigmoid is used for binary classification mostly, restricts previous layer output between 0 and 1, example image is a cat = 1 or not a cat = 0
teal mortar
pastel valley
there is like ReLU , sigmoid and softmax what does it do to the images?
softmax used for choosing most probable result with multiple classes classification, picks value with max argument from your list of outcomes
pastel valley
teal mortar
activation functions brings non-liniarity to the neurons, otherwise all neural n...
the cnn i create has ReLU on every convolutional layer so every time after that layer calculates the output every pixels less than 0 will be zero?
pastel valley
teal mortar
softmax used for choosing most probable result with multiple classes classificat...
in the fully connected layer part of the cnn there is the neurons that holds the scores until the softmax part right?
this is the part where the pixels becomes neurons right?
 teal mortar
pixel cannot have a negative value, if it is RGB, each pixel has value between 0 and 255, and you need to scale you dataset, divide by 255 each pixel, to bring values of each pixels between 0 and 1, for better results
pastel valley
teal mortar
pixel cannot have a negative value, if it is RGB, each pixel has value between 0...
can you explain this to me more sir? i dont understand
my image input is rgb
teal mortar
you flatten the conv layer to feed it to dense layers
teal mortar
pastel valley
can you explain this to me more sir? i dont understand
your neural network have inputs which you give, in your case pictures, neural network randomly generates weights with Gaussian distribution with mean zero with very low values and biases, usually the formula is Y = W*X + b, where "W" stands for weights, if weight is negative your output can be negative, in this case ReLU deactivates the node
teal mortar
pastel valley
dense layers the neurons that holds values 0 to 1 right?
but you can use leaky ReLU or ELU (exponential linear unit for that), you should a read a book on deep learning, you will understand it better
pastel valley
the softmax activation is the one to be used for final step like its the one to really calculate the score for each neurons to the output classes?
pastel valley
teal mortar
but you can use leaky ReLU or ELU (exponential linear unit for that), you should...
i am having a hardtime reading books i prefer short articles or parts on websites hahaha
sometimes when i read its like midway i just go day dreaming
lapis sequoia
teal mortar
but you can use leaky ReLU or ELU (exponential linear unit for that), you should...
tho leaky would leak no, it would go to minus side too!
teal mortar
pastel valley
sometimes when i read its like midway i just go day dreaming
https://www.manning.com/books/deep-learning-with-python-second-edition read this one, it is very good for beginners

Manning Publications
Printed in full color! Unlock the groundbreaking advances of deep learning with this extensively revised new edition of the bestselling original. Learn directly from the creator of Keras and master practical Python deep learning techniques that are easy to apply in the real world.
In Deep Learning with Python, Second Edition you will learn:
De...
teal mortar
lapis sequoia
tho leaky would leak no, it would go to minus side too!
you don't want neurons having value of 0, means they are deactivated
 brazen spire
we get 1000 weights of shape 55x55 at the end?
 lapis sequoia
teal mortar
you don't want neurons having value of 0, means they are deactivated
lapis sequoia
teal mortar
you don't want neurons having value of 0, means they are deactivated
well I've seen most people using ReLU, i haven't seen anything going wrong with them.
teal mortar
lapis sequoia
well I've seen most people using ReLU, i haven't seen anything going wrong with ...
ReLU usually give better results, with others you need to tinker more
 velvet thorn
teal mortar
you don't want neurons having value of 0, means they are deactivated
velvet thorn
teal mortar
you don't want neurons having value of 0, means they are deactivated
perhaps you could elaborate on why you think that is bad
lapis sequoia
I don't know why am I not being able to install anaconda properly
I have Python 3.9 on my windows
pastel valley
lapis sequoia
I don't know why am I not being able to install anaconda properly
i think if you install anaconda there is a python included in it
pastel valley
teal mortar
https://www.manning.com/books/deep-learning-with-python-second-edition read this...
yo sir thanks ill have alook butnot sure if i can really read it muc
teal mortar
velvet thorn
perhaps you could elaborate on why you think that is bad
ok, it is actually a subjective opinion, deactivation plays a good role in Dropout, but if you don't use dropout and have a good amount of deactivated neurons in the first layers it lead to poor results in my case, but yes, depends on case, same with weight regularisation l1, which works worse than l2 one.
velvet thorn
teal mortar
ok, it is actually a subjective opinion, deactivation plays a good role in Dropo...
yeah, that is definitely true
if you have too many dead neurons the network doesn't learn + everything is 0
but dead neurons in and of themselves are not bad
lapis sequoia
pastel valley
i think if you install anaconda there is a python included in it
I already have python installed
humble salmon
hi… can someone help me to explain this code

 solemn atlas
How can I get started with ml
Plz ping me when u reply
I want to learn and understand ml really well
lapis sequoia
humble salmon
hi… can someone help me to explain this code
can you share actual code?
humble salmon
lapis sequoia
can you share actual code?
that’s the actual code
lapis sequoia
textually
humble salmon
lapis sequoia
textually

 lapis sequoia
textually as in send not the image but the code.
in text.
so I can put comments to understand and help you understand.
humble salmon
def RockClimbing(stamina, obstacles):
count=0
i=1
while i<len(obstacles) and stamina>0:
if obstacles[i]>obstacles[i-1]:
diff=obstacles[i]-obstacles[i-1]
climbs = diff//1
if climbs!=diff:
climbs=climbs+1
stamina=stamina-2*climbs
count=count+1
else:
diff=obstacles[i-1]-obstacles[i]
descends=diff//1
if descends!=diff:
descends=descends+1
stamina=stamina-descends
count=count+1
i=i+1
return count
lapis sequoia
beautiful
def RockClimbing(stamina, obstacles):
    count=0
    i=1 # used for iterating through list
    while i<len(obstacles) and stamina>0:
        # if obstacle is bigger than previous
        if obstacles[i]>obstacles[i-1]:
            # finding difference
            diff=obstacles[i]-obstacles[i-1]
            # I assume this converts float to int
            climbs = diff//1
            # if the difference is exact interger, this condition will fail
            if climbs!=diff:
                climbs=climbs+1
            # decreasing stamina and increasing count
            stamina=stamina-2*climbs
            count=count+1
        else:
            # since our obstacle is smaller positive difference would be reverse
            diff=obstacles[i-1]-obstacles[i]
            descends=diff//1
            if descends!=diff:
                descends=descends+1
            stamina=stamina-descends
            count=count+1
        i=i+1
    return count
well i think what it does is with given stamina how much obstacles we can pass
if obstacle is heigher, we will have different stamina formula,
else different stamina formula.
@humble salmon
humble salmon
okayy thank you so muchh @lapis sequoia
 iron basalt
lapis sequoia
beautiful
iron basalt
lapis sequoia
beautiful
diff//1 -> int(diff)
lapis sequoia
iron basalt
`diff//1` -> `int(diff)`
yeah i did not change their code, i just explained it. its not mine lol.
vague fern
lapis sequoia
Also nitpicking in your question, i think you meant atleast 2d.
oh yeah right 2D atleast
 zealous burrow
Why the value of random state will affect the result of score so much?
I try it many times and still get similar results


 stray nymph
 last widget
Does anyone know how to do correlation analysis
If someone can just send me a link that would be amazing
vague fern
import statsmodels.api as sm
import pandas

prestige_dataset = pandas.read_csv('data.csv')

x = prestige_dataset.drop('prestige',axis=1)
y = prestige_dataset['prestige']

ols_model = sm.OLS(y, x).fit()
print("the result for ols regression model is")
print(ols_model.summary())
ERROR


raise ValueError("Pandas data cast to numpy dtype of object. "
ValueError: Pandas data cast to numpy dtype of object. Check input data with np.asarray(data).
why this error
 acoustic forge
I am about to rip out my hair working with Pyspark and Multiclass classification. How do I set multiple target columns??
 somber prism
Guys I want know how to highlight important points from the given texts , is there any way to do it
serene scaffold
@somber prism define "important"
pastel valley
yo what is the difference of test data and validation data ?
serene scaffold
pastel valley
yo what is the difference of test data and validation data ?
the validation set is basically a separate test set that you use for hyperparameter tuning
 void helm
Guys Can someone give a full industry grade project to help me understand how is it to work in A AI and ml workspace as i am new to AI ans ML
serene scaffold
void helm
Guys Can someone give a full industry grade project to help me understand how is...
how long do you expect such a thing to take?
void helm
@serene scaffold I didnt get you
serene scaffold
void helm
<@!253696366952316929> I didnt get you
the full industry grade project that you want to do. how long do you think it should take? a month?
void helm
no i just wanted to go through stuff that makes you write code as industry standard and a general understanding of whats going in ....
maybe if someone has a project in AI and ML that they wanted to share
serene scaffold
@void helm I'm trying to establish what your goals and expectations are
void helm
@serene scaffold SO my goal to to enter into data science field , i have knowledge of python as working as dev but no idea how a full stack ML project pipeline works
serene scaffold
void helm
<@!253696366952316929> SO my goal to to enter into data science field , i have k...
"full stack" doesn't have an established meaning for ML development, as far as I know.
do you belong to a university/company that gives you access to the OReily library?
void helm
@serene scaffold no my company doesnot have that
 lyric ermine
hey guys, short question about ewm function
https://gyazo.com/a115894d6da97322979549bd3dc47a8d
so i have a span of 2, shouldnt the last EMA be 2 here and not 2.02? because its 2 and 2

 strange stag
where to start: multi agent soft actor critic with tf2 [humanoid environment]
ive seen rllib, but im only getting a 0.10% gpu utilization, because there are not multiple agents in the environment as im using the HumanoidEnv-pybullet-v0 env, which i dont think supports multi agent
 dim aspen
So I trained a model on Jupyter Notebook and it worked with an error of <0.8. It generated a yolo weights file that I now am using to create a bounding box around an image. I have the following code to create a bounding box using Yolo and OCV but nothing shows in the image. No bounding box at all. The training worked for sure but I don't know whats wrong. Here is my code:
https://pastecode.io/s/vo5amxwj
It doesn't throw me any errors but the dog image shows up with no box around it
After I train my model on jupyter and gain my weights file in the backup folder, is that what im supposed to use in creating a bounding box?
I even told it to display the box if the confidence is >0 but still nothing'
lapis sequoia
I trained various models with different loss functions on the same dataset. I would like to use flask to create a web-app that can be used to compare any two models for a chosen sample. These images are saved as .npys.
Anyone know how to do something liek that with flask? Or where I could start on this? I can't imagine it's too involved.
 shell depot
I think you should create the program that do that
and then create an endpoint with flask and create a view where you should put your program
and then just handle the coming request and also the return
 rough mountain
I understand to make a video classifier I should use a lstm cnn, but using keras how does one train a model on videos? I understand passing in images, but it's not like I can pass in a video.
( I know how to break up a video into images )
velvet thorn
rough mountain
I understand to make a video classifier I should use a lstm cnn, but using keras...
your model is different
rough mountain
velvet thorn
your model is different
please elaborate
 tender hearth
rough mountain
I understand to make a video classifier I should use a lstm cnn, but using keras...
tender hearth
rough mountain
I understand to make a video classifier I should use a lstm cnn, but using keras...
are you just asking how to convert a video to an array of frames?

Stack Overflow
Program to convert a video file into a NumPy array and vice-versa. I had searched for many search engines but was unable to find the answer.
video is just a sequence of images after all
rough mountain
tender hearth
are you just asking how to convert a video to an array of frames?
I'm asking how to use a video in a ML application without cropping all the videos to x amount of frames and using a 4d input (the only solution I can think of)
I've heard of using a lstm
tender hearth
Yes, recurrent networks like LSTMs will allow you to do that without cropping/padding
rough mountain
How does one go about training them, I've only seen how to do traditional sequential AI's ( just link me to something )
tender hearth
Here's an article I guess https://towardsdatascience.com/lstm-how-to-train-neural-networks-to-write-like-lovecraft-e56e1165f514

Medium
LSTM Neural Networks have seen a lot of use in the recent years, both for text and music generation, and for Time Series Forecasting.
lapis sequoia
@left dust since you asked question about minimax and alpha beta pruning, yes a lot of people here know them and you can ask specific questions on those topics over here.
 umbral rapids
I have a problem using the chatterbot, the response bot doesn't give a proper response


 maiden sundial
Why addition of two ints, results in float, in pandas series?
 desert oar
maiden sundial
Why addition of two ints, results in float, in pandas series?
desert oar
maiden sundial
Why addition of two ints, results in float, in pandas series?
because of the missing values. there is no way to represent "missing" in int64, so pandas converts to float64 in order to represent "missing" with NaN
note that if you use dtype='Int64' pandas can represent missing values in integer data
maiden sundial
desert oar
note that if you use `dtype='Int64'` pandas _can_ represent missing values in in...
This works. Thanks.
lapis sequoia
+ python3 -m black media.ipynb
Skipping .ipynb files as Jupyter dependencies are not installed.
You can fix this by running ``pip install black[jupyter]``
No Python files are present to be formatted. Nothing to do 😴
$ cat requirements.txt | grep black
black
black[jupyter]
$ pip3 list | grep black
black             21.11b1
why doesnt my black[jupyter] work, am i supposed to format it differently?
install with pip install -r requirements.txt vs pip3 ... makes no difference
running pip install black[jupyter] manually does fix it though
last widget
Does anyone know how to do correlation analysis for big datasets? (eg between the columns time and rate)
If someone can just send me a link that would be so helpful
 trail jolt
last widget
Does anyone know how to do correlation analysis for big datasets? (eg between th...
trail jolt
last widget
Does anyone know how to do correlation analysis for big datasets? (eg between th...
https://stackoverflow.com/questions/21604997/how-to-find-significant-correlations-in-a-large-dataset
Stack Overflow
I'm using R.
My dataset has about 40 different Variables/Vektors and each has about 80 entries. I'm trying to find significant correlations, that means I want to pick one variable and let R calcula...
Take a look
last widget
trail jolt
https://stackoverflow.com/questions/21604997/how-to-find-significant-correlation...
Thank you so much!
 tidal bronze
hello guys,
I am interviewing for data visualisaation kind of poistion and then send me a take-home task. They provide a dataset with historical transaction and they want me to answers question such has when is there a peak in demand and similar. I oknow how to do these tasks but what do you think are some ideas of anything extra I could do to impress the person recruiting?
last widget
tidal bronze
hello guys,
I am interviewing for data visualisaation kind of poistion and then...
Maybe you could do something else complicated? like by finding out about different customers each month? idk depends on the data you have
tidal bronze
last widget
Maybe you could do something else complicated? like by finding out about differ...
well currently I can't load the df properly, you have experience with json files and pandas?
last widget
tidal bronze
well currently I can't load the df properly, you have experience with json files...
I am using pandas but I hardly know anything 💀 , hopefully someone else will be able to help you better. But yeaa like depending on the data given to you, maybe you can find out about some particular details.
trail jolt
last widget
Thank you so much!
You're welcome
acoustic forge
How would you guys do outlier detection in a dataset with 27 dimensions?
Z Score on each feature?
last widget
date = data['Date']
loct = data['Location']
data['Date'].corr(data['Location'])
why isnt this working 🥲
trail jolt
date = data['Date']
loct = data['Location'] data['Data'].core(data['Location'])
@last widget
last widget
trail jolt
<@751391459101507618>
ooff i still get this error:
TypeError: unsupported operand type(s) for /: 'str' and 'int'
OHH
wait
so i need to convert the location into numbers?
trail jolt
last widget
ooff i still get this error:
TypeError: unsupported operand type(s) for /: 'str'...
I didn't answer your question i just fixed the typos
last widget
trail jolt
I didn't answer your question i just fixed the typos
oh
okay thanks
although you made typos
trail jolt
Like what ?
trail jolt
Idk
last widget
but thank you for your time and effort
not being sarcastic 💀 fr
ok so i think i do need to convert the location into numbers?
last widget
trail jolt
Idk
btw is your pfp an nft that a basketball player bought
trail jolt
last widget
btw is your pfp an nft that a basketball player bought
Yeah
last widget
trail jolt
Yeah
nice
last widget
Yep
last widget
Yes I have googled, thanks
 stray oar
Anyone studied CS229 Stanford from YouTube??
hollow sentinel
i am confused by null hypothesis and alternative hypothesis
i'm looking at this problem it says
suppose your friend pete says that he can guess the suit of a randomly selected playing card more than 1/4 times on avg
so we make him guess the suit of a card 100 times
he gets it right 28 times
P(x greater than or equal to 28) = .278
bc it's a binomial distribution
number of successes in number of trials
the null hypothesis is that p is equal to 1/4
but he is guessing higher than .25
so is that not strong evidence?
does he have to get it right noticeably higher than the null hypothesis in order for his claim to be correct?

A first look at hypothesis testing.
For those that use R, below is the R code to find the binomial probability given in this video.
To find the probability that X takes on a value that is at least 28, where X has a binomial distribution with parameters n = 100 and p = 1/4:
1-pbinom(27,100,1/4)
[1] 0.2776195
To find the probability that X tak...
this is where the problem comes from
 silver sun
Im getting a UnimplementedError: Cast string to float is not supported error in my colab for my code num_epochs = 30 history = model.fit(training_padded, training_labels, epochs=num_epochs, validation_data=(testing_padded, testing_labels), verbose=2) Anyone have an idea how to solved this? Here are the data types in my df that Im using. label object comment object author object subreddit object score float64 ups float64 downs float64 date datetime64[ns] created_utc object parent_comment object year int64 dtype: object
 pure pumice
hey guys, does anyone know how to get rid of the % sign in the Rotten tomatoes column using the pd.to_numeric() formula

i believe i need to first get rid of the % to use that formula?
i have tried an astype formula as well
but it gives an error invalid literal for int() with base 10: '87%'
pure pumice
stark kiln
You may want to represent as a %
sorry what do you mean when u say represent as %?
stark kiln
pure pumice
sorry what do you mean when u say represent as %?
*represent as a percentage
serene scaffold
pure pumice
hey guys, does anyone know how to get rid of the % sign in the Rotten tomatoes c...
you're more likely to get help if you provide everything as text (in a copy-pastable way). df.head().to_dict('list') can be copied directly into this chat.
pure pumice
serene scaffold
you're more likely to get help if you provide everything as text (in a copy-past...
would the table appear?
the dataframe
serene scaffold
pure pumice
would the table appear?
We don't want the table because you can't copy and paste a table into a chat.
pure pumice
serene scaffold
We don't want the table because you can't copy and paste a table into a chat.
i dont think there is anything to copy and paste though, i just need to know how i can remove the % sign from the numbers. sorry
It would be nice if the Rotten Tomatoes data was numerical
Convert the text values into int or float format
For Example, 87% should become the number 87
HINT you can use the function pd.to_numeric on a string number to turn it to a numeric value
serene scaffold
pure pumice
i dont think there is anything to copy and paste though, i just need to know how...
please do df.head().to_dict('list') and copy and paste the dict that you'll see into the chat. When you do, I will use it, and then you will see why I asked.
serene scaffold
that is the code, not the result of running it.
pure pumice
{'Index': [0, 1, 2, 3, 4],
'ID': [1, 2, 3, 4, 5],
'Title': ['Inception',
'The Matrix',
'Avengers: Infinity War',
'Back to the Future',
'The Good, the Bad and the Ugly'],
'Year': [2010, 1999, 2018, 1985, 1966],
'Age': ['13+', '18+', '13+', '7+', '18+'],
'IMDb': [8.8, 8.7, 8.5, 8.5, 8.8],
'Rotten Tomatoes': ['87%', '87%', '84%', '96%', '97%'],
'Netflix': [1, 1, 1, 1, 1],
'Hulu': [0, 0, 0, 0, 0],
'Prime Video': [0, 0, 0, 0, 1],
'Disney+': [0, 0, 0, 0, 0],
'Type': [0, 0, 0, 0, 0],
'Directors': ['Christopher Nolan',
'Lana Wachowski,Lilly Wachowski',
'Anthony Russo,Joe Russo',
'Robert Zemeckis',
'Sergio Leone'],
'Genres': ['Action,Adventure,Sci-Fi,Thriller',
'Action,Sci-Fi',
'Action,Adventure,Sci-Fi',
'Adventure,Comedy,Sci-Fi',
'Western'],
'Country': ['United States,United Kingdom',
'United States',
'United States',
'United States',
'Italy,Spain,West Germany'],
'Language': ['English,Japanese,French',
'English',
'English',
'English',
'Italian'],
'Runtime': [148.0, 136.0, 149.0, 116.0, 161.0]}
sorry i was kinda confused
serene scaffold
pure pumice
{'Index': [0, 1, 2, 3, 4],
'ID': [1, 2, 3, 4, 5],
'Title': ['Inception',
'Th...
thanks. Any time you need help with a dataframe, share it like this--do not post any screenshots
pure pumice
serene scaffold
thanks. Any time you need help with a dataframe, share it like this--do not post...
noted
serene scaffold
pure pumice
noted
In [4]: df['Rotten Tomatoes']
Out[4]:
0    87%
1    87%
2    84%
3    96%
4    97%
Name: Rotten Tomatoes, dtype: object
So we can see here that the Rotten Tomatoes column contains objects, namely strings
Turning them into floats ('87%' -> .87) is a three step process
can you think of what those three steps are?
pure pumice
slicing the % out
serene scaffold
yes, that is the first one
serene scaffold
a float, then an int?
you were on the right track until you got to the last part.
!e print(float('87'))
arctic wedgeBOT
@serene scaffold :white_check_mark: Your eval job has completed with return code 0.
87.0
this is not what was wanted. you wanted .87, right?
serene scaffold
that's fine, I guess. people usually represent percentages as floats between 0 and 1
pure pumice
Convert the text values into int or float format
For Example, 87% should become the number 87
serene scaffold
(or above 1, for percentages greater than 100)
pure pumice
those are the instructions i was given
serene scaffold
anyway, do you know about the .str accessor for dataframe columns?
pure pumice
nope
serene scaffold
you know how 'bob'[:-1] would be 'bo'?
pure pumice
yes
serene scaffold
In [6]: df['Rotten Tomatoes'].str[:-1]
Out[6]:
0    87
1    87
2    84
3    96
4    97
Name: Rotten Tomatoes, dtype: object
the .str accessor gives you that functionality for the whole column
arctic wedgeBOT
Series.astype(dtype, copy=True, errors='raise')```
Cast a pandas object to a specified dtype `dtype`.yes I am familiar with astype
serene scaffold

serene scaffold
 pure pumice
okay
so
i did df['Rotten Tomatoes'].str[:-1]
and it removed all the %
then i use
df.astype('Rotten Tomatoes", copy=True, errors='raise')
?
serene scaffold
pure pumice
df.astype('Rotten Tomatoes", copy=True, errors='raise')
why "Rotten Tomatoes"...?
that's not a type.
I'm not anyone's type, either 
serene scaffold
df['Rotten Tomatoes'].str[:-1] returns a series of strings
strings that look just like ints
and you want them to be ints, right?
pure pumice
yup
serene scaffold
are you thinking what I'm thinking?
pure pumice
ngl nope 😩
serene scaffold
In [7]: df['Rotten Tomatoes'].str[:-1].astype(int)
Out[7]:
0    87
1    87
2    84
3    96
4    97
Name: Rotten Tomatoes, dtype: int32
im really new to this coding and i started on datatypes so i have no clue
OHH
u add
the astype
to the end
serene scaffold
ye
pandas lets you chain lots of method calls
so you can do insane wizardry with not very much code
(at least, not very much code compared to the scope of what you're doing)
serene scaffold
pure pumice
ValueError: cannot convert float NaN to integer
there are NaNs in your data?
do you know about fillna?
pure pumice
nope
serene scaffold
you can replace the NaNs with '0' before converting everything to an int
pure pumice
using fillna
serene scaffold
yes
or, you can do .astype(int, errors='ignore') and do fillna after that.
up to you
pure pumice
0 87
1 87
2 84
3 96
4 97
...
16739 NaN
16740 NaN
16741 NaN
16742 NaN
16743 NaN
Name: Rotten Tomatoes, Length: 16744, dtype: object
using ignore worked
serene scaffold
do you want them to stay as NaN or replace them with 0?
 pure pumice

worked like a charm
One last thing. if i were to do df.head() rn my data set wouldnt have changed (id still have the % ) how can i now update the data in the "Rotten Tomatoes" column
serene scaffold
the only thing left is to write it back to the dataframe.
pure pumice
yup
serene scaffold
adding/writing over a column is like putting something in a dict.
pure pumice
so do we need to make df['Rotten Tomatoes'].str[:-1].astype(int, errors='ignore').fillna(0) equal to something
and then merge?
pure pumice
groupby?
serene scaffold
no
serene scaffold
suppose you want to add 0 to a dict called foo with a key named bob
how would you do that?
stark kiln
Hi
stark kiln
It’s easy
serene scaffold
df['Rotten Tomatoes'] = df['Rotten Tomatoes'].str[:-1].astype(int, errors='ignore').fillna(0)
"declaring" and "defining" are different. there's no declaring in Python.
stark kiln
serene scaffold
"declaring" and "defining" are different. there's no declaring in Python.
*defining 😫
Would it be foo = {“bob”: 0}?
serene scaffold
stark kiln
Would it be `foo = {“bob”: 0}`?
that's if the dict doesn't already exist, but it doesn't matter at this point as the person in question hasn't used dicts before, so I couldn't use that to bridge their knowledge, so to speak.
foo['bob'] = 0 was the expected answer.
pure pumice
sorry im running into a problem
serene scaffold
pure pumice
sorry im running into a problem
what problem? if there's an error message, copy and paste the error message into the chat.
serene scaffold

 stark kiln
serene scaffold
that's if the dict doesn't already exist, but it doesn't matter at this point as...
stark kiln
serene scaffold
that's if the dict doesn't already exist, but it doesn't matter at this point as...
foo[“bob”] = 0```?Oh
serene scaffold
stark kiln
```foo = {}
foo[“bob”] = 0```?
the dict analogy doesn't really matter anymore
stark kiln
You already sent it
serene scaffold
I'm going to do pushups now to prove what a man I am.
pure pumice
df.plot.scatter('Rotten Tomatoes', 'IMDb') would plot the data?
serene scaffold
pure pumice
df.plot.scatter('Rotten Tomatoes', 'IMDb') would plot the data?
try it 
pure pumice
i have its giving me an error TypeError: 'value' must be an instance of str or bytes, not a int
serene scaffold
!docs pandas.DataFrame.plot.scatter
arctic wedgeBOT
DataFrame.plot.scatter(x, y, s=None, c=None, **kwargs)```
Create a scatter plot with varying marker point size and color.

The coordinates of each point are defined by two dataframe columns and filled circles are used to represent each point. This kind of plot is useful to see complex correlations between two variables. Points could be for instance natural 2D coordinates like longitude and latitude in a map or, in general, any pair of metrics that can be plotted against each other.I don't know what's causing that error, since value isn't an argument for scatter.
pure pumice
its only doing it when i have rotten tomatoes in there
for example if i do df.plot.scatter('Netflix ', 'IMDb')
it works
perfectly fine
serene scaffold
@pure pumice it worked when I did it with my five-row version

Does your df.dtypes look like this?
In [15]: df.dtypes
Out[15]:
Index                int64
ID                   int64
Title               object
Year                 int64
Age                 object
IMDb               float64
Rotten Tomatoes      int32
Netflix              int64
Hulu                 int64
Prime Video          int64
Disney+              int64
Type                 int64
Directors           object
Genres              object
Country             object
Language            object
Runtime            float64
dtype: object
Index int64
ID int64
Title object
Year int64
Age object
IMDb float64
Rotten Tomatoes object
Netflix int64
Hulu int64
Prime Video int64
Disney+ int64
Type int64
Directors object
Genres object
Country object
Language object
Runtime float64
dtype: object
yup
serene scaffold
no
your Rotten Tomatoes is still an object
not an int
(remember that strings are objects, but Pandas stores numeric values "unboxed")
serene scaffold
well, we already went over how to write over the Rotten Tomatoes column with the int column, but jupyter notebooks can be run in a non-linear way, so if you ran another cell, you might have undone it.
(I hate jupyter notebooks btw. but that's just me.)
hollow sentinel
when would we ever use a utility function
and not a cost function
talking about performance measures
pure pumice
serene scaffold
well, we already went over how to write over the Rotten Tomatoes column with the...
i just reran everything
hollow sentinel
like in linear regression you would use a cost function
pure pumice
but it is still an 'object'
hollow sentinel
to minimize the distance between the training examples and your model's predictions
serene scaffold
pure pumice
but it is still an 'object'
put df['Rotten Tomatoes'] = df['Rotten Tomatoes'].str[:-1].astype(int, errors='ignore').fillna(0) right before you try to plot it so there's no way it could be undone.
and if you get an error message, post the whole error message in the chat starting from Traceback
 serene scaffold
pure pumice
serene scaffold
pure pumice
yes
arctic wedgeBOT
Hey @pure pumice!
Uh-oh! It looks like your message got zapped by our spam filter. We currently don't allow .txt attachments, so here are some tips to help you travel safely:
• If you attempted to send a message longer than 2000 characters, try shortening your message to fit within the character limit or use a pasting service (see below)
• If you tried to show someone your code, you can use codeblocks
(run !code-blocks in #bot-commands for more information) or use a pasting service like:
serene scaffold
```py
code
```
^ share code like that in the future
or use the paste bin, in this case
arctic wedgeBOT
Hey @pure pumice!
Uh-oh! It looks like your message got zapped by our spam filter. We currently don't allow .txt attachments, so here are some tips to help you travel safely:
• If you attempted to send a message longer than 2000 characters, try shortening your message to fit within the character limit or use a pasting service (see below)
• If you tried to show someone your code, you can use codeblocks
(run !code-blocks in #bot-commands for more information) or use a pasting service like:
serene scaffold
@pure pumice use the paste bin: https://paste.pythondiscord.com/
serene scaffold
@pure pumice I suspect that there are values in the Rotten Tomatoes column that are different from what we expected
pure pumice
ya we only have the first 5 rows
so there must be much more in the rest
im gonna open the file in an excel and check it out
 mighty spoke
Hi does anyone know how I can make a for loop to perform a loop to carry out this sampling many times and for each iteration I want to calculate the max value and return an interpolated x value given this y value x_1 = plot1.sample(frac = 0.7,random,replace=True) y_value=max(x_1['Y'])*0.7 x_value = np.interp(y_value, ret.Y, ret.X)
serene scaffold
do df.loc[~df['Rotten Tomatoes'].str.match(r'\d+'), 'Rotten Tomatoes']
right after the line where we replace everything
(but make sure it gets displayed)
pure pumice
TypeError Traceback (most recent call last)
<ipython-input-4-18715bf12f33> in <module>
----> 1 df.loc[~df['Rotten Tomatoes'].str.match(r'\d+'), 'Rotten Tomatoes']
/cloud/lib/lib/python3.9/site-packages/pandas/core/generic.py in invert(self)
1530 return self
1531
-> 1532 new_data = self._mgr.apply(operator.invert)
1533 return self._constructor(new_data).finalize(self, method="invert")
1534
/cloud/lib/lib/python3.9/site-packages/pandas/core/internals/managers.py in apply(self, f, align_keys, ignore_failures, **kwargs)
323 try:
324 if callable(f):
--> 325 applied = b.apply(f, **kwargs)
326 else:
327 applied = getattr(b, f)(**kwargs)
/cloud/lib/lib/python3.9/site-packages/pandas/core/internals/blocks.py in apply(self, func, **kwargs)
379 """
380 with np.errstate(all="ignore"):
--> 381 result = func(self.values, **kwargs)
382
383 return self._split_op_result(result)
TypeError: bad operand type for unary ~: 'float'

i did it like that
i just opened the table in an excel file
and there are a lot of empty cells in the rotten tomatoe
s
column
serene scaffold
try df.loc[~df['Rotten Tomatoes'].astype(str).str.match(r'\d+'), 'Rotten Tomatoes']
serene scaffold
pure pumice
and there are a lot of empty cells in the rotten tomatoe
empty in what way?
NaN?
serene scaffold
@pure pumice I guess try df['Rotten Tomatoes'] = df['Rotten Tomatoes'].str[:-1].astype(int, errors='ignore').fillna(0).replace({'': 0})
pure pumice
replace the first one
serene scaffold
right.
pure pumice
still showing rotten tomatoes as an obj
ughgh i dont want to waste your time i have already taken an hr from u, I can try asking my teacher tomorrow
serene scaffold
You'll have to look through the data and figure out which value isn't NaN and doesn't look like "68%"
whether it's an empty string, or something weird like "basdfaf"
serene scaffold
all my homies hate excel
pure pumice
😩
serene scaffold
don't worry. once you become a pandas wizard, you will also join in my hatred of excel
hollow sentinel
i taught myself excel
pure pumice
theres 16754 lines of data 😦
serene scaffold
rip
pure pumice
nvm
its rip
okay so out of 16745, 5158 of the cells are empty
now i need to find how many cells contain a percentage and add it up
okay
i think i did something
that couldve fixed it
 half pine
Any ideas on x2polygons and hausdorff?
pure pumice
@serene scaffold i got a quick question if u dont mind me asking
serene scaffold
pure pumice
<@!253696366952316929> i got a quick question if u dont mind me asking
I don't know what the question is.
pure pumice
lol sorry
@serene scaffold

i need to create a new column
and apply a function to it
so would i first insert a new column
then groupby the new column with the language column
and then apply a function then combine the dataframes
 shy moon
Hi guys,
I'm putting together a project portfolio for my ds interviews. What do you guys use in practice, OOP or functional programming when you answer business related question with ds/da?
 agile cobalt
I'm pretty sure that functional at least 90% of the time, but I could be wrong
(anyone responding to this: ping me on response)
serene scaffold
pure pumice
<@!253696366952316929>
I do not look at screenshots of DataFrames; you have to do df.head().to_dict('list') like I mentioned before.
pure pumice
serene scaffold
I do not look at screenshots of DataFrames; you have to do `df.head().to_dict('l...
{'Index': [0, 1, 2, 3, 4],
'ID': [1, 2, 3, 4, 5],
'Title': ['Inception',
'The Matrix',
'Avengers: Infinity War',
'Back to the Future',
'The Good, the Bad and the Ugly'],
'Year': [2010, 1999, 2018, 1985, 1966],
'Age': ['13+', '18+', '13+', '7+', '18+'],
'IMDb': [8.8, 8.7, 8.5, 8.5, 8.8],
'Rotten Tomatoes': ['87%', '87%', '84%', '96%', '97%'],
'Netflix': [1, 1, 1, 1, 1],
'Hulu': [0, 0, 0, 0, 0],
'Prime Video': [0, 0, 0, 0, 1],
'Disney+': [0, 0, 0, 0, 0],
'Type': [0, 0, 0, 0, 0],
'Directors': ['Christopher Nolan',
'Lana Wachowski,Lilly Wachowski',
'Anthony Russo,Joe Russo',
'Robert Zemeckis',
'Sergio Leone'],
'Genres': ['Action,Adventure,Sci-Fi,Thriller',
'Action,Sci-Fi',
'Action,Adventure,Sci-Fi',
'Adventure,Comedy,Sci-Fi',
'Western'],
'Country': ['United States,United Kingdom',
'United States',
'United States',
'United States',
'Italy,Spain,West Germany'],
'Language': ['English,Japanese,French',
'English',
'English',
'English',
'Italian'],
'Runtime': [148.0, 136.0, 149.0, 116.0, 161.0]}
 last salmon
pure pumice
{'Index': [0, 1, 2, 3, 4],
'ID': [1, 2, 3, 4, 5],
'Title': ['Inception',
'Th...
last salmon
pure pumice
{'Index': [0, 1, 2, 3, 4],
'ID': [1, 2, 3, 4, 5],
'Title': ['Inception',
'Th...
format it lol
serene scaffold
last salmon
format it lol
I don't really care about that
@pure pumice what transformation are you trying to do?
pure pumice
Using the original dataframe, create a column that lists the number of languages that each item is available in
For example, if a film is listed as having the languages English,Korean, the new column would have a value of 2
so i need to create a new column which has the number of languages each movie is in
pure pumice
serene scaffold
<@!104664534446272512> what transformation are you trying to do?
what do u mean by transformation?
serene scaffold
pure pumice
what do u mean by transformation?
a change in the data
pure pumice
ya so i dont need to really need to change the data
pure pumice
serene scaffold
a change in the data
i just need to add data i guess
so if a movie lists 3 languages like this, i need to show that it contains "3" in a new column
 serene scaffold
pure pumice
so if a movie lists 3 languages like this, i need to show that it contains "3" i...
serene scaffold
pure pumice
so if a movie lists 3 languages like this, i need to show that it contains "3" i...
in other words, you need a new column that is the number of commas in Language plus one.
pure pumice
yes
 rotund basin
Anyone here knowledgeable about spaCy? Here is my problem. This code:
lang_cls = spacy.util.get_lang_class('en')
nlp = lang_cls.from_config(config)
Gives the error:
ValueError: [E958] Language code defined in config ("en") does not match language code of current Language subclass English (en). If you want to create an nlp object from a config, make sure to use the matching subclass with the language-specific settings and data.
Any suggestions?
serene scaffold
you'll be using some of the same approaches we talked about before, namely that you need to use the .str accessor, and write a column to the dataframe.
pure pumice
serene scaffold
you'll be using some of the same approaches we talked about before, namely that ...
okay so first i make a new column
pure pumice
serene scaffold
you'll be using some of the same approaches we talked about before, namely that ...
then i groupby the new column and the language column, apply the str. accessor
serene scaffold
pure pumice
then i groupby the new column and the language column, apply the str. accessor
no groupby.
you need to use one of the .str methods, and you use the = statement we talked about for writing a new column
pure pumice
serene scaffold
you need to use one of the `.str` methods, and you use the `=` statement we talk...
new_column = df['Language'].str
nah thats wrong
so str[] is gonna have something in it
ya im stuck
am i using count()? @serene scaffold
str.count
str.count('Language",0) @serene scaffold
ya i dont think ill get it lol @serene scaffold
desert oar
@pure pumice how would you do it if it was a list of strings, without pandas?
serene scaffold
sorry I was having dinner
serene scaffold
pure pumice
str.count('Language",0) <@!253696366952316929>
the .str. methods act on a column, so passing the name of the column isn't going to help.
pure pumice
serene scaffold
the `.str.` methods act on a column, so passing the name of the column isn't goi...
so would i pass the names of the languages?
serene scaffold
pure pumice
so would i pass the names of the languages?
no, for the count method, you pass what you're trying to count.
try following salt rock lamp's suggestion of thinking about how you'd do it as a list of strings
pure pumice
if its a list of strings
serene scaffold
or even just one string: "English,Scottish,Welsh"
pure pumice
id have to call on a substring
serene scaffold
pure pumice
id have to call on a substring
a substring isn't a data type.
pure pumice
then input where i want to start the count and end the count
so then in this case
id call
df
instead of the column
serene scaffold
!e
result = "English,Scottish,Welsh".count(',')
print(result)
@serene scaffold :white_check_mark: Your eval job has completed with return code 0.
2
no, you have to access the method via the column you're trying to count in.
I must now clean my dinner. I will return soon.
pure pumice
so newcolumn = df["language].str.count(' , ') +1
serene scaffold
where is .str.
pure pumice
serene scaffold
looks like you're on the right track
File "<ipython-input-12-50245ebbe0fc>", line 3
new_column = df["language].str.count(' , ') +1
^
SyntaxError: EOL while scanning string literal
serene scaffold
your string doesn't have a close quote
pure pumice
yup i realized sorry
rotund basin
rotund basin
Anyone here knowledgeable about spaCy? Here is my problem. This code:
```
lang_...
I'm doing my best to solve this without creating a new config, but I'm running out of ideas
pure pumice
serene scaffold
your string doesn't have a close quote
so the code went thru with no erros
but now i have to
add the column to
the dataframe
serene scaffold
yep. we talked about how to add columns to dataframes
for Rotten Tomatoes
the only difference there was that you used a column name that was already there, so it just wrote over that column
pure pumice
serene scaffold
the only difference there was that you used a column name that was already there...
df["new_column"] = df["Language"].str.count(' , ') +1
df.head()
serene scaffold
pure pumice
df["new_column"] = df["Language"].str.count(' , ') +1
df.head()
"new_column" is a pretty nondescript name, but I imagine this worked.
 serene scaffold
pure pumice
serene scaffold
pure pumice
In [10]: df['Language']
Out[10]:
0    English,Japanese,French
1                    English
2                    English
3                    English
4                    Italian
Name: Language, dtype: object

In [11]: df['Language'].str.count(',') + 1
Out[11]:
0    3
1    1
2    1
3    1
4    1
Name: Language, dtype: int64
It worked when I did it 
serene scaffold
yeah, the count method doesn't care about your intentions, unfortunately
rotund basin
rotund basin
I'm doing my best to solve this without creating a new config, but I'm running o...
Ah I think I figured it out. I should have been parsing my config with thinc.api.Config instead of configparser.ConfigParser. Woo!
 stoic musk
TypeError: return arrays must be of ArrayType
for gradient in gradients:
np.clip(gradient, maxValue*-1, maxValue, out = [dWaa, dWax, dWya, db, dby])
I'm trying to perform gradient clipping over four values, but not sure how to save them properly as output
I want to store them as the variables in the list above...
 neat token
Hi all and sorry to interrupt, I am new to deep learning field and I want to visualize my model layers to have a proper understanding what my model is learning. I found one activation map visualization method cited in a paper titled "New perspectives on plant disease characterization based on deep learning" and is shown below. May I ask can this be achieved by deconvolution without training the deconv network?
 arctic wedgeBOT
:incoming_envelope: :ok_hand: applied mute to @chrome blade until <t:1638069535:f> (9 minutes and 58 seconds) (reason: duplicates rule: sent 4 duplicated messages in 10s).
last widget
does anyone know if I can carry out correlation analysis between a column of words and another of integers?
serene scaffold
last widget
does anyone know if I can carry out correlation analysis between a column of wor...
what is "correlation analysis"?
last widget
serene scaffold
what is "correlation analysis"?
correlation
like to find out if there is any correlation between 2 things
oh maybe i mean correlation coefficient
(eg pearson)
serene scaffold
@last widget what do the words and the numbers mean? (I assume we're talking about strings and integers, computationally speaking)
last widget
serene scaffold
<@!751391459101507618> what do the words and the numbers mean? (I assume we're t...
yes, one column contains the collection dates and the other contains the location
this is my code so far:
date = data['Sample Collection Date']
loct = (data['Location'])
data['Sample Collection Date'].corr(loct)
but i keep getting an error 😭
serene scaffold
last widget
but i keep getting an error 😭
any time you're getting help with programming on the internet, be sure to never say that you got an error. Always just share the error message as text.
last widget
serene scaffold
any time you're getting help with programming on the internet, be sure to never ...
Oh 😬 alright. will keep that in mind thanks
I think I need to do a regression model for this.
I thought just the pearsons correlation coefficient would be enough
but I guessn ot
serene scaffold
yes, regression can help you find a best-fit curve
last widget
Hmm alrightt, thanks
 bold timber
Hi, I am so confused about reshape(1,-1). what is the meaning of 1 and -1 in this case?
 serene scaffold
bold timber
Hi, I am so confused about reshape(1,-1). what is the meaning of 1 and -1 in thi...
serene scaffold
bold timber
Hi, I am so confused about reshape(1,-1). what is the meaning of 1 and -1 in thi...
it would be easier if we started with an example that doesn't have -1, as -1 has a special function, in this case
!e
import numpy as np
arr = np.arange(12)
print(arr)
print(arr.reshape(4, 3))  # four rows, three columns
print(arr.reshape(2, 6))  # two rows, six columns
print(arr.reshape(2, 3, 2))  # two layers of three rows and two columns
@serene scaffold :white_check_mark: Your eval job has completed with return code 0.
001 | [ 0  1  2  3  4  5  6  7  8  9 10 11]
002 | [[ 0  1  2]
003 |  [ 3  4  5]
004 |  [ 6  7  8]
005 |  [ 9 10 11]]
006 | [[ 0  1  2  3  4  5]
007 |  [ 6  7  8  9 10 11]]
008 | [[[ 0  1]
009 |   [ 2  3]
010 |   [ 4  5]]
011 |
... (truncated - too many lines)
Full output: https://paste.pythondiscord.com/jeqivugiji.txt?noredirect
serene scaffold
@bold timber see what's happening here?
I'm signing off soon, so I'll finish the explanation: The shape of an array is a tuple of integers. We've looked at arrays with shapes of (12,), (4, 3), (2, 6), and (2, 3, 2). If you reshape an array, the product of all the elements has to be the same.
So, -1 is special in that it gets inferred for whatever value completes the product.
!e
import numpy as np
arr = np.arange(12)
print(arr.reshape(2, -1, 2))
@serene scaffold :white_check_mark: Your eval job has completed with return code 0.
001 | [[[ 0  1]
002 |   [ 2  3]
003 |   [ 4  5]]
004 |
005 |  [[ 6  7]
006 |   [ 8  9]
007 |   [10 11]]]
The shape is still (2, 3, 2) because if you have (2, ?, 2), 3 is the only value that completes the product.
So for an array of shape (n,), which is a vector, .reshape(1, -1) gives you a shape of (1, n), which is a row vector.
The end!
@bold timber you might need to read that a few times.
stoic musk
idx = np.random.choice(range(len(y[:,0]), p = y[:,0]))
TypeError: range() takes no keyword arguments
Trying to choose an index within tensor y (a 2d tensor), based on a probability-weighted distribution. the values of y are probabilities of the given index
bold timber
serene scaffold
So for an array of shape (n,), which is a vector, `.reshape(1, -1)` gives you a ...
Thank you so much for the explanation
bold timber
serene scaffold
The shape is still `(2, 3, 2)` because if you have (2, ?, 2), 3 is the only valu...
If I change the last number in the tuple, I get an error. Whether the value in the last number in a tuple must be the same as the first number?
I tried to change the number in the tuple into (2,3,3), and I got an error. But what happened?
 lapis sequoia
bold timber
I tried to change the number in the tuple into (2,3,3), and I got an error. But ...
lapis sequoia
bold timber
I tried to change the number in the tuple into (2,3,3), and I got an error. But ...
Well 2x3x3 = 18.
 glass minnow
x_train.reshape(-1,1)
lapis sequoia
You're trying to convert an array of 12 elements to array of 18 @bold timber
bold timber
lapis sequoia
You're trying to convert an array of 12 elements to array of 18 <@78696061666472...
Ok, thank you. I understand now.
half pine
    '''
    This function returns the coordinates of a given poi_id.
    It searches the poi_id under a provided list of poi Geodata series.
    If the given poi_id is found, then it returns the geometry of the point, otherwise it returns -1.
    '''
    # YOUR CODE HERE
    for i in range (0,poi.shape[0]):
        if int(poi_id) == int(poi.id[i]):
            return(poi.geometry[i])
        else:
          return -1
# Check whether the check_location_poi works correctly
assert obtain_location_poi(poi, 3).x == 444317.88872473064
assert obtain_location_poi(poi, 3).y == 588535.4382380601
assert obtain_location_poi(poi, 5) == -1

# Find the polygon that contains a POI
def find_polygon(polygons, poi):
    '''
    Given a poi, a point object, returns the polygon among a list of polygons'''
    # YOUR CODE HERE
    raise NotImplementedError()

    # POI 3 is in which polygon of:
px = obtain_location_poi(poi, 3)
  # OSM:
assert find_polygon(osm_buildings, px)["full_id"] == 'w158000109'
  # Mask:
assert find_polygon(mask_buildings, px)["fid"] == 1148
# Define a point that is not within an OSM building.
px = Point([444440, 588903])
assert find_polygon(osm_buildings, px) == -1 ```guys, how can I write the function "def find_polygon(polygons, poi):" here? Does anyone have an idea ?
last widget
How do I convert time (date) into the number of months starting from 2020-01?
lapis sequoia
hi guys. Is there any model u know about that fits better for cartoon images?
and what does this numbers mean? loss: 0.1279 - accuracy: 0.9743 - validation loss: 0.9940 - validation accuracy: 0.7917
why loss is small and val_loss is high?
 spare shell
how to create a simple recursive percentage calculator, so for example i have 1% from 100, so it's 1.0, i want to add that 1.0 to 100 so the next calculation would be something like 1% from 101.0 and so on, how i can do that, is there a formula or something ?
 dark wraith
spare shell
how to create a simple recursive percentage calculator, so for example i have 1%...
dark wraith
spare shell
how to create a simple recursive percentage calculator, so for example i have 1%...
tell us about ur end statement also
spare shell
wdym
dark wraith
spare shell
how to create a simple recursive percentage calculator, so for example i have 1%...
I meant...to say...what's the end statement..when to end?
it will be infinte otherwise..u will keep adding and adding
spare shell
oh 10
dark wraith
u mean 10 times?
spare shell
yea
lapis sequoia
spare shell
how to create a simple recursive percentage calculator, so for example i have 1%...
You can simply do x * 1.01**n
Here n means number of times. And x as in on which number.
spare shell
alr im gonna try it rn thanks
lapis sequoia
About 1.01 it is for 1% you can make it dynamic of course.
spare shell
is that good ?
n = 100
for _ in range(10):
    x = 1 * n
    y = x / 100
    n += y
    print(x)
no...thts worng .... like if u do it 2 times then accrding to ur method if x=100 and n=2 then ansewr wud be in deciamls bt his req anser shud be 102.01
dark wraith
spare shell
is that good ?
```python
n = 100
for _ in range(10):
x = 1 * n
y = x / ...
no
lapis sequoia
dark wraith
no...thts worng .... like if u do it 2 times then accrding to ur method if x=100...
Well that's what it should be no?
101 for one time.
And 1% of that is 1.01 so 102.1
I don't see what is wrong? Please explain.
lapis sequoia
dark wraith
no...thts worng .... like if u do it 2 times then accrding to ur method if x=100...
Also if you're confused about how i got this formula, you can try bigger example of course.
!e
print(100 * 1.01**2)
@lapis sequoia :white_check_mark: Your eval job has completed with return code 0.
102.01
 signal oar
Hey all ,
I would like to know if there is any library in python which has a list of words like 'is','am','I' ,'this','not'?
I'm working on a project and I need to exclude these words while reading a text file.
Thanks in advance😊
lapis sequoia
signal oar
Hey all ,
I would like to know if there is any library in python which has a li...
Hey, they are called stopwords, and yes a lot of libraries have ways to remove them. For example you can use NLTK.
Also you may find this helpful.
https://stackoverflow.com/questions/5486337/how-to-remove-stop-words-using-nltk-or-python
Stack Overflow
So I have a dataset that I would like to remove stop words from using
stopwords.words('english')
I'm struggling how to use this within my code to just simply take out these words. I have a list ...
hi guys. Is there any model u know about that fits better for cartoon images?
and what does this numbers mean? loss: 0.1279 - accuracy: 0.9743 - validation loss: 0.9940 - validation accuracy: 0.7917
why loss is small and val_loss is high?
hollow sentinel

how do i change the color of my axes labels and make the axes labels bigger?
i was looking in the doc
actually nvm
signal oar
lapis sequoia
Also you may find this helpful.
https://stackoverflow.com/questions/5486337/how-...
Thanks a lot we have been looking for this for a while now..😀🤝
 void sail
Hi Im currently working with a densenet and have a shape issue in my forward function

input = 16,3,96,96
output = 144,2
however it should be 16,2
I am assuming something is going wrong in out.view(-1, self.in_planes) but unsure how to resolve it, anybody willing to help me out?
lapis sequoia
hi guys. Is there any model u know about that fits better for cartoon images?
and what does this numbers mean? loss: 0.1279 - accuracy: 0.9743 - validation loss: 0.9940 - validation accuracy: 0.7917
why loss is small and val_loss is high?
 tidal bough
why loss is small and val_loss is high?
That's a sign of overfitting - your model is doing good on the training set but significantly worse on validation (though 79% is pretty high anyway).
and what does this numbers mean?
Accuracy is just the percentage of correctly classified data points, so the more (closer to 1) the better. What loss is depends on your loss function, but the less the better.
lapis sequoia
tidal bough
> why loss is small and val_loss is high?
That's a sign of overfitting - your mo...
so this means val is being done with training images too?
tidal bough
Validation set is a part of the original dataset that's split off - the idea is that you don't train your model at that part, so it's useful for judging how your model handles data it hasn't seen while training.
usually you randomly take, say, 20% of the original data to be the validation set and the rest is the training set
serene scaffold
tidal bough
Validation set is a part of the original dataset that's split off - the idea is ...
sounds like you're defining the test set?
lapis sequoia
yeah but i mean, if loss on validation is that bad, but acc on validation is that high
what could it mean?
that there are dupped images which form part of the validation and train dataset
tidal bough
serene scaffold
sounds like you're defining the test set?
oh yeah, I am. I'm actually not sure what the difference is unless you're tuning hyperparameters
serene scaffold
tidal bough
oh yeah, I am. I'm actually not sure what the difference is unless you're tuning...
I don't think one uses a validation set unless there are hyperparameters to tune
tidal bough
serene scaffold
I don't think one uses a validation set unless there are hyperparameters to tune
Actually, you know what? Apparently "literature on ML often reverses the meaning of the test set and the validation set" 😩
that's probably why I'm confused
serene scaffold
I hate that 😠
apparently some people don't see deep learning as a subset of machine learning, so in my paper I had to avoid writing in a way that depends on that shared definition
lapis sequoia
ª
hollow sentinel
ok ok ok
so if the training error is low and the generalization error is high
the model is overfitting
but what about underfitting?
is the generalization error low?
hollow sentinel
serene scaffold
I don't think one uses a validation set unless there are hyperparameters to tune
i was reading the o'reilly machine learning book and it said "A common solution to this problem is called holdout validation: you simply hold out
part of the training set to evaluate several candidate models and select the best one"
so yeah apparently validation is when you do have hyperparameters to tune
 untold tundra
a validation set is just an algorithm-comparison set, hyperparameters are just one algorithm-level variation
if you have algorithms: A1, A2, A3.... then you use a validation set to produce models from each, model1 = A1(validation_trainining), model2 = A2(validation_training), ...
you then compare the models by score(model1, validation_testing), score(model2, validation_testing), etc.
this is distinct from a test set, as the test set is used when you have selected the best model
rotund basin
This SO question seems to imply that spacy's doc.to_disk() (and presumably doc.to_bytes() as well) methods are not storing word vectors: https://stackoverflow.com/questions/62820459/storing-and-loading-spacy-documents-containing-word-vectors
Seems wrong to me, but my intuition has been wrong on these things before :)
Stack Overflow
I have a bunch of document that I want to process with spaCy. As I am loading in a lg model, word vectors will be generated for each document processed. I want to store all this information to di...
rotund basin
rotund basin
This SO question seems to imply that spacy's `doc.to_disk()` (and presumably `do...
wondering if I have to re-gather all of my data, and explicitly save the word vectors this time 🧐
untold tundra
what does pickle do ?
rotund basin
untold tundra
what does `pickle` do ?
if this is a question for me, I'm not using it in the context of my spacy project because I won't be able to trust the incoming pickles
untold tundra
yeah, i was just wondering if pickle would store everything
rotund basin
not sure. maybe worth trying, in another context/project
untold tundra
do word vectors have a .to_disk() ?
or else, presumably they'll be a numpy array -- you can use np.save
rotund basin
the OP solved it with doc.vocab.to_disk()
seems like that's the long way around though. I'd expect something more straightforward
rotund basin
will look at np.save
a kwarg on to_disk() like include_vectors= would be on my wishlist
untold tundra
why are you storing the vocab via a document?
rotund basin
storing in a s3 bucket
grave frost
hollow sentinel
so yeah apparently validation is when you do have hyperparameters to tune
oh no, you can tune hyperparameters on any set. its usually that you should train your model, tune and test on val set
rotund basin
for later use
untold tundra
rotund basin
storing in a s3 bucket
i mean, the nlp variable has the vocab
you dont need to parse a text to get the vocab, its there when you load en_core...
grave frost
tuning in itself on the training set is not problematic; just that then there's a high chance your model is overfitting
untold tundra
I suspect nlp.to_disk() will store the vocab