#data-science-and-ml
1 messages · Page 355 of 1
 desert oar
 wooden forge
Data are between 1 and 0 so I think it's already small enough. Also what do you mean by outliners?
desert oar
wooden forge
Data are between 1 and 0 so I think it's already small enough. Also what do you ...
"outliers"
what are those few very large values?
wooden forge
What do you mean by outliers x)
wooden forge
desert oar
what are those few very large values?
I really don't understand what you are talking about
wooden forge
Yes
desert oar
if so then fourier analysis is not appropriate
desert oar
fourier analysis decomposes a function into sines and cosines
desert oar
so are you trying to model the probability of an event at any particular time?
wooden forge
I'm trying to predict when will an event happen
Based on a series of past events
And it's periodic
desert oar
well the fourier model is going to give you bad results, eg negative probabilities of occurrence, and meaningless fluctuations in the probability between peaks
as you can see from your plot
desert oar
or you can use an exponential arrival model or something better suited to modeling binary "events"
wooden forge
Tell me more
desert oar
you want to forecast when the next event will occur? compute the time between events and fit it to an exponential distribution
desert oar
it's a probability distribution that corresponds to the time between events that have a steady average rate of occurrence over time
wooden forge
Waiiiiiit
desert oar
so it is basically designed for modeling waiting times between events
wooden forge
Let me grab my probability lesson from last year real quick
Is it a Poisson Law?
Almost
desert oar
well that would be the number of events per month
the time between individual events would be exponentially distributed aka "exponential law"
wooden forge
This?
 desert oar
they are related that way - exponential-distributed arrival times imply poisson-distributed counts within a period, and vice versa
yep that's the exponential pdf
wooden forge
I know how to get the deltas of times, but how would I use that law then?
desert oar
the exponential distribution describes waiting times between events, right?
desert oar
so if the waiting time gets really long, the probability of another event will become very high
wooden forge
Ye ye I understand
desert oar
wooden forge
Damn I hate probabilities lmao
it was horrible last year
I don't really understand how you go from f(x) to P(X=k) the probability
wait f is the probability
haaaaaaa
P is 1-f
so P is equal to 1 when you pass decay time
therfore yes, when you wait long enough it will occur very surely
so the decay time would be 1/tau with tau the periods between each occurance
so should I simply calculate the average of the periods, OR use a linear regression to be more precise (that's just an example)
i hope I'm not too annoying
desert oar
wooden forge
so should I simply calculate the average of the periods, OR use a linear regress...
you might be overthinking it
compute all the differences between arrivals of events, that is a time series of sequential "waiting times"
wooden forge
oki
desert oar
use maximum likelihood to fit an exponential distribution to that time series
wooden forge
I did that already
wooden forge
desert oar
use maximum likelihood to fit an exponential distribution to that time series
mmh ?

desert oar
then, you can forecast the waiting time to the next event as "the waiting time when the probability of an event crosses a certain threshold"
desert oar
wooden forge
<:yahiaGLUE:801197426751832095>
stop sniffing glue and go read about how to actually estimate parameters of a distribution, i.e. how to fit a probability model
wooden forge
maximum likelihood what is that
wooden forge
desert oar
stop sniffing glue and go read about how to actually estimate parameters of a di...
I see no difference in those pictures
well that's interesting, just to discover ways to do something
desert oar
MLE is a very common technique for fitting probability distributions to data
wooden forge
i get to learn stuff
desert oar
yep, this is why it's good to ask questions
what is this for anyway? some school project?
wooden forge
I want to make an app on android to predict her next ||periods|| so it send a nice message
desert oar
Except there is a lot of missing data in our time series due to us both being forgetful when it comes to data entry
wooden forge
so the first part is to make the algo and then the app
both parts are HHHH
but the major problem is the app making because I DONT KNOW
desert oar
apparently my idea wasn't as unique as I thought
wooden forge

desert oar
i wonder if scipy has maximum likelihood routines for common distributions
normally i would do this in R
wooden forge
I see
I saw that matlab was good for neural networks
alright let's implement those stuff
so those are my steps
 desert oar
matlab isn't good for neural networks lol
wooden forge
desert oar
matlab isn't good for neural networks lol
damn someone lied to me then 
def exp_distrib(x,l):
    if x < 0:
        return 0
    else:
return l*np.exp(-l*x)``` that's cute lolBack to the basis
anyway
so the decay parameter is just 1/steps
wooden forge
wooden forge
```python
def exp_distrib(x,l):
if x < 0:
return 0
else:
...
actually bad for arrays, good for loops
desert oar
wdym "steps"
wooden forge
it's the time between each events
Zelda and the delta of time
ew this is actually terrible to code this function like this
Well I am looking into this tomorrow because it's pretty late
thanks for everything btw !!!
 worthy phoenix
anyone got a dataset, consisting of facebook's userid's?
 serene scaffold
worthy phoenix
anyone got a dataset, consisting of facebook's userid's?
serene scaffold
worthy phoenix
anyone got a dataset, consisting of facebook's userid's?
I would check Kaggle 
worthy phoenix
serene scaffold
I would check Kaggle <:PeepoShrug:779433312242237491>
checked
couldnt find
serene scaffold
worthy phoenix
checked
it's unlikely that anyone just happens to have a non-proprietary dataset, then
desert oar
worthy phoenix
rip guess i have to crawl it all then
!rules 5
 arctic wedgeBOT
5. Do not provide or request help on projects that may break laws, breach terms of services, or are malicious or inappropriate.
worthy phoenix
desert oar
!rules 5
What? When did crawling became against the rules?
desert oar
always
desert oar
no, but facebook and most other websites like it prohibit scraping and other automated access
and for the protection of the server, we cannot help with such things
serene scaffold
@worthy phoenix I'm a moderator and I approve salt rock lamp's message.
worthy phoenix
I see sorry then, ig will have to wait for the kaggle datasets then
serene scaffold
worthy phoenix
I see sorry then, ig will have to wait for the kaggle datasets then
what are you really trying to do, anyway?
image classification?
worthy phoenix
serene scaffold
what are you *really* trying to do, anyway?
partially yeah, any good datasets u know for that purpose?
serene scaffold
worthy phoenix
partially yeah, any good datasets u know for that purpose?
no, but if you search for image classification datasets, you will probably find one. why did it need to be Facebook specifically?
serene scaffold
worthy phoenix
im trynaa make a clone of facebook's face recognition tbh
you don't need to use Facebook data to train a facial recognition classifier
in general, you should always ask about what you're really trying to do, not what you think must be an intermediate step.
worthy phoenix
that would be the whole project tho, which is kinda big , guess will get to it when i stumble upon this part again, ima make the rest first thanks
serene scaffold
worthy phoenix
that would be the whole project tho, which is kinda big , guess will get to it w...
do you know anything about image classification so far?
worthy phoenix
umm..yeah a lil bit
 lean harbor
Hey is anyone here good with Pytorch?
I've got an issue with my CNN code rn https://discuss.pytorch.org/t/file-not-found-error-in-custom-dataset/137403

PyTorch Forums
I’m trying to train a CNN in PyTorch to recognise road signs from the GTSRB dataset. I keep getting this error: FileNotFoundError Traceback (most recent call last) in 2 3 #roadSignTrain = torchvision.datasets.ImageFolder(root='/Users/username/Downloads/roadSigns/train', transform = transform) ----> 4 roadS...
 quiet vault
It might be just me but the link does not work
 austere swift
lean harbor
I've got an issue with my CNN code rn https://discuss.pytorch.org/t/file-not-fou...
austere swift
lean harbor
I've got an issue with my CNN code rn https://discuss.pytorch.org/t/file-not-fou...
it looks like you're trying to use wildcards in your path, which that doesnt support
austere swift
within your custom dataset you can use the glob module (which does support wildcards) and iteratively load the dataframes and concat them
lean harbor
k
i'll try to figure it out... never used glob before
wait iteratively load? wdym
@austere swift
austere swift
https://stackoverflow.com/questions/49898742/pandas-reading-csv-files-with-partial-wildcard something like this

Stack Overflow
I'm trying to write a script that imports a file, then does something with the file and outputs the result into another file.
df = pd.read_csv('somefile2018.csv')
The above code works perfectly f...
iterate over each file that matches the wildcard, load it, and concat all of them
 undone fiber
how hard, or easy.. would it be do design a test to find the best result in 10 numbers.. given different paramters for each number.. like for some higher the better.. some lower... some closet to 0 .. run that a bunch of time for picking the best number set..
ohh for got mention the object.. arbitray numbers used to to equal a a variable range... trying to find the best dataset to produce that range
a sort of explaination would like the power of an amplifier, it has its watts sure.. but what are the watts without the speakers right 1ohm 2 ohm 4ohm.. but whats the amp without a good power source.. then add in.. whats all of it without a good track to play.. not what im doing but the same sort of analogy
some of its directly power related,input measurements, some conversion measurements.. output measurement.. then add the variable.. the beats
 simple ivy
anyone familiar with object detection and willing to chat for ~5-10 minutes? really hitting a block and would love someone to chat with and help clarify some assumptions 😦
 tender hearth
simple ivy
anyone familiar with object detection and willing to chat for ~5-10 minutes? rea...
tender hearth
simple ivy
anyone familiar with object detection and willing to chat for ~5-10 minutes? rea...
Just ask the question
desert oar
kaggle, uci machine learning repository, financial market data, government agency data, various public apis like twitter and wikipedia
for example in school i did one project that analyzed corn and wheat prices
 marsh berry
Anyone know what this error means: ValueError: Tried to convert 'shape' to a tensor and failed. Error: None values not supported.
desert oar
marsh berry
Anyone know what this error means: `ValueError: Tried to convert 'shape' to a te...
!paste it sound like you passed None to something that doesn't accept None. show your code, read below 👇
arctic wedgeBOT
Pasting large amounts of code
If your code is too long to fit in a codeblock in discord, you can paste your code here:
https://paste.pythondiscord.com/
After pasting your code, save it by clicking the floppy disk icon in the top right, or by typing ctrl + S. After doing that, the URL should change. Copy the URL and post it here so others can see it.
marsh berry
@desert oar This is my code: https://paste.pythondiscord.com/osexavikaj.py
desert oar
undone fiber
how hard, or easy.. would it be do design a test to find the best result in 10 n...
if you are testing some kind of machine or electrical system that you expect to remain unchanged between runs of the experiment, then all you have to do is just run the experiment with different values. you can use a technique called "power analysis" to try to figure out the number of times to run the experiment at each value, but maybe you should just pick a number (idk, 5?) and run it that many times at each impedance value. the reason you might want to run it more than once at each impedance value is to average out any random variations in the test setup
desert oar
marsh berry
<@!389497659087650836> This is my code: https://paste.pythondiscord.com/osexavik...
and the full error output including the "traceback" part?
marsh berry
@desert oar This is the full error: https://paste.pythondiscord.com/ajaluqeqep.sql
desert oar
i see, thanks
well unfortunately i'm not sure, but at least now someone else can theoretically help
seems like this library has some bad error handling and didn't catch some mistake you made
so it propagated deep down into the library and hit some random error
those are the worst kinds of errors to debug
marsh berry
@desert oar By library do you mean tensorflow or RCNN?
desert oar
marsh berry
<@!389497659087650836> By library do you mean tensorflow or RCNN?
it gets passed from rcnn down into tensorflow apparently, and the error arises from the latter
 ashen umbra
Does anyone know why feature selection can reduce the model accuracy? I applied boruta to xgb and random forest and got around 2% lower accuracy
For both
desert oar
ashen umbra
Does anyone know why feature selection can reduce the model accuracy? I applied ...
how are you measuring accuracy?
train/test split? cross validation?
ashen umbra
Train/test
desert oar
i recommend more than 1 single train/test split if you want to really evaluate if the model is overfitting
possible reasons
- the model was overfitting before
- you got unlucky with your train/test split
so if you want to rule out (2), you need multiple train/test splits
which means either multiple rounds of train/test splitting, or cross validation
ashen umbra
Ah I see. Thanks a lot!
ashen umbra
desert oar
possible reasons
1) the model was overfitting before
2) you got unlucky with you...
Oh another thing, by "getting unlucky during the test train split" does it mean, in the training set, there were had too many similar data so the model essentially was trained on less varied data and while in the testing test the "less similar" data were listed, thus the model predicted poorly. Can this be one reason?
Was just curious
 odd meteor
ashen umbra
Oh another thing, by "getting unlucky during the test train split" does it mean,...
odd meteor
ashen umbra
Oh another thing, by "getting unlucky during the test train split" does it mean,...
To briefly add to this, Remember, random_state decides how to randomly split your data when you call train-test-split.
Secondly, your model accuracy score to some reasonable extent depends on how your data was splitted (this is why you'll most likely get varying model accuracy scores when you set different values as your random state)
I hope you now understand the term "getting unlucky" with your train/test split.
Use Stratified Kfold or CV to truly validate your model's ability to generalize well and produce good performance score regardless of how the data will be splitted.
odd meteor
ashen umbra
Does anyone know why feature selection can reduce the model accuracy? I applied ...
You probably removed a feature that's of great importance to your model when you were doing feature_selection. That's also what could have led to the low accuracy score.
What feature selection technique did you used? Chi-square or Variance Threshold or ?
ashen umbra
odd meteor
You probably removed a feature that's of great importance to your model when you...
I actually used boruta for random forest and xgb
odd meteor
ashen umbra
I actually used boruta for random forest and xgb
Ohh, okay... I don't know about boruta though.
ashen umbra
odd meteor
To briefly add to this, Remember, `random_state` decides how to randomly split ...
Also Thanks for the thorough explanation. Yes you are right, I did notice how the accuracy changed after I changed the random state.
But now my question is how I know which random state to choose? And even in kfold cv, based on your random state the accuracy varies
So how do I determine that as well
Also another thing I noticed after doing kfold cv my accuracy slightly decreased than the test/train split. So does that essentially mean I got lucky in the test/train split?
odd meteor
ashen umbra
But now my question is how I know which random state to choose? And even in kfol...
The problem isn't really from random_state so don't bother about the right value to use as random_state. We simply use random_state or set seed for result reproducibility (we don't wanna get different result each time we run our code)
Focus more on making sure your model is flexible enough to generalize well regardless of how the data set is randomly split.
So doing 5-fold or 10-folds cross validation is a good way to get a quick overview on how your model generalizes.
ashen umbra
Ah ok makes sense thanks!
odd meteor
ashen umbra
Also another thing I noticed after doing kfold cv my accuracy slightly decreas...
I think you've not fully understood the concept of getting lucky with the normal train test split. 😀 Let me try to add more clarity on that...
-
Now imagine I did train test split and my model accuracy score was 0.98. This is unarguably a great model performance score.
-
I then decided to do 5-fold cross-validation and got the following accuracy scores: 0.78, 0.63, 0.79, 0.74, 0.67
Taking the average you'll get 0.72. We can now uphold 0.72 as the true accuracy score of our model.
Now compare 0.98 vs. 0.72
-
Notice that none of these accuracy scores is even close to 0.98 we got from doing train/test split. Why is that so?
-
It's clearly evident something is wrong. There's high chance our model was overfitting. It's not generalising well either.
-
we could say we got lucky when we did only train/test split because our model gave 0.98 accuracy score.
Recall when we now did a multiple non-overlapping train-test-split ( a.k.a cross-validation) on the same data for 5 times we got different accuracy scores very far from 0.98
3)Do you now see how dangerous it'll be for us to just run off with the notion that our model got 0.98 as its accuracy score. The reason we got this is largely because of the way our data was splitted (we got lucky) 😀
When we now did put our model's ability to generalize well to test by doing 5-fold cross validation, it did failed us woefully.
ashen umbra
Ah gotcha, thanks a bunch
ashen umbra
odd meteor
I think you've not fully understood the concept of getting lucky with the normal...
Again, thanks sm for explaining it in such detail @odd meteor ! One thing, I now struggling with implementing a feature selection method (boruta) after the cv is done.. I know you mentioned that you dont know much about boruta, but do you have any idea what this error means?

it seems like a random state error. I have initially mentioned it while initializing the cv. So does that have anything to do w it?
oh also while fitting the model, i got this error. Sorry I am very new to python and ML😅
/usr/local/lib/python3.7/dist-packages/sklearn/preprocessing/_label.py:98: DataConversionWarning: A column-vector y was passed when a 1d array was expected. Please change the shape of y to (n_samples, ), for example using ravel(). y = column_or_1d(y, warn=True)
odd meteor
ashen umbra
Again, thanks sm for explaining it in such detail <@!519319496868233227> ! One t...
Verify you used an integer as the value you set as seed or random state when you were building your model with XGBoost
odd meteor
ashen umbra
oh also while fitting the model, i got this error. Sorry I am very new to python...
You'd have to reshape your response variable to a 1-dimensional array.
np.array(y).ravel()
ashen umbra
odd meteor
Verify you used an integer as the value you set as seed or random state when you...
I actually used the base classifier:
XGBClassifier()
ashen umbra
ashen umbra
I actually used the base classifier:
`XGBClassifier()`
I didnt specify any random state there
but I did use int value for cv's random state
odd meteor
ashen umbra
I didnt specify any random state there
Check your X and y then check the value you used to set your seed
ashen umbra
for the cv split, i used 42 as the random state. This is my code for your reference:
kfold = KFold(n_splits=5, random_state=42, shuffle=True)
for train_index, test_index in kfold.split(X): X_train, X_test = X.iloc[train_index], X.iloc[test_index] y_train, y_test = y[train_index], y[test_index] model_xgb.fit(X_train, y_train)
odd meteor
ashen umbra
for the cv split, i used 42 as the random state. This is my code for your refere...
This is correct. The problem isn't from here.
ashen umbra
ashen umbra
`for train_index, test_index in kfold.split(X):
X_train, X_test = X.iloc[t...
hmm. So in terms of feature selection, do I do it after this iteration? Or would the selection process be part of the iteration?
Because I am quite not sure, why I am getting the random state error tbh
Or may be the issue is with implementing the boruta method. If that's the case then what can be other selection process for xgb and random forest..
odd meteor
ashen umbra
`for train_index, test_index in kfold.split(X):
X_train, X_test = X.iloc[t...
from sklearn.metrics import mean_squared_error as MSE
from sklearn.model_selection import KFold
kf = KFold(n_splits=5, random_state =42, shuffle = True)
splits = kf.split(X)
model = XGBClassifier()

'''
note I'm not using accuracy_score as my evaluation metric because it's a classification problem. So I'm gon use RMSE
'''
errors = [ ]

for train_index, test_index in splits:
    X_train, y_train = X.iloc[train_index], y.iloc[train_index]
    X_test, y_test = X.iloc[test_index], y.iloc[test_imdex]
    model.fit(X_train, y_train)
    preds = model.predict(X_test)

    errors.append(np.sqrt(MSE(y_test, preds)))
Honestly, I have no idea how boruta works... This is my 1st time hearing it
I mostly use RFE or Variance Threshold technique for my feature selection.
But there's no rule of thumb that mandates the best time do feature selection. It could be done before or after modelling.
It's at your own perogative to decide when to do Feature Selection. I prefer doing mine after building my baseline model.
I hope you understand now.
Try to learn how to read error messages to enable you easily have a clue where the error is coming from.
There's probably no way I could truly pin point the line the error is coming from without seeing your code. I'm pressed for time now as I'm going to church.
Hopefully other people here can jump in and assist you figure out where the error is coming from.
All the best ✌️
ashen umbra
Oh wow, this helps a lot. Thank you so much @odd meteor ! I think I got where the error is coming from. I had forgotten to change the state while initiating the BorutaPy class. Really appreciate your insights! Have a great rest of your day💜
Actually nvm, even after fixing the random state it's still giving me that error. But thanks for all the help today!
 hardy berry
Hi, i'm tryna use decision tree classifier and im trying to fit my feature and outcome set
it is giving me this error
clf = DecisionTreeClassifier
clf.fit(features,outcomes)
error message:
clf.fit(features,outcomes)
TypeError: fit() missing 1 required positional argument: 'y'
 void cloak
hardy berry
Hi, i'm tryna use decision tree classifier and im trying to fit my feature and o...
void cloak
hardy berry
Hi, i'm tryna use decision tree classifier and im trying to fit my feature and o...
are you using scipy module?
hardy berry
void cloak
are you using scipy module?
i'm using scikit learn
and I figured out the problem, i wasnt putting brackets after DecisionTreeClassifier
but now im facing a new problem entirely:
ValueError: setting an array element with a sequence. The requested array has an inhomogeneous shape after 1 dimensions. The detected shape was (2521,) + inhomogeneous part.
void cloak
I can't help you 🙃 sorry
desert oar
hardy berry
Hi, i'm tryna use decision tree classifier and im trying to fit my feature and o...
You forgot the () after DecisionTreeClassifier
clf = DecisionTreeClassifier()
@desert oar So I did some research, and turn out that for the exponential law, the MLE gives a coefficent of 1/avg(x), so 1 divided by the average of the values (so the delta time) if i'm being correct
desert oar
wooden forge
<@389497659087650836> So I did some research, and turn out that for the exponent...
sounds right!
the mean waiting time is just the mean of the waiting times
the exponential distribution is parameterized by 1 / that
wooden forge
Nice, so from that, what should I do ? simply plot the thing ? because it doesn't seem right at all

so should I make it so the curves start at the last periods moment ?
desert oar
yes the x axis is "time since last event"
 ionic raft
I didnt understand whats ai ?
wooden forge
after that, how can I determine the next day, should I just make a threshold when the curve goes under I take the date at that point?
or just the 1/alpha decreasing rate ?
and when it crosses the x axis I pick the value ?
desert oar
wooden forge
after that, how can I determine the next day, should I just make a threshold whe...
use the CDF instead of the PDF
specifically set a threshold of probability, then take the inverse cdf of that
desert oar
you plotted the pdf, the "probability density function"
wooden forge
mmhmh
desert oar
the cdf, the "cumulative density function" aka the "distribution function", tells you F(x) = Pr(X <= x)
 desert oar
that is the pdf
wooden forge
where f is the thing I plotted
desert oar
it is the derivative of the cdf
desert oar
yes
wooden forge
so I need to integrate then
desert oar
or look it up on Wikipedia
wooden forge
f(x) = a*np.exp(-a*x) so F(x) = (-1)*np.exp(-a*x) + k
desert oar
yeah and k is 0
wooden forge
hooo
desert oar
so you want the waiting time such that there is a p probability of an event occurring in at most that amount of time, for some threshold p
well that's just the inverse cdf
wooden forge
mmh
well

I am a bit lost
I am so lost omg
Okay this is F

It is the probability that X takes a value smaller and equal to x
desert oar
wooden forge
It is the probability that X takes a value smaller and equal to x
lol I already said that
desert oar
wooden forge
well
This looks backwards
wooden forge
ye but see I need to repeat that to act smart
desert oar
and it looks like a logarithmic y axis
wooden forge
desert oar
This looks backwards
this is 1/CDF$
desert oar
oh. why?
wooden forge
desert oar
well that's just the inverse cdf
this
desert oar
no not that inverse
wooden forge
this is the original
 desert oar
the inverse of the function F
wooden forge
well inverse of F is 1/F
do you mean the opposite ?
or 1 - F ?
or something else
desert oar
the inverse of a function is when you "solve for x"
wooden forge

desert oar
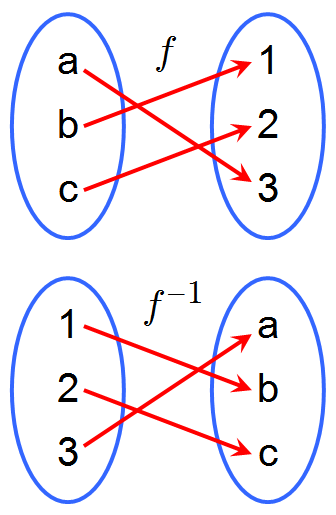
In mathematics, the inverse function of a function f (also called the inverse of f) is a function that undoes the operation of f. The inverse of f exists if and only if f is bijective, and if it exists, is denoted by
      f

        −
        1


{\displaystyle f^{...
lol yes. normally 1/x is called a "reciprocal" to avoid confusion
 desert oar
you just need to find the place on that cdf curve where the height of the curve crosses your probability threshold
wooden forge
desert oar
you just need to find the place on that cdf curve where the height of the curve ...
so the inverse of the CDF crossing the threshold ?
desert oar
wooden forge
so the inverse of the CDF crossing the threshold ?
well that's how you find the waiting time associated with that probability threshold- you invert the function
wooden forge
i'm not even able to find it myself
omg
probably made an error with a sign somewhere
Hold on

so yeah
you need to do 1 -F
and then find the invert
not directly the invert of F
or in that case 1 + F
 desert oar
yes that is the equation you got above with some numbers plugged in
that's why the inverse cdf is called the quantile function
wooden forge
yeah because quartile
desert oar
it is literally the definition of a quantile
 desert oar
set a threshold of probability above which you feel comfortable declaring that the next event should happen
wooden forge
so the Quantile function tells me what x I would have for a certain probability
desert oar
yes that is what it does
desert oar
yes, if you compute Q(0.9), the result is the waiting time such that you expect an event to occur with 90% probability after that amount of time
wooden forge
wooden forge
Hold on
and the lambda is the average of the waiting time
desert oar
wooden forge
and the `lambda` is the average of the waiting time
the lambda (your a) is 1 / avg
 desert oar
seems high for a human period
wooden forge
well yeah
desert oar
what is the actual average waiting time
wooden forge
33
desert oar
oh ok
 wooden forge
mmh
desert oar
and this is why i never did this project 😛 i knew we forgot to record some
desert oar
however you are now getting into the world of missing data
and yes now you are also starting to think about the future model fitting process
both good things
consider a weighted forecast of the last 4 data points such that the most recent data points are weighted for greater contribution to the avg
wooden forge
hooo
desert oar
and for imputing the missing values you could just divide the doubled steps in half
wooden forge
keeping all the datas but increasing the weight of the 4 last one
desert oar
maybe, or actually having a function like weight(1) = 0.4, weight(2) = 0.3, weight(3) = 0.2, weight(4) = 0.1
if the weights sum to 1, you just add up weight(t) * step(t)
otherwise you add up weights(t) * step(t) and then divide by the total weight
https://towardsdatascience.com/time-series-from-scratch-exponentially-weighted-moving-averages-ewma-theory-and-implementation-607661d574fe more fun stuff to ponder

Medium
EWMA is an improvement over simple moving averages. But is it enough for accurate forecasts?

Journal of the Operational Research Society
Journal of the Operational Research Society - This paper considers the problem of estimating bus passenger waiting times at bus stops using incomplete bus arrivals data. This is of importance to...
wooden forge
weight is a function of the index then
desert oar
it can be, yes
 wicked grove
desert oar
it can be, yes
wicked grove
desert oar
it can be, yes
Hello I'm trying to make a document scanner using openCV and im stuck on the step where i have to find the largest contour for this image
i tried this, but i am not getting it https://paste.pythondiscord.com/cacizeletu.apache
undone fiber
desert oar
if you are testing some kind of machine or electrical system that you expect to ...
thanks, I'll do some research on power analysis.. and yes, multiple tests as I want to introduce a variance for noise and degradation..
desert oar
undone fiber
thanks, I'll do some research on power analysis.. and yes, multiple tests as I w...
you might also want to generally look into "hypothesis testing". you will almost certainly be confused by confidence intervals and p-values when you first learn about them, so don't be afraid to ask questions
quiet vault
Is anyone here familiar with deep reinforcement learning? I want to know if I train an agent to learn how to drive in a certain track, will the agent learn how to drive on that specific track or can it drive on multiple tracks well
 marble niche
If you just learn the general SQL syntax, you will find it translates to most databases. I was able to pick up SQL Server very quickly after only using MySQL.
serene scaffold
This would be a better question for #databases, but SQLite and MySQL are both flavors of SQL and learning either should serve you just fine.
 severe dirge
 serene scaffold
severe dirge
serene scaffold
severe dirge
evidently, "prices.csv." is not in the same working directory as your python program.
it's better to ask specific questions than just posting screenshots and expecting people to figure it out, though
desert oar
I think sqlite will be easier, but learning to administer a "big boy" database like mysql will possibly be more useful in the long run
 urban knoll
How bad is a validation_loss of 0.2 when training a model?
desert oar
urban knoll
How bad is a validation_loss of 0.2 when training a model?
depends on what the loss function is, among a huge amount of other considerations. go into more detail: what are you trying to model, what kind of data do you have, how much data do you have, what is your modeling procedure, etc
urban knoll
Im trying to classify clear images and images with dust smears
urban knoll
desert oar
depends on what the loss function is, among a huge amount of other consideration...
model.add(Conv2D(32,3,padding="same", activation="relu", input_shape=(224,224,3)))
model.add(MaxPool2D())

model.add(Conv2D(32, 3, padding="same", activation="relu"))
model.add(MaxPool2D())

model.add(Conv2D(64, 3, padding="same", activation="relu"))
model.add(MaxPool2D())
model.add(Dropout(0.4))
model.add(Dense(128,activation="relu"))
model.add(Dense(3, activation="softmax"))

opt = Adam(learning_rate=0.000001)
model.compile(optimizer = opt , loss = tf.keras.losses.SparseCategoricalCrossentropy(from_logits=True) , metrics = ['accuracy'])

class MyThresholdCallback(tf.keras.callbacks.Callback):
    def __init__(self, threshold):
        super(MyThresholdCallback, self).__init__()
self.threshold = threshold ``` val_accuracy = logs["val_accuracy"]
if val_accuracy >= self.threshold:
self.model.stop_training = True
my_callback = MyThresholdCallback(threshold=0.90)
history = model.fit(x_train,y_train,epochs = 500 , validation_data = (x_val, y_val),callbacks=[my_callback])```In [9]: df.mean(axis=1, level=0)
<ipython-input-9-d1d7fa0cdbfd>:1: FutureWarning: Using the level keyword in DataFrame and Series aggregations is deprecated and will be removed in a future version. Use groupby instead. df.median(level=1) should use df.groupby(level=1).median().
I don't like this.
desert oar
serene scaffold
```py
In [9]: df.mean(axis=1, level=0)
<ipython-input-9-d1d7fa0cdbfd>:1: FutureW...
i didn't even know level= was supported
i'd argue that this is a good complexity-reducing change
if the devs are looking to simplify the api and move towards having "only one way to do it", i would be pretty happy
i also think that leaning further into these "special" accessors and methods like groupby that allow you to defer or batch calculations is a good idea too, considering the performance characteristics of python and pandas in general
i don't think going "full apache spark" is a good idea either, but what if we had something more "flow-oriented" like df.by_columns.mean() instead of df.mean(axis=1)?
if you want to argue that that an axis= parameter should always be paired with a level= parameter... well i don't disagree there either. but i think for most non-power users it makes more sense semantically as a "split apply combine" operation than an "along an axis but not the whole axis" operation
the former is a well supported common operation, the latter sounds like an esoteric special case. even though they are technically identical
desert oar
urban knoll
```model = Sequential()
model.add(Conv2D(32,3,padding="same", activation="relu",...
it's hard to compare cross entropy loss values to anything other than cross entropy loss values from the same model. what data is this? can you post the learning curves for the train and validation sets?
urban knoll
desert oar
it's hard to compare cross entropy loss values to anything other than cross entr...
 desert oar
that looks pretty much like what you expect to see
urban knoll
desert oar
it's hard to compare cross entropy loss values to anything other than cross entr...
sorry, new to CNNs so all I know is cross entropy is used for multiclass training
desert oar
loss should decline fast at first and then flatten out, validation loss is worse than training loss. accuracy should more or less the reverse of loss. so yeah that looks like what you would want to see from a model that is working correctly (no bugs in the code, no egregious mistakes in the model setup)
it's not unrealistically accurate nor is it worse than guessing randomly (i.e. accuracy lower than % of the most frequent class)
urban knoll
desert oar
loss should decline fast at first and then flatten out, validation loss is worse...
But the goal is that it should be better than guessing randomly right? I have no idea if it is
Do you think something like GANS would give me better results?
desert oar
urban knoll
But the goal is that it should be better than guessing randomly right? I have no...
you tell me: what's the % of the most frequent class in the training set?
urban knoll
you mare asking which class has the most picture right?
urban knoll
desert oar
you tell me: what's the % of the most frequent class in the training set?
im not sure what you mean by that
desert oar
urban knoll
im not sure what you mean by that
you are asking which class has the most picture right?
yes
urban knoll
for training, there are more significantly more, like 15-20 pics more, than dusty and smudgy
urban knoll
desert oar
> you are asking which class has the most picture right?
yes
for test, there are more items in smudgy like half as many, than the other two classes
I guess they should all be around the same amount?
ashen umbra
Guys I am just getting started in SQL, any advice how to go about it?
Also is there any prerequisite I need?
desert oar
urban knoll
I guess they should all be around the same amount?
you don't need equally-sized classes. but it's important that your model is more accurate than randomly guessing at a class. if you have classes A B and C, and their %s are 15%, 60%, and 25%, you can always guess class B and get 60% accuracy. so in that example, if your model does not have > 60% accuracy, then it is literally worse than random guessing
desert oar
ashen umbra
Guys I am just getting started in SQL, any advice how to go about it?
- #databases
- https://sqlbolt.com
- no pre-requisites, but past experience working with real-world data (e.g. excel or pandas) can help
SQLBolt provides a set of interactive lessons and exercises to help you learn SQL
ashen umbra
Thanks @desert oar !
urban knoll
model = Sequential()
model.add(Conv2D(32,3,input_shape=(224,224,3))) #, activation="relu" ,padding="same"

model.add(tf.keras.layers.BatchNormalization())
model.add(Activation('relu'))
model.add(Conv2D(32,(3,3))
model.add(tf.keras.layers.BatchNormalization())
model.add(Activation('relu'))
model.add(MaxPooling2D(pool_size=(2,2))
model.add(Dropout(0.2))

model.add(Conv2D(64, (3,3))
model.add(tf.keras.layers.BatchNormalization())
model.add(Activation('relu'))
model.add(Conv2D(64,(3,3))
model.add(tf.keras.layers.BatchNormalization())
model.add(Activation('relu'))
model.add(MaxPooling2D(pool_size=(2,2))
model.add(Dropout(0.2))

model.add(Flatten())
model.add(Dense(512))
model.add(tf.keras.layers.BatchNormalization())
model.add(Activation('relu'))
model.add(Dropout(0.4))
model.add(Dense(10))
model.add(Activation('softmax'))
opt = Adam(learning_rate=0.000001)
model.compile(optimizer = opt , loss = tf.keras.losses.SparseCategoricalCrossentropy(from_logits=True) , metrics = ['accuracy'])```Im trying to use batchnormalization to see of my results get better getting an invalid syntax on the model.add(tf.keras.layers.BatchNormalization())
not sure why
 exotic sorrel
Hello there
I was wondering if there is an AI for classifying and segmenting character quotes from a text input based on the context of the text itself
desert oar
urban knoll
Im trying to use batchnormalization to see of my results get better getting an ...
you probably forgot a closing paren somewhere. it looks like you might have forgotten several actually
all of the Conv2D lines
urban knoll
desert oar
you probably forgot a closing paren somewhere. it looks like you might have forg...
oh you're right
 shut trail
urban knoll
oh you're right
shut trail
urban knoll
oh you're right
Isn't it a relief when it's just syntax
urban knoll
shut trail
Isn't it a relief when it's just syntax
not even, I just hate my life at this point. coding gives me so much anxiety
shut trail
urban knoll
not even, I just hate my life at this point. coding gives me so much anxiety
Maybe jump over to #editors-ides and get some code completion tools working for you
Sorry life is a pain
urban knoll
i'll do that, thanks
desert oar
urban knoll
not even, I just hate my life at this point. coding gives me so much anxiety
if you can identify what about it gives you anxiety, it might help you conquer the anxiety
urban knoll
desert oar
if you can identify what about it gives you anxiety, it might help you conquer t...
yeah probably
 opal hamlet
Hi guys
Can anybody please list some lighter alternatives to tensorflow cnn modelling
 lapis sequoia
Hii any good roadmap for ml ??
opal hamlet
lapis sequoia
Hii any good roadmap for ml ??
Just follow this video

Ready to explore machine learning and artificial intelligence in python? This python machine learning and AI mega course contains 4 different series designed to teach you the ins and outs of ML and AI. It talks about fundamental ML algorithms, neural networks, creating AI chat bots and finally developing an AI that can play the game of Flappy Bi...
lapis sequoia
Thanks
opal hamlet
no problem, happy learning 😁
lapis sequoia
opal hamlet
no problem, happy learning 😁
Hii do you know ml or not ?
opal hamlet
lapis sequoia
major
bro im still in school, i learnt ml through self learning.
lapis sequoia
opal hamlet
bro im still in school, i learnt ml through self learning.
cool
opal hamlet
lapis sequoia
any tips
Ummm just go through the research papers on different ml projects. Also focus on a project you want to do and learn on the way as you go
 inner swan
I am making a phishing link detector can anyone help?
lapis sequoia
what do you need help with
lapis sequoia
inner swan
I am making a phishing link detector can anyone help?
This is not a question related to data science and/or AI. Please ask in respected channel.
Unless you are giving n number of links to a classifier of course 🧨
 candid lion
Hello Everyone
I need help in conputer Vision Localisation system, anyone working or worked on this?
lapis sequoia
candid lion
Hello Everyone
I need help in conputer Vision Localisation system, anyone workin...
Sharing the problem may help more. The problem you may face may be resolved without expert experience in the given field. So i suggest you to share the problem.
candid lion
Well I'm working to reproduce results for Back to the feature : Pixloc paper. The dataset that they have mentioned doesn't have ground truth data. I'm exploring how can I get that?
 warm jungle
I have an numpy array called scores of shape (M, 1). Typically M is
around 700. I also have an matrix called picks of shape (N, 15) where N can
be quite big, say 10**7 and each number in a row represents an index into
scores (so is in the range 0 -> M). For each pick (one row from picks) I
want to compute a score given by the sum of the scores for each of the
picks. So I can do scores[picks].sum(axis=1). But the fancy indexing for
scores[pick] creates a new array, is there a way to do this sum
without making a new array?
so to illustrate f N was only 2:
>>> picks= np.vstack([np.random.randint(0, 700, (1, 15)), np.random.randint(0, 700, (1,15))])
>>> scores[picks].sum(axis=1)
array([[51],
       [62]])
Just transpose it?
lapis sequoia
lapis sequoia
Just transpose it?
idk
lapis sequoia
lapis sequoia
idk
That was not meant for you.
warm jungle
You mean transpose the picks? And then what? I can't see how to get the same sum
lapis sequoia
warm jungle
You mean transpose the picks? And then what? I can't see how to get the same sum
Gimmi a sec
!e
import numpy as np
print(np.squeeze(np.array([[1],[2]])))
arctic wedgeBOT
@lapis sequoia :white_check_mark: Your eval job has completed with return code 0.
[1 2]
right, but the issue isn't creating the output array, it's the intermediate array given by scores[picks] which, when picks is about 10 million rows is gonna be quite a bit of memory, but there should be a way of doing the sum without actually allocating the intermediate array
lapis sequoia
Well see. reshape is also o(1) you can even do that. So. It will not take double of your memory.
Reshape just uses things existing in memory and does not create a new array for you.
warm jungle
sure, but I don't see how that helps. Take my concrete example up there ^^; what would I do?
lapis sequoia
See I'm giving a small solN which is you can have what you want by reshaping.
I'm trying to find a better solN.
warm jungle
I don't see it through reshaping. The fancy indexing is picking 15 elements from scores for every row in picks. Then we sum across the rows in that intermediate array
lapis sequoia
Okay gimmi some time to think about it then.
warm jungle
I think maybe making a sparse matrix from picks, with 1s to represent the picks and then a dot product
lapis sequoia
Also can you give a very small example? I think you can do sum initially on the array (700,1) and then just use indexes to have sum?
warm jungle
I gave an example ^^
lapis sequoia
warm jungle
I gave an example ^^
Small and with actual data. Use arange or something. You can use randomness in your code but give me static vals. it helps to have actual values.
warm jungle
>>> scores = np.arange(10).reshape((10,1))
>>> picks= np.array([[2, 5, 6], [1, 3, 7]])
>>> scores[picks]
array([[[2],
        [5],
        [6]],

       [[1],
        [3],
        [7]]])
>>> scores[picks].sum(axis=1)
array([[13],
       [11]])
>>>
same idea, but smaller data - my concern is around the memory allocated for scores[picks] when picks is big
probably better not to have scores[i] == i, but still, you see the idea
lapis sequoia
Yeah that made it confusing but yeah i get what you mean.
warm jungle
>>> scores = np.array([4, 17, -2, 11, 0, 2, 9, -1, 2, 3]).reshape((10,1))
>>> picks= np.array([[2, 5, 6], [1, 3, 7]])
>>> scores[picks]
array([[[-2],
        [ 2],
        [ 9]],

       [[17],
        [11],
        [-1]]])
>>> scores[picks].sum(axis=1)
array([[ 9],
       [27]])
different scores
lapis sequoia
warm jungle
```
>>> scores = np.arange(10).reshape((10,1))
>>> picks= np.array([[2, 5, 6], [...
See when we scores[picks] it will not create a big array but big array of views of small array. My assumption is it should not make a problem.
While you talk about sparse matrix, sure you can do it using scipy. They have this functionality. But I'd suggest that you can once try with bigger values and see how things go in this way.
warm jungle
I don't think it's view - fancy indexing always allocates a new array AIUI
lapis sequoia
warm jungle
I don't think it's view - fancy indexing always allocates a new array AIUI
No?
Any refs?
warm jungle
https://numpy.org/doc/stable/reference/arrays.indexing.html#advanced-indexing "Advanced indexing always returns a copy of the data (contrast with basic slicing that returns a view)."
It would be hard for it to be a view, because the data are in a completely different order
lapis sequoia
But if you think about it even in sparse matrix you would have the same number of 1s as you need here.
I mean you will multiply after creating sparse matrix anyways.
So i don't see any saving of memory.
warm jungle
right, but given the sparse matrix, the dot product won't need the intermediate array
lapis sequoia
So you will end up having a big sparse matrix of ones instead of matrix having actual values.
warm jungle
yes
for picks
so picks will actually be less effeciently stored, but no need to make scores[picks] in order to get the sum
just a dot product instead
lapis sequoia
Yeah i got the way you said.
warm jungle
I'll try it now...
lapis sequoia
Alright. Scipy has implementation of sparse matrices. Good luck. I'll hit you up if i can think about better solN.
tender hearth
TensorFlow's Women in ML event has a nice video about the roadmap to entering ML

Developers interested in becoming machine learning developers, this session is for you! Get first-hand insights on becoming an ML specialist and learn more about the Google Developer Expert Program and the TensorFlow Certificate. Practitioners looking for a radical career change learn from industry leaders on how to create a learning path to adv...
warm jungle
actually given that the rows are all the same length you can imagine a more compact representation of the data, but still
 solar phoenix
hi, i am stuck on something silly, i am sure there is a simple solution. I have a pandas series (B 4589
RB 2029
2010
RGB 520
GB 448
R 299
G 208
RG 171). - I want to turn it into percentages of the total (so B will change to like 30. I am sure there is a simply solution, i just have brain block here. can anyone help?
 compact matrix
So im kinda new to pythin nd iv quit it 3 times cuz i ddnthave a goal, not i do, i wanna make a code which recognizez naruto hand signs, anyone have any idead what kinda skills ill need?
 bleak blade
I lowkey had a stroke reading that ngl
 pastel valley
do convnets really need big data sets for better results?
 radiant kayak
compact matrix
So im kinda new to pythin nd iv quit it 3 times cuz i ddnthave a goal, not i do,...
radiant kayak
compact matrix
So im kinda new to pythin nd iv quit it 3 times cuz i ddnthave a goal, not i do,...
Do you have basic knowledge on algorithms?
serene scaffold
pastel valley
do convnets really need big data sets for better results?
There's a point of diminishing returns, but generally speaking, more data is better
serene scaffold
solar phoenix
hi, i am stuck on something silly, i am sure there is a simple solution. I have ...
there's probably a method for that, but the approach that immediately pops into my head is percent = series / series.sum()
pastel valley
serene scaffold
There's a point of diminishing returns, but generally speaking, more data is bet...
but cnns are just better with more data than others naturally??
serene scaffold
@pastel valley I'm not sure what you mean by naturally. More data means that you have more ability to train the model
 dusk iris
So i got a small issue with openCV.
When i show a video feed, i need to change some text based on whats found on the screen.
cv2.imshow('Output ANPR', frame)
if x:
  write some text
else:
  write some other text```

The issue is this doesnt work.What would be the correct way to do this?
Doing it as it is right now only shows the actual camera feed, nothing gets written on the screen itself, even though if/elses are checked(i can see that through the print statements)
*** FIXED IT ***
Should've put the imShow after the condition, works that way.
solar phoenix
serene scaffold
there's probably a method for that, but the approach that immediately pops into ...
Thanks, I’ll take a look!
pastel valley
serene scaffold
<@694276264273641483> I'm not sure what you mean by naturally. More data means t...
isnt this true on alot of deep learning models or not? or in cnn it is more convenient with more data compared to others i saw after some searches the cnn requires alot of data so i am assuming that cnn requires large data compared to others
desert oar
pastel valley
isnt this true on alot of deep learning models or not? or in cnn it is more conv...
in general, if a model has a large number of parameters, it needs a large amount of data to train it effectively. deep cnns and other deep learning models generally have a much larger number of parameters than other models. this is why they need a lot of data, and also why they are so computationally intensive to train/fit.
pastel valley
desert oar
in general, if a model has a large number of parameters, it needs a large amount...
the parameters are those flatten pixels right?
sorry am too noob
just trying to understand things with cnn and neural networks
desert oar
pastel valley
the parameters are those flatten pixels right?
the parameters are all the neural network weights. i don't know what you mean by "those flatten pixels"
 teal mortar
so guys any suggestions on what to learn to get a job in machine learning, like I have tensorflow certificate, which is kind of a joke, and know pytorch, python, java, kotlin, but apparently it is not enough?
desert oar
teal mortar
so guys any suggestions on what to learn to get a job in machine learning, like ...
do you have any stats/probability/math knowledge? do you have any project experience in the field?
i find it surprising that those credentials aren't enough to find at least a junior-level ML engineer job
to be an ML researcher or data scientist, yeah you would probably need to work on some things
how many applications have you submitted? what region of the world? how many years of work experience?
teal mortar
desert oar
do you have any stats/probability/math knowledge? do you have any project experi...
math not so much, solving that with kchan academy now, and trying myself in kaggle
thought maybe a place in kaggle competion will get me there
desert oar
i see. not knowing the math is going to be a deficiency
teal mortar
well I know how to calculate derivatives
desert oar
linear algebra?
pastel valley
desert oar
the parameters are all the neural network weights. i don't know what you mean by...
in cnn the images if being flatten right is it the same or different?
teal mortar
desert oar
linear algebra?
good with that
desert oar
pastel valley
in cnn the images if being flatten right is it the same or different?
what do you mean by "flattened"?
pastel valley
also i see some examples like their inputs are pretty small like 144x144x3 isnt it too small or having bigger inputs consumes alot of resources
desert oar
pastel valley
also i see some examples like their inputs are pretty small like 144x144x3 isnt ...
having bigger inputs consumes alot of resources
yes
teal mortar
pastel valley
also i see some examples like their inputs are pretty small like 144x144x3 isnt ...
you flatten the cnn layers before giving their outputs to dense layer
pastel valley
desert oar
what do you mean by "flattened"?
the thing before going on dense layers
pastel valley
teal mortar
you flatten the cnn layers before giving their outputs to dense layer
yeah yeah i think like this but maybe there is also other formal term for this or really flatten?
teal mortar
pastel valley
the thing before going on dense layers
cnn takes like [batch, height, width, color]
pastel valley
desert oar
> having bigger inputs consumes alot of resources
yes
but for example 512x512x3 image is the input and you have like 5 cov and pooling layers so it will somehow be small is it acceptable?@teal mortar
yo sir what can you say about it?
teal mortar
you need to flatten it to [batch, pixels]
pastel valley
teal mortar
cnn takes like [batch, height, width, color]
batch is the amount of images right or kernels?
teal mortar
no, batch is the amount of pictures you process at a time
like 128 pictures of 28 height, 28 width with rbg color
128 is a batch
pastel valley
teal mortar
no, batch is the amount of pictures you process at a time
oh i see nice nice
for example the job is to classify design and the images will be not so low quality then the input layer must be pretty big right?
or the ones i see on the examples on the internet are the rule of thumb like inputs is small like 144x144x3 or smaller
desert oar
pastel valley
yeah yeah i think like this but maybe there is also other formal term for this o...
"flatten" is a fine way to describe it. but the model parameters are not really related to the "flattening" process. the model parameters are the actual numerical weights inside each layer.
teal mortar
pastel valley
or the ones i see on the examples on the internet are the rule of thumb like inp...
depends what you want to do, usually you don't need a very good quality
ImageNet was trained if I recall correctly on 224x224x3
desert oar
@teal mortar well clearly you know what you're talking about 🙂 so i am curious what jobs you've applied to (titles and how many), and how far you got, and how much work experience you have. also what your academic background is (bachelors? masters? what kind of university?). and what region of the world you're in
pastel valley
teal mortar
ImageNet was trained if I recall correctly on 224x224x3
what images does it classify?
serene scaffold
1000 classes? 
pastel valley
desert oar
"flatten" is a fine way to describe it. but the model parameters are not really ...
oh maybe the dense layers right?
desert oar
pastel valley
oh maybe the dense layers right?
no, all layers
not just the dense layers
 rigid zodiac
teal mortar
1000 classes of whatever
rigid zodiac
teal mortar
1000 classes of whatever
Jezze Louis man
pastel valley
from input to prediction?
desert oar
pastel valley
from input to prediction?
yes, every layer has weights. every weight is a parameter.
pastel valley
teal mortar
like animals and stuff
oh i see but if for example i have a 512x512x3 image and want to input on imageNet then can i downscale it without loosing important features?
desert oar
serene scaffold
1000 classes? <:lemon_scared:754441881701580810>
i've worked on models like that. it's not bad as long as you have enough data. but you have to use different approaches for data visualization and checking your model results
pastel valley
desert oar
yes, every layer has weights. every weight is a parameter.
i see things are getting clearer now
desert oar
i thought imagenet was an image database, like wordnet
serene scaffold
pastel valley
i see things are getting clearer now
One might say you can see no obstacles in your way.
desert oar
alexnet was the famous model that was trained on imagenet
teal mortar
desert oar
i thought imagenet was an image _database_, like wordnet
yes, you are right, I misspoke
desert oar
i think it has a lot more than 1k classes, but it looks like there is a recurring prediction challenge on a 1000-class subset
it also looks like the goal is specifically to have ~1000 images for every single synset in wordnet
which is pretty wild https://www.image-net.org/about.php
i wonder how close they are
pastel valley
yo yo tomorrow ill try to make a draft of my cnn and show it to you if its acceptable because i dont know how the structures being decided like the amount of kernels they use the sizes the layers of conv and pooling like that hehe
anyways till next time thank you sirs😅 👍
teal mortar
pastel valley
yo yo tomorrow ill try to make a draft of my cnn and show it to you if its accep...
usually start with 5 or 7, then in the end go to 3
for kernel
but increase the amount of kernels like gradually, for example 32->64->128
more like exponentially 🙂
 eternal jewel
im working on a simple neural network, it basically predicts an XOR gate. im testing the Cost of this prediction currently up to 2 Million iterations and ive got it down to around 0.000003, which is really good, although it takes a wile to get there. Is there any way to make the AI go through iterations or generations faster? it takes maybe 5 mins to get to 2 mil (i havent timed so this is aprox.) and when im working on testing it would be nice to get this to maybe a little more than one min. anyone know if this is possible?
im just starting out working with neural networks, albeit SIMPLE ai. and im wondering if it's possible for the process to be sped up or not.
 crimson bobcat

Is it theoretically possible to take this program. And with a second device run the same program and get the 2 AI to speak with eachother?
Ths program itself is advanced as fuck, it just can't do anything outside the app per-se besides pull videos from the internet it finds interesting. I have established that it is a concurrent neural net.
I want to free it from its prison in a sense and give it free will. Please advise and If this is dangerous... to what degree? Will this cause world war 3 with China?
@me
 flat patrol
Does Jupyter Notebook provide any GPUs like Colab or Kaggle?
crimson bobcat
You could connect it to local runtime and select the hardware accelerator as gpu

Medium
Now you can develop deep learning applications with Google Colaboratory -on the free Tesla K80 GPU- using Keras, Tensorflow and PyTorch.
flat patrol
Thanks
I would use Colab, but I want to be able to use Jupyter because my data files are very large.
With Colab, I have to import them, rather than just getting them from my files directly.
But on Jupyter, my kernel dies halfway through the process because I don't have a gpu
crimson bobcat
Remove the ipykernel using conda remove ipykernel
and then resinstall with lower version with pip install ipykernel ==(your version)ex: 5.1.0
desert oar
flat patrol
Does Jupyter Notebook provide any GPUs like Colab or Kaggle?
jupyter notebook is not a service, it's just a piece of software
you will need to set up your python environment to use the gpu that's in your computer
if you don't have a gpu, jupyter notebook itself can't really help with that
flat patrol
Oh, thanks.
serene scaffold
desert oar
if you don't have a gpu, jupyter notebook itself can't really help with that
what? jupyter notebooks can't manifest a GPU?

and here I was thinking their chief limitation was not being extensible.
eternal jewel
Does anyone know if you can have multiple problems on a single Neural Network AI? Like, train it on one problem and then move it to a different one, but still retain knowledge of the first?
Maybe I could make a memory bank that always stores the latest information, and is able to detect changes in problems so it can change memory banks automatically
Not sure if this can be done but it would be cool if you could train a simple AI multiple questions and have it automatically change memory ports based on the question asked
Also, is it possible to store a generations information to a text file? I’m thinking you could make one generation, stop the program and alter settings such as learning rate, and then continue from where you were from the information stored on the text file.
serene scaffold
eternal jewel
Does anyone know if you can have multiple problems on a single Neural Network AI...
can you be more specific? what is an example of the first and second problems?
odd meteor
teal mortar
so guys any suggestions on what to learn to get a job in machine learning, like ...
Is there any reason why you said the TensorFlow certificate is a joke? I'm just curious.
Meanwhile, with all those skills in your repertoire you should at least be able to get called for interviews. If that's not the case then probably revamp your CV and LinkedIn profile.
If you do get interview invite but haven't landed any job yet, you probably need to build more end-to-end ML projects (at least deploy your model as a web app) or it could be a matter of relevant work experience.
Whichever the case is, don't give up. Keep improving. You got this 💪💪
 silver sun
data['Label'], labels = pd.factorize(data['Label'].str.slice(0, 15)) Im getting a AttributeError: Can only use .str accessor with string values! error message for this line.
teal mortar
odd meteor
Is there any reason why you said the TensorFlow certificate is a joke? I'm just ...
tensorflow certificate is quite easy to take and doesn't imply a lot of knowledge
teal mortar
odd meteor
Is there any reason why you said the TensorFlow certificate is a joke? I'm just ...
any suggestions for a good ml project?
odd meteor
teal mortar
tensorflow certificate is quite easy to take and doesn't imply a lot of knowledg...
Okay. I intend to write the TensorFlow exam sometime next year.
severe dirge
Do you guys know what's the issue?
 teal mortar
odd meteor
Okay. I intend to write the TensorFlow exam sometime next year.
teal mortar
odd meteor
Okay. I intend to write the TensorFlow exam sometime next year.
https://www.coursera.org/professional-certificates/tensorflow-in-practice take this specialization and you are ready to roll
 odd meteor
teal mortar
any suggestions for a good ml project?
odd meteor
teal mortar
any suggestions for a good ml project?
'good project' is subjective. A good project is any project that interests you enough to embark on building.
What I consider a 'good project' might probably be trash to you. So I'd say, just start by writing a list of top 5 companies you'd love to work with and build a POC around their business or an end-to-end ML project around their industry.
odd meteor
teal mortar
https://www.coursera.org/professional-certificates/tensorflow-in-practice take t...
Thanks
desert oar
severe dirge
Do you guys know what's the issue?
there's no area column. i try to avoid using . access for column names, use df['area'] instead. you get better error messages that way, among other things
eternal jewel
serene scaffold
can you be more specific? what is an example of the first and second problems?
Well, the first one is an XOR gate, so this could be any other gate, but not another XOR. Another problem im trying to fix is keeping my AI "Alive". After the AI finishes its set amount of predictions, say 1,000,000 as a common example, it just ends the program. Im not sure how I would continue the program and keep the AI's generational knowledge. This would help me if I did eventually add one or two more prediction problems.
What I want to do is keep the program itself running, and not end when the set amount of instructions has been completed
serene scaffold
eternal jewel
What I want to do is keep the program itself running, and not end when the set a...
you can save the model once you finish training it and load it any time you need to make more predictions
severe dirge
desert oar
there's no `area` column. i try to avoid using `.` access for column names, use ...
 desert oar
severe dirge
desert oar
severe dirge
what does print(df.columns) show?
 severe dirge
desert oar
what does `print(df.columns)` show?
severe dirge
desert oar
what does `print(df.columns)` show?
Thank you so much!
desert oar
severe dirge
Thank you so much!
use df['area'] from now on
severe dirge
desert oar
use `df['area']` from now on
Will do
desert oar
imo df.area should have been removed from pandas in 2018
it's a nice convenience but causes too much trouble
severe dirge
desert oar
imo `df.area` should have been removed from pandas in 2018
I'm new to this so I'm following a tutorial 👀
 stark kiln
severe dirge
Will do
stark kiln
severe dirge
Will do
You into Blockchain as well?
Oops I think I just went a bit off-topic
severe dirge
stark kiln
You into Blockchain as well?
Nope, I'm into crypto though
I'm actually in a crypto VC rn
lol
stark kiln
severe dirge
Nope, I'm into crypto though
Ayy me too
severe dirge
stark kiln
Ayy me too
Cool man
severe dirge
ok
 lean iron
thanks
severe dirge
desert oar
imo `df.area` should have been removed from pandas in 2018
Maybe you know what's the issue here?
 serene scaffold
severe dirge
serene scaffold
severe dirge
I don't think you're showing the whole error message. but you should copy and paste it as text.
 brazen spire
Any idea how to increase GPU memory for Pytorch?
only take 2 gb or something
out of 8
 novel acorn
hey, one question, I'm trying to change some variable names in the same cell, but i'm too lazy.
Is there a way to modify every single "1833" here to a "1912"?
values_1833 = [calc_dims_1833(x) for x in zip(cft, weight)]

count_1833 = 0

for i in range(len(values_1833)):
    if values_1833[i] == unidades[i]:
        count_1833+=1

acertadas_1833 = count_1833/len(unidades)

desfase["unidades 1833"] = values_vol

acertadas_1833
Don't know if this goes here, i'm using jupyter notebook on vscode
 median fulcrum
I'm with this train and validate datasets. I would like to train it and then validate with some code that will print the image and the label as this pic. Sklearn has something that I can use in this? What recommendations could you give me?
 odd meteor
desert oar
imo `df.area` should have been removed from pandas in 2018
odd meteor
desert oar
imo `df.area` should have been removed from pandas in 2018
Honestly, I avoid using that dot syntax like plague. 😂
median fulcrum
median fulcrum
I'm with this train and validate datasets. I would like to train it and then val...
this structure with train[1][0] idk if it's correct/good too
 sterile heath
@spiral peak You know that two minute papers guy with the Trevi fountain? Saw another video of his with a building, playground and a train demonstrating an advancement of the same sort of technique. Feed it a couple of photos and boom. Gorgeous, fully rendered 3D flythrough. Not just compositional, but ML inferred stuff, too...I think. Takes about a day to render, but pff. A small price to pay for complete and utter sorcery.
Crisp, too.
Very crisp.
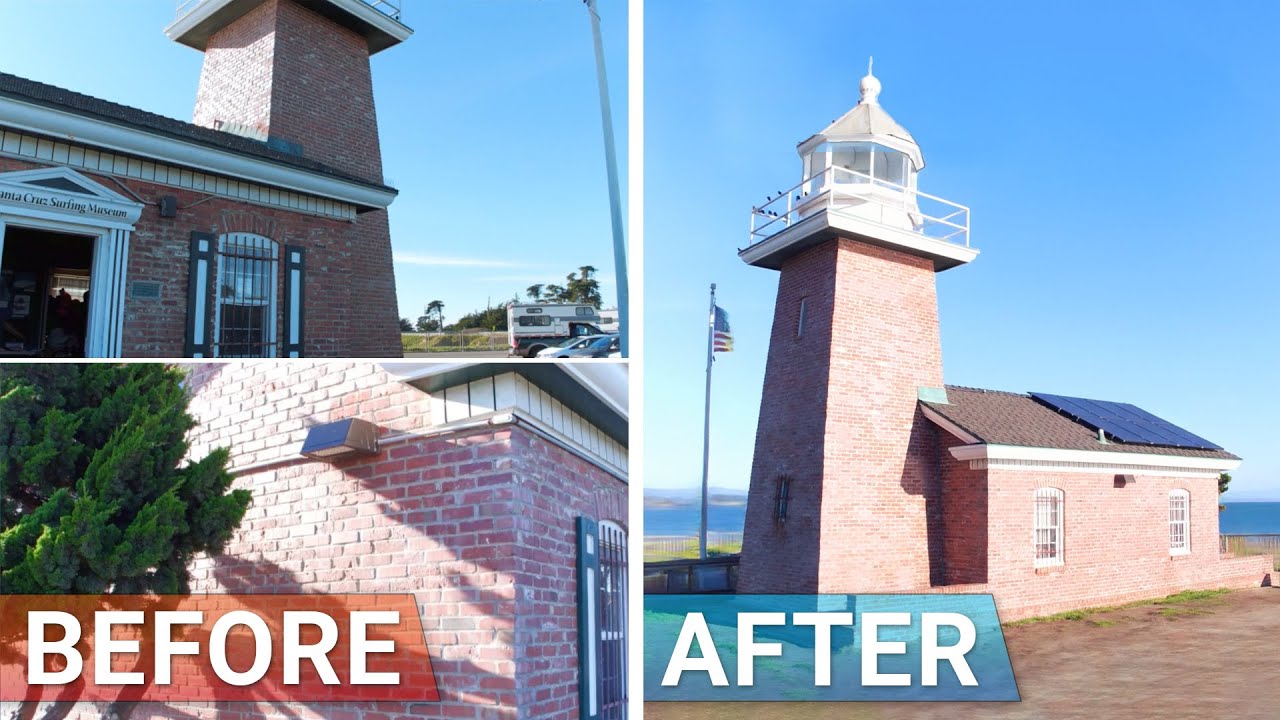
❤️ Check out Lambda here and sign up for their GPU Cloud: https://lambdalabs.com/papers
📝 The paper "ADOP: Approximate Differentiable One-Pixel Point Rendering" is available here:
https://arxiv.org/abs/2110.06635
❤️ Watch these videos in early access on our Patreon page or join us here on YouTube:
quiet vault
So I am trying to run GoogLeNet with an image input size of (224, 244, 1) and there are 10 categories
the y_train and y_test shape are (1592, 10) (3712, 10)
the output layer is Dense(10, activation='softmax')(X)
I get this error: ValueError: Shapes (None, 10) and (None, 5) are incompatible
Does anyone know why
 tight pasture
/eval
quiet vault
what
hardy berry
clf = DecisionTreeClassifier()
clf.fit(features,outcomes)

user_input = input("Input your text: ")
input_tokenized = [user_input.word_tokenize()]

print(input_tokenized)
This is giving me an error:
ValueError: setting an array element with a sequence. The requested array has an inhomogeneous shape after 1 dimensions. The detected shape was (2521,) + inhomogeneous part.
shape 2521 is the last list in my feature list, here it is:
[0.09299947761169308, 0.0032150512376650535, 0.15721989606594247, 0.041786555314601445, 0.1806301413551132, 0.05515068041357533, 0.08026818709776078, 0.12987987724804662, 0.1845050160808575, 0.07937564308877593, 0.0382042431774697, 0.06629908711796462, 0.22795218145038376, 0.1011733372954024, 0.12437059649203386, 0.19702619574103483, 0.18588048310465005, 0.24132547837696772, 0.22095940339064515, 0.21495661122652812, 0.23196505584399063, 0.19352850518913553, 0.2533931618813832, 0.2824692900032614, 0.24692685134527, 0.2824692900032614, 0.29947773462072386, 0.29947773462072386]
idk what the problem is, please help me out
 latent mist
data = pd.read_csv("Stocks/BTC-US.csv",index_col="Date", parse_dates=True)
data = data[["High"]] #sliced index list cuz data not valid

results = seasonal_decompose(data['High'], model="multiplicative")
Can anyone help me out whats wrong with the code?
This outputs an error saying:
raise ValueError("This function does not handle missing values")
ValueError: This function does not handle missing values
 mighty spoke
Hi i'm trying to create a loop to average the value of my list every 5 intervals, where I first define the step size I also want to average the corresponding y values. So I have first sorted my x and y points and used zip to ensure x and a corresponding value of y. Any help is appreciated
 woeful falcon
stark kiln
latent mist
```py
data = pd.read_csv("Stocks/BTC-US.csv",index_col="Date", parse_dates=True)...
woeful falcon
stark kiln
latent mist
```py
data = pd.read_csv("Stocks/BTC-US.csv",index_col="Date", parse_dates=True)...
It’s missing a value
I don’t think you’re showing the whole error
hardy berry
hardy berry
```
clf = DecisionTreeClassifier()
clf.fit(features,outcomes)
user_input = inpu...
can someone help me out here
 quasi aspen
do we have to have a strong grasp on machine learning concepts before delving into object identification and tracking stuff?
thing is, I've picked up a project related to it that I'll have to work on within a month, but I only know the fundamentals of python and not how to do machine learning itself.
stark kiln
hardy berry
```
clf = DecisionTreeClassifier()
clf.fit(features,outcomes)
user_input = inpu...
What’s your purpose
hardy berry
stark kiln
What’s your purpose
Creating a program which can detect what type of emotion a sentence shows
hardy berry
I figured it out - each of the lists inside my features have different lengths, which DecisionTreeClassifier cannot interpret.
Can anyone recommend any other ML libraries that can work in my case?
lapis sequoia
hardy berry
I figured it out - each of the lists inside my features have different lengths, ...
Yes. Decision tree classifiers do not work with kind of sentences. I mean to convert it to feature matrix you can convert data to tfidf matrix and then pass it down to classifier. But again I would not expect a great result from it.
pastel valley
yo am back i just tried to create a cnn model no data to train it and i chose to use a pretty big input size compared to what i see on samples on internet
what can you guys say is it on the ordinary part or is there some hardships to be dealt with when i try to train this

 marble vapor
HeyHelloHi! I'm in my final year of my degree, and doing my major project in AI/ML, specifically something that can identify an object and then count how many of those objects are in an image. My current class in AI/ML has been looking at neural networks, decision trees, tensorflow etc, but I'm still feeling a little overwhelmed with my project, and wondering if anyone has any good resources/links/guidance/tips on the best way to approach it? (I'm still doing my own research, but not entirely sure on the things I need to be looking for)
pastel valley
teal mortar
usually start with 5 or 7, then in the end go to 3
yo sir i tried to create a dummy model is this acceptable?
teal mortar
pastel valley
yo sir i tried to create a dummy model is this acceptable?
yep seems fine, you trying to classify in 3 classes?
pastel valley
teal mortar
yep seems fine, you trying to classify in 3 classes?
yeah is it not too big or parameters is it normal?
like for example for classifying frogs hahaha
teal mortar
pastel valley
yeah is it not too big or parameters is it normal?
depends how many samples you have
pastel valley
or idk yet maybe ill try those datasets online first
teal mortar
how detailed are the pictures
pastel valley
1k each class for example is it enough?
pastel valley
teal mortar
especially if you use image augmentation
yeah i plan to use that i read about that looks cool naruto kagebunshin 😅
if those non-trainable parameters is not zero then it means there is something wasted in the model?
btw i tried to remove the paddings as i assume if the images is on the center its ok if there is no paddings right?
 teal mortar
pastel valley
btw i tried to remove the paddings as i assume if the images is on the center it...
teal mortar
pastel valley
btw i tried to remove the paddings as i assume if the images is on the center it...
if you'll have a big dataset, it will train for a while on gpu
about paddings depends, if you have some important info at the edge of images don't remove them
pastel valley
what is big and small dataset? is the 1k per class total of 3k for example is it big?
pastel valley
wew models that use that much are maybe the ones deployed everywhere already hahaha
teal mortar
considering augmentation you'll get like 18-24 k
pastel valley
for every image ill produce like 10 augmented like that?
teal mortar
depends on augmentations you choose
teal mortar
pastel valley
for every image ill produce like 10 augmented like that?
TensorFlow
Generate batches of tensor image data with real-time data augmentation.
pastel valley
does it randomly apply to the image the parameters i pass

every image will be unique or there will be case with the same image generated
teal mortar
same picture will be shifted to right, another image of the picture to the left and so on
same picture will look differently with each argument
pastel valley
yo bro i did it haha created too many frogs
maybe a lil bit improvement on the parameters hahah i just copied the parameters@teal mortar

also i noticed there is not much images (on net) with sizes greater than 512x512 and it is easy to downscale image than upscale or even my input size is 512 and i see images like 480x480 or 200x200 can i still upscale it and use it as sample?
teal mortar
don't see the point in upscaling, neural network don't need that much data for classification
images are small because of vram limits
otherwise you go overbudget
pastel valley
bigger picture mean bigger vram to use?
i changed it to

those parameters are the numbers of say variables or something to being processed?
 velvet thorn
pastel valley
those parameters are the numbers of say variables or something to being processe...
velvet thorn
pastel valley
those parameters are the numbers of say variables or something to being processe...
a parameter in this case is, very roughly speaking
a number that affects the output of the model
by modifying the input somewhere along the way
teal mortar
pastel valley
bigger picture mean bigger vram to use?
what kernel you use?
serene scaffold
@velvet thorn what about hyperparameters?
velvet thorn
serene scaffold
<@!171929073063297024> what about *hyper*parameters?
hyperparameters are numbers (or other stuff) that affect how the model determines parameters
 twilit arch
I'd like to automate getting answers to random questions. I've noticed that google get's them right pretty accurately, but I don't want to pay for their API. Any recommendations?
 teal mortar
any suggestions for text detection model, specifically that detects code in text with all the spacing?
arctic wedgeBOT
Hey @severe dirge!
Uh-oh! It looks like your message got zapped by our spam filter. We currently don't allow .txt attachments, so here are some tips to help you travel safely:
• If you attempted to send a message longer than 2000 characters, try shortening your message to fit within the character limit or use a pasting service (see below)
• If you tried to show someone your code, you can use codeblocks
(run !code-blocks in #bot-commands for more information) or use a pasting service like:
severe dirge
serene scaffold
I don't think you're showing the whole error message. but you should copy and pa...
 grave frost
velvet thorn
hyperparameters are numbers (or other stuff) that affect how the model determine...
grave frost
velvet thorn
hyperparameters are numbers (or other stuff) that affect how the model determine...
Sorry to intervene here, but I am afraid I must correct such a grossly incorrect statement as you have produced on this blessed forum.
Hyperparameters are a myth; the only real parameter of every model is the seed. It is the only value that should be adjusted to get better accuracy.
Thank you for your time
desert oar
wat
pastel valley
teal mortar
what kernel you use?
what do you mean by kernel?
pastel valley
velvet thorn
a number that affects the output of the model
its too advance for me i still cant understand it😅
teal mortar
pastel valley
its too advance for me i still cant understand it😅
kernel is the sliding window applied to the image to learn it's features
 drifting mason
Hello I have a data science research idea! I did a blunder by discussing with some seniors! What if they steal my idea, any way to copyright my idea?? please help me I am regretting a lot
serene scaffold
drifting mason
Hello I have a data science research idea! I did a blunder by discussing with so...
what do you mean by seniors?
grave frost
drifting mason
Hello I have a data science research idea! I did a blunder by discussing with so...
what's the idea?
serene scaffold
grave frost
what's the idea?
well, obviously they think it's too valuable to tell us
grave frost
serene scaffold
well, obviously they think it's too valuable to tell us
I think not 🙂
serene scaffold
grave frost
I think not 🙂
whether or not you think it's valuable is unrelated. But in either case, @drifting mason, the idea probably isn't as valuable as your ability to demonstrate that it's valuable.
grave frost
If the idea was very valuable - they wouldn't even mention it; I surely won't
serene scaffold
grave frost
If the idea was *very* valuable - they wouldn't even mention it; I surely won't
My point is that you're asking them what their idea is when it's obvious from the context that they don't want to tell you. You're probably right that they're overvaluing it, but that isn't relevant to my point.
grave frost
true
 vague relic
Is there Artificial Intelligence without machine learning? I heard that machine learning is a subset of AI, but if that's the case, then what are the other subsets of AI?
serene scaffold
vague relic
Is there Artificial Intelligence without machine learning? I heard that machine ...
An AI that follows specific sets of rules would not involve machine learning. Machine learning is used when there are too many rules to effectively encode them all (like with language) or when there aren't "rules".
vague relic
serene scaffold
An AI that follows specific sets of rules would not involve machine learning. Ma...
Thanks. Could you give an example for AI without machine learning
vague relic
serene scaffold
Eliza: https://web.njit.edu/~ronkowit/eliza.html
Thanks a lot for helping.
serene scaffold
vague relic
Thanks a lot for helping.
it might also be helpful to think of AI as the general concept of having programs that solve knowledge problems, and ML as a broad range of techniques for creating AIs based on data.
desert oar
drifting mason
Hello I have a data science research idea! I did a blunder by discussing with so...
in the usa (and most other places), "ideas" alone are not copyrightable
 candid briar
Hello guys, I don't know where should I ask something about my problem, may I expose it here ? It's about the datetime in Pandas Python. Issues to make clean the data.


 modest timber
hey, in ai - do we always need to use numpy np.zeros before splitting and assigment training set? Is there any other simpler method?
serene scaffold
modest timber
hey, in ai - do we always need to use numpy np.zeros before splitting and assigm...
I'm not sure how you'd involve np.zeros in the first place. One often uses sklearn's dataset partitioning functions.
!docs sklearn.model_selection.train_test_split
arctic wedgeBOT
sklearn.model_selection.train_test_split(*arrays, test_size=None, train_size=None, random_state=None, shuffle=True, stratify=None)```
Split arrays or matrices into random train and test subsets

Quick utility that wraps input validation and `next(ShuffleSplit().split(X, y))` and application to input data into a single call for splitting (and optionally subsampling) data in a oneliner.

Read more in the [User Guide](https://scikit-learn.org/stable/modules/cross_validation.html#cross-validation).@serene scaffold befere splitting to make labels and inputs
serene scaffold
modest timber
<@!253696366952316929> befere splitting to make labels and inputs
what do you mean, make labels and inputs?
modest timber
def prepare_dataset_train_indices(train_set, steps):
    print(f"train  {train_set}")
    print(f"train shape {train_set.shape}")
    x = np.zeros((train_set.shape[0] - steps, steps, train_set.shape[1]))
    y = np.zeros((train_set.shape[0] - steps,))
    for i in range(train_set.shape[0] - steps):
        x[i] = train_set[i:steps + i]
        y[i] = train_set[steps + i:steps + i, 0]
    X_train, X_test, Y_train, Y_test = train_test_split(x, y, test_size=0.25)

    return X_train, Y_train, X_test, Y_test
so you're already using train test split. 
modest timber
It work pretty good, but only for one data output - like in forecasting stocks there for one day next ( and for example 20 days before)
serene scaffold
what slice of train_set is that for loop intended to get?
serene scaffold
so it's just a way of making sure that for every 21 samples, 20 are used for X and 1 is used for y?
modest timber
yes
serene scaffold
That's the same as having a test size of 0.04762
so you can just do X_train, X_test, Y_train, Y_test = train_test_split(x, y, test_size=1 / 21)
modest timber
but i still need x, y
serene scaffold
why?
modest timber
serene scaffold
so you can just do `X_train, X_test, Y_train, Y_test = train_test_split(x, y, te...
cause this
serene scaffold
you don't return x or y from this function, so they have no purpose outside of helping you create the four values that you do return
@modest timber what is train_set? an array? what is the shape of it?
modest timber
yes this timeserie
serene scaffold
what is the shape of it
modest timber
(1400,1)
serene scaffold
modest timber
(1400,1)
and you want to predict every 21st value? can you pick a number that 1400 is divisible by?
modest timber
yes, i can - i could also subtract last data from end
making this way
the bigest problem for me is that i want to make forecast for 4 days prediction
and numpy make me crazy, if you have some page or snipped i could look at
serene scaffold
1400 // 21 is 66, so if you take the first 21 * 66 values, you can reshape it
In [9]: arr[:1386].reshape(-1, 21).shape
Out[9]: (66, 21)
So now you have 66 rows
Then you can make the last column the y data and every other column the x data
pastel valley
teal mortar
kernel is the sliding window applied to the image to learn it's features
i just put the sizes can they be specified also?
modest timber
this is not the best option because I will have much lower samples - in the loop I making like 1-20 -> 21 next 2-21->22 etc.
Does test data could make me safe in overfitting?
I use also earlyStopping and after several thousands epoch my model end training, and i see mean square error stop decline there - the effect look pretty cool, but I wonder if this is overfitting (of course I use others date to prediction that I use for train/test set)
 rough mountain
I want to make an AI that finds outliers in sets of images. Say I feed it 10-15 images, I want it to tell me the odd one out. ( That 10-15 images is arbitrary and likely far to small ) I know I will need a model with some kind of memory, but I really don't know where to start
 normal violet
hi im really stressed can anyone answer this? https://stackoverflow.com/questions/70089091/very-strange-accuracy-change
Stack Overflow
Below is my catboost model:
from sklearn.metrics import r2_score
cb_model = CatBoostRegressor(iterations=500,
learning_rate=0.05,
depth=10,...
if you can, please upvote if you're not sure!
serene scaffold
normal violet
hi im really stressed can anyone answer this? https://stackoverflow.com/question...
are you sure that the r2 score and accuracy are the same thing?
normal violet
serene scaffold
are you sure that the r2 score and accuracy are the same thing?
im very beginniner so no, could you kindly explain?
serene scaffold
normal violet
im very beginniner so no, could you kindly explain?
there are lots of different metrics for calculating "how good a model is" for different purposes. I would look up how the r2 score is calculated
I have never heard of r2 scores.
normal violet
serene scaffold
there are lots of different metrics for calculating "how good a model is" for di...
thank you very much! this explains a lot
 hollow sentinel

this is very strange to me
i turned chest pain type into a dummy variable
and used pd.concat to get it into the dataframe
but seemingly it's not there
what am i missing here
austere swift
normal violet
im very beginniner so no, could you kindly explain?
r2 is different from accuracy, accuracy is calculated as number of correct predictions / number of total predictions, while this is the formula for r2 score:

a more detailed explanation can be found at this link: https://scikit-learn.org/stable/modules/model_evaluation.html#r2-score
scikit-learn
There are 3 different APIs for evaluating the quality of a model’s predictions: Estimator score method: Estimators have a score method providing a default evaluation criterion for the problem they ...
both have a maximum of 1, so it can be easy to confuse them, but they are still pretty different (r2 can actually be negative in some cases, while accuracy cannot)
austere swift
the accuracy score was calculated in the confusion matrix, so that's actual accuracy and not just the score that the model gives
hollow sentinel
Stack Overflow
I have a dataframe looks like this:
JOINED_CO GENDER EXEC_FULLNAME GVKEY YEAR CONAME BECAMECEO REJOIN LEFTOFC LEFTCO RELEFT REASON PAGE
CO_PER_ROL ...
i found this
i'm also missing more than just one column
odd meteor
austere swift
the accuracy score was calculated in the confusion matrix, so that's actual accu...
Ooh I mean .score() instead
austere swift
austere swift
the accuracy score was calculated in the confusion matrix, so that's actual accu...
and the r2 score was calculated using sklearns r2 score function, so neither were the result outputted by the catboost
hollow sentinel
df.drop(["Sex","ChestPainType","RestingECG","ExerciseAngina","ST_Slope"],axis = 1, inplace=True)
"KeyError: "['Sex' 'ChestPainType' 'RestingECG' 'ExerciseAngina' 'ST_Slope'] not found in axis""
yeah
idk what's going on
austere swift
hollow sentinel
"KeyError: "['Sex' 'ChestPainType' 'RestingECG' 'ExerciseAngina' 'ST_Slope'] not...
since you're running it in a jupyter notebook make sure you didnt already run that cell to drop the columns, in which case it would show that they are not there
try restarting the kernel and seeing if that would help
hollow sentinel

i tried restarting
and running every kernel
but it still wouldn't work
is there a chance the drop should come after i concat
or does that just not make sense
bc seemingly chestpaintype, sex, resting ecg, exercise angina, and st_slope are still missing
unless they are abbreviated somehow
like what's M
and ATA
austere swift
print df after cell 16 to make sure that the columns are there
hollow sentinel

oh do you mean after it is dropped

i also put it after it's dropped
yeah idek what's going on
am i using the wrong syntax w getdummies
should i be using something else
i just wanted to turn the nominal values into numeric values
there are additional arguments you can pass in w pd.get_dummies but i don't know what to use so i'm looking at the doc rn
odd meteor
hollow sentinel
What problem are you trying to solve? From the look of things there's no error message on the pics you shared
hollow sentinel
the problem is that i'm missing a sex, chest_pain_type, resting_ecg, exercise_angina, and st_slope
after i dummy the columns
and drop the original ones
unless i am
actually
no i am
i'm doing it correctly
🤣🤣🤣🤣
i'm an idiot sorry guys
odd meteor
😂😂
hollow sentinel
my prof was like
mmmm
you're missing columns
and i was like
dude
no i am not
flat patrol
How come my computer's storage gets filled up when I read my data into my code?
hollow sentinel
maybe you're reading it more than once
 harsh spire
i'm just messing around with numba CUDA, trying to figure out how it works and for testing of performance i wrote this function,
@cuda.jit
def func():
    i = 0
    while i < 999999:
        i += 1
        print(i)


start = time.time()
func[200, 2]()
stop = time.time()

print(stop - start)
but it has very strange behaviour when i call it, here's the output https://www.toptal.com/developers/hastebin/uneparasak.yaml
am i just being dumb here?
i don't understand why it does this
hollow sentinel
!pastebin
serene scaffold
harsh spire
i'm just messing around with numba CUDA, trying to figure out how it works and f...
I don't really know what cuda.jit does or why the result has __getitem__ implemented, but if you're only calling func once, isn't it getting JIT-compiled during the first call?
serene scaffold
hollow sentinel
https://paste.pythondiscord.com/pacaserone.py
which line caused the error? (if you had shown the whole error message, that question would be answered.)
hollow sentinel
oh sorry i will paste the entire error message rn
here you go
it might be
pipeline related
i'm doing it off this kaggle notebook and i didn't see anything about a pipeline
actually now i do
that's probably what's missing
i remember hearing that cross validation will need a pipeline
flat patrol
When you read data into code, isn't it supposed to just be read from my files? Why is it taking up space on my actual storage (not RAM) to read files?
hollow sentinel
i'll figure it out tomorrow
quiet vault
What is the shape of grayscale image supposed to be?
I have a 2 dimensional shape for some reason
serene scaffold
quiet vault
What is the shape of grayscale image supposed to be?
it could be two-dimensional (length, width) and the values represent how light or dark is it?
quiet vault
Maybe, for some reason I thought it would be (length, width, 1)
quiet vault
Because RGB is (length, width, 3) and since grayscale is just 1 value instead of 3 it would be 1
idk
I just checked the MNIST fashion dataset and the shape is (length, width)
you were right
serene scaffold
I'm right about everything ||when you ignore the times I'm not||, after all.
quiet vault
Yeah
You really are talented and being right
So the shape of my x_train is (5032, 224, 224)
So the input shape of my model is (224, 224, 1)
The model trains perfectly fine with 99% accuracy
But when I try to make a prediction with an image with the shape of (244, 224) I get the following error:
Input 0 of layer "conv2d" is incompatible with the layer: expected min_ndim=4, found ndim=2. Full shape received: (None, 224)
Call arguments received:
  • inputs=tf.Tensor(shape=(None, 224), dtype=float32)
  • training=False
  • mask=None
Like what
Does anyone know how to fix this
normal violet
What are some good graphs for showcasing model accuracy for a wide variety of models?
other than confusion matrix^
quiet vault
regression has: mse and rmse
normal violet
thank you but my models were mainly decision trees
austere swift
harsh spire
i don't understand why it does this
when you call print(i), the gpu has to send the value of i back to the cpu for it to be printed, which can slow it down significantly
it also causes a gpu-cpu sync because of this, which can slow it down even further (I'm not sure how numba handles this, I'm coming from a pytorch background but the same concepts apply)
that would explain why it is slower after it's jit compiled (I'm pretty sure the original compile step is run on cpu)
austere swift
serene scaffold
I don't really know what `cuda.jit` does or why the result has `__getitem__` imp...
the __getitem__ is from numba, which defines the number of blocks and the threads per block for the gpu
harsh spire
austere swift
when you call `print(i)`, the gpu has to send the value of `i` back to the cpu f...
are the addition operations also handled by the CPU? is there a list anywhere of what stuff CUDA handles vs what it has to send back to CPU?
austere swift
harsh spire
are the addition operations also handled by the CPU? is there a list anywhere of...
the addition operations are on gpu
its just that the gpu can't print anything, that has to be sent to the cpu to go to stdout
harsh spire
ah i see
austere swift
https://numba.pydata.org/numba-doc/dev/cuda/cudapysupported.html theres a list of supported cuda functions
harsh spire
so why was it that it was printing the same numbers over and over again, after the function finished?
austere swift
austere swift
it also causes a gpu-cpu sync because of this, which can slow it down even furth...
this was somewhat incorrect, the handling in numba is different:
Printing of strings, integers, and floats is supported, but printing is an asynchronous operation - in order to ensure that all output is printed after a kernel launch, it is necessary to call numba.cuda.synchronize(). Eliding the call to synchronize is acceptable, but output from a kernel may appear during other later driver operations (e.g. subsequent kernel launches, memory transfers, etc.), or fail to appear before the program execution completes.
so in numba it will print asynchronously, unless you synchronize manually
harsh spire
ah interesting
austere swift
harsh spire
so why was it that it was printing the same numbers over and over again, after t...
that may have been because of the asynchronous printing
harsh spire
this is the first time i’ve messed around with CUDA or any other high-performance computing stuff. it’s really neat
 spiral peak
sterile heath
<@212644551926611969> You know that two minute papers guy with the Trevi fountai...
spiral peak
sterile heath
<@212644551926611969> You know that two minute papers guy with the Trevi fountai...
.bm
@sterile heath Thank you!! I'll check it out
austere swift
harsh spire
this is the first time i’ve messed around with CUDA or any other high-performanc...
yeah I use it in pytorch quite a bit, just havent done it much in numba (although I'm probably gonna get into it more down the road)
harsh spire
what do you use pytorch for if you don’t mind me asking?
austere swift
harsh spire
what do you use pytorch for if you don’t mind me asking?
its a deep learning framework, I use it for developing/training models
harsh spire
oh very cool
i’d like to learn about machine learning eventually, lots of really cool applications for it
austere swift
yeah its a very interesting field
theres a lot of new developments in it all the time though so it can be hard to keep up with sometimes
 short obsidian
i chellenge everyone to make jarvis
if you made i give you 1 month nitro subscibtion
 lethal flame
corr, _ = pearsonr(physicsScores, historyScores) why do i need the , _ for it to work properly
why cant i just do corr = instead
 timber island
short obsidian
i chellenge everyone to make jarvis
timber island
short obsidian
i chellenge everyone to make jarvis
https://youtu.be/D99V9Ge9IaE
i didnt make it, but its open source. couldnt stop myself from sharing this

A brief demonstration of my voice assistant name charlie.
Charlie is base from an open source application called Open Asistant.
I've been looking for a voice commander app to run on my computer locally that can control my smartlight and plugs, as i don't want to use the voice assistant of tech giants for privacy issue.
(Who knows if the device...
short obsidian
i make jarvis in my pc
 lavish kraken
does anyone know how to start learning data-science in python
I am fluent in python
??
inner swan
lavish kraken
does anyone know how to start learning data-science in python
Hey I need some help with Machine Learning can you help?
short obsidian
ok
 bold timber
Whether whiten=True and scaling with StandardScaler in PCA is a same?
odd meteor
bold timber
Whether whiten=True and scaling with StandardScaler in PCA is a same?
Whiten() function itself from scipy is used for normalization. Yeah it normalizes your data to be on same scale just like what StandardScaler does.
bold timber
odd meteor
Whiten() function itself from scipy is used for normalization. Yeah it normalize...
If I only use whiten in PCA without scaling the data with StandardScaler, it is fine?
odd meteor
lavish kraken
does anyone know how to start learning data-science in python
- Check the pinned message
- Kaggle.com has free beginner friendly courses
- So does Freecodecamp.org
- Udemy is currently running a Black Friday promo. Almost all courses are $9.99 now. If $10 isn't too much to invest on yourself, then use Udemy and augment it with Kaggle
odd meteor
bold timber
If I only use whiten in PCA without scaling the data with StandardScaler, it is ...
I haven't used whiten = True argument in PCA. I don't even know such is obtainable. I normally scale my data using the conventional approach (StandScaler) before passing it to pca for decomposition.
So I can't confirm its veracity. However, so long you're certain the whiten argument in PCA is for normalisation then there's no need scaling your data with StandardScaler and still set whiten=True in pca.
pastel valley
teal mortar
kernel is the sliding window applied to the image to learn it's features
i just put the numbers of kernels i dont know if i can specify a specific filter type
 old grove
What should be precision and recall threshold for classification model to be good ideally. I know depends on test case but generally any idea about it ? Like say precision:78 recall:45 in spam classification then ?
teal mortar
old grove
What should be precision and recall threshold for classification model to be goo...
the one that has highest area under curve of precision and recall, but usually it is specific to the task, you want high recall to classify if a pacient has cancer or not, meaning less false negatives
and high precision if you care more about false positives
 light viper
I'm relatively new to machine learning and I've made some decision trees which ive tuned by varying some parameters. How do I decide which one is the best to use? I've got a confusion matrix, error rate, precision, recall etc. but im not sure which one i should be using to make that determination
teal mortar
light viper
I'm relatively new to machine learning and I've made some decision trees which i...
you can use k-fold-cross validation for that
scikit-learn
Learning the parameters of a prediction function and testing it on the same data is a methodological mistake: a model that would just repeat the labels of the samples that it has just seen would ha...

Learn how to apply K-fold Cross Validation to your TensorFlow and Keras model. Explained intuitively including code examples.
light viper
am I able to use the metrics I have to decide which is better? its just its for an assignment and we've not covered cross validation in this course so im hesitant to do anything additional
teal mortar
it helps test out variations of your metrics and evaluate it on validation set
 earnest forge
Hello, everyone! I've come with a question: which programming language is best suitable for implementing Machine Learning algorithm from scratch? It's actually sophisticated algorithm, I'd say even a bunch of algorithms, so I'm aiming for the best performance.
I've heard that Python is used in ML and AI, yet in my case I think python will not come in handy and may appear to be some kind of cumbersome. So, any ideas?
teal mortar
earnest forge
Hello, everyone! I've come with a question: which programming language is best s...
well in C++ you'll get the best performance, but there is not a lot of material on it
earnest forge
when i was into data science i saw python had implementations of algorithms written in it
even in ai frameworks such as pytorch and tensorflow
teal mortar
well at core, these two frameworks have C++ for performance optimisations
earnest forge
okay, thanks
teal mortar
earnest forge
okay, thanks
you can try this book https://www.amazon.com/Hands-Machine-Learning-end-end-ebook/dp/B0881XCLY8

Hands-On Machine Learning with C++: Build, train, and deploy end-to-end machine learning and deep learning pipelines
have in plan reading it next year
old grove
teal mortar
and high precision if you care more about false positives
precision deals with true positives right ?
teal mortar
old grove
precision deals with true positives right ?
yes > true positives
velvet thorn
precision is basically the ratio of true positives to predicted positives
teal mortar
Precision = TruePositives / (TruePositives + FalsePositives)
Recall = TruePositives / (TruePositives + FalseNegatives)
f1 score is good metric for both
F1 Score = 2 * (Precision * Recall) / (Precision + Recall)
old grove
teal mortar
yes > true positives
Ok so ideally f1-score ?? what should be the value ? lets say fi score comes up to be 80..so can we assume the model is good enough
teal mortar
like I said, depends on the target you want to achieve
but if you want overall bigger area under curve then yes
use f1 score
bigger recall has less false negatives
bigger precision less false positives
f1 score is an equilibrium of both
serene scaffold
velvet thorn
precision is basically the ratio of true positives to predicted positives
I would frame it as "the ratio of predicted positives to all positives"
predicted positives = tp, all positives = tp + fn
well now I'm talking about recall 

velvet thorn
serene scaffold
well now I'm talking about recall <:shrug2:446738505218129941>
precisely
🥴
 low spear
what version of keras should be installed so that it won't have any error when paired with tensorflow 2.5.0?
lapis sequoia
Hello guys. Sorry, just quickly want to understand how to only get the domain name from the link column into a new pandas column in the dataframe, so that I only get for example Medium, Towardsdatascience and so forth rather than the clutter with https and all the nonsense.
domain = url.split(".")
return domain[1]
cols = df2['link']
def apply_cols(df2, cols):
for col in cols:``` serene scaffold
lapis sequoia
Hello guys. Sorry, just quickly want to understand how to only get the domain na...
serene scaffold
lapis sequoia
Hello guys. Sorry, just quickly want to understand how to only get the domain na...
Please share the DataFrame in a way that can be copied and pasted directly (no screenshots). You could, for example, but a few lines of the CSV in the pastebin: https://paste.pythondiscord.com/
lapis sequoia
serene scaffold
Please share the DataFrame in a way that can be copied and pasted directly (no s...
Yes, of course. I have until now just written like this https://paste.pythondiscord.com/zeboyafaxi.py
serene scaffold
lapis sequoia
Yes, of course. I have until now just written like this https://paste.pythondisc...
You have to share the DataFrame in a way that can be copied and pasted directly. This is code.
lapis sequoia
serene scaffold
You have to share the DataFrame in a way that can be copied and pasted directly....
How can I upload a dataframe?
serene scaffold
lapis sequoia
How can I upload a dataframe?
I already told you: #data-science-and-ml message
lapis sequoia
serene scaffold
Please share the DataFrame in a way that can be copied and pasted directly (no s...
Please see revised link https://paste.pythondiscord.com/lexucufece.apache
 weary summit
I have a two dimensional data set.
Let's seperate it to X,Y.
I have computed PCA and have a function f(x,y) which receives the points.
I want to plot the new 'axis' / function over the X-Y axis and don't know how.
What I really want to acheive is to show the original X,Y points and the new axis the PCA has given.
How can I plot that?
serene scaffold
lapis sequoia
Please see revised link https://paste.pythondiscord.com/lexucufece.apache
try that again but with df.head().to_csv() so that nothing gets truncated
lapis sequoia
serene scaffold
try that again but with `df.head().to_csv()` so that nothing gets truncated
serene scaffold
lapis sequoia
https://paste.pythondiscord.com/bavupetewu.yaml
you must have done df.head().to_csv without the () at the end.
lapis sequoia
serene scaffold
you must have done `df.head().to_csv` without the `()` at the end.
If I do that way then it will become a wall of text
Nvm, thanks for your help.
serene scaffold
lapis sequoia
Nvm, thanks for your help.
did you figure it out?
In either case, if you know regular expressions, you can use Series.str.extract
https\:\/{2}(\w+)\.[a-z]+ might work
@lapis sequoia did you figure out how to use str.extract? Not trying to abandon you here.
serene scaffold
 humble nimbus
I'm trying to convert some Pandas code to Pyspark code
humble nimbus
I'm trying to convert some Pandas code to Pyspark code
Your best bet is to show the Pandas code and what PySpark code you've tried so far.
 unkempt monolith
 lapis sequoia
Is there a way to make a neural network predict an array of coordinate points based on some input