#data-science-and-ml
1 messages · Page 354 of 1
 royal crest
 velvet thorn
did you read the documentation?
royal crest
what if it's something like "men's room", because it definitely is not "men is room"
 dense beacon
velvet thorn
did you read the documentation?
dense beacon
velvet thorn
did you read the documentation?
I read the replace documentation, but I couldn't find examples with regular expressions. I will research a little more
velvet thorn
dense beacon
I read the replace documentation, but I couldn't find examples with regular expr...
see the regex argument
regexbool, default True
Determines if the passed-in pattern is a regular expression:

    If True, assumes the passed-in pattern is a regular expression.

    If False, treats the pattern as a literal string
 reef ivy
Good day
I am creating a model for the Scene Classification using my own architecture, and this is the graph of the results. Is it okay like this, or do you have to change some parameters? Please help. Thanks.
 dense beacon
velvet thorn
https://pandas.pydata.org/docs/reference/api/pandas.Series.str.replace.html
dense beacon
velvet thorn
https://pandas.pydata.org/docs/reference/api/pandas.Series.str.replace.html
thanks!!!!
dense beacon
velvet thorn
https://pandas.pydata.org/docs/reference/api/pandas.Series.str.replace.html
I ended up going to another site kkkk
That's why I wasn't thinking
 quiet vault
reef ivy
Good day
I am creating a model for the Scene Classification using my own archit...
quiet vault
reef ivy
Good day
I am creating a model for the Scene Classification using my own archit...
The model does seem to start overfitting
Without seeing the current hyperparameters, I cannot tell whether you need to change anything or not
@reef ivy
 desert oar
the 1st one is more readable so it's better unequivocally imo. also there are issues with the 2nd one if you have duplicate column names or possibly some adverse interaction with multiindex columns
desert oar
reef ivy
Good day
I am creating a model for the Scene Classification using my own archit...
that seems pretty typical, train loss keeps going down while validation loss stays flat or starts increasing (indicating overfitting)
consider "verbose" mode regex. for example (kind of contrived in this case, but it's just an example):
def decontracted(phrase):
    ...
    phrase = re.sub(r"""
        ( (?: s?h | x ) e
          | it
          | who
        ) 's
    """, r"\1 is", phrase, re.I | re.X)
    ...
    return phrase
 rose schooner
what does this picture mean? This is a visualization of the rules using the scikit-fuzzy control system. please help
 desert oar
rose schooner
what does this picture mean? This is a visualization of the rules using the scik...
desert oar
rose schooner
what does this picture mean? This is a visualization of the rules using the scik...
i don't think many people here know what scikit-fuzzy is. you might have to elaborate, link to some docs, etc.
rose schooner
mutasi_rule1 = ctrl.Rule(antecedent=(population['small'] & generation['short']), consequent=prob_mutasi['large'])
mutasi_rule2 = ctrl.Rule(antecedent=(population['medium'] & generation['short']), consequent=prob_mutasi['medium'])
mutasi_rule3 = ctrl.Rule(antecedent=(population['large'] & generation['short']), consequent=prob_mutasi['small'])
mutasi_rule4 = ctrl.Rule(antecedent=(population['small'] & generation['medium']), consequent=prob_mutasi['medium'])
mutasi_rule5 = ctrl.Rule(antecedent=(population['medium'] & generation['medium']), consequent=prob_mutasi['small'])
mutasi_rule6 = ctrl.Rule(antecedent=(population['large'] & generation['medium']), consequent=prob_mutasi['very_small'])
mutasi_rule7 = ctrl.Rule(antecedent=(population['small'] & generation['long']), consequent=prob_mutasi['small'])
mutasi_rule8 = ctrl.Rule(antecedent=(population['medium'] & generation['long']), consequent=prob_mutasi['very_small'])
mutasi_rule9 = ctrl.Rule(antecedent=(population['large'] & generation['long']), consequent=prob_mutasi['very_small'])
mutasi_value = ctrl.ControlSystem([mutasi_rule1, mutasi_rule2, mutasi_rule3, mutasi_rule4, mutasi_rule5, mutasi_rule6, mutasi_rule7, mutasi_rule8, mutasi_rule9])
mutasi_value.view()
hm, good question. there are more than 9 nodes so each node isn't a rule
what do the docs say?
 iron basalt
rose schooner
what does this picture mean? This is a visualization of the rules using the scik...
iron basalt
rose schooner
what does this picture mean? This is a visualization of the rules using the scik...
It's probably a directed graph of the rules. Each edge is an IF-THEN.
desert oar
iron basalt
It's probably a directed graph of the rules. Each edge is an IF-THEN.
you think it's every possible outcome after flowing through the rules graph?
iron basalt
desert oar
you think it's every possible outcome after flowing through the rules graph?
Yeah, I think every node is a variable and the directed edges between them are an IF-THEN relationship.
Multiple incoming means you need both (AND).
Or, well, not exactly.
The left vertex with 4 incoming edges looks like it could be "very_small".
reef ivy
quiet vault
Without seeing the current hyperparameters, I cannot tell whether you need to ch...
I don't know if you have a source for me to read and learn how to avoid overfitting. I also leave you a summary of the model in case you want to check.
 reef ivy
desert oar
that seems pretty typical, train loss keeps going down while validation loss sta...
reef ivy
desert oar
that seems pretty typical, train loss keeps going down while validation loss sta...
I used a dropout value of 0.3 for training the model. I don't know if some data augmentation was needed, I just normalized.
quiet vault
Data Augmentation is recommended
 glass spade
so i am quite new to python so right now i dont know where i have made a mistake, anyone can help me over here?

 misty cypress
glass spade
so i am quite new to python so right now i dont know where i have made a mistake...
misty cypress
glass spade
so i am quite new to python so right now i dont know where i have made a mistake...
Test for equality with ==
 serene scaffold
@glass spade hello, this is not a data science question
 lapis sequoia
I have this question from the paper attention is all you need. I'm trying to learn it but well I'm stupid in certain topics.
Question: the input embeddedings for each word, does our model learn it or we just take those vectors of 512 from some place. So say for 'wicked' we have some data set containing 512 sized vector or we give some random values at the initial stage.
Please ping me when you reply or need more info. Thanks.
 tender hearth
lapis sequoia
I have this question from the paper attention is all you need. I'm trying to lea...
tender hearth
lapis sequoia
I have this question from the paper attention is all you need. I'm trying to lea...
you can have it be learned as part of your model or you can use some pre-trained word embedding
lapis sequoia
tender hearth
you can have it be learned as part of your model or you can use some pre-trained...
I see. So when they say we use learned embeddings they mean they took prelearned from some place right?
I'm putting the same word as they did in paper just to make sure.
tender hearth
It's ambiguous
You'll have to look at their experiments
But it doesn't matter anyway this is not that important for the Transformer
lapis sequoia
makes sense. Alrighty thanks!!
 brittle flower
As far as I understand it, pandas is used to read things like CSV files and turn them into a form that's easy to work with in python right?
So with that said, when should I use Pandas vs something like SQLite?
I'm still new to all this so my apologies if this is a dumb question
tender hearth
brittle flower
As far as I understand it, pandas is used to read things like CSV files and turn...
https://datascience.stackexchange.com/questions/34357/why-do-people-prefer-pandas-to-sql sums up what I have to say
brittle flower
tender hearth
<https://datascience.stackexchange.com/questions/34357/why-do-people-prefer-pand...
Thanks!
 swift oxide
Hi guys
So I am an undergraduate
And want to study data science
are there any valuable free courses available which I should do?
lapis sequoia
swift oxide
are there any valuable free courses available which I should do?
You may check pinned messages of this channel for resources.
swift oxide
thank you
 umbral rapids
hi everyone,
i want ask something about chatterbot, anyone can help me? or which chatroom i can talk about it?
 tough bolt
https://forums.developer.nvidia.com/t/i-need-help-running-the-nvoftracker-sample/195391
Does anyone of you possibly know the answer to my question here?
OpenCV seems to not be found

NVIDIA Developer Forums
I am trying to run the NvOFTracker Sample provided with the NvOFT SDK. I have installed the dependencies from the ReadMe and compiled the project using cmake following the instructions. Cmake had no problem compiling, but when opening the project Below is a screenshot of the errors I am getting when building the “INSTALL” project from the NVO...
 vast ridge
Hi, I'm just getting started with DNN but I'm having trouble developing an intuition for what kinds of problems I'll be able to solve (in a reasonable amount of time) on my hardware. I have a single RTX 3090. Would I be able to train a model on the MNIST handwritten digits dataset? Would I be able to do an image classifier like Hot Dog / Not Hot Dog? Is there some kind of rule of thumb I can use to determine what I could reasonably expect to do with my machine?
serene scaffold
vast ridge
Hi, I'm just getting started with DNN but I'm having trouble developing an intui...
the top answer goes over that sort of thing. However there's no rule of thumb that I know of: you can calculate how much memory your algorithm will take based on its architecture. https://www.quora.com/How-much-GPU-memory-do-I-need-for-training-neural-nets-using-CUDA
 rigid zodiac
Hi, that way give me the same shape (5032,2) instead of (5032,10)
vast ridge
@serene scaffold Thanks
tough bolt
tough bolt
https://forums.developer.nvidia.com/t/i-need-help-running-the-nvoftracker-sample...
I mean, how do I check if OpenCV is successfully installed on my machine?
I've set a path variable to it's bin folder

but beyond that - how do I know if it works?
serene scaffold
rigid zodiac
Hi, that way give me the same shape (5032,2) instead of (5032,10)
It worked when I did it.
In [6]: {i: np.random.random((4, 5)) for i in range(3)}
Out[6]:
{0: array([[0.91913774, 0.71353068, 0.56942474, 0.98381137, 0.56272452],
        [0.36382881, 0.13909369, 0.42216599, 0.61908678, 0.14025616],
        [0.78495386, 0.47651101, 0.74226828, 0.50331094, 0.47046735],
        [0.32812879, 0.182404  , 0.06890785, 0.0017023 , 0.8786275 ]]),
 1: array([[0.908052  , 0.88506795, 0.73072904, 0.49743972, 0.30238189],
        [0.24826409, 0.64773087, 0.92844733, 0.44376607, 0.93255118],
        [0.35608897, 0.12204277, 0.02212306, 0.21138171, 0.09416699],
        [0.40889931, 0.95413059, 0.63739048, 0.15812703, 0.57536725]]),
 2: array([[0.13681117, 0.45421894, 0.33326889, 0.32885797, 0.25749207],
        [0.4799509 , 0.22633532, 0.9028686 , 0.76263384, 0.44751801],
        [0.18326051, 0.77245997, 0.20170911, 0.73836005, 0.86353963],
        [0.18084389, 0.08583771, 0.26749453, 0.57455304, 0.12993736]])}

In [7]: dicty = _

In [8]: np.array(list(dicty.values()))
Out[8]:
array([[[0.91913774, 0.71353068, 0.56942474, 0.98381137, 0.56272452],
        [0.36382881, 0.13909369, 0.42216599, 0.61908678, 0.14025616],
        [0.78495386, 0.47651101, 0.74226828, 0.50331094, 0.47046735],
        [0.32812879, 0.182404  , 0.06890785, 0.0017023 , 0.8786275 ]],

       [[0.908052  , 0.88506795, 0.73072904, 0.49743972, 0.30238189],
        [0.24826409, 0.64773087, 0.92844733, 0.44376607, 0.93255118],
        [0.35608897, 0.12204277, 0.02212306, 0.21138171, 0.09416699],
        [0.40889931, 0.95413059, 0.63739048, 0.15812703, 0.57536725]],

       [[0.13681117, 0.45421894, 0.33326889, 0.32885797, 0.25749207],
        [0.4799509 , 0.22633532, 0.9028686 , 0.76263384, 0.44751801],
        [0.18326051, 0.77245997, 0.20170911, 0.73836005, 0.86353963],
        [0.18084389, 0.08583771, 0.26749453, 0.57455304, 0.12993736]]])

In [9]: _.shape
Out[9]: (3, 4, 5)
can you do it with like 100 array? cause may be because of the amount of it causing problem
serene scaffold
rigid zodiac
can you do it with like 100 array? cause may be because of the amount of it caus...
That is not the cause of the problem.
if array behavior changed unpredictably as the size of the array increases, the whole system would be completely useless.
rigid zodiac
serene scaffold
if array behavior changed unpredictably as the size of the array increases, the ...
this is what I have after combine all of it

It just weird because when I do that with 3 files and it works with np.concatenate
serene scaffold
rigid zodiac
this is what I have after combine all of it
can you un-comment the print statement and paste the whole thing that gets printed into the chat as text?
(it must be text--I won't read it as a screenshot)
desert oar
what are the shapes of the input arrays?
serene scaffold
desert oar
what are the shapes of the _input_ arrays?
that's what the print statement tells us. Last time they were all (69, 10) that I could see, but the screenshot was cut off.
rigid zodiac
desert oar
what are the shapes of the _input_ arrays?
shape for each npy file is (69,10)
desert oar
i assume that one of the arrays has the wrong shape, so the resulting array is a 1-dimensional array of dtype 'object', where each element is another array
serene scaffold
rigid zodiac
shape for each npy file is (69,10)
we need to be sure of that beyond any shadow of a doubt, so please copy and paste the result of the print statement into the chat
 arctic wedgeBOT
Hey @rigid zodiac!
Uh-oh! It looks like your message got zapped by our spam filter. We currently don't allow .txt attachments, so here are some tips to help you travel safely:
• If you attempted to send a message longer than 2000 characters, try shortening your message to fit within the character limit or use a pasting service (see below)
• If you tried to show someone your code, you can use codeblocks
(run !code-blocks in #bot-commands for more information) or use a pasting service like:
serene scaffold
rigid zodiac
serene scaffold
https://paste.pythondiscord.com/
https://paste.pythondiscord.com/wanofuhiji.yaml
this is the message when I run that
desert oar
yep i called it
"ragged nested sequence"
so the problem is that one of your npy files has the wrong shape
use np.concatenate or np.stack as required, but check the shape of each array and do whatever you need to do if the shape is wrong
serene scaffold
np.array((arr for arr in dicty.values() if arr.shape == (69, 10)) would filter out those that are the wrong shape
desert oar
(i'd still recommend concatenate or stack)
serene scaffold
but you probably need to figure out why you ended up with arrays of the wrong shape to begin with
serene scaffold
desert oar
(i'd still recommend `concatenate` or `stack`)
mamamamama
rigid zodiac
serene scaffold
`np.array((arr for arr in dicty.values() if arr.shape == (69, 10))` would filter...
this is the error I have
 rigid zodiac
So this is what I should have in my code right
import glob
import numpy as np

numpy_vars = {
    np_name: np.load(np_name)
    for np_name in glob.glob('/content/drive/MyDrive/Huy_2/data_v7/TrainTestVal/train/Fall/*.npy')
}
print([arr.shape for arr in numpy_vars.values()])

d = np.array((arr for arr in numpy_vars.values() if arr.shape == (69, 10)))
you can remove the print statement now, but try it and see
rigid zodiac
serene scaffold
you can remove the print statement now, but try it and see
when I tried to print its chape and the array, this is what I have () <generator object <genexpr> at 0x7ff75f787650>
serene scaffold
rigid zodiac
when I tried to print its chape and the array, this is what I have ```()
<genera...
I guess you have to do np.array([arr for arr in numpy_vars.values() if arr.shape == (69, 10)])
keep in mind that we still have the upstream problem of your Fall directory having invalid data in it.
rigid zodiac
serene scaffold
I guess you have to do `np.array([arr for arr in numpy_vars.values() if arr.shap...
holy shit, it work
[[[ 4.00000000e+00  8.74386072e-01  1.50802922e+00 ...  1.84121192e-01
   -1.01648159e-02 -4.85714495e-01]
  [ 4.00000000e+00  8.79931092e-01  1.50638187e+00 ...  3.68044764e-01
   -4.09859121e-02 -5.02487361e-01]
  [ 4.00000000e+00 -2.71962792e-01  2.49074984e+00 ...  0.00000000e+00
    0.00000000e+00  0.00000000e+00]
...```you are life saver man
so for short if I combine more than 3files of npy, I need to inclue the condition of its shape
serene scaffold
rigid zodiac
so for short if I combine more than 3files of npy, I need to inclue the conditio...
no, that's not the reason
if you concatenate multiple arrays, which is what we're doing here, they all need to be the same shape
and for some reason, even though most of the arrays in your .npy files have the shape (69, 10), some of them don't
and I don't know why that is. it will be your job to figure that out


 serene scaffold
@glass spade can you be more specific? It is not likely that anyone will want to look at these screenshots and try to infer what the problem is.
desert oar
rigid zodiac
so for short if I combine more than 3files of npy, I need to inclue the conditio...
!e ```python
import numpy as np
arrs = [
np.array([[11,12,13], [14,15,16]]),
np.array([[21,22], [24,25,26]]),
np.array([[31,32,33], [34,35,36]]),
]
print(np.stack(arrs))
@desert oar :x: Your eval job has completed with return code 1.
001 | <string>:5: VisibleDeprecationWarning: Creating an ndarray from ragged nested sequences (which is a list-or-tuple of lists-or-tuples-or ndarrays with different lengths or shapes) is deprecated. If you meant to do this, you must specify 'dtype=object' when creating the ndarray.
002 | Traceback (most recent call last):
003 |   File "<string>", line 9, in <module>
004 |   File "<__array_function__ internals>", line 5, in stack
005 |   File "/snekbox/user_base/lib/python3.10/site-packages/numpy/core/shape_base.py", line 426, in stack
006 |     raise ValueError('all input arrays must have the same shape')
007 | ValueError: all input arrays must have the same shape
does that warning look familiar?
rigid zodiac
desert oar
does that warning look familiar?
Not really it is my first time. Are you trying to do the same thing as I did
 sleek fjord
anyone worked with tkinter?
 limpid hollow
Hi guys, I'm trying to set up manually the weights of my dataframe's columns for a KNeighborsClassifier model, but I don't understand the documentation, it's asking for custom function.
It's written:
[callable] : a user-defined function which accepts an array of distances, and returns an array of the same shape containing the weights
The following doesn't work for the four columns in my df:
return [1, 2, 1, 1]``` regal ingot
can i ask a question related to bayes theorem stuff
sleek fjord
quiet vault
and wrong channel
which channel?
 serene scaffold
@regal ingot it means "the probably that an object with a certain class has a value of x for a certain feature is proportional to <that equation>"
regal ingot
what does the symbol that looks like a open infinity mean
serene scaffold
Keep in mind that I'm not using the terms "object" and "class" in the oop sense.
regal ingot
class is like classification
serene scaffold
regal ingot
what does the symbol that looks like a open infinity mean
Good question. That is the "is proportional to" symbol.
regal ingot
i followed the lectures but now im doing the assignment and im super confused
serene scaffold
Being confused is normal when you're taking a technical course.
regal ingot
yeah i didn't reaalize the level of stats in intro to AI
serene scaffold
It's all stats. Always has been 🔫 🧑🚀
(well, and probability, and linalg, and a few other things.)
sleek fjord
which is the channel to ask doubts related to GUI, tkinter?
 echo thorn
# How I do it now
V = [0 if (i + 1) % N == 0 else 1 for i in range(N ** 3 - 1)]

# How I want to do it
V = np.ones(N ** 3)
V[(i + 1) % N == 0] = 0```mmh
echo thorn
Im now making a list using list comprehension but I want to use numpy
because N is typically pretty large
If I use something like V[(V + 1) % N == 0] = 0 it looks at the value of V
regal ingot
i learned numpy of yt last night
echo thorn
but I want it to look at the index
 tidal bough
echo thorn
```import numpy as np
# How I do it now
V = [0 if (i + 1) % N == 0 else 1 for i...
tidal bough
echo thorn
```import numpy as np
# How I do it now
V = [0 if (i + 1) % N == 0 else 1 for i...
use something like
V = np.arange(N**3)
V = ((V+1)%N != 0)
you can do ((V + 1) % N != 0).astype(int), possibly? not sure if it's the same for numpy as for pandas.
tidal bough
Yeah, you can do .astype(uint8) and it'll even be a free conversion
sleek fjord
regal ingot
what do the sigma and mean in this represent
i think mu is mean and sigma is variance
echo thorn
sigma is how flat mu is where
quiet vault
sleek fjord
which is the channel to ask doubts related to GUI, tkinter?
Maybe #user-interfaces
 thorn canopy
hello! i am getting an 403 POST /api/shutdown (::1): '_xsrf' argument missing from POST when using jupyter notebook stop.. what is _xsrf and where can I provide it?
 serene scaffold
@regal ingot you want to turn the right part into a function, yes?
 mild elk
regal ingot
how do i make this into a python function
mild elk
regal ingot
how do i make this into a python function
are u going to substitute x with a numpy array
when u code it
regal ingot
no x is gonna a value
mild elk
oh like int value
regal ingot
float
mild elk
yea and how about sigma and mu
if mu and sigma are just other floats that you are inputting as parameters it is pretty easy
am i right?
mild elk
ok first separate the constant from the exponential term
the constant is 1/sqrt(2pisigma^2)
regal ingot
k
i never made a equation into a function so do i make a bunch of variables to hold things
 dense ice
I have a question connected to accuracy of a CNN model. What more benefits a model, having more regular data (dataset with a lot of images) than augmented data or the opposite ?
lapis sequoia
ok so
i have this documentation i tried everything writing it but can anyobody write me it together pls https://docs.microsoft.com/en-us/azure/cognitive-services/speech-service/get-started-text-to-speech?tabs=script%2Cwindowsinstall&pivots=programming-language-python

Learn how to use the Speech SDK to convert text-to-speech. In this quickstart, you learn about object construction and design patterns, supported audio output formats, the Speech CLI, and custom configuration options for speech synthesis.
is about text to speech
 cobalt jetty
regal ingot
how do i make this into a python function
cobalt jetty
regal ingot
how do i make this into a python function
from scipy.stats import norm iirc.
This is the standard Gaussian likelihood function. If you want to code it from scratch, you can lift pandas or numpy's broadcasting behavior.
cobalt jetty
regal ingot
anyone familar on bayes theorem i got a question
you can ask, i might be able to help.
regal ingot
k so here's the thing
i get a cvs file of 0s and 1s that's an image of a letter. the 1s equate black pixels. 0s are white.
i have 3 features: proportion of black pixels in the image, propoirt of black pixels in top half of the image, and in the left half of the
image
im supposed to find out the most likely letter the image is
so im using a naives bayes classfier
 wooden forge
Hello, quick question about csv files and pandas and numpy. I have a csv file containing dates and int in {0,1}. Basically 1 means that an event occurs and 0 that it doesn't. I would like to transform that csv into a numpy array and then plot my datas. Maybe I could create two arrays from that because I think numpy doesn't allow different type inside the same array (?), so how could I do that ? For the moment I have a Pandas object that is kinda weird (size=(365,1)) so I can't really use it, or can I ?
regal ingot
I got 5 classes: A, B, C, D, E
I got 3 features: proportion of black pixels in image, proportion of black pixel in top half of image, and proportion of black pixels in left half of image. aka probBlack, topProp, and leftProp.
I was given an equation that gives me P(feature = x | class) so i can find that out for each feature.
i was also given the prior porbablity of each class.
how do i find the most likely class for the image.
im so close yet so far
 stark zenith
Pandas question - I have one column of categorical data and another column of unique entries, how would I go setting the df so that I have one line for each category and all of the unique entries concatenated into single cells under their categories?
serene scaffold
stark zenith
Pandas question - I have one column of categorical data and another column of un...
Take a look at this: https://stackoverflow.com/questions/20109391/how-to-make-good-reproducible-pandas-examples

Stack Overflow
Having spent a decent amount of time watching both the r and pandas tags on SO, the impression that I get is that pandas questions are less likely to contain reproducible data. This is something th...
stark zenith
serene scaffold
Take a look at this: https://stackoverflow.com/questions/20109391/how-to-make-go...
I was hoping to get lucky, I'll make an example later when I'm on desktop.
serene scaffold
stark zenith
I was hoping to get lucky, I'll make an example later when I'm on desktop.
Thanks!
stark zenith
serene scaffold
Thanks!
No, thank you! This is a great guide.
regal ingot
𝜇 = 0.38, 𝜎 = 0.06 x = 0.3416666666666667
 wooden forge
Hello, quick question about **csv files and pandas and numpy**. I have a csv fil...
wooden forge
wooden forge
Hello, quick question about **csv files and pandas and numpy**. I have a csv fil...
Sorry for the ping @serene scaffold but you seem very knowledgable, would you have an answer to this question?
serene scaffold
wooden forge
Hello, quick question about **csv files and pandas and numpy**. I have a csv fil...
if you have a pandas object, you just have to do .to_numpy() and then it's an array.
wooden forge
yeah but there is only one column (?)

The size is (365,1) and I'd like it to be (365,2)
wooden forge
series = read_csv('PeriodsTime.csv', dtype={'Days':np.datetime64, 'Periods':int}) this is how I extract the datas
serene scaffold
wooden forge
```series = read_csv('PeriodsTime.csv', dtype={'Days':np.datetime64, 'Periods':i...
you also need sep=';', in there
wooden forge
lemme try ^^
TypeError: the dtype datetime64 is not supported for parsing, pass this column using parse_dates instead
wh-
serene scaffold
just delete the whole dtype= part for now
you can use
!docs pandas.to_datetime
arctic wedgeBOT
pandas.to_datetime(arg, errors='raise', dayfirst=False, yearfirst=False, utc=None, format=None, exact=True, unit=None, infer_datetime_format=False, origin='unix', cache=True)```
Convert argument to datetime.there is no way, I love you
regal ingot
u got that tingle when u get shit right huh
wooden forge
Yes, solving problems is an amazing feeling
cobalt jetty
regal ingot
I got 5 classes: A, B, C, D, E
I got 3 features: proportion of black pixels in i...
ProbBlack, TopProp, and LeftProp are your priors. You want to express something like: P(X|C) = P(C|X)*P(X)/P(C). If you consider the probability to see different classes as uniform, you can remove the denominator and assume P(X|C) is proportional to P(C|X)*P(X). You already have your priors. You can use the probability chain rule to try and define the likelihood of seeing a class given the probability to see the behavior in one of the image quadrant.
wooden forge
Well thanks a lot Stelercus, have a good day/noon/night !
cobalt jetty

Mathematics Stack Exchange
I am wondering how I would apply Bayes rule to expand an expression with multiple variables on either side of the conditioning bar.
In another forum post, for example, I read that you could expand...
this should help.
serene scaffold
@stark zenith I'll probably be here for another two hours or so, just FYI
regal ingot
regal ingot
𝜇 = 0.38, 𝜎 = 0.06 x = 0.3416666666666667
return (1 // (np.sqrt(2 * 0.06 * (0.06 ** 2)))) * (np.exp(-.5 * ((a - 0.38)/0.06) ** 2))
so i tried making my equation into a function
but my answer is off
serene scaffold
regal ingot
```py
return (1 // (np.sqrt(2 * 0.06 * (0.06 ** 2)))) * (np.exp(-.5 * ((a - 0.38...
use backticks so asterisks don't turn into bold
wooden forge
hi it's me again, just a question about matplotlib. I'd like to reduce to number of ticks or simply say that I only want the month of a certain amount of days on the xlabel, how could I do that?
 regal ingot
i feel like im getting closer to getting the first half of my assignment 🙂
does anyone mind plugging these in and seeing if they got 6.06:
𝜇 = 0.38, 𝜎 = 0.06 x = 0.3416666666666667
 serene scaffold
regal ingot
does anyone mind plugging these in and seeing if they got 6.06:
𝜇 = 0.38, 𝜎 = ...
serene scaffold
regal ingot
does anyone mind plugging these in and seeing if they got 6.06:
𝜇 = 0.38, 𝜎 = ...
what about x
oh sorry. one moment
regal ingot
my prof said it's a abuse of notation what does that mean
serene scaffold
regal ingot
does anyone mind plugging these in and seeing if they got 6.06:
𝜇 = 0.38, 𝜎 = ...
!e
import numpy as np

m, s, x = .38, .06, 0.3416666666666667
frac = 1 / np.sqrt(2 * np.pi * (s ** 2))
power = -.5 * ((x - m) / s) ** 2
print(frac * np.e * power)
@serene scaffold :white_check_mark: Your eval job has completed with return code 0.
-3.688705405740556
It's like 0! = 1, probably something that isn't really good to write but it's not that bothering after all
just like a convention
but having a probability higher than 1 is indeed weird
regal ingot
oh P*feature = class | x) is a densitiy function
but yeah my prof said it's should still be used even if it's 1> x
wooden forge
wooden forge
hi it's me again, just a question about matplotlib. I'd like to reduce to number...
Found it ! The code is :
plt.xticks(x, x, rotation=45)
plt.locator_params(axis='x', nbins=len(x)/12)
``` if anyone wants to know regal ingot
it should be between 0 and 1 in the end though
limpid hollow
Also, use ha='right' in plt.xticks
cobalt jetty
cobalt jetty
this is a PDF, you shouldn't get a value above 1.
retracting my statement here. I'm tired. You can have a pdf value above 1 on small intervals so that the whole PDF integrates to 1.
cobalt jetty
regal ingot
it should be between 0 and 1 in the end though
!e
from scipy.stats import norm
norm.pdf(x=0.3416, loc=0.38, scale=0.06)```welp. it gives this: 5.4177044014013696
regal ingot
this is killing me
serene scaffold
regal ingot
this is killing me
 regal ingot
ithink 5.4
is the right naswer
ive done this equation 100000 times
i know the left half makes 6.649
holly pooooop
i got the same answer using both u guys functions
regal ingot
k need some more help
so i got the p(feature = x | classs) for each feature
i got the P(class) : prior porbability
how do i check the probability the isntance is class A
i have P(x1 | A), p(x2 | A),
P(x3|A)
i got P(A) - prior probability
regal ingot
anyone on i'm stuck
regal ingot
how do i get the most likely when i have more than 1 feature?
 odd meteor
regal ingot
i dont understandd that equation
odd meteor
regal ingot
i dont understandd that equation
This is the probability density function of a normal distribution a.k.a PDF in Statistics.
So basically it is telling you that f(x) of a Conditional Probability (a.k.a Bayesian Theorem) follows a normal distribution.
odd meteor
regal ingot
what do the sigma and mean in this represent
The M symbol kinda pronounced as (Me-U) is the population mean and sigma = Standard Deviation.
regal ingot
so how do i get the most likely now
serene scaffold
odd meteor
The M symbol kinda pronounced as (Me-U) is the population mean and sigma = Stand...
I just say it as "moo". 🐮
odd meteor
serene scaffold
I just say it as "moo". 🐮
😅😅
regal ingot
im so tired
odd meteor
regal ingot
how do i get the most likely when i have more than 1 feature?
I'm not sure I understand your question. Elucidate more?
regal ingot
alright so here's the information i have
There are 5 classes: A,B,C,D,E
I have a cvs file of 0s and 1s that is shapped like on of these letters
i have three features: porpotion of black pixels(1's) in the file, proportion of black pixels in the top half of the file, and proportion of black pixels on the left half of the file
i plugged those values and the sigma/ MU for each one into the population desity equation and got those answers
i also of the prior probability of the classes
how do i find the most likely class for the file
desert oar
rigid zodiac
Not really it is my first time. Are you trying to do the same thing as I did
hint: it was in the output that you posted
i am demonstrating the source of the problem you encountered
odd meteor
regal ingot
i plugged those values and the sigma/ MU for each one into the population desity...
What exactly are you trying to compute? The conditional probability or the pdf of your data distribution?
The two are different things altogether.
regal ingot
im supposed to use naive baysian classfier to find the most likely class my file is
sorry man im really lost
odd meteor
regal ingot
im supposed to use naive baysian classfier to find the most likely class my file...
You should just focus on the 1st one then. Calculating the conditional probability 😅. So if you're not mandated to code the conditional probability from scratch, you can use sklearn to easily do this
regal ingot
idk how to use sklearn
arctic wedgeBOT
Hey @regal ingot!
It looks like you tried to attach file type(s) that we do not allow (.pdf). We currently allow the following file types: .gif, .jpg, .jpeg, .mov, .mp4, .mpg, .png, .mp3, .wav, .ogg, .webm, .webp, .flac, .m4a.
Feel free to ask in #community-meta if you think this is a mistake.
regal ingot
emyrs so how would i do conditional probility
if i have the P(x1|A), p(x2|A), P(x2|A) and P(A)
P(a) is the prior probability
odd meteor
regal ingot
idk how to use sklearn
To calculate conditional probability in a classification problem like yours, you could either use MultinomialNB or GaussianNB
(Try to read up the distinction and difference between the two Naive Bayes algorithms)
from sklearn.naive_bayes import GaussianNB
model = GaussianNB()
model.fit(features,label)
#Then do the prediction
Since you said you don't know how to use Sklearn, I'd presume you're relatively new to Machine Learning. You might wanna take a Udemy or Kaggle course if you are new new to ML. It'll help you understand better

 odd meteor
regal ingot
if i have the P(x1|A), p(x2|A), P(x2|A) and P(A)
odd meteor
regal ingot
if i have the P(x1|A), p(x2|A), P(x2|A) and P(A)
Again, are you sure you not asked to manually calculate the conditional probability? Since you already know the probability.
Were you given the probabilities already?
odd meteor
Since this is an assignment I'm not at liberty to directly assist you in solving the problem but I can try to define the conditional probability concept with another example.
regal ingot
that's fair, i feel like i have the needed values
im just wondering how do i plug them in
to gut my answer
odd meteor
regal ingot
i guess we should manually do it
Yes, you're expected to calculate it manually. You don't need sklearn for that
regal ingot
@odd meteor do you mind if step by step tell you what i did
and can you tell me where i went wrong
Step 1: make loop that calculates the Proportions.
step 2: get the sigma and mu values from the document aswell each proportion and plug them into the equation i.e.
prop_first = norm.pdf(x=a, loc=0.43, scale=0.12)
- now i have probablties of each proportin given each class. i.e P(proportionBlack | A)
now what
i still have the prior probability of each class
i tried doing argmax(x1|a) * p(a)
and it didn't really give me values i wanted
Any ideas
odd meteor
regal ingot
that's fair, i feel like i have the needed values
Brief Explanation on Bayesian Statistics
Bayesian Statistics a.k.a Conditional Probability is simply a statistical method of using new evidence to iteratively update our preconceived belief/notion about a given outcome/event.
P(A|B) = P(B|A)P(A) / P(B)
You can read the above formula of Baye's Theorem as:
The probability of A given that B has happend = The Probability of B given that A has happened divided by the probability of B.
P(A) = this is the initial hypothesis about the event. This is also called the 'prior'
P(B) = The marginal likelihood ; that is, the probability of observing a new event. This is also called the 'posterior'
P(A|B) = The likelihood which is the probability of observing the evidence given the event we're interested in.
Further Explanation With Example
I'm not good at explaining things but let me try with this example.
-
Now imagine 5% of people in your class have Ebola virus (this is simply our P(A) i.e our 'Prior' because we have no evidence)
-
10% of people in your class are unfortunately already predisposed to contract this Ebola virus because of their genetic traits (P(B))
-
20% of people with Ebola virus in your class are genetically predisposed. (This is our P(B|A))
Now we want to calculate P(A|B), which translates to the probability that a person in your class has Ebola virus given that the person is genetically predisposed.
/Recall being genetically predisposed to Ebola virus doesn't mean the person already has the virus. It simply means that those people that are predisposed are more susceptible to contracting Ebola virus than other people in your class simply because their gene has been confirmed to be more vulnerable./
Doing the Calculations
P(A|B) = (20% * 5%) /10%
Ans = 0.1
odd meteor
regal ingot
but i have more than 1 feature
Once you understand the logic you should be able to get it for the 3 features respectively. You'll get 3 answers one for each conditional probability you wanna calculate
 odd meteor
regal ingot
odd meteor
regal ingot
Remove f2 and f3. Concentrate on f1. Get the conditional probability, then do the same for f2 and f3.
You'll get 3 probabilities one for each f
regal ingot
also it's confusing since my professor stated that my P(F1 |A) can be higher than 1
odd meteor
I'm about to crash now. It's 1:16 am here. You can get more clarity from online sources. Try to look at examples to understand it more clearly.
regal ingot
alright emyrs
thanks man
5.42155501469245, 3.2281537396969444, 4.428172811878681 so ill just plug these into the equation
conditional probability
odd meteor
regal ingot
also it's confusing since my professor stated that my P(F1 |A) can be higher tha...
If it's more than 1 then it's definitely not a probability anymore. Ask for more clarity from your professor if you can.
regal ingot
he said this
 hollow sentinel
from sklearn.linear_model import LogisticRegression
logmodel = LogisticRegression()
logmodel.fit(X_train,y_train)
predictions = logmodel.predict(X_test)
/Users/rahuldas/opt/anaconda3/lib/python3.7/site-packages/sklearn/linear_model/_logistic.py:940: ConvergenceWarning: lbfgs failed to converge (status=1):
STOP: TOTAL NO. of ITERATIONS REACHED LIMIT.
Increase the number of iterations (max_iter) or scale the data as shown in:
https://scikit-learn.org/stable/modules/preprocessing.html
Please also refer to the documentation for alternative solver options:
https://scikit-learn.org/stable/modules/linear_model.html#logistic-regression
extra_warning_msg=_LOGISTIC_SOLVER_CONVERGENCE_MSG)
scikit-learn
The sklearn.preprocessing package provides several common utility functions and transformer classes to change raw feature vectors into a representation that is more suitable for the downstream esti...
scikit-learn
The following are a set of methods intended for regression in which the target value is expected to be a linear combination of the features. In mathematical notation, if\hat{y} is the predicted val...
uh
what does this mean
 fresh kraken
odd meteor
Since you said you don't know how to use Sklearn, I'd presume you're relatively ...
fresh kraken
odd meteor
Since you said you don't know how to use Sklearn, I'd presume you're relatively ...
bro, plz suggest some course , i really am confused about which courses should be taken or not there are so many , i need some kind ofcurriculum to be a machine learnign engineer , plz dm me if you can
velvet thorn
hollow sentinel
what does this mean
hm
which part do you find impenetrable
it explains exactly what happened and suggests two things you acn do
swift oxide
fresh kraken
bro, plz suggest some course , i really am confused about which courses should b...
hi, can you send me too
odd meteor
fresh kraken
bro, plz suggest some course , i really am confused about which courses should b...
First thing first, please do check the pinned message.
I understand 😀 I've been there before. There are plethora of resources readily available online and this kinda seems to make some beginners so confused.
I'll only advise, you don't jump from one course to the other 'cos it's gon make you more confused and worst of all make you seem like you aren't making proper progress.
Try to focus on using one material/resources to learn. If you must jump from one material to the other, endeavour to at least finish the previous material before using another one.
With that being said..... I believe there are 3 ways to get started in Data Science.
- Apply for Graduate School
- Enroll in a Data Science Bootcamp
- Use an Online Material to learn. (Udemy, YouTube, Coursera, DataQuest, DataCamp, Kaggle) etc
Oh, if you're interested using #3 to learn, please feel free to check different materials before settling for one. There ain't no shame in dropping any material that doesn't work for you. I started with Andrew Ng's ML course on Coursera, I didn't really find it fun coding in Octave, so I dropped it and moved to Udemy.
We can discuss further on what works best for you via DM.
lapis sequoia
So I watched 3B1B's series again and I'm confused about a thing
When he presents backpropagation I don't see any changes to the bias(es)
Only to the weights while going backwards
Where are the biases changed?
fresh kraken
odd meteor
First thing first, please do check the pinned message.
I understand 😀 I've be...
Thank you @odd meteor for taking your time and answering this, this is really helpful , and i am looking at the pinned message
 fossil karma

 hollow sentinel
velvet thorn
it explains exactly what happened and suggests two things you acn do
hollow sentinel
velvet thorn
it explains exactly what happened and suggests two things you acn do
I’ll take another look today
 hardy berry
how can i assign unique number to a word, for eg:
I am god
"4, 7, 9"
You love god
"6, 8, 9"
"I love god"
"4, 8, 9"
but on a much larger scale, i've tried a couple of libraries like spacy and nltk but cant seem to find the right function
this is NLP
lapis sequoia
hardy berry
how can i assign unique number to a word, for eg:
I am god
"4, 7, 9"
You love g...
For smaller scale you can assign each number to chars like 1 2 4 8.... and just assign them.
And just sum them up.
Tbh that's how permissions are unique. 1 2 4.
And sum of them are unique too.
hardy berry
yeah but i'm doing this on a larger scale, i have a csv file with sentences that im gonna tokenize and then assign numbers to each of those words to run through a machine learning algorithm (i think ima use decision tree)
 vast isle
I need to delete the data in the log.txt file how do I do it?
lapis sequoia
vast isle
I need to delete the data in the log.txt file how do I do it?
Just write nothing and close it?
lapis sequoia
vast isle
I need to delete the data in the log.txt file how do I do it?
Also this does not belong to #data-science-and-ml btw imo.
hardy berry
hardy berry
yeah but i'm doing this on a larger scale, i have a csv file with sentences that...
@lapis sequoia can you help me out here? recommend a library or a function in a specific library? you seem to know your stuff
lapis sequoia
I'm thinking.
hardy berry
cool cool lmk when you find something
vast isle
lapis sequoia
Just write nothing and close it?
no dude it's not like that, i need to do this in python for my project
lapis sequoia
vast isle
no dude it's not like that, i need to do this in python for my project
That's what i said. Open file in write mode in python. Do nothing. Close it.
vast isle
lapis sequoia
Also this does not belong to <#366673247892275221> btw imo.
im sorry
lapis sequoia
hardy berry
<@456226577798135808> can you help me out here? recommend a library or a functio...
Will you require mapping in the task or just at the end?
hardy berry
lapis sequoia
Will you require mapping in the task or just at the end?
yeah so the output will be as numbers and i wanna map it back
lapis sequoia
Only once right?
hardy berry
so the feature set (the sentences) will be coverted into the numbers through NLP so that decisiontreeclassifer can understand it
then when i get the output from decisiontreeclassifier, it should map it back to the words
and ofcourse the input from the user will be converted into numbers
and ofcourse the input from the user will be converted into numbers
vast isle
lapis sequoia
That's what i said. Open file in write mode in python. Do nothing. Close it.
Would you help me if I send my project to you?
odd meteor
hardy berry
how can i assign unique number to a word, for eg:
I am god
"4, 7, 9"
You love g...
Why do you wanna manually map each tokens? NLTK or spaCy can handle that with ease
lapis sequoia
odd meteor
Why do you wanna manually map each tokens? NLTK or spaCy can handle that with ea...
Well yeah they asked about library.
lapis sequoia
vast isle
Would you help me if I send my project to you?
If i am free and open to helping on the time i may help in this server. You can ask in help channels. And other helpers may help too. But imo i already gave you enough answer.
hardy berry
odd meteor
Why do you wanna manually map each tokens? NLTK or spaCy can handle that with ea...
that's possible?
odd meteor
hardy berry
that's possible?
With Gensim yes
hardy berry
im kinda new to NLP, i wanted to do decisiontreeclassifier which im familiar with and I realized it can't handle words
so i'm like lets dabble in NLP
hardy berry
odd meteor
With Gensim yes
can you guide me through that process?
vast isle
lapis sequoia
If i am free and open to helping on the time i may help `in this server`. You ca...
I'm just starting out so I don't understand how to do it but thank you for your help
odd meteor
hardy berry
can you guide me through that process?
Okay cool. I'm on a lunch break. Give me a few minutes
hardy berry
odd meteor
Okay cool. I'm on a lunch break. Give me a few minutes
yeah sure sure
lapis sequoia
vast isle
I'm just starting out so I don't understand how to do it but thank you for your ...
Start with searching for how to read and write a file in python. You'll get to somewhere from there.
I'm in a bus rn so writing code is hell for me.
vast isle
lapis sequoia
Start with searching for how to read and write a file in python. You'll get to s...
thank you dude
 stark kiln
So, if I have the following code:
word = input("Enter a word: ")
And I have a words.txt file with the following:
Change
Charge
Chain
Chuckle
and for the input() I enter "Chayyyddd".
How to make do I make it so that it looks at the first three letters c, h and a, and look through the .txt file so that it looks for words beginning with cha and outputs That word was not found. Perhaps you meant "Change" or "Charge" or "Chain"?
or something like that?
serene scaffold
stark kiln
So, if I have the following code:
```py
word = input("Enter a word: ")
```
And I...
is this a data science question?
stark kiln
serene scaffold
is this a data science question?
Uhhh...I don't really know. I'm coding an AI
hardy berry
Pretty sure his problem is NLP
serene scaffold
stark kiln
Uhhh...I don't really know. I'm coding an AI
Try using an individual help channel. See #❓|how-to-get-help
stark kiln
ok
serene scaffold
hardy berry
Pretty sure his problem is NLP
not really
odd meteor
hardy berry
can you guide me through that process?
There are many ways to approach this actually. You could use Gensim, or CountVectorizer, or TfidfVectorizer.
stark kiln
Ok, I did it
hardy berry
odd meteor
There are many ways to approach this actually. You could use Gensim, or CountVec...
I need a few things:
- Be able to convert sentences into a list of integers so that it can be read through a Machine Learning Algorithm
- Be able to convert individual words into integers
- Be able to covert a list of integers back into sentences
- Be able to covert user input (a sentence) into integers
odd meteor
hardy berry
I need a few things:
- Be able to convert sentences into a list of integers so t...
I'll gonna briefly try to explain Gensim but you can try to easily figured out how to use CountVectorizer and TfidfVectorizer
hardy berry
odd meteor
I'll gonna briefly try to explain Gensim but you can try to easily figured out h...
Alright, please explain gensim
what's the difference between CountVectorizer and TfidfVectorizer? @odd meteor they seem to do similar things
I'll give an overview of my entire project ig aswell:
I have a database of sentences that each correspond to an emotion
I want to train an AI model and feed it the database
Then, take an input from the user and the program uses the AI model to create a prediction on what emotion it is trying to convey
odd meteor
hardy berry
I need a few things:
- Be able to convert sentences into a list of integers so t...
GENSIM
Gensim is one of the popular NLP libraries which is often use to build document or word vectors, corpora, performing topic identification and document comparison.
from gensim.corpora.dictionary import Dictionary
from nltk.corpus import stopwords
from nltk.stem import WordNetLemmatizer
from nltk.tokenize import word_tokenize

my_documents = [
'The movie was about black magic.' ,
'I really like the movie!',
'That movie was awful, I hate black magic movies',
...,
'More black magic and sorcerer films, please!']

tokenized_doc = [word_tokenize(doc.lower()) for doc in my_documents]

tokenized_alpha = [ w for w in tokenized_doc if w.isalpha()] # we only want the tokens to contain alphabetical words

no_stops = [ w for w in tokenized_alpha if w not in stopwords.words('english')] #remove stopwords

lemmatizer = WordNetLemmatizer()
lemmatized = [ lemmatizer.lemmatize(t) for t in no_stops]
dictionary = Dictionary(lemmatized)

#We've just created a dictionary of all the tokens in the document using Gensim.

print(dictionary.token2id)

#This will show you all tokens with their respective ids. We can now this dictionary to build a Gensim corpus.
Building a Gensim Corpus
print (corpus)
What this does is, Gensim uses a simple bag of words a.k.a (bow) to transform each document into bag of words using the token ids and the frequency of each token in the document.
**Tf-Idf + Gensim **
Now you can now build a TFIDF model using Gensim and the corpus we've already developed.
Please try to read up TF-Idf (I don't wanna overstretch this response... I feel like it's already too much)
from gensim.models.tfidfmodel import TfidfModel
doc = corpus[4] #selecting to work on the 5th document in our corpus
Tfidf = TfidfModel(corpus)
tfidf_weights = Tfidf(doc) #tfidf weights
print(tfidf_weights[:5]) #print the top 5 weights
sorted_tfidf_weights = sorted(tfidf_weights, key=lambda w: w[1], reverse = True) #sort in descending order

#To know the top 5 weighted words

for term_id, weight in sorted_tfidf_weights[:5] :
    print(dictionary. get(term_id), weight)
You can then pass weights into your ML Decision Tree algorithm to build your model.
I hope I don't end up confusing you.
Again, there are other ways to do this. You can simply use TfidfVectorizer
odd meteor
hardy berry
Gensim seems complicated tbh
I used Gensim because you mentioned that you'd like to be able to convert back the token id to its original word. 😀. If you're using a vectorizer you won't be able to easily know which word belongs to which id.
Well, just use TfidfVectorizer then
hardy berry
odd meteor
I used Gensim because you mentioned that you'd like to be able to convert back t...
Oh alright, so then I'll try and use gensim
hardy berry
odd meteor
**__GENSIM__**
Gensim is one of the popular NLP libraries which is often use to...
Had a couple of doubts regarding this:
- What have you done with the lemmetizer?
- What have you done with the no_stops list?
 formal lava
How do I sart RL? I mean reqs, guides, everything
odd meteor
hardy berry
what's the difference between CountVectorizer and TfidfVectorizer? <@!5193194968...
They are both vectorizers used in converting a text to a word vector. The beauty of TfidfVectorizer over CountVectorizer is that, TfidfVectorizer down weights non relevant or less important words that appear too often in a document
hardy berry
So basically Tfidf does an extra step of Lemmatization?
hardy berry
hardy berry
Had a couple of doubts regarding this:
- What have you done with the lemmetizer?...
searched these up
can I get away without removing stop words/lemmatizing?
odd meteor
hardy berry
Had a couple of doubts regarding this:
- What have you done with the lemmetizer?...
Lemmatization is the process of reducing words to their roots; which are valid words in the language your text is in.
Lemmatization is kinda the same with Stemming. The only difference is that stemming transforms words to their root forms but it's not guaranteed the stemmed word will always be a valid word in the language your text is in.
Example
- Stemming: house, houses, housing == hous
- Lemmatization: house, houses, housing == house
Although stemming automatically converts your text to lowercase unlike lemmatization. So you can stem 1st and lemmatize afterwards
hardy berry
So basically we use Gensim to create a dictionary and then use tf-idf to vectorize
and then when I get the input from the user I can reference it back to the gensim dictionary I have
formal lava
formal lava
How do I sart RL? I mean reqs, guides, everything
...
odd meteor
hardy berry
Had a couple of doubts regarding this:
- What have you done with the lemmetizer?...
Stopwords are those words that always appear too often in a text and at the same time useless because they are not informative.
Example: the, at, in, a, but, for, on, from. This also extends to punctuations
odd meteor
formal lava
How do I sart RL? I mean reqs, guides, everything
Idk about RL yet. But always check the pinned message or online resources
formal lava
Is it possible to get good money from rl?
odd meteor
formal lava
Is it possible to get good money from rl?
If you're gainfully employed to use RL to build stuff, yeah, why not?
formal lava
Should i learn ml in general
odd meteor
formal lava
Should i learn ml in general
Definitely.
hardy berry
Can I create a dictionary with every english word? So that I can mix n match later on?
odd meteor
hardy berry
Can I create a dictionary with every english word? So that I can mix n match lat...
Without removing stopwords?
Well, you can do that but it'll mess up your model performance.
Stemming, Lemmatization, removing stopwords, converting your documents to lowercase are all data cleansing processes when dealing with a text data.
odd meteor
hardy berry
Can I create a dictionary with every english word? So that I can mix n match lat...
Just use TfidfVectorizer for your text classification or sentiment analysis project you're currently working on. You can always Google to understand more about Gensim. I feel using TfidfVectorizer will be more straightforward and easier to grasp.
formal lava
 tardy jolt
would anyone like to build ultron?
tardy jolt
would anyone like to build ultron?
wdym?
 mighty spoke
Hi I have some data which I have binned into intervals, now I want to plot it on a scatter plot but i'm not sure how to do this, appreciate any help, my code:
def create_bins(lower_bound, width, quantity):
""" create_bins returns an equal-width (distance) partitioning.
It returns an ascending list of tuples, representing the intervals.
A tuple bins[i], i.e. (bins[i][0], bins[i][1]) with i > 0
and i < quantity, satisfies the following conditions:
(1) bins[i][0] + width == bins[i][1]
(2) bins[i-1][0] + width == bins[i][0] and
bins[i-1][1] + width == bins[i][1]
"""
bins = []
for low in range(lower_bound,
lower_bound + quantity*width + 1, width):
bins.append((low, low+width))
return bins
bins = create_bins(lower_bound=-125,width=5,quantity=49)
bins2 = pd.IntervalIndex.from_tuples(bins, closed="left")
categorical_object = pd.cut(x, bins2)``` haughty otter
I am trying to make a scatterplot using seaborn.
sns.scatterplot(data=out, x='0', y='1', hue='y')
Simply doing this is giving me an error:
ValueError: Could not interpret value `1` for parameter `y`
 desert oar
mighty spoke
Hi I have some data which I have binned into intervals, now I want to plot it on...
desert oar
mighty spoke
Hi I have some data which I have binned into intervals, now I want to plot it on...
!code fyi you can use a "code block" for better formatting. read below (carefully)
arctic wedgeBOT
Here's how to format Python code on Discord:
```py
print('Hello world!')
```
These are backticks, not quotes. Check this out if you can't find the backtick key.
desert oar
haughty otter
I am trying to make a scatterplot using seaborn.
```py
sns.scatterplot(data=out...
seaborn probably just doesn't have good support for numeric column names. try renaming them
haughty otter
desert oar
seaborn probably just doesn't have good support for numeric column names. try re...
yes just did that, passed as integers and it worked.
thank you
 chilly geyser
@odd meteor By the way, regarding the accuracy weirdness/sklearn, I think it was because I had SMOTE in my examples, and indeed the over/undersampling was a cause.
hollow sentinel
/Users/rahuldas/opt/anaconda3/lib/python3.7/site-packages/sklearn/linear_model/_logistic.py:940: ConvergenceWarning: lbfgs failed to converge (status=1):
STOP: TOTAL NO. of ITERATIONS REACHED LIMIT.

Increase the number of iterations (max_iter) or scale the data as shown in:
    https://scikit-learn.org/stable/modules/preprocessing.html
Please also refer to the documentation for alternative solver options:
    https://scikit-learn.org/stable/modules/linear_model.html#logistic-regression
  extra_warning_msg=_LOGISTIC_SOLVER_CONVERGENCE_MSG)
i do not know what this means
i looked it up and i still don't know
odd meteor
hollow sentinel
```python
/Users/rahuldas/opt/anaconda3/lib/python3.7/site-packages/sklearn/line...
Stack Overflow
I am doing multiclass/multilabel text classification. I trying to get rid of the "ConvergenceWarning".
When I tuned the max_iter from default to 4000, the warning is disappeared. However, my model
mighty spoke
desert oar
!code fyi you can use a "code block" for better formatting. read below (carefull...
is it in the right format now?
desert oar
mighty spoke
is it in the right format now?
that looks better. the info box i posted also explains how to add python syntax highlighting
 grave sparrow
For pandas, is there a way to say...
If you have a df
1             0              Yes
2             1              No
1             1              No```
Is there a way to set z = Yes for all instances (rows) of x=1 where y = 0? For instance, in the example above, the 3rd record would be changed to YesI feel like there should be a very simple function to do this... but my mind keeps going blank
serene scaffold
grave sparrow
For pandas, is there a way to say...
If you have a df
```x y ...
do you know how to do boolean masking?
grave sparrow
I do at a workable level
serene scaffold
grave sparrow
I do at a workable level
In [3]: (df['x'] == 1) & (df['y'] == 0)
Out[3]:
0     True
1    False
2    False
The solution also involves loc
grave sparrow
Sorry I think I get what you are getting at. But I mean if 1 instance of where x=1 has a matching y=0, then all instances where x=1 should return Yes
Or does your proposed solution work with that as well?
serene scaffold
grave sparrow
Sorry I think I get what you are getting at. But I mean if 1 instance of where x...
do you know about the any and all methods of series? Not the builtin functions.
serene scaffold
also, what do you want to do if there is no row for which x = 1 and y = 0?
grave sparrow
If y=0 then once then Yes, otherwise No (or boolean T/F)
serene scaffold
is every value in this new Yes/No column going to be the same?
Also, booleans are strongly preferred to strings if the strings just represent true/false values
grave sparrow
y can be 0 or higher, but It should only return true if it is 0, otherwise false.
I feel like maybe I should just split it into 2 dfs and join
Because using loc in the past has been a nightmare
serene scaffold
grave sparrow
Because using loc in the past has been a nightmare
In [4]: df.loc[(df['x'] == 1) & (df['y'] == 0), 'z'] = 'Yes'

In [5]: df
Out[5]:
   x  y    z
0  1  0  Yes
1  2  1   No
2  1  1   No
Alternatively
In [6]: df['z'] = (df['x'] == 1) & (df['y'] == 0)

In [7]: df
Out[7]:
   x  y      z
0  1  0   True
1  2  1  False
2  1  1  False
Okay so it is a little more complex.
serene scaffold
I might get another chance to look in a bit
grave sparrow
if x = 2 and y == 0 then every Z value for that X value should be True as well.
However, if a single value is not 0, then every value should be false.
I did not properly create a big enough table to demonstrate that.
But it is sort of a .... hmmm. a window if
serene scaffold
grave sparrow
I did not properly create a big enough table to demonstrate that.
I mean I appreciate that you made an example at all 😄
(I'm waiting on another download btw)
However, if a single value is not 0, then every value should be false.
I would assume that this is not the case, and do the transformation in the previous step
and then
if (df['y'] != 0).any():
    ...
or something, as a cleanup step
grave sparrow
1             0              True
2             1              True
1             1              True
2              0             True```
So in this scenario I would want all records to say Yesagain, proper bools are better for this
grave sparrow
Fixed!
serene scaffold
an expression like df['z'] = True would wipe out whatever is there and replace every cell with True
serene scaffold
for fun
grave sparrow
So like in excel I could do a MINIFS taking the minimum of Y when doing an array lookup on the X column
Then based on that I could convert to T/F
serene scaffold
I don't use excel anymore
grave sparrow
Maybe I could do a group by and subtract the counts
serene scaffold

regal ingot
salutations
 ancient grotto
I have something really strange for me.
This is the code on my friends PC


And this is the same code on my PC. We get different values but use the same data. We even exchanged data. How can this be? This is maybe because of diffrent andas and numpy versions?
Iam happy for any help. Thank you guys in advance
On my laptop i get even different data
 regal ingot
should my if blocks always end with a else
    a, b, c, d = 0 , 0 ,0.3 , 0.4
    if x <= a:
        return 0
    elif a < x < b:
        return ((x-a) / (b-a))
    elif b <= x <= c:
        return 1
    elif d <= x:
        return 0
aanyone here got any knowledge on fuzzy classfiers
 stoic musk
I don't think you need it but it's good practice
Trying to run ResNet for the first time, getting this:
Exception: URL fetch failure on https://storage.googleapis.com/tensorflow/keras-applications/resnet/resnet152_weights_tf_dim_ordering_tf_kernels_notop.h5: None -- [Errno -3] Temporary failure in name resolution
Am I using an old version ?
hollow sentinel
i got a dumb question
can you do k means clustering
w more than two axes

11 clinical features for predicting heart disease events.
i am also unsure if logistic regression is better for this
or k means clustering
my partner says k means clustering
desert oar
hollow sentinel
can you do k means clustering
Yes, you just need the matrix of pairwise distances between data points. Number of features is irrelevant (although beware the "curse of dimensionality")
The "curse" is that, as you add features, distances between points get larger and larger
Which can sometimes make for bad results when using distance-based techniques
hollow sentinel
hm
 ruby granite
I'm messing around with numpy and pandas and using VSCode. Since there are a lot of functions I don't know I end up pasting them into a browser search bar. Is there a way to get more descriptive hover text/popups in the editor though?
 supple trench
Does anyone know how to count unique values in multiple arrays? for example, I have this format of dataset:
post_id author_login comment_count like_count date_gmt lang liker_ids commenter_ids
783 2 jasontromm 2 1 2005-09-21 01:46:44 en [67919898] [5909034, 67919898]
870 2179 jasontromm 2 1 2015-01-14 14:31:42 en [52816673] [52816673, 762]
1236 2253 woordenaar 1 1 2013-07-22 13:49:02 nl [52914860] [52914860]
1238 2262 woordenaar 2 1 2013-07-25 07:33:45 nl [52914860] [52914860, 1148]
1252 2322 woordenaar 1 1 2013-08-10 09:42:40 nl [52914860] [52914860]
I want to know if there's a way to count the unique values in either liker_ids or commenter_ids for each author_login
and then sum them
and for them to be disregarded if they're repeated in another row or have already been taken into account
serene scaffold
supple trench
Does anyone know how to count unique values in multiple arrays? for example, I h...
Thank you for showing the data; can you do it as a CSV? that way I can copy it directly
print(df.head().to_csv()) will provide this.
The solution will probably involve the explode method. 💥
Please ping me when you have provided the DataFrame as a CSV
supple trench
,post_id,author_login,comment_count,like_count,date_gmt,lang,liker_ids,commenter_ids
0,969,jasontromm,0,0,2009-12-31 16:27:39,en,,
1,970,jasontromm,0,0,2010-01-06 14:48:55,en,,
2,971,jasontromm,0,0,2010-01-11 16:48:34,en,,
3,977,jasontromm,0,0,2010-01-20 17:07:21,en,,
4,978,jasontromm,0,0,2010-01-20 19:42:44,en,,
serene scaffold
supple trench
,post_id,author_login,comment_count,like_count,date_gmt,lang,liker_ids,commenter...
where did the lists go?
you have some empty cells.
 serene scaffold
supple trench
did not get printed
serene scaffold
supple trench
did not get printed
try print(df.loc[[783, 870, 1236, 1238, 1262]].to_csv())
oh that won't work either.
supple trench
,post_id,author_login,comment_count,like_count,date_gmt,lang,liker_ids,commenter_ids
783,2,jasontromm,2,1,2005-09-21 01:46:44,en,[67919898],"[5909034, 67919898]"
870,2179,jasontromm,2,1,2015-01-14 14:31:42,en,[52816673],"[52816673, 762]"
1236,2253,woordenaar,1,1,2013-07-22 13:49:02,nl,[52914860],[52914860]
1238,2262,woordenaar,2,1,2013-07-25 07:33:45,nl,[52914860],"[52914860, 1148]"
1262,2372,woordenaar,1,1,2013-08-22 07:50:23,nl,[52914860],[52914860]
it worked
serene scaffold
YAY
supple trench
THANK YOU
serene scaffold
supple trench
THANK YOU
In [27]: df[['author_login', 'liker_ids', 'commenter_ids']].explode('liker_ids').explode('commenter_ids')
Out[27]:
     author_login liker_ids commenter_ids
783    jasontromm  67919898       5909034
783    jasontromm  67919898      67919898
870    jasontromm  52816673      52816673
870    jasontromm  52816673           762
1236   woordenaar  52914860      52914860
1238   woordenaar  52914860      52914860
1238   woordenaar  52914860          1148
1262   woordenaar  52914860      52914860
can you think of what to do from here?
supple trench
would nunique() do the trick?
serene scaffold
that would be part of the solution, yes
also it would probably actually be better to do this in two separate dataframes
and
you probably need to use groupby
or it won't be with respect to author_login
see how much you can figure out from there
supple trench
so i'm gessing df.groupby('author_login').['liker_ids].nunique()
Thank you that helps out a lot!
serene scaffold
supple trench
so i'm gessing df.groupby('author_login').['liker_ids].nunique()
try it and see if that's it. ||it's not||
supple trench
gdf = most_unique_likes.groupby('author_login')
gdf = gdf.agg({"liker_ids": "nunique"})
gdf = gdf.reset_index()
This worked like a charm
Thanks for guiding me in the right direction! Really appreciate it
serene scaffold
supple trench
gdf = most_unique_likes.groupby('author_login')
gdf = gdf.agg({"liker_ids": "nun...
nice, I hadn't even thought of this solution. Great work 
lapis sequoia
# Scale features
s1 = MinMaxScaler(feature_range=(-1, 1))

inputs = final_array_final
# Only gets the final output
outputs = different_arrays[:, -1]

# Will be 7k values (10k total)
train = final_array_final[:7000]
# This thing's shape needs to be (10000, 1)
predicted = outputs[:7000]

# Train the data from the first 7000 rows.
# added both train and train2 here
Xs = s1.fit_transform(train)

# scale predicted value
s2 = MinMaxScaler(feature_range=(-1, 1))
predictedFinal = np.reshape(predicted, (-1, 1))
Ys = s2.fit_transform(predictedFinal)

#time steps
window = 70
X = []
Y = []
for i in range(window, len(Xs)):
    X.append(Xs[i - window:i, :])
    Y.append(Ys[i])

# Reshape data
X, Y = np.array(X), np.array(Y)

model = Sequential()
model.add(LSTM(units=50, return_sequences=True, input_shape=(X.shape[1], X.shape[2])))
model.add(Dropout(0.2))
model.add(LSTM(units=50, return_sequences=True))
model.add(Dropout(0.2))
model.add(LSTM(units=50))
model.add(Dropout(0.2))
model.add(Dense(units=1))
model.compile(optimizer='adam', loss='mean_squared_error', metrics=['accuracy'])

# Allow for early exit
es = EarlyStopping(monitor='loss', mode='min', verbose=1, patience=10)

# Fit (and time) LSTM model
t0 = time.time()
history = model.fit(X, Y, epochs=10, batch_size=250, callbacks=[es])

t1 = time.time()
print('Runtime: %.2f s' % (t1 - t0))
# %%

# Plotting
plt.figure(figsize=(8, 4))
plt.semilogy(history.history['loss'])
plt.xlabel('epoch')
plt.ylabel('loss')
model.save('model.h5')
plt.show()

# verify fit
Yp = model.predict(X)

# un-scale
Yu = s2.inverse_transform(Yp)
Ym = s2.inverse_transform(Y)

plt.figure(figsize=(10, 6))
plt.plot(predicted[window:], Yu, 'r-', label='LSTM')
plt.plot(predicted[window:], Ym, 'k--', label='Measured')
plt.ylabel('idk')
plt.legend()
plt.show()
so this is my code. My inputs are in the shape of (10k, 200) and my outputs are in the shape of (10k, 1)
im trying to use the inputs to make the outputs, but every time i try and plot it, my graph looks like

so in my training data, i get 7k values of the 10k values
"train" is the input in the shape of (7k, 200) and "predicted" is the output in the shape (7k, 1)
i think my problem is in the inputs
i think it's the 200 columns that are messing it up
 last salmon
lapis sequoia
```py
# Scale features
s1 = MinMaxScaler(feature_range=(-1, 1))
inputs = final_...
last salmon
lapis sequoia
```py
# Scale features
s1 = MinMaxScaler(feature_range=(-1, 1))
inputs = final_...
 lapis sequoia
shall I proceed? installed python version is 3.10 btw

 next pelican
Any resources for "finding optimal threshold to maximize f1 score for each class in a multi label classification setting".
 blissful seal
import pyttsx3

Assitant = pyttsx3.init('sapi5')
voices = Assitant.getProperty('voices')
print(voices)
Assitant.set.Property('voices',voices[0].id)

def Speak(audio):
is there any promblem ?
glass spade
hi help me over here
print("hello!")
Question_1=input("Sir or Ma'am?:")
if question_1== sir:
input('Hello sir are you a returning user or an old one?')
hardy berry
hardy berry
I'll give an overview of my entire project ig aswell:
I have a database of sente...
can anyone recommend any libraries for this
tender hearth
hardy berry
can anyone recommend any libraries for this
Research NLP methods for sentiment analysis
You have a choice of popular NLP architectures such as LSTMs and Transformers
But try out the non-ML methods first
hardy berry
So i've got gensim and tfidvectorizer working
its converting it into numbers
here's my code
import pandas as pd #Pandas is a python library which we use to analyze data
from nltk.tokenize import word_tokenize
from gensim.corpora.dictionary import Dictionary
from gensim.models.tfidfmodel import TfidfModel

raw_data = pd.read_csv("C:/Users/DELL/Documents/emotions.csv") #We are reading a CSV file with the database
raw_data.columns = ["Emotion","Sentence"] #Adding column names to the pandas

sentences = list(raw_data["Sentence"]) #Converting all the sentences into a list
emotions = list(raw_data["Emotion"]) #Converting all the emotions into a list

tokenized_sentences = []
tokenized_emotions = []
features = []
outcomes = []

for i in sentences:
    tokenized_sentences.append(word_tokenize(i.lower()))

for i in emotions:
    tokenized_emotions.append(word_tokenize(i.lower()))

dictionary_sentences = Dictionary(tokenized_sentences)
processed_dictionary_sentences = [dictionary_sentences.doc2bow(i) for i in tokenized_sentences]
model_sentences = TfidfModel(processed_dictionary_sentences)

dictionary_emotions = Dictionary(tokenized_emotions)
processed_dictionary_emotions = [dictionary_emotions.doc2bow(i) for i in tokenized_emotions]
model_emotions = TfidfModel(processed_dictionary_emotions)

processed_sentences = []
processed_emotions = []
for i in range(0,len(tokenized_sentences)):
    vector_sentences = model_sentences[processed_dictionary_sentences[i]]
    processed_sentences.append(vector_sentences)

for i in range(0,len(tokenized_emotions)):
    vector_emotions = model_emotions[processed_dictionary_emotions[i]]
    processed_emotions.append(vector_emotions)

print(processed_sentences[:5])
print(sentences[:5])
print("\n")
print(processed_emotions[:20])
print(emotions[:20])
 bold timber
Hello everyone, I have a problem like this. How to fix out this problem? I had tried to downgrade the version, but it still doesn't work.

this is my code to determined sum of cluster
 hardy berry
```
import pandas as pd #Pandas is a python library which we use to analyze data...
hardy berry
hardy berry
```
import pandas as pd #Pandas is a python library which we use to analyze data...
output
I dont get what the decimals are
 desert oar
bold timber
Hello everyone, I have a problem like this. How to fix out this problem? I had t...
desert oar
bold timber
Hello everyone, I have a problem like this. How to fix out this problem? I had t...
what does model.cluster_centroids_ actually contain?
bold timber
desert oar
what does `model.cluster_centroids_` actually contain?
like this
 desert oar
bold timber
like this
desert oar
bold timber
like this
Ok, so why did you try to unpack it into 2 variables? That's clearly an array of 3 rows, one row per centroid
bold timber
desert oar
Ok, so why did you try to unpack it into 2 variables? That's clearly an array of...
I want to analyze the cluster each data
data array is so difficult to analyze the cluster
in this case I use 3 cluster
desert oar
bold timber
I want to analyze the cluster each data
but what did you expect that code to do?
lapis sequoia
I got an important assessment tomorrow and I can't install this essential package sklearn. Can someone take a look at my error and help me, please.
desert oar
lapis sequoia
I got an important assessment tomorrow and I can't install this essential packag...
!paste
stupid bot
sigh
desert oar
@lapis sequoia paste the full error to https://paste.pythondiscord.com
and yes of course
lapis sequoia
Can it cover all the errors?
bold timber
desert oar
but what did you expect that code to do?
I want to put the value into dataframe like this
 lapis sequoia
thanks for willing to help btw
desert oar
lapis sequoia
Can it cover all the errors?
? that is a website where you can post long chunks of text output to share
desert oar
bold timber
I want to put the value into dataframe like this
is this the same model? where did you get this code?
you need to consult the documentation to see what model_centroids_ contains
maybe they changed the api
bold timber
desert oar
is this the same model? where did you get this code?
I have that code from my friend, and he tells me to downgrade my scikit-learn version. When I tried to update or downgrade my version, I still got an error
lapis sequoia
https://pastebin.com/krU69UP7 @desert oar
Pastebin
Pastebin.com is the number one paste tool since 2002. Pastebin is a website where you can store text online for a set period of time.
desert oar
try pip install --prefer-binary scikit-learn
sklearn is not the package name, although hopefully they reserved the name to prevent malicious typosquatting
desert oar
bold timber
I have that code from my friend, and he tells me to downgrade my scikit-learn ve...
check the docs, also ask your friend what version they used
lapis sequoia
desert oar
try `pip install --prefer-binary scikit-learn`
same error
desert oar
it seems like it's trying to build from source, which would only happen if it can't find a binary "wheel" on pypi that matches your system
are you using python 3.10?
lapis sequoia
    File "C:\Users\madan\AppData\Local\Temp\pip-build-env-tvobzf3f\overlay\Lib\site-packages\setuptools\msvc.py", line 270, in _msvc14_get_vc_env                             raise distutils.errors.DistutilsPlatformError(                                                                                                                      distutils.errors.DistutilsPlatformError: Microsoft Visual C++ 14.0 or greater is required. Get it with "Microsoft C++ Build Tools": https://visualstudio.microsoft.com/visual-cpp-build-tools/                                                                                                                                                  ----------------------------------------
```maybe this helps you understand it. PS I installed build toolsyeah
desert oar
downgrade to 3.9 and make sure you have the 64 bit version
https://pypi.org/project/scikit-learn/ it looks like there is no 3.10 wheel
 lapis sequoia
okay
how to completely remove 3.10 though?
cause when I try to reinstall it, it had previous setup
desert oar
if you installed with the windows installer from python.org, the add/remove programs should work
otherwise you can keep it installed and use py -3.9 instead of python on the command line
lapis sequoia
no that is inefficient
lapis sequoia
desert oar
if you installed with the windows installer from python.org, the add/remove prog...
i can't see add/remove programs
desert oar
lapis sequoia
no that is inefficient
your exam is tomorrow, make it work the inefficient way and fix it later. also it's not that much harder to type
desert oar
lapis sequoia
i can't see add/remove programs
it was a standard windows feature when i last used windows, maybe it has a different name in windows 10
lapis sequoia
someone said, i may be able to do my things from anaconda
lapis sequoia
@desert oar I want to go even backward to 3.8, was any new features released after that?
3.8 because anaconda also has this one
desert oar
lapis sequoia
<@!389497659087650836> I want to go even backward to 3.8, was any new features r...
you can use 3.8
anaconda has 3.9 and 3.10 too, but if they offer 3.8 by default then you can use it
I recommend doing the simplest thing that could possibly work, if you are on a time limit
don't mess around with entirely new software the night before an exam imo
lapis sequoia
this one right?
 desert oar
lapis sequoia
this one right?
desert oar
lapis sequoia
this one right?
Yes
mighty spoke
Hi i tried binning my data and plotting it but its not actually binning the data ```x, y = zip(*sorted(zip(lag, acf)))#ensures x and y values correspond to each others in pairs when sorted
def create_bins(lower_bound, width, quantity):
""" create_bins returns an equal-width (distance) partitioning.
It returns an ascending list of tuples, representing the intervals.
A tuple bins[i], i.e. (bins[i][0], bins[i][1]) with i > 0
and i < quantity, satisfies the following conditions:
(1) bins[i][0] + width == bins[i][1]
(2) bins[i-1][0] + width == bins[i][0] and
bins[i-1][1] + width == bins[i][1]
"""
bins = []
for low in range(lower_bound,
                 lower_bound + quantity*width + 1, width):
    bins.append((low, low+width))
return bins
df = pd.DataFrame({'X' : x, 'Y' : y}) #we build a dataframe from the data
bins = create_bins(lower_bound=-125,width=5,quantity=49)
bins2 = pd.IntervalIndex.from_tuples(bins, closed="left")
categorical_object = pd.cut(df.X, bins2)
grp = df.groupby(by = categorical_object) #we group the data by the cut
ret = grp.aggregate(np.mean) #we produce an aggregate representation (median) of each bin
plt.plot(x,y,'o')
plt.plot(ret.X,ret.Y)
plt.show()```
it shows this
 lapis sequoia
desert oar
downgrade to 3.9 and make sure you have the 64 bit version
lapis sequoia
desert oar
downgrade to 3.9 and make sure you have the 64 bit version
thanks man it worked
really appreciated 🙂
I don't need to pip install jupyterlab, if I install Anaconda right?
 slender kestrel
yo ! i am looking forward to learn machine learning and deep learning but the resources are quite scattered so can anyone suggest me what should i do like does anyone here has done machine learning and from they learned etc etc
 manic berry
Hi all, I'm looking for some pandas help. I am grouping the following dataframe (fake data):

Using:
df.groupby(["age","gender"]).agg(
{
"100m":{"mean","median","count"},
"200m":{"mean","median","count"},
"400m":{"mean","median","count"},
"800m":{"mean","median","count"},
"1500m":{"mean","median","count"},
}
)
Which gives me:

But I am unsure how I would then index each column
E.g. if I wanted to get only columns: Age, Gender, 100m mean
So that I could plot it using matplotlib for example
Any advice appreciated
manic berry
That's worked! Thanks
lapis sequoia
🙂
lapis sequoia
lapis sequoia
I don't need to pip install jupyterlab, if I install Anaconda right?
if you have the anaconda navigator, it should ideally have the jupyterlab.
rigid zodiac
Dumb question time, can we use array or vector in ML model?
desert oar
lapis sequoia
I don't need to pip install jupyterlab, if I install Anaconda right?
I recommend not mixing anaconda and a plain python installation, until you know more about how they both work "under the hood". So yes, I suggest pip installing jupterlab
Eventually you should get familiar with venv/virtualenv, conda envs, and jupyter "kernels", which allows you mix different python setups easily
desert oar
slender kestrel
yo ! i am looking forward to learn machine learning and deep learning but the r...
I recommend a structured course. Like you said, the information is very scattered, and there is a huge amount of topics to cover
slender kestrel
desert oar
I recommend a structured course. Like you said, the information is very scattere...
yess but where to find a good structured course
which i am able to understand since the math used in it is a total pain
desert oar
Are you asking about a feature where every "value" is an array? Usually we don't do that, usually the data gets flattened somehow. there are some specialized specialized models that group features together, but usually that part is specifically for feature selection
desert oar
slender kestrel
yess but where to find a good structured course
Honestly i am not sure. But the math pre-requisites are usually linear algebra and calculus
slender kestrel
desert oar
Honestly i am not sure. But the math pre-requisites are usually linear algebra a...
yess math required are
PCA multivariate calc and linear algebra
lapis sequoia
desert oar
I recommend not mixing anaconda and a plain python installation, until you know ...
yeah but my course requires anaconda as well
is it okay with the default checks?
 desert oar
lapis sequoia
is it okay with the default checks?
desert oar
lapis sequoia
is it okay with the default checks?
I prefer checking the 1st one because i know precisely what i am doing, but i guess if you are nervous feel free to leave it unchecked.
If you aren't using conda "environments" and don't intend to use other python installations on your system, then the 2nd option is ok
 charred stone
Hi! I’m making a simple classification model with 2 classes to classify. For some reason, on the first epoch the accuracy is 76%, not 50. I do have truce as much as data in the second class as I do the first, but initially, it should just be random for the whole set.
 short heart
the bigger correlation there is between 2 features the better it is to create features out of these 2?
 junior matrix
Anyone on?
serene scaffold
junior matrix
Anyone on?
what is your end goal in asking if anyone is on?
serene scaffold
junior matrix
I wanted some help regarding cnn
I'm at work, but try putting your question about CNNs out there, and hopefully someone will be able to help.
junior matrix
So i am using cnn for feature extraction, i have removed the softmax layer
And compiled the model
To extract features, do i need to need to train the model?
Or use predict directly
serene scaffold
do you know the difference between training and predicting?
serene scaffold
what is feature extraction?
junior matrix
Reducing the dimension on data to get important features
For the data
Which can then be passed into model for classification
serene scaffold
junior matrix
Which can then be passed into model for classification
sounds like this is something you have to do before you call predict
 true nacelle
If a method has been deprecated (docs for pandas), what does that mean?
Was looking into changing some categories for a df I've been working on, but when I call the methods it says
'DataFrame' object has no attribute 'rename_categories'
I checked the docs for that method and turns out since 1.3.0 they've "deprecated" it, and I'm running on 1.3.3.
 tranquil folio
true nacelle
Was looking into changing some categories for a df I've been working on, but whe...
tranquil folio
true nacelle
Was looking into changing some categories for a df I've been working on, but whe...
Deprecated in general means there is a newer better way to do what you are trying to do. The depricated feature may still be available, but you should use the preferred feature if you can
I'm not familiar with what feature you need specifically though
serene scaffold
true nacelle
If a method has been deprecated (docs for pandas), what does that mean?
To add to what dowcet has said, if something has been deprecated, that means it might be removed in the next version. There will usually be some kind of warning saying what you should do instead so that your code doesn't break when you update.
true nacelle
tranquil folio
Deprecated in general means there is a newer better way to do what you are tryin...
Thanks! I was referring to pd.cat method (or is it called an attribute?). Basically, anything having to do with pd.series.cat
serene scaffold
true nacelle
Thanks! I was referring to pd.cat method (or is it called an attribute?). Basica...
try pd.concat
also, all methods are attributes, but not all attributes are methods
anything you get with the dot operator is an attribute of the thing you got it from.
true nacelle
serene scaffold
try `pd.concat`
But concat is different from something like this, no?
pandas.Series.cat.rename_categories
serene scaffold
!docs pandas.Series.cat
arctic wedgeBOT
Series.cat()```
Accessor object for categorical properties of the Series values.

Be aware that assigning to categories is a inplace operation, while all methods return new categorical data per default (but can be called with inplace=True).you're right, cat is an accessor
true nacelle
Cause my issue is that you have all these neat functions for dealing with categories but they don't work anymore.
serene scaffold
(which means that it's an attribute that's just for getting other attributes.)
!docs pandas.Series.cat.rename_categories
arctic wedgeBOT
Series.cat.rename_categories(*args, **kwargs)```
Rename categories.the only part that was deprecated is the inplace parameter
true nacelle
Oh, then it's odd behaviour that my output says the following:
Wait, I'm dealing with a df, but this only works for series. Might be what's causing all the trouble.
serene scaffold
maybe. if you copy and paste the whole error message, I might be able to infer what the problem is
true nacelle
Is there a special way to paste it or do I just literally copy paste? (formatting etc.)
serene scaffold
true nacelle
Is there a special way to paste it or do I just literally copy paste? (formattin...
```
Traceback:
blah blah blah
SomeError: Bad code!!!
```
true nacelle
---------------------------------------------------------------------------
AttributeError                            Traceback (most recent call last)
~\AppData\Local\Temp/ipykernel_25208/1267334694.py in <module>
----> 1 x1.cat.rename_categories()

~\anaconda3\envs\myenv1\lib\site-packages\pandas\core\generic.py in __getattr__(self, name)
   5485         ):
   5486             return self[name]
-> 5487         return object.__getattribute__(self, name)
   5488
   5489     def __setattr__(self, name: str, value) -> None:

AttributeError: 'DataFrame' object has no attribute 'cat'
yes, you were right
Since python is dynamically typed, you often get AttributeError instead of TypeError
but the problem in this case is that x1 has a different type than you expected.
(From Python's perspective, the type doesn't matter--what matters is that you looked up the cat attribute and it wasn't there for some reason. Does that make sense?)
true nacelle
Yeah, like sorta from the dir(x1) list right?
serene scaffold
right, dir(...) will give you a list of available attributes
true nacelle
Then I think I just need to slice a part of the df to get a series, and then work with that. Basically, I'm trying to predict a terminal waiting time for a df containing travel data, but there's metadata from the og df, and I just need to change the allowed values for a certain field and then we're good to go!
serene scaffold
true nacelle
Thanks a bunch for the help!
serene scaffold
that frog looks like it needs to poop
true nacelle
Yeah there's something uncanny in the eyes
true nacelle
Well, I'm into politics, stone collecting and small prices to pay for salvation
serene scaffold
wow
true nacelle
 true nacelle
serene scaffold
wow
true nacelle
serene scaffold
wow
Btw I did what I said I was gonna do, and now it works!
echo thorn
I have a some function f(k) which I want to integrate over k using scipy: F, err = scipy.integrate.quad(f(k), 0, 1) but f contains meshgrid of x, y and z so I get an error
and f is defined as f = lambda k: some expression with X, Y, Z and k
where X, Y, Z = np.meshgrid(x, y, z)
Like I can do it by implementing my own numerical integrater but it will be way less optimized
true nacelle
echo thorn
I have a some function f(k) which I want to integrate over k using scipy: ```F, ...
How come f contains a meshgrid?
 arctic wedgeBOT
:incoming_envelope: :ok_hand: applied mute to @narrow ingot until <t:1637342994:f> (9 minutes and 58 seconds) (reason: duplicates rule: sent 4 duplicated messages in 10s).
echo thorn
and I want to integrate it on a grid
true nacelle
Since I assume sending it to a grid is a must, this may help:
https://stackoverflow.com/questions/20668689/integrating-2d-samples-on-a-rectangular-grid-using-scipy
Stack Overflow
SciPy has three methods for doing 1D integrals over samples (trapz, simps, and romb) and one way to do a 2D integral over a function (dblquad), but it doesn't seem to have methods for doing a 2D in...
Cause vectorising and putting values into a df first is easier imo (again, I don't know the whole picture)
echo thorn
its literally just getting the result of that integral on a grid
echo thorn
I mean i just want to find the result of that integral on some grid
true nacelle
echo thorn
where ```X, Y, Z = np.meshgrid(x, y, z)```
oh sorry, I somehow missed this lmao
serene scaffold
lapis sequoia
<@!253696366952316929> can you help
no, I'm at work
lapis sequoia
oh srr
 knotty cloak
So I was referred here from the lobby in the hopes of finding someone that knows pandas better than I do. I was trying to assist someone on /r/learnpython with a question about grouping overlapping time ranges, and while I provided a working solution using multiple applys, I feel like there's probably a better more elegant solution. Anyone here want/available to take a look at it?
here's the question they posted if anyone is available: https://www.reddit.com/r/learnpython/comments/qxgf76/how_to_aggregate_overlapping_times/
 vapid sentinel
hey guys anyone has done data science pgp at upgrad , jigsaw or great learning
vapid sentinel
vapid sentinel
hey guys anyone has done data science pgp at upgrad , jigsaw or great learning
i want enroll for that anybody can share reviews
serene scaffold
knotty cloak
So I was referred here from the lobby in the hopes of finding someone that knows...
The solution probably involves the groupby method, but I don't attempt to answer Pandas questions without a copy-and-pasteable example of the input.
knotty cloak
@serene scaffold they included data in their post that I copy/pasted. Do you want what I used?
serene scaffold
knotty cloak
<@!253696366952316929> they included data in their post that I copy/pasted. Do y...
What I see is an example of the desired output.
knotty cloak
Is it ok to paste it here? I used the data they had, but I can strip the result column for you.
serene scaffold
knotty cloak
Is it ok to paste it here? I used the data they had, but I can strip the result ...
Yes, you can paste it here.
knotty cloak
columns= "Event Start End".split('\t') data = """e1 09:00 09:30 e2 09:10 10:00 e3 09:30 09:40 e4 09:45 09:50 e5 10:00 10:30 e6 10:20 10:40 e7 10:45 11:00 e8 10:55 11:10 e9 11:20 11:50 e10 11:25 11:40 e11 11:35 12:00""" data = [ d.split('\t') for d in data.splitlines() ] df = pd.DataFrame(data,columns=columns) df = df.set_index(['Event'])
serene scaffold
So the input is just the output but without that column?
knotty cloak
That's my understanding of it, yes.
serene scaffold
Alright. let me see
knotty cloak
Thanks, Did what i could to help them, but reasonably convinced there's a better way.
serene scaffold
columns= "Event    Start    End".split()

data = """e1    09:00    09:30
    e2    09:10    10:00
    e3    09:30    09:40
    e4    09:45    09:50
    e5    10:00    10:30
    e6    10:20    10:40
    e7    10:45    11:00
    e8    10:55    11:10
    e9    11:20    11:50
    e10    11:25    11:40
    e11    11:35    12:00
"""

data = [d.split() for d in data.splitlines()]
df = pd.DataFrame(data, columns=columns)
df = df.set_index(['Event'])
@knotty cloak I think their desired output is wrong? Events 3 and 4 don't overlap, but they're shown as part of the same group
knotty cloak
11:35 is beofre 11:40 so they do overlap
oh wait, you mean events 3 and 4, not the groups.
yes they are in group 1 because event 2 set the end time to 10
so e1 and e2 overlap as does anything that fits in that group.
so 3 & 4 don''t overlap each other, but they both ooverlsap with 2
serene scaffold
There probably isn't an idiomatic Pandas solution.
knotty cloak
Ah. Was worried that might be the case too. Thanks for taking the time to look at it
Is there a pandas way to set a column to "maximum value before this row" ?
That's what I was going for with this:
def local_max(v): local_max.value = max(local_max.value,v) return local_max.value local_max.value = pd.to_datetime(0) df['max_end'] = df.End.apply(local_max)
serene scaffold
knotty cloak
Is there a pandas way to set a column to "maximum value before this row" ?
I can't think of one for every previous row, but there is rolling for selecting values of interest within a given range
knotty cloak
That might work then. I'll google it. Thank you.
serene scaffold
knotty cloak
That might work then. I'll google it. Thank you.
Pandas doesn't really have operations where the result for a previous row during the same calculation affects subsequent rows
even rolling isn't cascading, in that regard, as it's always doing calculations with respect to a column that has already been calculated
knotty cloak
yeah, the solution I offered was to make a new column that was "max seen so far" and then increment a group every time something's start was not smaller than the max_seen end.
I'll probably just leave it at that, from here it's mostly just educational for me I think.
serene scaffold
knotty cloak
yeah, the solution I offered was to make a new column that was "max seen so far"...
also I like your technique of storing the persistent value as an attribute of the function.
class static:
    def __init__(self, **kwargs):
        self.vals = kwargs
    def __call__(self, func):
        func.__dict__.update(self.vals)
        return func
fun way to get that behavior with a decorator
knotty cloak
Thanks. Ooh That's good too. I like the way function attributes work, but I'm generally concerned that they're used so infrequently that any use of them is confusing.
serene scaffold
knotty cloak
Thanks. Ooh That's good too. I like the way function attributes work, but I'm g...
it would probably make any linter cry
FUNCTYPE DOES NOT HAVE THIS ATTRIBUTE
WHAT HAVE YOU DONE?@
knotty cloak
That's a bonus right?
serene scaffold
I guess
knotty cloak
Have to run, thanks for the help today. Appreciated!
 lean iron
Do you guys suggest any place to learn how to code a really basic ai?
arctic wedgeBOT
:incoming_envelope: :ok_hand: applied mute to @lapis sequoia until <t:1637367057:f> (9 minutes and 59 seconds) (reason: duplicates rule: sent 4 duplicated messages in 10s).
charred stone
Hi, I have a simple classification MLM with 2 classes. However, on the first epoch the accuracy is 76, not 50 percent. The dataset is 2000 images long, so it could t have just gotten lucky. What could be the problem?
I do have trice as many images in the second dataset as the first one, but it should be random and thus 50% regardless
serene scaffold
lean iron
Do you guys suggest any place to learn how to code a really basic ai?
I recommend the book "Data Science from Scratch"
serene scaffold
charred stone
Hi, I have a simple classification MLM with 2 classes. However, on the first epo...
does MLM stand for machine learning model? In either case, what is the architecture, specifically? some kind of neural net?
quiet vault
charred stone
Hi, I have a simple classification MLM with 2 classes. However, on the first epo...
I think it’s just luck
charred stone
serene scaffold
does MLM stand for machine learning model? In either case, what is the architect...
Yes, it’s just a net
im using keras to build it
 serene scaffold
charred stone
im using keras to build it
serene scaffold
charred stone
im using keras to build it
it's easier for everyone to read your code if you use markdown
```py
code
```
that aside, if you run it more than once, is the first epoch always that high?
lapis sequoia
desert oar
I prefer checking the 1st one because i know precisely what i am doing, but i gu...
is the second one worthy to check?
charred stone
serene scaffold
that aside, if you run it more than once, is the first epoch always that high?
yes
quiet vault
I'm not sure but it could be the weight initializer. The weights start the same every time which happens to be good in this occasion
Try chaining the weight initializer on each layer to see if the results vary
desert oar
knotty cloak
Is there a pandas way to set a column to "maximum value before this row" ?
look up "expanding" windows
also this would be a "scan" operation in functional programming jargon
!e ```py
import pandas as pd
print(
pd.Series([3,2,5,1,4])
.expanding()
.min()
)
@desert oar :white_check_mark: Your eval job has completed with return code 0.
001 | 0    3.0
002 | 1    2.0
003 | 2    2.0
004 | 3    1.0
005 | 4    1.0
006 | dtype: float64
i gave you some conditions in which it would make sense
 willow seal
i want to start learning maths related to data science how should i go about it and where do i find the resources. i am in high school grade 11. don't really know anything so if the course expects me to know higher level knowledge it will be tough for me so any course which sort of explains from basics?
arctic wedgeBOT
:incoming_envelope: :ok_hand: applied mute to @brave plover until <t:1637392966:f> (9 minutes and 58 seconds) (reason: duplicates rule: sent 4 duplicated messages in 10s).
 quasi aspen
Guys I think I got myself in some trouble
so there was this engineering competition which i registered in and i had an idea for a project that required ML concepts
so i registered in it, thinking I'll just learn it along the way of working on the device i had to build
thing is
what I didn't realise was ml is actually an extremely extensive topic and it would probably require me 6 months or so to be able to implement it
I have 2 months at most to make the project
plus
my laptop is really really garbage
so it can definitely not run ml
what do?
im gonna use object identification and tracking btw
odd meteor
willow seal
i want to start learning maths related to data science how should i go about it ...
Khan Academy and StatQuest are probably one of the best free online resource to use.
Focus majorly on these topics
Math
- Linear Algebra
- Calculus
- Ordinary Differential Equation (ODE)
Statistics
- Probability
- Probability Mass Function (PMF) Vs. Probability Density Function (PDF)
- Measures of Central Tendency
- Central Limit Theorem (CLT)
- Regression Analysis
- Ordinary Least Square (OLS) vs. Gradient Descent
- Correlation Analysis (Pearson Correlation)
- Problem of Multicolinearity & Autocorrelation
- ANOVA
- Hypothesis Testing
willow seal
thanks ill start to look into these
 dawn garden

hi guys i need to replace the NA values by mean of length based on gender so for m it should take all length values of m and replace it by m length mean
this is what i tried
df[df['Gender']=='M']['Length'].fillna(df[df['Gender']=='M']['Length'].mean())
lapis sequoia
willow seal
i want to start learning maths related to data science how should i go about it ...
Check pinned messages of this channel
lapis sequoia
quasi aspen
so it can definitely not run ml
I mean running ml doesn't seem like a great terminology to me. But anyways you can take help of Google colab to run the heavy algos. It won't take your pc's ram.
quasi aspen
lapis sequoia
I mean running `ml` doesn't seem like a great terminology to me. But anyways you...
okay thanks I'll try that
lapis sequoia
So in formula of attention.
Respectively softmax(Q * K.t) * V
If we take query and key as same. Say for 10 words having dimensions of 20.
So 10x20
Now by doing softmax of Q and K multiplication we will get importance of another word for each.
Which is understood.
But what does it imply to multiply V by it?
Please note that above question is about transformers and I'm following formula from attention is all you need. Please ping me when replied. Thanks.
 weary summit
Hi
I am trying to make a simple insertion in numpy
I have 2d ndarray, let's call it 'blur' of shape (x,y)
I would like to create a new 2d ndarray, let's call it 'expanded', of shape (2x, 2y), containing zeros, but the actual values of the 'blur' array only in even indices of 'expanded'
Meaning:
expanded = { x/2, y/2 are even -> expanded[x,y] = blur[x/2, y/2]
else 0}
I have written the following:
expanded = np.zeros(blur.shape[0]*2, blur.shape[1]*2,)
How do I insert all the values of 'blur' in the even indexes of 'expand'?
tidal bough
lapis sequoia
So in formula of attention.
Respectively `softmax(Q * K.t) * V`
If we take que...
But what does it imply to multiply K by it?
Do you meanVhere?
weary summit
weary summit
Hi
I am trying to make a simple insertion in numpy
I have 2d ndarray, let's call...
I eventually used:
expand[::2, 1::2] = blur
It does the trick, doesn't sure why though
tidal bough
weary summit
I eventually used:
expand[::2, 1::2] = blur
It does the trick, doesn't sure why...
I think you want expanded[::2, ::2] = blur, though, given your original explanation
1::2 would be a slice of all the odd indices
 grave frost
need some quick pandas help 🙏
in my df, I have 7 columns. It is created from a list of lists - so the last 4 columns look like ymin,xmin,ymax,xmax
while the data in above corresponding columns is actually xmin,yminx,xmax,ymax, but they're labelled in the above columns' order which completely spoils the df.
how can I re-arrange all the column data back to xmin,ymin,xmax,ymax, but keeping the column names to ymin,xmin,ymax,xmax?
so, column indices[1] --> new_indices[0], then then last column becomes second-last
grave frost
but that would change the names too, unfortunately
tidal bough
a good old Python
df["ymin"], df["xmin"] = df["xmin"], df["ymin"]
should work
same for the other two, or even for all 4 at once
a more efficient way, though, would probably be to rename them to the right names and then reorder them
tender hearth
!e nope I don't think so...? not sure
import pandas as pd
df = pd.DataFrame({'a': [1, 3, 5], 'b': [2, 4, 6]})

df['a'], df['b'] = df['b'], df['a']
print(df)
@tender hearth :white_check_mark: Your eval job has completed with return code 0.
001 |    a  b
002 | 0  2  2
003 | 1  4  4
004 | 2  6  6
yep
grave frost
oh, so it loses its assignment
lapis sequoia
tidal bough
> But what does it imply to multiply K by it?
Do you mean `V` here?
Aw shit shit shit. Yes. Means V.
Yes i edited it as V now. Thanks.
tidal bough
the explanation I find in a random article is
After “softmaxing” we multiply by the Value matrix to keep the values of the words we want to focus on and minimizing or removing the values for the irrelevant words (its value in V matrix should be very small).
lapis sequoia
I see. Can you share the article? I'm also confused if we take word number x dimensions or dimensions x word number as matrix. Because if it's first one then softmaxing gives relation between words but then we HAVE to have the value having same number of words.
tidal bough

Medium
Detailed implementation of a Transformer model in Tensorflow
tidal bough
To obtain this roles, we need three weight matrices of dimensions k x k
so the article suggests they are just all square
though, hmm
the next paragraph seems to contradict that, lol
lapis sequoia
tidal bough
> To obtain this roles, we need three weight matrices of dimensions k x k
so th...
Which weight matrices? For multiheaded attention?
tidal bough
This sentence is from "The Query, The Value and The Key", where it's still talking about the normal one
lapis sequoia
Oh that is in context of multi attention.
Multi attention has weights. As it says of 3 kind. While attention is just a static multiplication and softmax kind(atleast this one)
Yeah i think they are taking the number of input numbers as output numbers. As in if some line is in 7 words in english, it would be same in spanish too. And the examples at the end also show the same numbers everytime.
tardy jolt
i have an idea for a self sentient machine but i need help in coding anyone interested
?
tender hearth
tardy jolt
i have an idea for a self sentient machine but i need help in coding anyone inte...
Just ask the question
tender hearth
what is your idea?
tardy jolt
a self feeding graph system that feeds itself patterns on regression until it gains causality
feedback self
grave frost
only if it were that simple
grave frost
nor do they have graphs
tardy jolt
true we have neurons that link together to form engrams
basically a storage mechanism
tardy jolt
actually where do you get information to model
we use chemical storage mechanisms called trace engrams
grave frost
temporal lobe 🤷♂️
tardy jolt
correct
there is a theory by jeff hawkins called thousand brains theory on how we model using neocortical columns
 orchid kayak
does it make sense that my evaluation metrics outperformed my training metrics?
and by a good amount as well
grave frost
tardy jolt
there is a theory by jeff hawkins called thousand brains theory on how we model ...
there is yes, and it explains very explicitly that graphs are not the mode of thinking
perhaps you minsinterpreted his statements
odd meteor
orchid kayak
does it make sense that my evaluation metrics outperformed my training metrics?
Evaluation metric should be same for both training, validation, and test set. I suppose you mean to say:
The model performance score of your validation/test set is better than that of your training set.
orchid kayak
odd meteor
Evaluation metric should be same for both training, validation, and test set. I ...
yes that is what I meant to say, thank you for clarifying that
tardy jolt
grave frost
there is yes, and it explains very explicitly that graphs are not the mode of th...
thanks for the advice
odd meteor
orchid kayak
yes that is what I meant to say, thank you for clarifying that
Ok, yeah such situation can occur but in my experience it's not so often. This is because, technically, it's expected that a model will perform much better on the data it was trained on when compared to its performance on any unseen data (validation/test set).
Do verify your model isn't overfitting... If everything is all green then there's no need to be unsettled 😀. It's not a strange scenario.
orchid kayak
Thanks, I'll try and check that. I am in unfamiliar waters here, working with sound data so I am having a hard time with evaluating my own results
wooden forge
Hi everyone, I would like to know how to correctly use FFT for time prediction, I've been trying to do that but I can't get a satisfying result
Basically, I have an array representing the percentage of chance of an event occuring, coded by 0 or 1
and those events are periodic, so I thought the FFT was a good idea
but it doesn't seem correct so far
This plot pretty much shows why i'm upset lol
 desert oar
@wooden forge https://stackoverflow.com/a/28163549
Stack Overflow
For data that is known to have seasonal, or daily patterns I'd like to use fourier analysis be used to make predictions. After running fft on time series data, I obtain coefficients. How can I use ...
wooden forge
Yeah I found that but heh, the code is hard to read lol
litteraly no comments on it so pretty hard to just understand what's going on
desert oar
Fair enough, let me see if I can write up an explanation or find a better demonstration
wooden forge
thank you I truly appreciate
 pulsar needle
hey could anyone help me with Kmeans clustering with sklearn
wooden forge
Meanwhile I'll try to find some stuff
desert oar
@wooden forge The general idea is that you still need to learn a linear trend, and you use the Fourier decomposition to figure out the "seasonal" fluctuation around that trend
serene scaffold
pulsar needle
hey could anyone help me with Kmeans clustering with sklearn
can you be more specific?
desert oar
https://fischerbach.medium.com/introduction-to-fourier-analysis-of-time-series-42151703524a here is a much better writeup
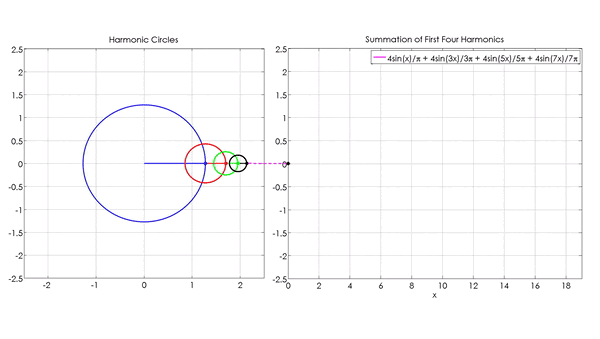
Medium
How to detect seasonality, forecast and fill gaps in time series using Fast Fourier Transform
wooden forge
Sweet, let me read that ^^
desert oar
wooden forge
`learn a linear trend` what does that mean?
literally fit a straight line to the time series: is it going up or down overall, and if so what is the slope?
wooden forge
hu-
You’ve read all your free member-only stories, become a member to get unlimited access. Your membership fee supports the voices you want to hear more from.
pulsar needle
serene scaffold
can you be more specific?
yeah i was just wondering if there was a way to see the labels for the centroids that the model creates (model.cluster_centers_)
desert oar
OK it's not actually that bad but
desert oar
pulsar needle
yeah i was just wondering if there was a way to see the labels for the centroids...
The "label" is just the position in that array. Element 0 is the centroid for cluster 0, etc
also in the future it helps if you ask your specific question upfront, instead of "asking to ask"
lapis sequoia
desert oar
use incognito mode lol
Haha the medium hack!!
desert oar
so @wooden forge you
-
fit a trend line to the data (linear regression of
yagainst time) -
subtract the trend from the data to get a de-trended series
-
take the top few fourier components of the de-trended series and apply inverse fourier transform to those
-
sum the results of 2 and 3: trend + "filtered" fourier
this technique is a special case of the general category of techniques called "time series decomposition"
in this case you decompose into a "trend component" and a "seasonal component"
wooden forge
so np.polyfit gives a trend line of my input data ?
desert oar
well that is how they are using it
it does more than that in general
as an exercise, read the documentation for it and try to figure out how to use it to fit a trend line
wooden forge
it's like a normalisation method to apply the fft afterwards ?
desert oar
I think if you didn't remove the trend from the data, it would mess up the fourier decomposition results
wooden forge
or do you apply the trend line to the fft?
desert oar
you compute the trend line in order to compute the fourier transform on the de-trended data
wooden forge
okay I get it
desert oar
so yes I guess you could say that you "apply" the trend line to the result of the inverse fourier transform, by adding them together
wooden forge
Alright, I have to test that out, i'll need some time, and then tell you how it went ^^
desert oar
literally elementwise +
wooden forge
thanks salt !
desert oar
you're welcome, I think a great exercise would be to re-implement that code but with better comments and variable names
willow seal
wrong place btw
hollow sentinel
does anyone here know rapid miner
or can point me to a community w rapid miner ppl
i have some questions
servers
not communities
lapis sequoia
Hello guys,
Im using the below code to filter yearwise data like this:
papers_1987_1988 =papers[papers["year"] == 1987]
How do i include another year in this same filter?
I want to filter out both 1987 and 1988 data
If i use like this : papers_1987_1988 =papers[papers["year"] == 1987 | 1988]
the count i am getting is not correct
never mind, i got it. the answer would be : papers_1987_1988 =papers[(papers["year"] == 1987) | (papers["year"] == 1988)]
 calm thicket
you used [] not ()
hollow sentinel
ohh thank you
sometimes my eyes just
miss it
ValueError: could not convert string to float: 'Flat'
this is strange
i thought i dropped the string values in my dataframe
nvm
i had to reload the block where i actually dropped the columns
it's just weird to me how jupyter runs in blocks
the term isn't blocks
i think it's kernels?
can you run the entire thing instead of just running separate kernels?
calm thicket
they're supposed to let you redesign or whatever quickly
and yes, there should be an option for that somewhere
hollow sentinel
yay guys i did it
wooden forge
desert oar
you're welcome, I think a great exercise would be to re-implement that code but ...
I don't remember why I was doing this. basically I jusy smoother the signal by keeping certain frequencies

but why did I do that I don't know
https://fischerbach.medium.com/introduction-to-fourier-analysis-of-time-series-42151703524a I was following this website lol
(the one you shared)
wooden forge
btw @desert oar what level of regression do you recommand with the polyfit method ?
Welp

I don't see how I can predict anything from that
the problem with the detrend is that the trend line is way too small to have any impact
wooden forge
So it doesn't change from what I did
 marble niche
I am having trouble defining a window alias on a MySQL database. Where exactly do I define the alias in the query? I have the following query: ```sql
SELECT
YEARWEEK(payment_date) AS payment_week,
SUM(amount) AS week_total,
ROUND(
(SUM(amount) - LAG(SUM(amount), 1) OVER prev_wk_tot)
/ LAG(SUM(amount), 1) OVER prev_wk_tot
* 100,
1) AS pct_diff
FROM
payment
GROUP BY
yearweek(payment_date)
WINDOW prev_wk_tot AS
(ORDER BY yearweek(payment_date))
ORDER BY 1;
In MySQL's official documentation, it states "...a WINDOW clause falls between the positions of the HAVING and ORDER BY clauses..."
wooden forge
Like SELECT Something AS smt?
marble niche
wooden forge
Like `SELECT Something AS smt`?
No but it is similar
I want to define an alias for a window
If you download a MySQL server on your local machine you can play around with the sakila database
marble niche
marble niche
If you download a MySQL server on your local machine you can play around with th...
That is how I learned
It should be pretty easy to get set up with the installer
desert oar
wooden forge
I don't see how I can predict anything from that
What are those huge values from? Are those some kind of measurement error? If so you should probably remove them from the time series entirely and then re-interpolate with fourier
also polyfit is just a polynomial
so if you want to fit a quadratic, use degree 2
Unless you have a good reason to believe otherwise, either linear or flat is fine
 simple ivy
hey all  does anyone know how to convert a pytorch model to a tensorflow model? ive tried a lot of tutorials online but none have worked so far 😦
serene scaffold
simple ivy
hey all <:DogWave:817121778467340349> does anyone know how to convert a pytorch...
I think you'd have to know the architecture of the pytorch model and rewrite it in tensorflow.
wooden forge
desert oar
What are those huge values from? Are those some kind of measurement error? If so...
Ho. Well, the spikes in blue are actually the original datas. For each day I assign 0 or 1 is the event happen or not that's all
If you look at the legend it says "real value" because it's the actual value I have in real life
simple ivy
serene scaffold
I think you'd have to know the architecture of the pytorch model and rewrite it ...
why did i think it was as easy as converting the .pth file to something else  😭
😭
wooden forge
desert oar
Unless you have a good reason to believe otherwise, either linear or flat is fin...
Oki. Well thing is it's so small that it doesn't have any real impact
serene scaffold
simple ivy
why did i think it was as easy as converting the .pth file to something else <a:...
oh, if you're talking about a saved version of a trained model, you'd have to re-build the model and then train it.
simple ivy
serene scaffold
oh, if you're talking about a saved version of a *trained* model, you'd have to ...
ah, so rebuilding the model in tensorflow and retraining?
serene scaffold
simple ivy
ah, so rebuilding the model in tensorflow and retraining?
yes. my guess is that the way trained models get saved is unspecified (meaning that programs other than pytorch can't depend in pytorch models being saved a certain way and thus be able to "crack them open")
simple ivy
serene scaffold
yes. my guess is that the way trained models get saved is unspecified (meaning t...
yeah, that makes sense! thanks for the help 🙂
serene scaffold
simple ivy
yeah, that makes sense! thanks for the help 🙂
Sorry I didn't have better news
desert oar
wooden forge
Oki. Well thing is it's so small that it doesn't have any real impact
I would look into either transforming your data to reduce the scale, or removing those outliers