#data-science-and-ml
1 messages · Page 353 of 1
 lone drum
 dusk iris
Not sure why this is happening temp_r, temp_g, temp_b = pixel ValueError: too many values to unpack (expected 3)
 rigid zodiac
lone drum
can i share you my dataframes ?
rigid zodiac
lone drum
can i share you my dataframes ?
can you take a screen shot of it and attach here
 odd meteor
dusk iris
Not sure why this is happening ```temp_r, temp_g, temp_b = pixel
ValueError: too...
odd meteor
dusk iris
Not sure why this is happening ```temp_r, temp_g, temp_b = pixel
ValueError: too...
Fixed
lone drum
rigid zodiac
can you take a screen shot of it and attach here
sure give a min
lone drum
rigid zodiac
can you take a screen shot of it and attach here
this is my first df ss call_expiry_data df
 rigid zodiac
lone drum
this is my first df ss `call_expiry_data` df
rigid zodiac
lone drum
this is my first df ss `call_expiry_data` df
what do you want to do with it?>
lone drum
this is my second put_expiry_data df

this is my last and third month_exp_5_min df

i want to take one row from month_exp_5_min this df at a time at fetch from call_expiry_data df and put_expiry_data df
lone drum
lone drum
i want to take one row from `month_exp_5_min ` this df at a time at fetch from `...
@rigid zodiac do u get my point here ?
rigid zodiac
basically you are trying to combine the columns together?
dusk iris
odd meteor
Fixed
Eh i cant get it to work for some reason xD
lone drum
for e.g in this i want to take new_time column and atm_strike_price column value and search in call_data_df and put_data_df (other 2 df)
 lone drum
for e.g in this i want to take `new_time` column and `atm_strike_price` column v...
lone drum
lone drum
for e.g in this i want to take `new_time` column and `atm_strike_price` column v...
@rigid zodiac
rigid zodiac
I think you will need to match or make sure the time frame is match in the Month_exp_5_min df
then I would combine them together
lone drum
this row from another dataframe to be fetched and same for another dataframe
 rigid zodiac
then I would search:
df[ df[time] == #what ever time you want
rigid zodiac
lone drum
this row from another dataframe to be fetched and same for another dataframe
you can combine df, so I dont think that would be an issue
May wanna convert the date_time to make it short
lone drum
rigid zodiac
you can combine df, so I dont think that would be an issue
can u exaplin a bit here which df i can combine with ?
rigid zodiac
Combine all of the df, i.e. the df of call, put and expiration. Only take the necessary columns (since some of it is repeat)
lone drum
rigid zodiac
Combine all of the df, i.e. the df of call, put and expiration. Only take the ne...
if u see in month_exp_5 min df i have to take values from that df and based on that i have search in other df do u get my point here ?
rigid zodiac
lone drum
if u see in `month_exp_5 min` df i have to take values from that df and based on...
That's why I told you to make sure the month_exp_5min match
since some of the data is missing
you can create row and give it empty value
lone drum
rigid zodiac
That's why I told you to make sure the month_exp_5min match
match with what ? other df's?
rigid zodiac
Match it with the call df and put df
 dapper hatch
I have 1 list and I need to put each of the "DATA_" in a 5 x 4 matrix and in the first position each element of the list. How can I do it ?
resultado = 10

lista_2 = [('DATO_UNO',), ('DATO_DOS',), ('DATO_TRES',('DATO_CUATRO',), ('DATO_CINCO',)]
okay so what i can do with month_exp_5_df ?
 rigid zodiac
 normal violet
odd score
normal violet
very
odd meteor
normal violet
can someone help me comprehend this tomfoolery
You did a 3-fold cross validation on your model and that's the score you were shown. Meanwhile, your model is underfitting.
normal violet
odd meteor
You did a 3-fold cross validation on your model and that's the score you were sh...
That makes sense, how to fix?
odd meteor
dusk iris
Eh i cant get it to work for some reason xD
What's the error you got?
odd meteor
normal violet
That makes sense, how to fix?
You need to increase the complexity of your model to reduce the high bias in your model.
dusk iris
KeyError: "None of [Index(['scaled_red', 'scaled_blue', 'scaled_green'], dtype='object')] are in the [columns]"
if i remove double [] near scaled ones i get KeyError: ('scaled_red', 'scaled_blue', 'scaled_green')
normal violet
odd meteor
You need to increase the complexity of your model to reduce the high bias in you...
Could you kindly elaborate on how to do this
 hearty briar
feature engineering
rigid zodiac
anyone know how to create custom length array?
normal violet
hearty briar
feature engineering
Sorry, very new to datascience, could you provide an example?
hearty briar
yeah I think what emrys is saying is that you need to add things for the model to use to help evaluate things
which is to say there's too little features/information/complexity for it to use to evaluate correctly
the concept of adding/removing/modifying features in datasets is referred to as feature engineering
you want to find the balance between too much and too little information
to avoid underfitting/overfitting
does that make sense?
odd meteor
dusk iris
```KeyError: "None of [Index(['scaled_red', 'scaled_blue', 'scaled_green'], dtyp...
I've updated the code. Try it again and let me the outcome.
@dusk iris ensure you indent yours accordingly.
odd meteor
dusk iris
You updated the old block of code?
I updated the for loop of num_clusters
 odd meteor
normal violet
umm can i dm someone for help im extremely confused
odd meteor
normal violet
umm can i dm someone for help im extremely confused
What's confusing you?
odd meteor
normal violet
how can i improve this
There's no one way to do this. You just gotta try out alotta stuffs and see which works best. You could :
- Increase your dataset (if there's more available)
- Include more paramaters, expand the search space of your GridSearch (It gets computationally expensive as your search space increases)
- Do feature selection
- Try out other 2-3 algorithms, then compare and contrast
- Try some ensemble tricks
- Much more...

 vocal yew
Is anybody able to help in #help-avocado regarding potentially running a multiple linear regression
 cobalt jetty
normal violet
cobalt jetty
normal violet
You likely have an issue with the order of your data. Check if you haven't sorted one of your axis by the index of the datapoints for instance.
 orchid kayak
Hi I have a question: I am currently executing a loop (length 8732) where in each interval I am loading a wav file and appending it to an array. I am executing it on google colab. Does it make since that it take it incredibly long to execute?
I am trying to build a model program from scratch (using tenserflow) and I was taught in a way which requires a dataset, that is why I am loading all those WAVs
 serene scaffold
orchid kayak
Hi I have a question: I am currently executing a loop (length 8732) where in eac...
serene scaffold
orchid kayak
Hi I have a question: I am currently executing a loop (length 8732) where in eac...
yes, I imagine this would take a long time. can you do it in such a way that only one wav needs to be loaded at a time?
keep in mind that a loop does not "exist" and does not have a length. the container that you are iterating over probably does.
orchid kayak
serene scaffold
yes, I imagine this would take a long time. can you do it in such a way that onl...
Yes that is what I am doing. I have 8732 WAVs, so I made a for loop with that length that loads and appends the WAV files
serene scaffold
orchid kayak
Yes that is what I am doing. I have 8732 WAVs, so I made a for loop with that le...
can you show the code?
I assume when you said "appending it to an array", you are actually referring to a list. but if you are appending to an array, that works out to be much much slower.
orchid kayak
I have to append to a numpy array because later on in the module I will work with numpy arrays.
I will send the code as soon as it finishes running (I had some other issues with it which meant that I only started executing it now)
serene scaffold
orchid kayak
I have to append to a numpy array because later on in the module I will work wit...
those two propositions don't follow. You can convert back and forth between a list and an array as needed
orchid kayak
It was never a python list
serene scaffold
if you're repeatedly appending, it needs to be a list.
appending to an array returns a new array, and involves copying over the entire array first
so the amount of work gets larger and larger with each append.
orchid kayak
I do believe that is the exact thing that is happening.
serene scaffold
I would kill the program and approach it differently. For all we know it could take days or even weeks
orchid kayak
I had not realized that.
serene scaffold
it might never finish before the death of the universe 
orchid kayak
I doubt that, it already did a good amount
serene scaffold

serene scaffold
can you show the part of the code where you load the data and append it to the list array?
!code
 arctic wedgeBOT
Here's how to format Python code on Discord:
```py
print('Hello world!')
```
These are backticks, not quotes. Check this out if you can't find the backtick key.
orchid kayak
sound_path = "/content/drive/My Drive/Data/UrbanSound8k" # The base path which has 10 folders, each with a certain amount of WAV files
iterable = len(os.listdir(sound_path)) - 1 # Sets the amount of folders in the base path in case it changes (it has a -1 because there is a constant CSV file there)
train_data = np.array(1, dtype=np.int32) # The np array which holds the WAV file data
train_data_sample_rate = np.array(1) # Holds the sample rate data, needed later for mfccs
sum_data = 0 # Sums the rows, since in the CSV file they are followed consecutivley while in the folders they are seperate

for i in range(iterable + 1): # Loops over the 10 folders
  sound_files_path = sound_path + '/fold'+ str(i + 1)

  for j in range(len(os.listdir(sound_files_path))):
    train_label = train_labels[sum_data + j:(sum_data + j + 1)]
    train_label_class = list(train_label['slice_file_name'])

    sound_file_path = sound_files_path + '/'+ train_label_class[0]
    rate, raw_data = lb.load(sound_file_path)

    np.append(train_data, raw_data)
    np.append(train_data_sample_rate, rate)
  sum_data = sum_data + j + 1
thanks
sound_path = "/content/drive/My Drive/Data/UrbanSound8k" # The base path which has 10 folders, each with a certain amount of WAV files
iterable = len(os.listdir(sound_path)) - 1 # Sets the amount of folders in the base path in case it changes (it has a -1 because there is a constant CSV file there)
# train_data = np.array(1, dtype=np.int32) # The np array which holds the WAV file data
train_data = []
train_data_sample_rate = []
# train_data_sample_rate = np.array(1) # Holds the sample rate data, needed later for mfccs
sum_data = 0 # Sums the rows, since in the CSV file they are followed consecutivley while in the folders they are seperate

for i in range(iterable + 1): # Loops over the 10 folders
  sound_files_path = sound_path + '/fold'+ str(i + 1)

  for j in range(len(os.listdir(sound_files_path))):
    train_label = train_labels[sum_data + j:(sum_data + j + 1)]
    train_label_class = list(train_label['slice_file_name'])

    sound_file_path = sound_files_path + '/'+ train_label_class[0]
    rate, raw_data = lb.load(sound_file_path)

    train_data.append(raw_data)
    train_data_sample_rate.append(rate)
  sum_data = sum_data + j + 1

train_data = np.array(train_data, dtype=np.int32)
train_data_sample_rate = np.array(train_data_sample_rate)
well it append if it is not a numpy array?
serene scaffold
orchid kayak
well it append if it is not a numpy array?
yes, you can append to lists
and as you see, we turn them into arrays at the end
orchid kayak
yes
It does appear to run faster albeit by not so much
thanks for the assistance
after almost finishing the second folder, it is actually a lot faster.
orchid kayak
serene scaffold
so the amount of work gets larger and larger with each append.
This is 100% what was causing the issue
I could see with each new folder how the loop became slower
serene scaffold
import pathlib

sound_path = pathlib.Path("/content/drive/My Drive/Data/UrbanSound8k")
iterable = len(os.listdir(sound_path)) - 1
train_data = []
train_data_sample_rate = []

sum_data = 0

for i, directory in enumerate(sound_path.iterdir()):
    if not directory.is_dir():
        continue
    sound_file_dir = directory / 'fold' / str(i + 1)
    for j, sound_file in enumerate(sound_file_dir.iterdir()):
        train_label = train_labels[sum_data + j:(sum_data + j + 1)]
        train_label_class = list(train_label['slice_file_name'])

        rate, raw_data = lb.load(sound_file_dir / train_label_class[0])

       train_data.append(raw_data)
       train_data_sample_rate.append(rate)
  sum_data = sum_data + j + 1

train_data = np.array(train_data, dtype=np.int32)
train_data_sample_rate = np.array(train_data_sample_rate)
this is intended to do the same thing
might even be possible to make it more succinct.
orchid kayak
thank you so much for all of your help!!
 hasty mountain
Can someone recommend a tutorial about how to install and train Tacotron2/NVidia's Flowtron?
I wanted to generate audio based on a dataset I got here, but I'm having difficulties on how to do that following their GitHub tutorial...
PS: I don't want to use a premade voice, I want to use the voice that's used in my dataset. I suppose I'll have to train the model from scratch.
 sand aurora
Hello everyone, I have a question about pandas Series. Can I ask it here? I am new to Python Discord. Thank you.
 austere swift
yes, you can
 placid heath
what is your question
 boreal pollen
Hello everyone, how can I check if there is some element in the array?
import numpy as np
years = np.arange(1900, 2020+1, 1)
interclary_years = list(filter(lambda i: i % 4 == 0, years))
print(f"Interclary years are: {interclary_years}")
year = int(input("Enter any interclary year: "))
for i in interclary_years:
 placid tendon
hello does anyone here use carla simulator because tutorial.py isn't working for me due to client = carla.Client('localhost', 2000) not working
serene scaffold
!e
import numpy as np
years = np.arange(1900, 2021)
result = years[years % 4 == 0]
print(result)
@serene scaffold :white_check_mark: Your eval job has completed with return code 0.
001 | [1900 1904 1908 1912 1916 1920 1924 1928 1932 1936 1940 1944 1948 1952
002 |  1956 1960 1964 1968 1972 1976 1980 1984 1988 1992 1996 2000 2004 2008
003 |  2012 2016 2020]
@boreal pollen is that what was wanted?
Also, numpy is usually used for scientific computing. you usually don't mix numpy and constructions like list(filter(...))
 lime ocean
Does anybody know how K-fold validation works? I am a bit confused about why developing 5 different models and testing them all individually would be helpful.
Do we just pick the most accurate model and ditch the rest? Or do we try to stitch them together somehow?
It seems like if we try to stitch them together somehow we end up with a new, untested model that we don't have stats for. But if we just pick the most accurate model we are more likely to just be getting lucky, so our validation stats are probably less meaningful.
 velvet thorn
lime ocean
Does anybody know how K-fold validation works? I am a bit confused about why dev...
velvet thorn
lime ocean
Does anybody know how K-fold validation works? I am a bit confused about why dev...
okay
so basically
you want to answer the question "how does my model perform on unseen data"?
and you want high confidence in the result.
lime ocean
yeah, makes sense so far
velvet thorn
sorry got distracted
anyway
you could do that
with a single train/test split
but then the dependence on the quality of the split is higher
K-fold validation is simply train-test splitting repeated
velvet thorn
lime ocean
Do we just pick the most accurate model and ditch the rest? Or do we try to stit...
you generally don't use any of them
you probz want to retrain on the whole thing
lime ocean
and then if we see good results we can re-train the model with the entire dataset and assume it's good?
oh, ok
lime ocean
that was what I was stuck on, makes sense
velvet thorn
(part of the reason for K-fold validation is also hyperparameter tuning)
(and then the holdout set is to make sure you don't overfit those)
velvet thorn
lime ocean
It seems like if we try to stitch them together somehow we end up with a new, un...
not all models can be meaningfully ensembled in that way
have you heard of
model stacking?
there are ways to combine models, but this probz isn't what you're thinking of
still, good to know
velvet thorn
lime ocean
Is that kinda what deep learning does?
can you elaborate on why you say that
uh
not necessarily.
okay I have to go but
Google should help you
lime ocean
thanks for the help, cya
velvet thorn
check out "model ensembles"
and look into specifically random forests (very simple example, using bagging)
serene scaffold
velvet thorn
model stacking?
Is that when you use more than one model, but each does something different? (As opposed to models making potentially conflicting predictions and deciding which to listen to)
velvet thorn
serene scaffold
Is that when you use more than one model, but each does something different? (As...
kind of, yes
the models are linked linearly
so the output of model n is used as the input of model n + 1
serene scaffold
@velvet thorn so it's like having a dense neural network, but the layers aren't necessarily arrays
It could be any model you want
velvet thorn
serene scaffold
<@171929073063297024> so it's like having a dense neural network, but the layers...
ish
well, not necessarily linearly
could be a graph, in theory, I guess
 misty flint
 lone drum
Hello
I have 2 data frames
In one of dataframs i have new_time and atm_strike_price columns
I want take values of these column and fetch same data from another data frame
How I can do this?
Ping me when replying
 quasi parcel
Hi everyone, i hope everyone are doing well, i have a problem with df.to_sql
df.to_sql('table_name', engine, if_exists='replace')```
when i did this the table is getting altertedcan anyone help me with this
the table schema is getting altered
 rotund trellis
i am trying to create an MLP using Python OpenCV but i get this error. Any idea how to set the layer

 tight glacier
does a variable with 4 values have a greater maximum entropy(information) than one with only 3 values?
pls help
 limpid oak
can somebody help with regex format
I have number
1976655
need to covert 19.76655
lone drum
my df this way in last column atm_strike_price i want to remove one zero from each row so i get 8950 ping me whn replying.

 fleet prism
Can someone figure what sort of model this uses? https://tfhub.dev/google/magenta/arbitrary-image-stylization-v1-256/2
 mossy kite
My model predicts Y and takes X[] as input. It depends on the last X states to predict next Y. I can only predict one step ahead. How do I extend this?
Do I need to also predict next state of X[]
 ripe forge
Might be easier to explain if you make an example, but yes that seems like one way to do it
serene scaffold
mossy kite
My model predicts Y and takes X[] as input. It depends on the last X states to p...
can you show the code?
!code
arctic wedgeBOT
Here's how to format Python code on Discord:
```py
print('Hello world!')
```
These are backticks, not quotes. Check this out if you can't find the backtick key.
ripe forge
Another would be to train a model to predict from X[] of some older time, and give it an offset that it learns from
 mighty spoke
Hi I'm having some difficulty with plotting my graph it is meant to be a mess as its unbinned however it does not look right as all the points are connected with lines
 rotund trellis
X_for_ML = np.reshape(image_features, (x_train.shape[0], -1))
rotund trellis
rotund trellis
X_for_ML = np.reshape(image_features, (x_train.shape[0], -1))
what is the function of writing reshape() in this way...I am having a hard time understanding as to what action is being performed on X_for_ML.
mossy kite
rotund trellis
what is the function of writing reshape() in this way...I am having a hard time ...
https://numpy.org/doc/stable/reference/generated/numpy.reshape.html
Puts the data into the form expected by your model
Are you following a tutorial somewhere?
 tidal bough
mighty spoke
Hi I'm having some difficulty with plotting my graph it is meant to be a mess as...
tidal bough
mighty spoke
Hi I'm having some difficulty with plotting my graph it is meant to be a mess as...
Do you want no lines? Use scatter instead of plot, then
 gritty sinew
Hi, has anyone used mplfinance to plot candlestick graphs?
I'm facing an issue with that library
rotund trellis
mossy kite
Are you following a tutorial somewhere?
No, I am using a code online for a project am working on…
mossy kite
gritty sinew
I'm facing an issue with that library
What's the issue?
gritty sinew
When I try to plot tables using matplotlib after using mplfinance plotting, I find these black borders around my table plot. It messes up my whole alignment when I try to merge that table image within other images.
As long as my mplfinance plot is not called, the table plots properly. After the first instance of mplfinance plot being called, all following table plots are messed up
fig, axes = mpf.plot(df, type='candle', returnfig=True)
This is how I call the plot function
  def render_mpl_table(data, title, col_width=8.0, row_height=3, font_size=38,
                     header_color='#327a81', row_colors=('#daeff1', '#f0f7f6'), edge_color='w',
                     bbox=(0, 0, 1, 1), header_columns=0,
                     ax=None, **kwargs):
    if ax is None:
        size = (np.array(data.shape[::-1]) + np.array([0, 1])) * np.array([col_width, row_height])
        fig, ax = plt.subplots(figsize=size)
        ax.axis('off')
        ax.set_title(title, fontsize=42, weight='bold', color=header_color, pad=6, y=1.05)

    mpl_table = ax.table(cellText=data.values, bbox=bbox, colLabels=data.columns, **kwargs)
    mpl_table.auto_set_font_size(False)
    mpl_table.set_fontsize(font_size)

    for k, cell in mpl_table._cells.items():
        cell.set_edgecolor(edge_color)
        if k[0] == 0 or k[1] < header_columns:
            cell.set_text_props(weight='bold', color='w')
            cell.set_facecolor("#327a81")
            cell.set_fontsize(34)
        else:
            if k[1] != 0:
                value = float(data.iloc[k[0] - 1, k[1]].replace(',', ''))
                if value < 0:
                    cell.set_text_props(weight='bold', color="#d66954")
                    cell.set_facecolor(row_colors[k[0] % len(row_colors)])
                else:
                    cell.set_text_props(weight='bold', color="#2db353")
                    cell.set_facecolor(row_colors[k[0] % len(row_colors)])
            else:
                cell.set_text_props(weight='bold')
                cell.set_fontsize(32)
                cell.set_facecolor(row_colors[k[0] % len(row_colors)])
    return ax.get_figure(), ax
This is the code I use to generate my mpl table
mighty spoke
tidal bough
Do you want no lines? Use `scatter` instead of `plot`, then
Hi I'm trying to use scatter but it keeps saying ValueError: x and y must be the same size, I've tried making them both 1d arrays but its still not working
mossy kite
mighty spoke
Hi I'm trying to use scatter but it keeps saying ValueError: x and y must be the...
What is the return of print(len(x), len(y))
I suspect you'll find one is longer than the other
Make them the same length and it should work
oh and if they're pandas dataframes you'll use df.size I think instead of len
or just use debugger which is probably the better way to inspect them
mighty spoke
mossy kite
What is the return of print(len(x), len(y))
ahh yes I used print(x.size,y.size) and its 195, 38025 respectively but len(x) and len(y) are both 195, I suspect my y points are (195,195)
but i'm still not sure how to make my y points 195 as I used a loop, would you like to see it?
mossy kite
mighty spoke
but i'm still not sure how to make my y points 195 as I used a loop, would you l...
You want to only use the 195 points of each?
mossy kite
mighty spoke
but i'm still not sure how to make my y points 195 as I used a loop, would you l...
yes
You should be able to use arr[:195] to pass in only the first 195 points from the array that's too long?
mighty spoke
mossy kite
You want to only use the 195 points of each?
yh my loop is supposed to print only 195 values but i'm not sure why its 195 by 195 `import pandas as pd#import pandas package to read data more easily
import matplotlib.pyplot as plt#imported pyplot to plot graphs
import datetime as dt#date time to read first column of csv file
import numpy as np
from datetime import datetime
from scipy.stats import binned_statistic
df = pd.read_csv('FREY.csv')
df2 = pd.read_csv('SLI.csv')
pd.to_datetime(df["Date"]).dt.strftime("%d%m%Y")#reads the date time objects
pd.to_datetime(df2["Date"]).dt.strftime("%d%m%Y")
df['Date'] = pd.to_datetime(df['Date'])
df2['Date'] = pd.to_datetime(df2['Date'])
x1=(df['Date'] - dt.datetime(1970,1,1)).dt.total_seconds()/86400
x2=(df2['Date'] - dt.datetime(1970,1,1)).dt.total_seconds()/86400
t0=[]
def lag(x1,x2,t0):
for i in range(len(x1)):
for j in range(len(x2)):
t=x2[j]-x1[i]
if x2[j]==x2[0]:
x2[j]+=1
if x2[j]==x2.iloc[-1]:
x1[i]+=1
t0.append(t)
return [lag, t0]
d0=[]
def udcf(x1, x2, d0):
x_mean = np.mean(x1)
y_mean = np.mean(x2)
x_stdv = np.std(x1)
y_stdv = np.std(x2)
for i, x_val in enumerate(x1):
for j, y_val in enumerate(x2):
x2_new=t0+x2[j]
d = (x_val - x_mean) * (x2_new - y_mean) / (x_stdv*y_stdv)
d0.append(d)
return [udcf, d0]
Tau=lag(x1,x2,t0)[1]
y0 = udcf(x1,x2,d0)[1]
y=np.array(y0)
x=np.array(Tau)
print(y.size, x.size)
plt.plot(x,y, ls='-', lw='1', color='red', marker='')
plt.title('UDCF vs Lag')
plt.xlabel('time lag \u03C4')
plt.ylabel('UDCF_ij')
plt.show()
`
mossy kite
And which line gives you this error @mighty spoke
mighty spoke
mossy kite
And which line gives you this error <@!761588935616102422>
Hi so def udcf is printing the y values and when i'm trying to plot it which gives me the error
mossy kite
mighty spoke
Hi so def udcf is printing the y values and when i'm trying to plot it which giv...
x and y need to be the same length
if one array is longer you can just give it the first n points from the longer one
i.e plt.plot(x, y[:195]) etc
if x is length 195
If they're supposed to be the same length already at that step youve got a bigger issue @mighty spoke
@mighty spoke All fixed?
mighty spoke
mossy kite
<@!761588935616102422> All fixed?
Hi @mossy kite I'm trying to fix my loop but its just not working :/
because they are are both meant to be the same dimensions
mossy kite
@mighty spoke Whats your overall goal here
So I can understand the problem and your approach
Are you performing feature analysis
looking for a correlation
mighty spoke
yh thats right
so at the moment i'm trying plotting the udcf function (unbinned dcf) then I will bin it to get the dcf function to perform statistcs and analysis on it
but at the moment i'm trying to print the udcf values and the corresponding time lag values
mossy kite
And something is going wrong as you preprocess your data set? You expect two equal length arrays but one is much longer
mighty spoke
yhh thats right one of them is (195,) and the other is (195,195)
mossy kite
Scatter can't work without matching x,y points
Do you need both arrays in the second one
or is only one the one you need
Maybe that's where it's gone wrong? @mighty spoke
df.keys shows the columns inside the dataframe
maybe you're trying to give it one 1D array and one 2D array?
needs two 1d array for scatter
mighty spoke
mossy kite
Do you need both arrays in the second one
what do you mean my both arrays in the second one?
mighty spoke
mossy kite
maybe you're trying to give it one 1D array and one 2D array?
yhh i think thats the problem
mossy kite
Give it just one of the 1D arrays from y
y["arr1"]
like that I think
assuming one of them is the data you need
mighty spoke
mossy kite
y["arr1"]
ohh i see but the y values are supossed to correspond to the x values but i'm not sure why its not printing 1d array for y values
mossy kite
mighty spoke
ohh i see but the y values are supossed to correspond to the x values but i'm no...
If it's an error in how it was generated that's more difficult for me to solve
I only really know what it's expecting for a scatter plot
and how to pass that in from a pandas df
Could the 2D array be the matching X and Y points? @mighty spoke
and the first array is something else you don't need
mighty spoke
mossy kite
Could the 2D array be the matching X and Y points? <@!761588935616102422>
so the udcf function is iterating through all the x1 and x2 points which should be the same length as the x values which is the first array
mossy kite
mighty spoke
so the udcf function is iterating through all the x1 and x2 points which should ...
Have you tried using the debugger in something like pycharm?
mighty spoke
oh whats that
mossy kite
It sounds like a generic suggestion but it's extremely useful
you can stop at any point and look at every variable in detail
to see exactly whats going on in your loops and code
Sometimes that's the only way to solve something like this
mighty spoke
mossy kite
It sounds like a generic suggestion but it's extremely useful
i see thanks @mossy kite
also on a side note
would you know why when I print this this list its empty?
t0=[] def lag(x1,x2,t0): for i in range(len(x1)): for j in range(len(x2)): t=x2[j]-x1[i] if x2[j]==x2[0]: x2[j]+=1 if x2[j]==x2.iloc[-1]: x1[i]+=1 t0.append(t) return lag print(t0)
mossy kite
mighty spoke
`t0=[]
def lag(x1,x2,t0):
for i in range(len(x1)):
for j in range(le...
to be honest no
that's where the debugger again is invaluable
you can step through one line at a time and watch what everything is doing
and you'll likely quickly see why the result isn't what you expect
mossy kite
 hardy moat
someone know how can i install mediapipe?
hardy moat
someone know how can i install mediapipe?
pip install mediapipe
hardy moat
mossy kite
pip install mediapipe
yes its dosent work for some reson
mossy kite
hardy moat
yes its dosent work for some reson
Need specific error
hardy moat
i asowme at first that was my python version but according to githun its need to be below 3.9
mossy kite
hardy moat
i asowme at first that was my python version but according to githun its need to...
You on windows?
hardy moat
mossy kite
You on windows?
yes i am
mossy kite
I'd install anaconda for data science under windows
I got tired of dealing with all the bs trying to use the regular distributions of python
once I did that, everything just worked and I could focus on my actual problems
highly recommend it
hardy moat
mossy kite
I'd install anaconda for data science under windows
ok alredy on this
mossy kite
perfect
you'll never look back
I just tested it with no issues btw so double check your configuration
and post me the full error if you can
On windows 10 here
hardy moat
i dont so sure what is annaconda i know its helps for aI
mossy kite
hardy moat
i dont so sure what is annaconda i know its helps for aI
it's a distribution of python with its own package manager and most of the stuff you'd want/need for data science included
I'd get rid of your python now and just move to that
I wasted so much time trying to get stuff working before I switched over
hardy moat
mossy kite
and post me the full error if you can
pip install mediapipe
ERROR: Could not find a version that satisfies the requirement mediapipe (from versions: none)
ERROR: No matching distribution found for mediapipe
mossy kite
Now I can focus on my projects instead
hardy moat
ok thanks
mossy kite
hardy moat
ok thanks
https://github.com/google/mediapipe/issues/1325
check here maybe
rigid zodiac
Hi everyone, I'm looking for to combine / append a bunch of numpy files. So far I was success to combine it. However it change my numpy structure. Can some one please check my code
arctic wedgeBOT
:incoming_envelope: :ok_hand: applied mute to @tranquil basin until <t:1636744250:f> (9 minutes and 58 seconds) (reason: duplicates rule: sent 4 duplicated messages in 10s).
serene scaffold
rigid zodiac
Hi everyone, I'm looking for to combine / append a bunch of numpy files. So far ...
It's not clear what you mean by "numpy files" and "change the numpy structure". Did you concatenate several arrays, and now you want to reshape it?
 hardy berry
So i'm trying to make a NLP program - I wanna tokenize a list of words but the program is unable to. The list here is called "emotions" and it is appending it into "outcomes". The result i'm getting is all 0's - there is no problem with the raw data.
It's the last for loop - please help me out here
import pandas as pd #Pandas is a python library which we use to analyze data
import spacy #This is a natural language processing library which we use

raw_data = pd.read_csv("C:/Users/DELL/Documents/emotions.csv") #We are reading a CSV file with the database
raw_data.columns = ["Emotion","Sentence"] #Adding column names to the pandas

sentences = list(raw_data["Sentence"]) #Converting all the sentences into a list
emotions = list(raw_data["Emotion"]) #Converting all the emotions into a list

pipeline = spacy.load("en_core_web_sm") #This is the NLP Pipeline - with this we can do all NLP applications

features = []
outcomes = []

for sentence in sentences: #Going through every sentence inside the sentences
    temporary_sentence = [] #A list used temporarily to store the values for each individual sentence
    nlp_one = pipeline(sentence) #Applying the NLP Pipeline
    for token in nlp_one: #Tokenization
        temporary_sentence.append(token.idx) #Token.idx applies a number to each word. We are putting these into a temporary sentence
    features.append(temporary_sentence) #Adding the temporary sentence into the main features list
    temporary_sentence = [] #Clearing out the temporary sentence

for emotion in emotions: #Performing the same NLP pipeline, tokenization and numbering with the emotions
    nlp_two = pipeline(emotion)
    for token in nlp_two:
        outcomes.append(token.idx)

print(outcomes[:10])
Yes I tried but it wont work. Also I cant use np.concatinate cause it's not in a sequence.
numpy file is the npy.
rigid zodiac
serene scaffold
It's not clear what you mean by "numpy files" and "change the numpy structure". ...
It's a bit weird because before I combine it using loop. its structure was (69,10).
after combine all 5068 files, the structure turn into (5068,2)
serene scaffold
hardy berry
So i'm trying to make a NLP program - I wanna tokenize a list of words but the p...
if there's a CSV involved, you should also share a sample of the CSV. Try copy/pasting a few lines into the paste bin
!paste
arctic wedgeBOT
Pasting large amounts of code
If your code is too long to fit in a codeblock in discord, you can paste your code here:
https://paste.pythondiscord.com/
After pasting your code, save it by clicking the floppy disk icon in the top right, or by typing ctrl + S. After doing that, the URL should change. Copy the URL and post it here so others can see it.
serene scaffold
rigid zodiac
It's a bit weird because before I combine it using loop. its structure was (69,1...
I would need to see the code to guess why this is.
rigid zodiac
serene scaffold
I would need to see the code to guess why this is.
numpy_vars = {}
for np_name in glob.glob('/content/drive/MyDrive/Huy_2/data_v7/TrainTestVal/train/Fall/*.npy'):
numpy_vars[np_name] = np.load(np_name)```Once I load it, it turn into the dict type, so I do
np.array(list(numpy_vars.items()))```numpy_vars = {
np_name: np.load(np_name)
for np_name in glob.glob('/content/drive/MyDrive/Huy_2/data_v7/TrainTestVal/train/Fall/*.npy')
}
would be a better approach
is it guaranteed that numpy_vars.items() contains only arrays of the same shape?
rigid zodiac
so all of that for numpy_vars?
serene scaffold
do print([arr.shape for arr in numpy_vars.items()])
 serene scaffold
rigid zodiac
serene scaffold
rigid zodiac
that is not what I wrote.
rigid zodiac
 serene scaffold
rigid zodiac
serene scaffold
rigid zodiac
I don't really know what numpy_vars.items() is (in terms of the types of what it contains), then. unfortunately I'm running out of time.
gritty sinew
gritty sinew
When I try to plot tables using matplotlib after using mplfinance plotting, I fi...
Just wondering if anyone knows a better place to ask this question to get some solution?
rigid zodiac
serene scaffold
I don't really know what `numpy_vars.items()` is (in terms of the types of what ...
I search about how to convert dict into array and it is the 1st thing pop up
serene scaffold
rigid zodiac
I search about how to convert dict into array and it is the 1st thing pop up
you can't just convert a dict to an array. the types of the keys and values matters.
rigid zodiac
serene scaffold
you can't just convert a dict to an array. the types of the keys and values matt...
agh I see, that's probably the reason why I ruin my array structure
serene scaffold
an array has to be "rectangular". a two-dimensional array, for example, has to have the same number of values in each row or column
rigid zodiac
serene scaffold
an array has to be "rectangular". a two-dimensional array, for example, has to h...
should I use the append() when I combine array to keep its structure
serene scaffold
rigid zodiac
should I use the append() when I combine array to keep its structure
No, append works differently for arrays than lists
rigid zodiac
serene scaffold
No, append works differently for arrays than lists
darn, I havent deal with these type so I have 0 clue what to use... any suggestion?
mossy kite
Sometimes I wonder if I have any idea what I'm doing at all
mighty spoke
@mossy kite I sorted it thanks!
mossy kite
mighty spoke
<@!426860632516591628> I sorted it thanks!
Fantastic!
 slender berry
do you guys think tensorflow is better or pytorch
mossy kite
slender berry
do you guys think tensorflow is better or pytorch
keras is top3 on kaggle but pytorch is growing fast and on track to become standard
up to you really, what's your goal?
slender berry
mossy kite
up to you really, what's your goal?
I've done work on both and I'm trying to figure which one I should mainly use
I'm new to the nn world and I have made a few programs for image, text, and audio classification from the tensorflow site and have looked through the API's for both
just wondering if I should go more indepth for tensorflow or pytorch, because both of them are similar but they still have pros and cons
mossy kite
 mossy kite
slender berry
I've done work on both and I'm trying to figure which one I should mainly use
mossy kite
slender berry
I've done work on both and I'm trying to figure which one I should mainly use
keras can be faster for implementing ideas quickly. pytorch more pythonic and good if you have a deep understanding of the underlying math/algos
slender berry
mossy kite
keras can be faster for implementing ideas quickly. pytorch more pythonic and go...
ohh kk, thanks!
serene scaffold
rigid zodiac
darn, I havent deal with these type so I have 0 clue what to use... any suggesti...
do print([arr.shape for arr in numpy_vars.values()]). This is not the same code I told you to do previously.
rigid zodiac
serene scaffold
do `print([arr.shape for arr in numpy_vars.values()])`. This is not the same cod...
I have this now

what should I do next? just convert it?
serene scaffold
rigid zodiac
I have this now
if you do np.array(numpy_vars.values()), that should give you an array of shape (n, 69, 10), where n is the length of numpy_vars.
rigid zodiac
serene scaffold
if you do `np.array(numpy_vars.values())`, that should give you an array of shap...
omg you are a live saver, thanks man
rigid zodiac
serene scaffold
if you do `np.array(numpy_vars.values())`, that should give you an array of shap...
how can I print the data out? like I just want to see its structure
serene scaffold
rigid zodiac
how can I print the data out? like I just want to see its structure
you can just print the array. But it's a 3d array--think of it as a cube of numbers.
there are n "layers", and each layer has 69 rows and 10 columns
rigid zodiac
i see, thanks man
 lapis sequoia
is there a website with pandas questions (and answers) for practice?
rigid zodiac
serene scaffold
you can just print the array. But it's a 3d array--think of it as a cube of numb...
how can I reshape it? specifically vertically
 frank torrent
Anyone know how I can create a for loop to go through a folder of images and have them be PIL images? I want to feed them into ResNet50 via PyTorch but dont want to do 1 image at a time
This is specifically a folder on google drive and I am using google colab
austere swift
frank torrent
Anyone know how I can create a for loop to go through a folder of images and hav...
make a generator function that loads the images
keras has one by default, so you can use that (it will work with pytorch too since it doesnt affect the actual model/training)
TensorFlow
Generate batches of tensor image data with real-time data augmentation.
frank torrent
austere swift
https://www.tensorflow.org/api_docs/python/tf/keras/preprocessing/image/ImageDat...
So i have the code to convert the images to the size of 224 and into tensors
austere swift
you can also make a class that inherits from torch.utils.data.IterableDataset and overwrite the __iter__() method
serene scaffold
rigid zodiac
how can I reshape it? specifically vertically
You might be talking about transposing. What do you want the shape to be at the end?
austere swift
frank torrent
So i have the code to convert the images to the size of 224 and into tensors
you can do that with torchvision.transforms
rigid zodiac
serene scaffold
You might be talking about transposing. What do you want the shape to be at the ...
0.o because im using this as a predictors and my response look like vertical
serene scaffold
rigid zodiac
0.o because im using this as a predictors and my response look like vertical
Hmm, not sure what to tell you rn. I'm on mobile
rigid zodiac
serene scaffold
Hmm, not sure what to tell you rn. I'm on mobile
Me too, imma google transpose. Thanks for suggesting
lapis sequoia
could someone of you pros have a look at my problem in #help-cake?
I'd be very grateful
 merry ridge
So last year I was interviewing for a company that asked me to do some leetcode style open book data science questions, and I couldn't do one of the questions at all because they asked me to implement an algorithm I had not heard of and I Google wouldn't give me a basic description of that algorithm from the name they used. Does anyone mind taking a look at my vague recollection and taking a stab at what it probably was? I suddenly care about it again because the same company unexpectedly asked me to interview with them again.
It was basically simple linear regression, except each explanatory variable x_i was an amalgamation of several variables. They did not want multiple linear regression, but to instead take an array where each column contained a variable, and apply some kind of mean to reduce it from an mxn array to an mx1 array to then do regression on.
rigid zodiac
merry ridge
So last year I was interviewing for a company that asked me to do some leetcode ...
I honestly think Leetcode is good for software engineer and others. Not for data scientist, cause in my interview with IBM and Boeing, their question is more like textbook in gradschool. All you need is to make ML and DL.
merry ridge
The only thing that I can recall aside from that was that there was more to it than just taking a standard mean of all of the variables, and they did not give me weights to apply a convex linear combination to each row.
rigid zodiac
that's is just practice, creating ML / DL is much harder than that
merry ridge
I don't think you understand my question
mossy kite
Yes I do
rigid zodiac
merry ridge
I don't think you understand my question
yeah sorry that's my fault, I just read the "leetcode" Tbh, you cant prepare yourself, I have interviewed with many companies and each companies has different style
merry ridge
Yes but I am asking if anyone recognizes that specific algorithm I just described, I am not interested in interviewing strategies
mossy kite
It was basically simple linear regression, except each explanatory variable x_i was an amalgamation of several variables.
rigid zodiac
IBM more likely required you to do the test, which is something similar with iris dataset
and Yeah like Legend said
merry ridge
Legend literally copy and pasted what -I- said
rigid zodiac
look up to some crash couse in statistics on youtube and you will be fine
mossy kite
agreed, don't sweat this @merry ridge
merry ridge
I am not sweating anything. I simply gave background for why I couldn't give a more thorough descriptor of the algorithm I am looking for.
rigid zodiac
merry ridge
It was basically simple linear regression, except each explanatory variable x_i ...
for this specific question, you can pretty much apply any algorithm that you want but multiple linear. Few loops should do the trick I think
mossy kite
indeed
merry ridge
I want to know if anyone recognizes that specific algorithm by name, I don't want interview advice.
mossy kite
Not to change the subject but what can I infer from this? Do either of you know
 rigid zodiac
merry ridge
I want to know if anyone recognizes that specific algorithm by name, I don't wan...
rigid zodiac
merry ridge
I want to know if anyone recognizes that specific algorithm by name, I don't wan...
they want you to reduce the mea of the things right? then reduce it and just make a simple regression (i.e. linear regression) that's all
rigid zodiac
mossy kite
Not to change the subject but what can I infer from this? Do either of you know
look like a time series
mossy kite
rigid zodiac
look like a time series
Yes, it is. It's financial data. Does this mean that beyond 20 days the correlation is low and so resulting predictions would be inaccurate with any model used? And what does it mean when it's going negative after 65 days
rigid zodiac
you may want to reduce its correlation, this is most definitely will effect your accuracy (if I remember correctly)
it simply mean what ever it is has a negative correlation with the thing you are trying to do after day 65
mossy kite
I have a lot more reading to do
rigid zodiac
mossy kite
I have a lot more reading to do
Let me know if you need some python book
mossy kite
rigid zodiac
Let me know if you need some python book
Thank you. Python itself is fairly straightforward so far. The issue is what I'm trying to do is difficult as a whole
Multivariate multistep time series forecasting
And I'm not sure what the state-of-the-art architecture is
rigid zodiac
try SARIMA
rigid zodiac
may want to tweet a few things, SARIMA in my own experience, it work pretty ok for those with high correlation
you are dealing with finance data, most of the time it will have a trend. Try to detrend / log it
mossy kite
I've heard what I'm trying to do is impossible but I don't believe it can't be useful in some way in the short term
rigid zodiac
let me know how it goes, i never try lstm. I thought it only work for picture dataset
mossy kite
rigid zodiac
let me know how it goes, i never try lstm. I thought it only work for picture da...
works for time series too but some say arima is better still
velvet thorn
mossy kite
It was basically simple linear regression, except each explanatory variable x_i ...
define “amalgamation”
mossy kite
@merry ridge
merry ridge
For example, if there are n explanatory variables, a function f(x_1,x_2, ... x_n) to R.
A function in a mathematics sense, mapping from the n fold cartesian product of R's (where each x_i is an element of R) to R
The problem is what that function should be, and I'm really just looking for a page that describes common options, all I know is that I distinctly recall they wanted something more complex than just the mean, and did not give enough information for a weighted mean.
 neon heart
merry ridge
The problem is what that function should be, and I'm really just looking for a p...
neon heart
merry ridge
The problem is what that function should be, and I'm really just looking for a p...
WLS?
 craggy sparrow
man It seems that I'll need to learn math from the beggining
not the very beginning but
 old grove
Hey Guys, One Question
I have enrolled for my masters In Data Science and just started and fresher in this domain. And I am interested to Get Insights from data and using that data help in data driven decision making as well as also love go get predictions Insights or say do predictions.
So I have seen that Data analyst Do Data mining and help in data driven decision making using storytelling thats it but not make predictions or use machine learning rather data scientists do that and they dont do data driven decision making and they dont do story telling like data analyst do
SO THE QUESTION IS,AS A DATA SCIENTIST, CAN I WORK AS DATA ANALYST OR CAN I APPLY TO ROLE OF DATA ANALYST AFTER MY PG??(AS THE WORK WHICH I AM INTERESTED SEEMS OF DATA ANALYST) ?
lone drum
I have a dataframe in
Which some column contains nan values
How I can fill this value by taking it's next time value
Ping me when replying
austere swift
lone drum
I have a dataframe in
Which some column contains nan values
How I can fill this...
!d pandas.DataFrame.fillna
arctic wedgeBOT
DataFrame.fillna(value=None, method=None, axis=None, inplace=False, limit=None, downcast=None)```
Fill NA/NaN values using the specified method.you can use method='bfill' to do exactly that
lone drum
austere swift
you can use `method='bfill'` to do exactly that
In my data frame i have to take value from another data frame
And fill value from that dataframe
austere swift
lone drum
In my data frame i have to take value from another data frame
And fill value fro...
you can set value to that other dataframe to do that
same function
lone drum
austere swift
you can set `value` to that other dataframe to do that
see this way my df and nan values

i hav to get value from this data , the highlighted value for next time i want to get

@austere swift do u get my point ? what i am trying to do?
lone drum
ping me when u reply
 storm river
I have understood that a linear regression model works based on y=mx+c. If more than one independent variables are introduced, then the equation would become y=(m1*x1+m2*x2+...mn*xn)+c.
I have trained a model and found the m1, m2, m3 and m4 and c. But when I plot the equation, I get this weird result. Please help me

 tidal bough
storm river
I have understood that a linear regression model works based on ``y=mx+c``. If m...
tidal bough
storm river
I have understood that a linear regression model works based on ``y=mx+c``. If m...
The result looks like you didn't sort the points by x-coordinate before plotting.
plot simply connects the points with lines in the order provided
storm river
I will try that. But I only plotted one line but why are there more lines near the y-axis
 stable bloom
why its all looks the same? i want to plot each data from species column
 tidal bough
storm river
I will try that. But I only plotted one line but why are there more lines near t...
tidal bough
storm river
I will try that. But I only plotted one line but why are there more lines near t...
Is x a 2d array? Then each row or column(not sure) of x would be considered as a set of x-coordinates to be matched up with your one set of y ones.
 boreal wasp
 dark sedge
hello all
serene scaffold
@dark sedge hi
lone drum
hello stelercus

 vivid rock
Hi guys, so some background: I play a LOT of table tennis and often I do some practicing alone with one side of my table up like this ⬇️
 lone drum
i want to fill nan with this values with this highlighted value
 vivid rock
Hi guys, so some background: I play a LOT of table tennis and often I do some pr...
vivid rock
vivid rock
Hi guys, so some background: I play a LOT of table tennis and often I do some pr...
I wanted to build a python program that can keep a count of the number of times I returned the ball back (how long the rally lasted), I was wondering what would be a good way to implement this. I had 2 ideas in my mind:
- Keeping the distinguishing principle Audio and use DejaVu or some other package and use a microphone to match the audio to a database of sounds hitting the ball back.
- Use open cv and keep count on whenever the ball hits the side of the board that's upright
vivid rock
lone drum
i want to fill `nan` with this values with this highlighted value
just use find and replace in excel
lone drum
vivid rock
just use find and replace in excel
i want to do in replace
vivid rock
@lone drum umm I didn't quite get you, are you unable to implement it inside excel?
lone drum
vivid rock
<@!680099760836968475> umm I didn't quite get you, are you unable to implement ...
i want to do it in python
vivid rock
lone drum
i want to do it in python
try .replace() in pandas after creating a dataframe from the excel file
vivid rock
vivid rock
I wanted to build a python program that can keep a count of the number of times ...
.
 somber prism
hey guys i want to know how much each sample are deviated from the mean but in percentage
i dont want to know the how std away from the mean but their percentage
anyone know what formula should i look into ?
| sample - sample mean |
is this the right one ?
storm river
tidal bough
Is `x` a 2d array? Then each row or column(not sure) of x would be considered as...
there are more than 1 "x". x1 is a csv column conatining heights, x2-weight etc
tidal bough
somber prism
hey guys i want to know how much each sample are deviated from the mean but in p...
that sounds like you just want to calculate (x - mean)/std or something.
somber prism
tidal bough
that sounds like you just want to calculate `(x - mean)/std` or something.
yes i want to know how each n samples are deviated from the mean but instead of getting a std value i need a percentage
to be more precise , i want the std to be represented in %
storm river
what I am trying to do is:
make a model and plot its predictions. Since it is a linear regresion model, its just a line so we can sum that model to a line equation in the form of y = (x1*m1 + x2y2 ... xn*mn) + c. Where y is the column of predicted values, x1, x2...xn are diff columns used to predict and c is the y-intersect
mossy kite
somber prism
to be more precise , i want the std to be represented in %
just convert to percent
lone drum
vivid rock
try .replace() in pandas after creating a dataframe from the excel file
see i want to replace it in my output df
somber prism
tidal bough
that sounds like you just want to calculate `(x - mean)/std` or something.
this just gets me the z score ( how each samples are deviated from the mean ,) now how do i convert this to a percentage
mossy kite
@somber prism Percent difference: ((val2-val1)/val2))*100
somber prism
mossy kite
<@!393393798350372876> Percent difference: `((val2-val1)/val2))*100`
whats val 1 and 2 here ?
mossy kite
somber prism
whats val 1 and 2 here ?
To be honest I'm not sure. I just started studying data science and AI last week. That's just the formula to get the percent difference between two values
somber prism
i see
 willow crypt
does networkx belong here?
serene scaffold
willow crypt
does networkx belong here?
if you're using it to do data science, yes.
there's also #algos-and-data-structs if you're doing a graph traversal algorithm, or something.
mossy kite
somber prism
i see
Did you get it?
vivid rock
vivid rock
I wanted to build a python program that can keep a count of the number of times ...
oof, not a single person with a suggestion?
mossy kite
vivid rock
oof, not a single person with a suggestion?
It hasn't even been 3 hours
could take up to 3 days to get a proper reply in here
Easiest way is a microphone like you were thinking
looks like every 3 pulses would count as one return
oof, not a single reply to me Rajas?
lone drum
how i can take this highlighted value and replace it with nan value of my dataframe ping me when replying
 vivid rock
mossy kite
oof, not a single reply to me Rajas?
vivid rock
mossy kite
oof, not a single reply to me Rajas?
wahaha I was playing valo lol sry
lone drum
lone drum
how i can take this highlighted value and replace it with `nan` value of my data...
i have to fiull nan value at this place
 mossy kite
lone drum
i have to fiull nan value at this place
mossy kite
lone drum
i have to fiull nan value at this place
.fillna(val)
assuming this is pandas dataframe
also be aware of dropna() to simply remove those rows if that solution is acceptable for your scenario
@lone drum
lone drum
mossy kite
.fillna(val)
i have to fill value for some other time interval also
mossy kite
@lone drum All fixed now?
lone drum
mossy kite
<@!680099760836968475> All fixed now?
means ?
mossy kite
lone drum
means ?
Do you have any other questions or is your problem solved?
lone drum
my problem is not solved yet
mossy kite
lone drum
my problem is not solved yet
What is your goal
lone drum
mossy kite
What is your goal
i want to fill nan values with another dataframe next time values
in above case 09:40:00 it has nan value so it will take next time interval data i.e. 09:41:00 this row data it will take close column value to fill nan value
mossy kite
lone drum
i want to fill nan values with another dataframe next time values
fillna(func())
like
lone drum
mossy kite
fillna(func())
means , can u explain what u are trying to say ?
mossy kite
lone drum
means , can u explain what u are trying to say ?
write a function to iterate through the columns and replace NA with the values you choose
Lots of ways to go about this
Could take days for someone to give you best practice
I'll make something up in a bit if nobody else chimes in
lone drum
mossy kite
I'll make something up in a bit if nobody else chimes in
can u plz guide me here how i can do this ?
mossy kite
lone drum
can u plz guide me here how i can do this ?
Yes
lone drum
sure
mossy kite
Ok lets take this one step at a time
mossy kite
lone drum
sure
you need to fill the na values in each column with other values from the same column
is it always from a same relative position?
if so, easy algorithm here
really just a simple loop
in fact, the built in function might take care of the iteration
just need to tell it what to fill with
lone drum
mossy kite
you need to fill the na values in each column with other values from the same co...
i need to with another datframe values
mossy kite
lone drum
i need to with another datframe values
which ones?
the previous value?
the avg of all values?
the next value?
a constant?
lone drum
mossy kite
which ones?
call_expiry_data df and put_expiry_data df
i want to get close column values to fill nan
mossy kite
@lone drum Can you be more descriptive
I can't visualize the problem well enough to start writing code
You have two dataframes
They both have missing values?
in one or more columns
 reef lantern
hey which course is better for beginners of AI
cs50 AI or Elements of AI course
mossy kite
reef lantern
hey which course is better for beginners of AI
cs50 AI or Elements of AI course
I'd just go on youtube
so much free content
reef lantern
mossy kite
I'd just go on youtube
lmao cs50 is really good and btw I got both from youtube only
mossy kite
Perfect
reef lantern
but both r really good
so really confused which one to choose
 simple ivy
hey folks, anyone know why model.predict() is taking longer to run on my microcomputer than my local machine? on my laptop its less than 6 seconds but on the microcomputer its running for 5 minutes (and counting, its still going 😬 )
lone drum
mossy kite
You have two dataframes
i have 2 datavfarmes one has misiing value other has data value
mossy kite
lone drum
i have 2 datavfarmes one has misiing value other has data value
This will do it
let me know if you need assistance writing the function to pass to the apply() method
lone drum
mossy kite
https://pandas.pydata.org/pandas-docs/stable/reference/api/pandas.DataFrame.appl...
i will go through it
austere swift
simple ivy
hey folks, anyone know why `model.predict()` is taking longer to run on my micr...
the microcomputer is slower
arctic wedgeBOT
Hey @wispy brook!
It looks like you tried to attach file type(s) that we do not allow (.svg). We currently allow the following file types: .gif, .jpg, .jpeg, .mov, .mp4, .mpg, .png, .mp3, .wav, .ogg, .webm, .webp, .flac, .m4a.
Feel free to ask in #community-meta if you think this is a mistake.
 wispy brook
I'm trying to extract (x,y) coordinates from a tracing of arbitrary text that can then be loaded as a numpy array (see attached image as example). I have been doing it by hand but I would like to automate the process with Python. Is there a library that can help with this?

Even better if it can do the same with an arbitrary SVG
mossy kite
wispy brook
I'm trying to extract (x,y) coordinates from a tracing of arbitrary text that ca...
What's your input
wispy brook
PNG? I can always figure out how to produce a PNG from an arbitrary string
If it's easier to go directly from an arbitrary string to coordinates, I can always do that too
mossy kite
@wispy brook I guess I don't fully understand what you're doing
Might be better off waiting for someone else to help
but.... they may never come. So ping me if you want to try to figure something out
@wispy brook
You want to input a PNG that looks like that and then transform it into a 2D array of X,Y points?
wispy brook
no, I would like to input a string or a black and white line drawing of a simple shape and get a 2D array of x and y points
the above image was the result of plotting such a set of points
To better understand what I'm trying to accomplish, this person made a mirror array to propose:
https://github.com/bencbartlett/3D-printed-mirror-array/blob/main/README.md
I want to abstract his work a little further to write an arbitrary personalized message
I'm going to build it and hang it up near a window around Christmas as an "abstract art piece" and have it surprise my wife when it finally catches the sunlight in the spring
GitHub
3D-printable hexagonal mirror array capable of reflecting sunlight into arbitrary patterns - 3D-printed-mirror-array/README.md at main · bencbartlett/3D-printed-mirror-array
Turns out it's actually non-trivial to get his program to produce mirror arrays that say arbitrary text:
You need to use an exact number of mirrors from a set of numbers to get the array to look right, which can effect the cost of building the array. I was going to use the subroutine I was asking about here to speed up the process of plotting the points to figure out how much I can write or how many dots I can dedicate per letter and still have the message be legible
Doing the same to simple shapes would be nice if I wanted to increase the "resolution" of the heart around the text. Or if I were a pirate, this would be a pretty baller way to hide a treasure map
But that last feature (returning coordinates of simple shapes) is just a "nice-to-have", not a requirement
mossy kite
Are you building a lot of these? @wispy brook
wispy brook
Nope, just one
but I was planning on submitting a pull request with the updated version
Could I use thresholding in opencv?
then use np.nonzero(np.array(coords)) to get the coordinates of all black dots in the image?
I could then remove a percentage of the coordinates until I can pair it down to an acceptable number of points (this last part will be tricky to have everything remain legible)
@mossy kite Thanks for being a rubber ducky, I think I have an idea of how to proceed. Don't tell my wife, I want it to be a surprise
mossy kite
wispy brook
<@!426860632516591628> Thanks for being a rubber ducky, I think I have an idea o...
Glad I was able to help. Best of luck and let us know how it turns out!
I won't spoil the surprise
 austere loom
Has anyone deployed a cloud Ray cluster?
mossy kite
austere loom
Has anyone deployed a cloud Ray cluster?
Yes. But are they in here? Unlikely.
austere loom
mossy kite
Yes. But are they in here? Unlikely.
Should have been more specific 🙃
 urban knoll
Does any one know how to locate a smudge in an image? I only know how to use CNN to train a model to figure out if a image has smudge on it. But I don't know how to make an algorithm that goes "the smudge is on the upper right corner" or something like that. Any help would be greatly appreciated.
 wintry orbit
i
velvet thorn
urban knoll
Does any one know how to locate a smudge in an image? I only know how to use CNN...
you're talking about object detection...?
there are algorithms that can return the coordinates of bounding boxes
 stable kestrel
Is it correct to say that the total chance of making a wrong conclusion with a CI of 95 % is alpha* p(H0) + b*p(H0) ?
urban knoll
velvet thorn
you're talking about object detection...?
If that's what I need then sure?
urban knoll
velvet thorn
there are algorithms that can return the coordinates of bounding boxes
Also, if I'm trying to train a model to correctly identify more than 2 classes I know that softmax is good but I don't know how outputs I should have the dense layer. I tried 3 (since it's the number of classes I'm using) but I got an error
 young raft

10 Open Source Data Science Tools✨🔥
1️⃣ Google spreadsheets and Apache OpenOffice
2️⃣ Python💖and R
3️⃣ Jupyter notebook
4️⃣ Pentaho
5️⃣ RapidMiner
6️⃣ Apache Spark
7️⃣ Hadoop
8️⃣ Weka
9️⃣Tableau
🔟Power bi
#DataScience #DataAnalytics
 Twitter
·
lapis sequoia
Twitter
·
lapis sequoia
hey would anyone mind helping me out for a sec?
 gleaming ginkgo
Can someone help me a lil bit with Selenium?
 dusk zephyr
Hello folks.
I use vscode on my laptop to run ipynb files. But sometimes the editor freezes and takes up 100% of 1 or 2 processors. Can you help me how to make ds experience better....
vivid rock
mossy kite
Easiest way is a microphone like you were thinking
issue 1: background noise of course
issue 2: if the ball missed and hits the ground, it will still matches more or less the same against our audio database and hence count as a returns when bouncing
 hoary wigeon
Hello @ everyone
I need a small help
I'm working on a Data Science project, In description they have mentioned evaluation algorithm = rmse, normalization_constant=10000 what does normalization_constant means ?
lapis sequoia
can someone give the all required data science packages insallation stetement in pip?
arctic wedgeBOT
Hey @hoary wigeon!
Uh-oh! It looks like your message got zapped by our spam filter. We currently don't allow .txt attachments, so here are some tips to help you travel safely:
• If you attempted to send a message longer than 2000 characters, try shortening your message to fit within the character limit or use a pasting service (see below)
• If you tried to show someone your code, you can use codeblocks
(run !code-blocks in #bot-commands for more information) or use a pasting service like:
hoary wigeon
lapis sequoia
can someone give the all required data science packages insallation stetement in...
lapis sequoia
that's so long list haha
hoary wigeon
hehe
lapis sequoia
actually I want a one line command for top packages
 next lance
What is the size of CUDA
 wicked grove
hello im trying to make a document scanner with open cv,and i am following a tutorial
biggest = np.array([])

maxArea=0
big=[]
cnts,hierarchy=cv2.findContours(orig,cv2.RETR_EXTERNAL,cv2.CHAIN_APPROX_NONE)
for c in cnts:
    area = cv2.contourArea(c)
    print(area)
    if(area>500):
        a=cv2.drawContours(orig,c,-1,(70,255,255),3)
        peri = cv2.arcLength(c,True)
        approx = cv2.approxPolyDP(c,0.02*peri,True)
        if area > maxArea and len(approx) == 4:
            biggest = approx
            big.append(biggest)
            maxArea = area
print(biggest)
big_sort=sorted(big)
big_sort[0]
print(big_sort)
biggest_cont = biggest
cv2.imshow("contour",a)
cv2.waitKey(0)
plt.imshow(a, cmap='gray')
plt.show()
i can't understand why the contours of the image is drawn and not of document's
this is the output after i run the code, i want the contours of the document,Can someone please tell me what i should do
 lapis sequoia
ok so how can i make in python voice text to speech with my own voice
 wooden forge
Hi, is anyone familiar with time series and predictions. Basically I have dates and I would like to predict the next one
From a list of dates I want to to predict the next one
and turn that into an app on android so that's another issue because apparently i can only do that on Linux and that sucks
 gentle dust
hello, im a 16 year old whos been accepted into a prize program where we look for planets with universities such as using data from the kepler telescope and translating it into python graphs
just thought id introduce myself cause imma be here a lot lmao
lone drum
my dataframe this way which contains nan values

i want to fill this values from anothjer dataframe
i want to fill value based on time intercla
interval*
for e.g i am getting nan value at 09:40 time interval so i want to take value from another dataframe for 09:41 time interval
like wise i want to take value next to nan time interval
u can see in this the hightlighted row i want to get value and fill in place of nan in my above dataframe

ping me when replying
mossy kite
vivid rock
issue 1: background noise of course
issue 2: if the ball missed and hits the gro...
Those are the challenges left in place for you to solve
Keep us updated on the progress
 normal violet
gentle dust
hello, im a 16 year old whos been accepted into a prize program where we look fo...
normal violet
gentle dust
hello, im a 16 year old whos been accepted into a prize program where we look fo...
cool! whats the comp called?
mossy kite
normal violet
That's not right
looks more like a drawing of grass by a two year old than a meaningful chart with data
 calm thicket
looks more like a 1yo to me
cobalt jetty
cobalt jetty
You likely have an issue with the order of your data. Check if you haven't sorte...
I pinged you with an offer of an aswer to your problem when you posted the same plot 3 days ago. See my reply pointed.
 gentle kindle
Hello, I'm a web developer with 20 years experience in PHP & 2 w/Python. I thought I was experienced until I experienced Python. Once I got experienced with Python I encountered AI & Machine Learning. Now I'm a babe in the woods and there's no mommy. ;>
I got one small AI Classification project under my belt, using Logistic Regression & SVC to assign job titles to an internal taxonomy w/an accuracy of 95% although in real life, more like 75%.
lapis sequoia
hi intermediate here
gentle kindle
One thing I've been thinking on for a very long time is taxonomy. I am attempting to use DBPedia & its ontology to classify WordPress blogs.What I was looking for was a hierarchy. I don't see one. DBPedia's Ontology may not be inherently hierarchical?
Hi! Sorry I hadn't joined up sooner.
lapis sequoia
gentle kindle
One thing I've been thinking on for a very long time is taxonomy. I am attemptin...
sounds complicated
gentle kindle
HUGELY Complicated. Sorry I am not replying, I'm blind as of 2 years.
The Web is a data dump, emphasis on "dump". We need a hierarchy that can survive the data.
lapis sequoia
gentle kindle
HUGELY Complicated. Sorry I am not replying, I'm blind as of 2 years.
i am just leaning about modules
gentle kindle
I love, and hate Python, spoken as an old-hand w/PHP.
lapis sequoia
you sound wise
lapis sequoia
gentle kindle
I love, and hate Python, spoken as an old-hand w/PHP.
i want to help my freind to launch a small scale rocket and help him in software we have to register a company
lapis sequoia
gentle kindle
I love, and hate Python, spoken as an old-hand w/PHP.
just a highscool student
gentle kindle
lapis sequoia
i want to help my freind to launch a small scale rocket and help him in software...
Good for you! You're young & getting started in SPACE. I Tweet about space. Be aware, it's easy for form a company, but it has legal & financial consequence. I have rough experience with an S-Corp.
This is off-topic, but do you know there are comapnies launching shoebox satellites composed of a cell-phone & cameras into orbit on small rockets?
lapis sequoia
gentle kindle
Good for you! You're young & getting started in SPACE. I Tweet about space. Be a...
in india it's legal to launch a rocket under 1 km and we've devloped a solid engine made out of grain
lapis sequoia
gentle kindle
This is off-topic, but do you know there are comapnies launching shoebox satelli...
sounds like space pollution is coming ahead
gentle kindle
lapis sequoia
in india it's legal to launch a rocket under 1 km and we've devloped a solid eng...
Well I'll be! I now India is a decades-long player in the booster business, launching satellites & now expanding into LEO. BUt word of advice, what the real need for is the next generation of swarm apce-worker robots.
Hey, love to talk about Space, but this is nto the place for it.
Are you in any Space forums?
lapis sequoia
gentle kindle
Are you in any Space forums?
no i am just a normal kid right now
gentle kindle
YI'm an aging man looking for a way to financially recover a series of catastrophes. I'm trying to write a plugin that'll accomplish something that's now turning out to be leading edge. I'm old & blind.
lapis sequoia
gentle kindle
Well I'll be! I now India is a decades-long player in the booster business, laun...
actually i am just like an high level employ of a unregestered startup if it fails i have my own plns
gentle kindle
Good! You should join a Space forum and start making connections. there's a lot of room, and junk in LEO.
lapis sequoia
gentle kindle
YI'm an aging man looking for a way to financially recover a series of catastrop...
how was your life till now
gentle kindle
My life was great till 2017. I had a modest asset but lost it. I got involved in a disasterous start-up/remote and waiting for my partner to launch finally after 3 years so I can put my energy to this near-impossible product.
Anyway, this isn't the place for it. And I want to put my focus to the future.
lapis sequoia
gentle kindle
My life was great till 2017. I had a modest asset but lost it. I got involved in...
i am sure you'll achive everything
you have a strong will power
gentle kindle
I'm not ready to roll over & die. But the damage is is severe. There is no guarantee of anything. Anyway, nice to meet you & good luck.
lapis sequoia
gentle kindle
I'm not ready to roll over & die. But the damage is is severe. There is no guara...
good luck and i hope you live a long , sucessful and happy life
gentle kindle
#spaceThat is nice & greatfully received. Thank you.
To the channel: I have thought long & hard on Taxonomy, and learned it's malleable. So any rigit categorization & hierarchy is doomed to fail. Unfortunately, WordPress is designed around hierarchical categories and people cannot navigate thousands of tags in alpha order.
I got a rude awakening with DBpedia's Ontology & learned how ignorant I am about taxonomy. That said, I'm learning. I propose distinctions, educate me if I am speaking out of turn: Ontology is basically tagging, Taxonomy is hierarchical (think Philology). In WordPress, Caategories are reserved for nouns & tags for names.
hoary wigeon
Hello @ everyone
I need a small help
I'm working on a Data Science project, In description they have mentioned evaluation algorithm = rmse, normalization_constant=10000 what does normalization_constant means ?
gentle kindle
Hello, can one of you admins create a text & voice channel for Taxonomy & Ontologies? This is a vital topic for Data Science.
I think Ontology focuses on describing an object and taxonomies detail relationships. There is one inherent "object" but many different facets of relationships.
lapis sequoia
gentle kindle
Hello, can one of you admins create a text & voice channel for Taxonomy & Ontolo...
try finding it on more popular lobbies like python general its more visited
 uneven orbit
I have homework can anyone help me?
lapis sequoia
gentle kindle
Hello, can one of you admins create a text & voice channel for Taxonomy & Ontolo...
i ve talked to a admin and he said 'i find the more general channel data-science-and-ai more suited as a topical text channel. but you can raise your idea in community-meta if you feel more strongly after reading this. but keep in mind that we had to remove our windows channel because it was never used, and im not that convinced how much traffic that channel would get.'
gentle kindle
lapis sequoia
i ve talked to a admin and he said 'i find the more general channel data-science...
I'll consider this. THank you.
serene scaffold
uneven orbit
I have homework can anyone help me?
You are more likely to get help if you put your actual question out there. Be sure that it relates to the channel topic.
gentle dust
normal violet
cool! whats the comp called?
the program is called "planet hunting with python"
with queen mary
 mild elk
anyone here have experience using the lazypredict library?
 last salmon
uh guys
im trying to make an ai that can recieve data, store it and spit it out when asked about it
how would i go about doing that?
 modest timber
hi could lstm make output True or false? or I need make 0,1
willow crypt
i am using networkx. I add edges with custom property G.add_edge(pair[0], pair[1], weight = 1), and later increase weight if this same pair already has an edge withG[pair[0]][pair[1]]["weight"] += 1. How can i check how many edges have weight of 1 or higher, of 2 or higher and so on?
I want to make analisys how many edges and nodes i have left if i only keep edges with weight = 1, weight = 2, weigh = 3 and so on
odd meteor
last salmon
im trying to make an ai that can recieve data, store it and spit it out when ask...
Isn't that what database is used for? Excel, SQL etc already does that.
modest timber
Hey! I 've got problem with LSTM model. My LSTM model that based on the last 60 days price movements ( that I try to determine whether stock are up - 1 or down - 0) - give me values other that I suppose 0 or 1 🙄 , what could be the issue maybe I cant make that prediction? - with float as inputs I use pct change of stocks. Any clues?
 quiet vault
To get an output of a number between 0 and 1 you have to use the sigmoid activation function at the output layer
@modest timber
The LSTM will not give u either 1 or 0. It will always give u a number with a decimal
last salmon
odd meteor
Isn't that what database is used for? Excel, SQL etc already does that.
really how can i use it?
odd meteor
last salmon
really how can i use it?
By querying the database.
There's a chance I might not have understood your question properly. What exactly do you mean by you wanna build an AI?
Do you mean bot or???
 marsh yacht
guys where can i practice my data science skills?
last salmon
odd meteor
By querying the database.
a bot sorry
odd meteor
last salmon
a bot sorry
Okay I understand you more clearly now. I can only suggest you look into using NLP to build a Virtual Assistant / Chatbot that interacts with a database or API.
modest timber
Thanks , @quiet vault
odd meteor
last salmon
im trying to make an ai that can recieve data, store it and spit it out when ask...
RSVP this if it looks like what you're interested in
 last salmon
odd meteor
RSVP this if it looks like what you're interested in
last salmon
odd meteor
RSVP this if it looks like what you're interested in
yes
modest timber
Hey, what do you think guys, after graduading computer science school is good to start first off with datascience job? I frankfully I would, but I a bit concern because of problematic with all of data especially numpy pandas staff,now I try make project and I did not expect it to will be so difficult
Maybe i should start with python job?
last salmon
odd meteor
RSVP this if it looks like what you're interested in
Ex.
User: What is the Sun?
Ai:I dont know give me an answer?
User: It is a star
some time later
User: What is a star?
Ai: It is a star
im kind of
thinking of it
having the abiltiy to form varaibles
or smth
based of off the user input
odd meteor
last salmon
Ex.
User: What is the Sun?
Ai:I dont know give me an answer?
User: It is a sta...
I understand....
If it's a niche specific bot then it'll be a lot easier to code and manage. But if the bot takes both questions related to marriage, science, health, travel questions etc it'll be a lot harder to code 😀😀
last salmon
odd meteor
I understand....
If it's a niche specific bot then it'll be a lot easier to co...
ok
so like
where do i start
how can i start making this?
odd meteor
For example if you build a bot that helps its users to order coffee it'll be more easier to code and manage than building a bot that tries to handle a lot of things.
odd meteor
last salmon
how can i start making this?
If you already have good knowledge of ML then you might wanna delve into Deep Learning and focus on NLP. specifically how to use NLP to build Chatbots.
Also do RSVP the upcoming DeepLearning workshop on NLP. I believe it'll help you as well
last salmon
odd meteor
If you already have good knowledge of ML then you might wanna delve into Deep Le...
k thanks
wait why would i need machine learning for this doe?
i dont have chaning inputs
just the bot looking for exisiting data
odd meteor
last salmon
not to manage tasks
Remember, it's a bot and the responses your bot gives its supposed users will be hard coded by you.
Except what you have in mind is to build sophisticated Conversational bots like Sophia then I really don't have experience on that for now 😀
last salmon
leave that aside
is there any way
i can like make new variables
be written
as a script is progressing?
casue as i see it
all i have to do is
make it that
there is a text file or smth
that the script can write already existing data
on
and scan it when asked a question ro smth
odd meteor
last salmon
wait why would i need machine learning for this doe?
Because you don't wanna build a bot that's dumb in giving responses 😀. So your bot should be able to extract and classify intent and entity from whatever text the user type in.
Now with libraries like SpaCy you could easily do this. Further more you can also build an interpreter to make your bot more robust using RASA
last salmon
odd meteor
Because you don't wanna build a bot that's dumb in giving responses 😀. So your ...
ooooo
odd meteor
last salmon
i dont have chaning inputs
This would kinda defeat the essence of building a bot in the first place. A bot should be able to take in several inputs (input that's related to the purpose/problem the bot was built to solve in the 1st place) and at the same time to be so brillant enough to quickly decipher the user's intent.
If you're building a bot with the intention that it can't take varying input then its as having as a dumb bot.
The implication of this is, when a user don't type exactly the same text with what you used to code the bot from backend, your bot won't be able to give a responses.
last salmon
so i need a library
sorry im kinda acting dum
just that this is my 1st time ahving a go at something like this
modest timber
@odd meteor what do you think about my ask 😋
modest timber
modest timber
Hey, what do you think guys, after graduading computer science school is good t...
that one? 😋
odd meteor
last salmon
so i need a library
I'm not a Chatbot developer but the basic things you'd need to build a more robust bot are but not limited to:
-
A Database or API (your bot will have to interact with a database or API to fetch its response most times) you could use SQL or even Excel
-
RASA NLU or other sort of high level API for intent recognition and entity extraction.
-
An Interpreter object
-
Training Data
-
CRF (Conditional Random Fields) like
ner_crfwhich helps in handling typographical errors -
Incremental Slot Filling & Negation
-
Others...
odd meteor
modest timber
Hey, what do you think guys, after graduading computer science school is good t...
Starting with the basis will ease you alotta stress. I'd advice starting from Python programming first if you don't have the knowledge.
Then after Python, move to Data Science, then to Machine Learning, then to Deep Learning. Once you've gotten to Deep Learning you could then choose to focus majorly on a particular niche (NLP, Computer Vision, Reinforcement Learning etc. )
I'm equally a beginner myself so I'm currently exploring NLP at the moment. Other experienced guys here can provide you with a more sound feedback
 finite gate
Hi guys, i have a quick question about pandas posted in #help-cherries ,I'm sorry to bother if this cross posting is very illegal. But it's a problem I'm stuck on for about 3 days now :/.
finite gate
lapis sequoia
simple pandas question in <#696351646976049242> if anyone knows
look at concat or append
last salmon
odd meteor
I'm not a Chatbot developer but the basic things you'd need to build a more robu...
ight lemme clip this
last salmon
odd meteor
I'm not a Chatbot developer but the basic things you'd need to build a more robu...
what should i use as a database or api????
last salmon
odd meteor
I'm not a Chatbot developer but the basic things you'd need to build a more robu...
would tensorflow work?
modest timber
quiet vault
To get an output of a number between 0 and 1 you have to use the sigmoid activat...
So only at the end layer, yes?
modest timber
quiet vault
yes
So it should like model.add(Dense(1, activation="sigmoid")
modest timber
I getting the same😂, could you help me tomorow because i verry sleepy now
modest timber
Predictions are floats
quiet vault
yea
modest timber
And out put 1/0
serene scaffold
quiet vault
what are the predictions
a prediction is the output of a model.
quiet vault
alright lol
serene scaffold
 quiet vault
yea
What you do now is that you round
That is the most common way of doing binary classification
So >0.5 is up and <0.5 down
modest timber
So its ok you say
modest timber
Yes
quiet vault
no negatives?

 quiet vault
interesting
modest timber
Like around 0.57
modest timber
Whatever the output i expect 1/0
quiet vault
what training loss are u getting
quiet vault
modest timber
Whatever the output i expect 1/0
with the sigmoid function the output wont be 1 or 0 all the time
it will most of the time be something in between
but you can round up or down
modest timber
 modest timber
So i need to get round


 modest timber
quiet vault
it will most of the time be something in between
modest timber
quiet vault
it will most of the time be something in between
I dont understand that 😁, but ok I see I need round that and check what will happend
I see that tomorow
quiet vault
modest timber
ok tgars giid]
omg
ok thats good*
it isn't a straight line anymore which is good
lapis sequoia
how do i query a dataframe string column with regex? like
SELECT *
FROM df
WHERE locations RLIKE '^Toronto';
 main fox
lapis sequoia
how do i query a dataframe string column with regex? like
```
SELECT *
FROM df
...
main fox
lapis sequoia
how do i query a dataframe string column with regex? like
```
SELECT *
FROM df
...
df.loc[:, df.columns.str.startswith('foo')]
thank you that probably works for my case right now, but is there no regex command its a bit more general?
main fox
lapis sequoia
thank you that probably works for my case right now, but is there no regex comma...
kanoki
There are several pandas methods which accept the regex in pandas to find the pattern in a String within a Series or Dataframe object. These methods works on the same line as Pythons re module. Its really helpful if you want to find the names starting with a particular character or search for a pattern within a dataframe column or extract the da...
lapis sequoia
uhhh can someone explain MSE and SSIM method to me?
wicked grove
main fox
https://kanoki.org/2019/11/12/how-to-use-regex-in-pandas/
Hello,can you please help me with openCV
im trying to make a document scanner with open cv,and i am following a tutorial
biggest = np.array([])

maxArea=0
big=[]
cnts,hierarchy=cv2.findContours(orig,cv2.RETR_EXTERNAL,cv2.CHAIN_APPROX_NONE)
for c in cnts:
    area = cv2.contourArea(c)
    print(area)
    if(area>500):
        a=cv2.drawContours(orig,c,-1,(70,255,255),3)
        peri = cv2.arcLength(c,True)
        approx = cv2.approxPolyDP(c,0.02*peri,True)
        if area > maxArea and len(approx) == 4:
            biggest = approx
            big.append(biggest)
            maxArea = area
print(biggest)
big_sort=sorted(big)
big_sort[0]
print(big_sort)
biggest_cont = biggest
cv2.imshow("contour",a)
cv2.waitKey(0)
plt.imshow(a, cmap='gray')
plt.show()
i can't understand why the contours of the image is drawn and not of document's
lapis sequoia
Ok so i am trying to train my own voice in text-to-speech well tts means converting text in voice like when i type Hello World! it speaks and i want to make it with my own voice for example connecting .wav file and so make it so it responds can anyone send me github link for it and explain me how it works Please i will be so glad for helping me 🙂
 bright sequoia
hi guys I want to edit a pandas frame like df[column][row] = smt
how can I do that
odd meteor
bright sequoia
hi guys I want to edit a pandas frame like df[column][row] = smt
how can I do th...
There are many ways to do this. If you'd like to change the value in row 4, 'Names' column, you could do this:
df.at[3, 'Names'] = 'Sunman'
bright sequoia
odd meteor
There are many ways to do this. If you'd like to change the value in row 4, 'Nam...
oh man thanks a lot, its solved
 wheat ice
.atlooks cool, i never saw that before
modest timber
quiet vault
ok thats good*
Could you help with that transformation ?( I have no clue ).
The data like in plot - is from 0.54 to 0.58~
I think something is wrong as sigmoid function generally starts activate from 0.5, so I assume this is the threshold and i would have all True
 upbeat prism
hi, I'm trying to implement a neural network. The first few layers are described here in the picture. Now I want to use pyTorch's torch.nn.Conv1d(in_channels, out_channels, kernel_size,...) for that but I have no idea how to read the image.
It says the size of the 2nd layer (conv1d) is 32x40945 and the sie of the 3th layer (pooling) is 32x10236. What is now in_channels, out_channels and kernel_size exactly? Note that in and out channels are integers.

 upbeat prism
 glass minnow
the sum is the cummultative error of all samples. You are interested in the average per sample. you have n samples. (probably not the best explanation but that's the gist of it).
odd meteor
glass minnow
Why cost Function is divided by n ?
n is simply your sample space or the total number of observations
upbeat prism
glass minnow
by sample you mean features ?
the sum sums up all those errors. each blue is a sample/measurement. You want the average error, so you divide by n which here is 5.
My check out some stat quest videos on youtube about this.

 hushed lichen
the sky is red
glass minnow
upbeat prism
the sum sums up all those errors. each blue is a sample/measurement. You want th...
Got it thank you so much @upbeat prism
glass minnow
odd meteor
n is simply your sample space or the total number of observations
Thank you @dry pine
 robust jungle
Im getting this error when trying to run model_main_tf2.py:
TypeError: init(): incompatible constructor arguments. The following argument types are supported: 1. Tensorflow.python.lib.io._BufferedInputStream(filename: str, buffer_size: int, token: tensorflow.python.lib.io._pywrap_file_io.TransactionToken = None)
Invoked with: None, 524288
rigid zodiac
serene scaffold
if you do `np.array(numpy_vars.values())`, that should give you an array of shap...
This is what I have from the last conversation that we have, and now i'm trying to do a transpose to it. However, I cant print out its shape.

 wide helm
if someones knows tensorflow's image_data_generator i'd be happy to receive help on #help-broccoli
hushed lichen
the sky is red, and i have proof
 dim trail
hi everyone. Does anyone know how to build a SAT solver (for a sudoku) with Dimacs input?
serene scaffold
Is there a term for when uses more than one model for the same thing at the same time, all of which predict for disjoint sets of classes?
serene scaffold
rigid zodiac
This is what I have from the last conversation that we have, and now i'm trying ...
This is a list of tuples, not an array.
rigid zodiac
so how can I print its shape of the data? I let
d = np.array(numpy_vars.values())
serene scaffold
rigid zodiac
so how can I print its shape of the data? I let
``` d = np.array(numpy_vars.val...
did you do d.shape?
rigid zodiac
serene scaffold
did you do `d.shape`?
yes I did and It gives me this
 serene scaffold
rigid zodiac
yes I did and It gives me this
serene scaffold
rigid zodiac
yes I did and It gives me this
try print(d)
wait a minute
there's an extra set of parentheses
why do you have d = np.array((numpy_vars.values()))
it might not matter. in either case, remove them, and then print d.
rigid zodiac
when I print it, I have this
 serene scaffold
rigid zodiac
when I print it, I have this
serene scaffold
rigid zodiac
when I print it, I have this
I guess you have too much data
I've never seen that.
rigid zodiac
I suppose so, I just too chicken to feed it into my ML or DL. I spent pretty much all morning to either print it or find other way
rigid zodiac
serene scaffold
I guess you have too much data <:PeepoShrug:779433312242237491>
It was another reason, there is no dimension with the array. I guess I will have to look for another solution
thank you so much for helping me
serene scaffold
rigid zodiac
thank you so much for helping me
No problem. But there has to be a reason this isn't working. I'll look at it in a moment
mossy kite
rigid zodiac
so how can I print its shape of the data? I let
``` d = np.array(numpy_vars.val...
What are you trying to do, in plain english?
serene scaffold
@mossy kite numpy vars is dict[str, np.array]
Namely 2d arrays of shape (69, 10)
They want a 3d array
@rigid zodiac try np.array(list(numpy_vars.values()))
rigid zodiac
Oohh imma try that thank you
 plush orchid
not sure this is the best place but related
I have a big video ml pipeline where everything is optimized but video output writing, which is a massive bottleneck
without video writing: ~300+ FPS
with video writing: 100 FPS
it's already in a very light thread but cv2.VideoWriter is just simply way too slow, even when I try to use nvenc + gstreamer. wondering if anyone has crazy solutions like offloading the encoding to some consumer process or a magic library that does it better than cv2, or should I just write every N frames 😓 which would be unfortunate
I shuold add Im using H264 b/c for the same reason why I need this so insanely fast, jpeg or something would take up my entire disk
 desert oar
plush orchid
not sure this is the best place but related
I have a big video ml pipeline wher...
desert oar
plush orchid
not sure this is the best place but related
I have a big video ml pipeline wher...
this is well beyond my area of expertise, but sending frames to a separate thread or process to be written doesn't sound like a bad idea. that, or, maybe you can batch frames together and write big chunks at a time. filesystem i/o is slow, it's good to do it in chunks
plush orchid
desert oar
this is well beyond my area of expertise, but sending frames to a separate threa...
batching sounds promising but not sure where to start, or rather, it doesn't seem to be a thing in cv2 (???)
 undone fiber
question for you guys before I start building a ai/ml type algorythm.. would this work for an abstract relationable process.. where in intergers coupled with rates like 8x8 8x6 8x4, qam16, qam64, etc = (abstract number) .. the abs.num is a measurement of all the fields combines IRL which in tuen equal the total power output.. the vaules/rates themselves are measurement but do no directly equal the abs.num .. hope I explain it well enough.
 sleek robin
can someone please help me understand, when you have an LSTM and use it for classification, i understand you have a few LSTM layers and then add a few FC layers at the end
but what does the FC bit connect to? what does the LSTM output to the FC that acts as the extracted features?
from the simple explanations it sounds like LSTMs by themselves are predictive as in they just output the next predicted word or element of the sequence or whatever
rather than encoding the features of a sequence
do you just yeet the state from the final cell into the FC part?
 tender hearth
Why does nn.MultiheadAttention (https://pytorch.org/docs/stable/generated/torch.nn.MultiheadAttention.html) require that the embed_dim is divisible by num_heads?
I thought the input was just copied for each head?
From this answer: https://stackoverflow.com/questions/66389707/why-embed-dimemsion-must-be-divisible-by-num-of-heads-in-multiheadattention the input is split up on the embed_dim dimension and then fed into the subsequent heads
Why is that?
lone drum
my dataframe this way

i want to fill nan values for e.fg. if CE_price has nan value then it will take vlue from new_CE_price column and fill it and if PE_price has nan value then it will take value from new_PE_price column and fill it
ping me when replying
how i can do this ?
lapis sequoia
This is not my code, I just want to look at it as a guidance, I understand the principles behind it and just need a reference to code of
That being said, how good is this? Is there something wrong with it that I should pay attention to or is it fine? I noticed for example that the "derivative" of the sigmoid is off

 dawn lark
Does anyone know of any nautilus alternatives that can handle large datasets?
I have a dataset divided into folders where some of them hold around 250k images, each around 32Kb, and it takes forever to open with nautilus
I'm currently using dolphin, which is pretty good, but was wondering if there was anything better
 tidal bronze
how can I break into this field without formal education?
odd meteor
tidal bronze
how can I break into this field without formal education?
-
Buy courses online, learn, implement, build, talk about it online.
-
Enroll in a Data Science tech bootcamp.
-
Writing a research paper to prove a concept or any crazy idea you've got.
In any of the path you choose, ensure you're intentional about increasing your network by actively attending conferences, workshops, joining online/offline ML communities, and participating in hackathons that's related to Data Science.
tidal bronze
odd meteor
1) Buy courses online, learn, implement, build, talk about it online.
2) Enro...
thanks for the answer! What kind of projects would be good to build up my portfolio. I do kaggle cases every now and then but I do not know how much that experience is relevant
tidal bronze
odd meteor
1) Buy courses online, learn, implement, build, talk about it online.
2) Enro...
any particular course you would recommend?
odd meteor
tidal bronze
thanks for the answer! What kind of projects would be good to build up my portfo...
Projects that interests you enough.
odd meteor
tidal bronze
any particular course you would recommend?
How about building an end to end project on any of the Kaggle projects you've worked on?
From collection of data to deploying your model on cloud
 pastel valley
yo is convolutional neural network capable of this example:
person classification
but when inputed a hand or feet only of the person will the model be able to still classify it as person?
serene scaffold
pastel valley
yo is convolutional neural network capable of this example:
person classificatio...
It depends on whether or not you can actually identify a person by their hands and feet in real life. From there, it depends on how effectively you represent their hands and feet for machine learning purposes.
pastel valley
serene scaffold
It depends on whether or not you can actually identify a person by their hands a...
for example a cropped image of person that just remain his left side arm and the model is trained with only full body persons?
serene scaffold
@pastel valley if the model is trained on images of the whole body, and it's not broken down by body part, I imagine that there's no way it could work on just the feet.
pastel valley
serene scaffold
<@694276264273641483> if the model is trained on images of the whole body, and i...
oh i see thank you sir
 tough bolt
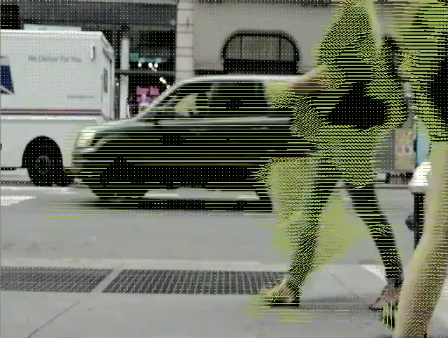
OpenCV is a popular open-source computer vision and machine learning software library with many computer vision algorithms including identifying objects, identifying actions, and tracking movements…
Has anyone here used nvidia apis/sdks before?
I am struggling to get how to use the NvOF Tracker in python
 soft plover
Anyone who worked on the water detect library?
 low spear
have anyone try to use faster r-cnn to detect vehicles? is it possible to detect the vehicles without having any xml file?
mighty spoke
Hi I have a scatter plot which I need to bin, I have to choose a bin size shown in the picture, calculating the mean in each bin which should give a bell shape curve, I'm not sure where to start with this
 tidal bough
mighty spoke
Hi I have a scatter plot which I need to bin, I have to choose a bin size shown ...
tidal bough
mighty spoke
Hi I have a scatter plot which I need to bin, I have to choose a bin size shown ...
https://numpy.org/doc/stable/reference/generated/numpy.histogram.html#numpy.histogram does exactly that - pass it the data and the bin edges, and it'll calculate the counts for each bin.
 chilly geyser
Does anyone know if something is wrong with cross_val_score of sklearn at https://scikit-learn.org/stable/modules/generated/sklearn.model_selection.cross_val_score.html
I am getting incredible high accuracy on both test/train but when I manually try to get accuracy via the confusion matrix (https://scikit-learn.org/stable/modules/generated/sklearn.metrics.confusion_matrix.html) - I get a lot lower accuracy. Basically I am getting cross_val_scores (scoring="accuracy") of around 0.9 while the confusion matrices (and classification_report) give an accuracy of about 0.58. Does this mean the 'score' is a number that is not the accuracy? If so, then what is the score?
scikit-learn
Examples using sklearn.model_selection.cross_val_score: Model selection with Probabilistic PCA and Factor Analysis (FA) Model selection with Probabilistic PCA and Factor Analysis (FA), Imputing mis...
scikit-learn
Examples using sklearn.metrics.confusion_matrix: Faces recognition example using eigenfaces and SVMs Faces recognition example using eigenfaces and SVMs, Visualizations with Display Objects Visuali...
mighty spoke
tidal bough
https://numpy.org/doc/stable/reference/generated/numpy.histogram.html#numpy.hist...
Thanks @tidal bough as I don’t want a histogram can I still use this to make an error bar binned scatter plot ?
tidal bough
mighty spoke
Thanks <@!266216750876459008> as I don’t want a histogram can I still use this t...
It's called histogram because it essentially computes a histogram, but what it does is what I explained - counts the number of values in each bin provided, returning the counts.
odd meteor
chilly geyser
Does anyone know if something is wrong with `cross_val_score` of `sklearn` at ht...
For a classification problem, .score() calculates the accuracy score of a model by default. Cross validation runs multiple non-overlapping train-test-split depending on the number of K-Folds you specified to produce several accuracy scores.
Doing cross validation on its own won't give you a single value by default, except you decided to take the mean of the resulting cross validation scores.
Can you share the code of how you did your cross validation?
 brazen spire
can't get Mnist to recognise any number with a pretrained alexnet. Can a bigger input_size change that?
my current input_size is 80
 tidal bronze
hey I need to get distances between two zip codes in Singapore, what's the best library for that?
wooden forge
Hi, I would like to know if anyone could help me with Date Prediction. I want to create a period tracker, but I just don't know what to do to forecast the values. Neural Network, Polynomial regression ? Any help would be appreciated
 hollow sentinel
so i saved a file on my mac called heart.csv
but when i do
pd.read_csv("heart.csv")
it won't show
does it have to be in the same folder or something
serene scaffold
hollow sentinel
pd.read_csv("heart.csv")
it's the same as any Python file IO. The path has to be relative to Python's working directory.
hollow sentinel
oh i figured it out
been a while since i did data analysis
what's .duplicated
checking duplicate rows
serene scaffold
hollow sentinel
what's .duplicated
!docs pandas.DataFrame.duplicated
desert oar
plush orchid
batching sounds promising but not sure where to start, or rather, it doesn't see...
i admittedly don't know how cv2 handles video. there's no way to split up a video into chunks of N frames at a time?
arctic wedgeBOT
DataFrame.duplicated(subset=None, keep='first')```
Return boolean Series denoting duplicate rows.

Considering certain columns is optional.the go-to resource for learning about forecasting: https://otexts.com/fpp3/
3rd edition
wooden forge
desert oar
the go-to resource for learning about forecasting: https://otexts.com/fpp3/
Will do thanks a lot!
serene scaffold
isn't one core the default assumption? what about this should be running in parallel?
desert oar
wooden forge
Will do thanks a lot!
Time Series Analysis Resources
Books
The go-to textbook for time series forecasting: https://otexts.com/fpp3/ (free to read online!)
Python resources
Time series handling in Pandas: https://pandas.pydata.org/pandas-docs/stable/user_guide/timeseries.html
Scikit-learn for time series: https://tslearn.readthedocs.io/en/stable/
Another library for time series machine learning that wraps a lot of other models/libraries (including Facebook's "Prophet" model): https://unit8.com/resources/darts-time-series-made-easy-in-python/
Other resources
A detailed writeup about the Prophet model: https://www.microprediction.com/blog/prophet (note: this entire website is dedicated to time series forecasting in industry!)
General Additive Models for time series forecasting: https://asbates.rbind.io/2019/05/03/gams-for-time-series/
Some resources on Bayesian time series forecasting:
https://multithreaded.stitchfix.com/blog/2016/04/21/forget-arima/
https://www.bankofengland.co.uk/ccbs/applied-bayesian-econometrics-for-central-bankers-updated-2017
https://towardsdatascience.com/a-bayesian-approach-to-time-series-forecasting-d97dd4168cb7
https://towardsdatascience.com/probabilistic-programming-and-bayesian-inference-for-time-series-analysis-and-forecasting-b5eb22114275
@serene scaffold are you interested in pinning that? ☝️ (also if you have any ideas to add)
hollow sentinel
plt.figure(figsize=(50,50))
sns.displot(df["Age"],color="green",label="Age",kde = True)
plt.legend()
import matplotlib.pyplot as plt
plt.figure(figsize=(20,20))
sns.displot(df['Age'], color="red", label="Age", kde= True)
plt.legend()
no
serene scaffold
desert oar
***Time Series Analysis Resources***
**Books**
The go-to textbook for time seri...
serene scaffold
hollow sentinel
"TypeError: 'module' object is not callable"
whatever you're trying to do, the thing you think is a function is actually a module.
desert oar
serene scaffold
no
i thought numpy did use openmp in some cases? and i know at least scipy links to blas (maybe also numpy itself) which probably can do multithreading
hollow sentinel
oh ok so i fixed that part
"AttributeError: module 'seaborn' has no attribute 'displot'"
serene scaffold
desert oar
i thought numpy did use openmp in some cases? and i know at least scipy links to...
maybe? the code in question isn't really leveraging numpy all that much.
hollow sentinel
displot is an attribute tho
desert oar
hollow sentinel
displot is an attribute tho
an "attribute" of a module could be another module
hollow sentinel
what
wooden forge
desert oar
***Time Series Analysis Resources***
**Books**
The go-to textbook for time seri...
Waow thanks a lot for taking your time!
serene scaffold
desert oar
an "attribute" of a module could be another module
displot is a callable of some kind. might be a version issue? https://seaborn.pydata.org/generated/seaborn.displot.html#seaborn-displot
desert oar
oh idk, let me see. @hollow sentinel can you post the full traceback for your code? that will tell us where exactly it occurs
desert oar
i don't think plt.figure is a function based on what you had said
hollow sentinel
i changed it to distplot
it said it was deprecated in the docs
so that's why i used displot
bc that's what they recommended
wooden forge
desert oar
***Time Series Analysis Resources***
**Books**
The go-to textbook for time seri...
pip install darts just broke my anaconda thats cool I like the spirit
desert oar
wooden forge
pip install darts just broke my anaconda thats cool I like the spirit
ouch, but why are you using pip in anaconda? pretty sure u8darts and darts are available in conda-forge
desert oar
what path? what exactly did you try and what happened?
(also this is why you shouldn't install things in the base conda env)
desert oar
conda "freezing" on install might actually just be conda being extremely slow
especially on windows
darts pulls in a huge amount of deps
desert oar
nuke the env and try again in a new env with u8darts
wooden forge
yup
desert oar
typical conda things, welcome to data science
wooden forge
nice
 grave frost
typically, conda takes anywhere between 20s - 3 weeks
if it's taking any longer @wooden forge then you know you've got a problem
 red hornet
Hey, anyone know whether there's a real difference between using python DataFrame.iloc[:, 1:].to_numpy()
overpython DataFrame[DataFrame.columns[1:].to_numpy()?
other than just readability, like is there a better practice in anyone's opinion?
calm thicket
first one, it should be faster i think. also there's an error in the second, really highlights the readability issue 😬
mighty spoke
Hi I'm trying to plot a binned scatter plot with a particular bin size/interval I also want to find the mean in each bin but it's not binning properly any help is appreciated
red hornet
calm thicket
first one, it should be faster i think. also there's an error in the second, rea...
ahh okay, I figured the 1st might be better overall. what's the error in the 2nd btw? it seems to run fine at least 🥲
calm thicket
missing ] somewhere, you probably just typed it wrong
velvet thorn
desert oar
especially on windows
there's also this thing where if you don't press enter the shell doesn't update
 dense beacon
Goodnight. Can anyone give me a hand?
velvet thorn
dense beacon
Goodnight. Can anyone give me a hand?
show code.
dense beacon
texts = data['text']

def decontracted(phrase):
    # specific
    phrase = re.sub(r"won't", "will not", phrase)
    phrase = re.sub(r"can\'t", "can not", phrase)

    # general
    phrase = re.sub(r"n\'t", " not", phrase)
    phrase = re.sub(r"\'re", " are", phrase)
    phrase = re.sub(r"\'s", " is", phrase)
    phrase = re.sub(r"\'d", " would", phrase)
    phrase = re.sub(r"\'ll", " will", phrase)
    phrase = re.sub(r"\'t", " not", phrase)
    phrase = re.sub(r"\'ve", " have", phrase)
    phrase = re.sub(r"\'m", " am", phrase)

    return phrase

def preProcessamento(x):
    x = data['text'].apply(lambda x: str(x).lower())
    x = x.decontracted()
    x = remove_punctuation(x)
    x = remove_numbers(x)
    x = remove_linebreaker(x)
    x = tokernizer(x)
    x = remove_stopwords(x)

    return texts

preProcessamento(texts)
texts.head(10)
AttributeError: 'Series' object has no attribute 'decontracted'
velvet thorn
uh.
okay
first, I think you want decontracted(x)
because it's a free function
but in any case
that won't work
you can call methods on the pandas string accessor directly
try data['text'].str.replace (look at the docs)
dense beacon
Ok, i will try
Can I still use this method using regular expression? Or what you proposed sets aside the use of regular expression?
velvet thorn
dense beacon
Can I still use this method using regular expression? Or what you proposed sets ...
yes
look into the docs! you'll learn a lot
dense beacon
ok
def decontracted(phrase):
    # specific
    # data['text'].str.replace
    phrase = re.data['text'].str.replace(r"won't", "will not", phrase)
    phrase = re.data['text'].str.replace(r"can\'t", "can not", phrase)

    # general
    phrase = re.data['text'].str.replace(r"n\'t", " not", phrase)
    phrase = re.data['text'].str.replace(r"\'re", " are", phrase)
    phrase = re.data['text'].str.replace(r"\'s", " is", phrase)
    phrase = re.data['text'].str.replace(r"\'d", " would", phrase)
    phrase = re.data['text'].str.replace(r"\'ll", " will", phrase)
    phrase = re.data['text'].str.replace(r"\'t", " not", phrase)
    phrase = re.data['text'].str.replace(r"\'ve", " have", phrase)
    phrase = re.data['text'].str.replace(r"\'m", " am", phrase)

    return phrase
Is that what you mean?
chilly geyser
odd meteor
For a classification problem, `.score() ` calculates the accuracy score of a mod...
Yes, I know how CV is supposed to work.
I don't exactly have a minimum working example on fake data
velvet thorn
dense beacon
```python
def decontracted(phrase):
# specific
# data['text'].str.replac...
no...
why is there a re.
dense beacon
I thought I needed to use it due to the regular expression