#data-science-and-ml
1 messages · Page 350 of 1
 somber prism
 median fulcrum
somber prism
like for eg if there are around 10k cosmetics products and 100 electronics produ...
median fulcrum
somber prism
like for eg if there are around 10k cosmetics products and 100 electronics produ...
by an image or just description?
somber prism
description
median fulcrum
you would use nlp?
somber prism
yes like cleaning the description part and vectorizing the texts
 shut trail
just grabbing a column as a row
median fulcrum
I think it's possible
shut trail
id give you the code but i dont know your data structure 🙂
somber prism
median fulcrum
I think it's possible
also you wont know what kind of products being sent to classify whether they are norm or anomaly as long as they are under certain conditions
median fulcrum
shut trail
id give you the code but i dont know your data structure 🙂
lol

 serene scaffold
median fulcrum
lol
serene scaffold
median fulcrum
lol
they can't replicate your data locally if you provide it as a screenshot (unless they manually type all of that out)
median fulcrum
serene scaffold
they can't replicate your data locally if you provide it as a screenshot (unless...
it's jut the data structure
serene scaffold
median fulcrum
it's jut the data structure
yes, but if they want to figure out what operations would or wouldn't work with it, they'd have to at the very least create mock values.
median fulcrum
serene scaffold
yes, but if they want to figure out what operations would or wouldn't work with ...
yes, but what we are trying to do it's not so easy, with the data sctructure make more clear
 robust jungle
How can I train a transfer learning object detector? I already have annotations/images.
serene scaffold
median fulcrum
yes, but what we are trying to do it's not so easy, with the data sctructure mak...
My point is that it's easier for people to help you if you provide the text of the data. print(df.head().to_csv()) is much easier to work with for those trying to help.
median fulcrum
serene scaffold
My point is that it's easier for people to help you if you provide the text of t...
yes, but the guy which I was talking, ask me the data structure. But I think the strategy would not work since we have a lot of countries. Anyway in the next time that I need I will provide the material, sorry.
 still delta
Reinforcement Learning geek?
shut trail
median fulcrum
yes, but the guy which I was talking, ask me the data structure. But I think the...
transpose that bad boy
its not as big a set as you think lol
median fulcrum
shut trail
its not as big a set as you think lol
don't you think complicated in this database?
shut trail
years and countries . no .
5 million observations with spatial parameters and things slow way down lol
its complicated enough to demonstrate skills! dont get me wrong, its good. I just meant in my own opinion that is not a large table. I think you could open that with google sheets no problem
shut trail
serene scaffold
yes, but if they want to figure out what operations would or wouldn't work with ...
this person is teaching you how to communicate with programmers and analysts
 wise pelican
So I know that mean absolute deviation and median absolute deviation help tell how far elements in a dataset deviate away from the mean and median
For a data set where maintaining a higher value consistently is important, would doing the same for a stuff like quantiles/percentiles work?
Say I have this function for getting the mean & median absolute deviation (that I found on stackoverflow):
def get_median_abs_dev(x):
    med = np.median(x)
    x = abs(x-med)
    MAD = np.median(x)
    return MAD

df['Metric Mean Absolute Deviation'] = df.groupby('Cluster').mad()
df['Metric Median Absolute Deviation'] = df.groupby('Cluster')['Metric'].transform(get_median_abs_dev)
Would doing something like this be productive, or are the mean/median absolute deviation metrics doing what I'm looking for already?
def get_75th_abs_dev(x):
    quantile = np.percentile(x, 75)
    x = abs(x-quantile)
    quantile_abs_dev = np.median(x)
    return quantile_abs_dev

df['Metric 75th Percentile Absolute Deviation'] = df.groupby('Cluster')['Metric'].transform(get_75th_abs_dev)
 rapid hornet
Hello do machine learning and artificial intelligence fall into the things a data scientist needs to learn or can learn if he wishes to? or is it a completely different field?
 pine wolf
data science is a pretty wide net, a data scientist isn't required to know anything about machine learning
rapid hornet
Is it a completely different field if someone is interested to learn them?
 languid sluice
rapid hornet
Is it a completely different field if someone is interested to learn them?
languid sluice
rapid hornet
Is it a completely different field if someone is interested to learn them?
a data scientiest doesn't even have to work with computers, though they often do as computers are good with it
rapid hornet
languid sluice
a data scientiest doesn't even have to work with computers, though they often do...
Humm interesting, for me I want to learn enough programming to become an expert enough at manipulating data (sort of like a data scientist) to help me in the field i actually want to specialize in and then later on use AI and Machine learning to create my own app
Do you think it's doable or?
 trail badge
can anyone please help a bit, how do i slice a .json file 500 MB to create a NEW .json file with less objects (like 1000 objects ) maybe 20 MB.? .json data is formated in a single array with more around 1 million objects #help-cupcake #help-kiwi
 ocean flower
You might try using rpy2 to import the R package ggplot2 in to Python. What you're trying to do is pretty much what ggplot2 is made for. https://rpy2.github.io/ https://www.rdocumentation.org/packages/ggplot2/versions/3.3.5
A system for 'declaratively' creating graphics,
based on "The Grammar of Graphics". You provide the data, tell 'ggplot2'
how to map variables to aesthetics, what graphical primitives to use,
and it takes care of the details.
median fulcrum
ocean flower
You might try using rpy2 to import the R package ggplot2 in to Python. What you'...
The strange is that all websites show that catplot can plot two graphs as once, but idk what I am doing wrong

Stack Overflow
I am trying to plot two catplots in same figure. I tried to use subplot() function but no result.
Here is the code I am using for ploting one catplot at a time.
First Catplot
fig, axs =plt.subp...
ocean flower
median fulcrum
The strange is that all websites show that catplot can plot two graphs as once, ...
It probably can, I just really like how intuitive ggplot2 is. To be honest, I hardly use the Python graphing libraries at all. I'll occassionally use them to look at how my Keras models are training, but that's about it.
 tranquil folio
rapid hornet
Humm interesting, for me I want to learn enough programming to become an expert ...
tranquil folio
rapid hornet
Humm interesting, for me I want to learn enough programming to become an expert ...
My impression is it's a "can". Not required but a common specialty
median fulcrum
ocean flower
It probably can, I just really like how intuitive ggplot2 is. To be honest, I ha...
really? I found that python was pretty constant in plots when R was giving me some confusing parameters
ocean flower
median fulcrum
really? I found that python was pretty constant in plots when R was giving me so...
That's interesting! ggplot2 does have a fair number of parameters, but they all correspond to very specific aspects of a graph, and the ability to duplicate parameters (e.g. multiple "aesthetics" in one graph, although I do fin the use of the word "aesthetics" for this a little questionable as its really a variable mapping) with specific colors et cetera makes the whole thing much more versatile and customizable while also making a lot of obvious sense.
median fulcrum
ocean flower
That's interesting! ggplot2 does have a fair number of parameters, but they all ...
I think if I do R plots I would be much more slow than python, since I would search a lot about the parameters, for me python is more "put x, y and the data, the rest we look after"
ocean flower
median fulcrum
I think if I do R plots I would be much more slow than python, since I would sea...
Yeah the ability to do stuff fast is pretty much the ONLY reason I would use Python plots, but for a graph that's really high quality and visualizes something difficult to see, I find ggplot2 is much superior.
median fulcrum
ocean flower
Yeah the ability to do stuff fast is pretty much the ONLY reason I would use Pyt...
I think it's in this way that we have to use julia in some projects....
ocean flower
median fulcrum
I think it's in this way that we have to use julia in some projects....
Maybe. I actually don't know Julia myself.
median fulcrum
ocean flower
Maybe. I actually don't know Julia myself.
The ability to use ggplot2 and seaborn could make the development of an study much faster
ocean flower
median fulcrum
The ability to use ggplot2 and seaborn could make the development of an study mu...
Indeed. Not a huge seaborn expert, but I think you probably could make the type interchange without too much trouble.
median fulcrum
median fulcrum
https://stackoverflow.com/questions/56937029/plot-two-catplots-in-same-figure-us...
idk if was i lib update or whatever but even the example of this guy doesn't work for me
it's giving me this warning too:
UserWarning: catplot is a figure-level function and does not accept target axes. You may wish to try barplot
  warnings.warn(msg, UserWarning)
barplot
hmmm
rapid hornet
tranquil folio
My impression is it's a "can". Not required but a common specialty
ok thank you!
 desert oar
wise pelican
So I know that mean absolute deviation and median absolute deviation help tell h...
desert oar
wise pelican
So I know that mean absolute deviation and median absolute deviation help tell h...
yes, i these are reasonable stats to consider! it's actually a good thing to think about the entire probability distribution of "deviations", not just the central tendencies
desert oar
rapid hornet
Humm interesting, for me I want to learn enough programming to become an expert ...
manipulating data is not necessarily required for data science, nor are data scientists adept at manipulating data. however, imo it's a very useful skill to be able to manipulate data, so you don't have to think hard about it, and you can focus your energy on your project.
@wise pelican why .transform and not .agg for mean abs dev? also i believe mean abs dev has some bad statistical properties, but let me double check that for you
(also written "average absolute deviation" AAD to avoid the conflicting MAD abbreviation)
also there's a question of deviation around the mean or around the median 🙂
 mortal dove
I'm working on an ARIMA model, I want to know how significant something should have impacted the model to be considered an intervention.
In 2014 South Africa implemented new travel regulations for tourists, requiring specific documents if a child is not traveling with both their parents.
To me it looks like the underlying pattern has changed in sometime in 2014. If the chance is indeed significant enough to be considered an intervention, is there any way to exactly pick which month the intervention happened in? Or would I be going back on news articles and finding out when exactly the changes were implemented/announced?
 desert oar
ah i was thinking of MAPE, which has a lot of issues
 sour mango
if I have the same file name as a .py file and a .ipnyb file, does the naming convention state the use of _notebook in the name of the .ipynb file?
desert oar
sour mango
if I have the same file name as a .py file and a .ipnyb file, does the naming co...
no, the file extension is enough
desert oar
mortal dove
I'm working on an ARIMA model, I want to know how significant something should h...
"change point detection" is a broad category. i agree that it looks like there might have been a big mean shift + a possible change in trend from linear to curved/flattening
mortal dove
Appreciate it. Just wanted a bit of confirmation of my own thoughts on this.
wise pelican
desert oar
(also written "average absolute deviation" AAD to avoid the conflicting MAD abbr...
I admittedly did very little research into MAD, since I became curious that AAD might not be completely accurate
And the use of .transform instead of .agg is merely me coming across someone's answer on stackoverflow and using that as a basis of "should I even bother with MAD and QAD (quantile average deviation)"
 silver summit
anyone know why pyspark uses camel case in methods? feels so odd to write snake case for everything else then when I use spark this convention is broken
maybe to keep the api as similar to scala as possible?
shut trail
median fulcrum
hmmm
i said dont use cat plot, its not what you want. you want two scatter plots in side by side subplots 🙂
R is great, so is ggplot2. but so is seaborn. no reason to learn a whole new thing if we still working on data types. In R you will still have to transform your data
silver summit
(don't learn R, you will hamstring yourself)
median fulcrum
shut trail
i said dont use cat plot, its not what you want. you want two scatter plots in s...
I got it but not with catplot or scatterplot, I find a stripplot
🙂
shut trail
for your second figure that would be perfect
not for life expt against time though
show it off when youre done 👀
 thin palm
How do we know which features to pick once we look at correlations?? There's not many directions I've found on Google
Because I've cleaned the data, now we have 44 features but of course we aren't going to use all of them, how do we know which one to pick???
 thick swift
I only have experience on R for modelling, but, in general, you remove all variables that are correlated with each other, and then you can either reduce a full model down to a minimum model, or build it up.
Or, alternatively (and generally better) you do multimodel inference.
thin palm
hmm, not sure if I've ever heard mulitmodel inference!
will be something to Google for sure
thick swift
Although 44 variables are a lot. How many observations do you have?
thin palm
44 variables was just what I was given of course, 43 once I separate our target
the target var is 'default' which is the first on the list
 thick swift
Can you remove some a priori due to probable poor effect?
thin palm
but that's what I'm trying to understand
because what if I remove something important
this is what I'm afraid of
thick swift
Thing is, you remove things that, like, macroscopically are probably not affecting each other
If I was looking at gene expression, I would discard a variable that describes, like, the effect of planetary bodies.
Get what I mean?
thin palm
Yeah I see what you're getting at
thick swift
In any case, what's your sample size?
thin palm
yup, so I think what I'll do is figure out more correlation and pick what I think would make the most sense
and then go from there to build a Classification model
appreciate your time man
Thanks!
thick swift
I say you could do multimodel inference. It'll get you somewhere at least.
No problem. Have fun!
thick swift
shut trail
i use both lol but python is def more useful
R is a language too. Just full of bad choices.
(sorry for the zombie ping)
ocean flower
shut trail
i mean.. its a language lol
Indeed. Love R, ESPECIALLY ggplot2 and a lot of its statistical libraries, but I don't really consider it a language. It's more a statistical software that uses the format of a language. I like to tell people about Rpy2 though, because it allows you to use R IN Python code, and it seems a lot of folks don't really know about it.
silver summit
thin palm
44 variables was just what I was given of course, 43 once I separate our target
why is 44 variables a lot?
I generally use anywhere from 100 to 400 variables at work and it's definitely ok. Working with compliance or policy teams and having to explain each feature might suck tho haha
ocean flower
silver summit
I generally use anywhere from 100 to 400 variables at work and it's definitely o...
One of the benefits of being an Industrial Engineer is you never have to explain why you used a variable.
silver summit
@ocean flower almost all of ours have to be explainable. We need to say this decision about the customer was made b/c x or y.
which also forces us to use monotonic contstraints... sort of sucks...
ocean flower
silver summit
<@!894744601045381221> almost all of ours have to be explainable. We need to sa...
I can definitely see how that would happen.
IE's funny because we really aren't making decisions, we're just criticizing everybody else and throwing rhetorical firebombs throughout the factory and supply chain.
It's almost like publishing a magazine: the production manager is the writer, and we're the editor with the red pen sending him all the notes while his name still is the only one that ends up on the story...
silver summit
well we get sued if we don't do this lol
ocean flower
IE's never get sued. LOL!
silver summit
also, need to make sure decisions aren't made off protected traits like gender or ethnicity
ocean flower
silver summit
also, need to make sure decisions aren't made off protected traits like gender o...
And that's a big one right there.
silver summit
it also constrains the models we can build... like... almost always xgboost... I'm not a DS, I'm an XGBoost Engineer..
ocean flower
silver summit
it also constrains the models we can build... like... almost always xgboost... I...
Yeah our main constraint ends up being consistency with previous reports. We're always supposed to make the final product as similar to previously published documents as possible.
And that also means we modify our methods to make such consistency possible.
This is a bigger problem than you would think it would be.
Especially because the previous reports are frequently predicated upon incredible levels of statistical illiteracy.
silver summit
what sort of models do you use?
I took a few IE courses back in the day. Convex and Non-Linear Optimization.
ocean flower
A lot of IoT OEE, predetermined time systems, linear regression, monte carlo simulations, and sometimes, deterministic models that are, to be honest, complete BS but demanded by management.
Oddly enough, I have only had one job since college that asked for a Linear or Non-Linear Program, and it wasn't technically an IE job.
Databases ends up being a HUGE part of my job though. Most of what I learned about DS, I learned on the job as an IE.
DS is especially important when looking at a massive supply chain or the runtime logs of automated machinery.
silver summit
I really need to up my game on DBs tbh... I just basically know sql. Run hive queries and then do anything fancy in spark.
ocean flower
Well SQL is a lot of it. Honestly, you have most of what you need to know just from that. I remember on LinkedIn someone was comparing programming languages to various romcom girls as a joke, and my comparison was that Excel was that boring girl from down the street that my dad keeps trying to set me up with, while SQL is the madame: no skill required, and she can get you ANYTHING!!!
silver summit
lol yeah pretty much
I mostly want to understand when to use what database and the tradeoffs
system design perspective
daughter is awake from her nap, back later
ocean flower
Well 99.9% of the time, the database system will already have been chosen for you by somebody else for a great many reasons that may have nothing to do with traditional system design (e.g. which company offered the better contract to operate the database). What's more important is knowing how to find what you need, how to get it, and how NOT to get it.
And I'm logging off too, since I know you won't be able to respond for quite some time and I have an appointment in 30 minutes anyways.
desert oar
on the other hand, sometimes you are out there on your own and have to just use any database
in which case, pick one, learn it well enough to be dangerous, and don't worry about the other options
i suggest postgres: it apparently has issues scaling to super-high workloads, but it has a huge feature set and its performance is good enough for data science stuff
sqlite is also a good option if only because it's so simple, doesn't need a server etc. useful for things like setting up an ad-hoc local feature store for a machine learning project, or storing model predictions and experiment outputs
 analog mirage
 iron basalt
Help how?

 prisma mulch
HELP!
#importing libraries
import pandas as pd
import matplotlib.pyplot as plt
from sklearn.metrics import mean_absolute_error
from sklearn.model_selection import train_test_split
from sklearn.ensemble import RandomForestRegressor
import numpy as np

#reading data
df = dataframe1 = pd.read_csv("training_V6final.csv")

#cleaning out values with no data
df = df.dropna(axis=0, how='all')

#setting target and features
target = df.VA
factors = ['diagnosis','preCST','CST']
markers = df[factors]

# splitting data into evalset and trainset
train_markers, eval_markers, train_target, eval_target = train_test_split(markers, target, random_state=0)

#creating the model
model = RandomForestRegressor(random_state = 0)
model.fit(markers, train_target)
predictions = model.predict(eval_markers)
print(mean_absolute_error(eval_target, predictions))
print(predictions)
df.describe()
saved_predictions = pd.DataFrame(predictions, columns=['predictions']).to_csv('prediction.csv')
Traceback:
ValueError: Found input variables with inconsistent numbers of samples: [2162, 1621
trying to use sklearn random forest, but it keeps erroring out. I found a bunch of results on so, but none have the answer that I am looking for. I thought it was a data problem, so I decided to drop all the rows with empty entries. Still doesn't work :(
 main fox
prisma mulch
trying to use sklearn random forest, but it keeps erroring out. I found a bunch...
main fox
prisma mulch
trying to use sklearn random forest, but it keeps erroring out. I found a bunch...
Change dropna() param to how="any"
 lapis sequoia
<@456226577798135808>
lapis sequoia
lapis sequoia
<@456226577798135808>
yes?
import
await
like this it has to some command to change color @lapis sequoia
ok
hmm come to dm
@bot.listen
@client.listen
discord bot?
i know it
import discord.py
talk later
thisone
ok
 royal crest
?
 brisk trench
Has anybody here done the Google Machine Learning Crash Course? If so, what are your thoughts on it and would you recommend it?

Google Developers
 tender hearth
brisk trench
Has anybody here done the Google Machine Learning Crash Course? If so, what are ...
tender hearth
brisk trench
Has anybody here done the Google Machine Learning Crash Course? If so, what are ...
It's a crash course so it's fast paced and it throws a lot of terminology at you
It's not exactly the best beginner-friendly course but it's still fine
 grave frost
silver summit
it also constrains the models we can build... like... almost always xgboost... I...
grave frost
silver summit
it also constrains the models we can build... like... almost always xgboost... I...
ooof
lapis sequoia
does anyone know ai
can someone join vc and help me with tensorflow
i know what i want to do
i have the data
i dont know how to do it
pls
vc
grave frost
brisk trench
Has anybody here done the Google Machine Learning Crash Course? If so, what are ...
I did quite some time ago and personally liked it pretty much; it may be slightly complex but its a good primer I beleive. just google and read up stuff you don't understand - no course is going to spoonfeed
 dull turtle
hello i have a data in csv file, I am working with pandas dataframe. in my data frame i have a date column, i have dropped the duplicate dates and saved unique dates in rem_date_dup this variable.
i have to get first date from rem_date_dup variable along with last close value of that day and i want to subtract it from next days every close value
my code ```python
bnf_df = pd.read_csv('/BANKNIFTY.csv', names = ['script_name', 'expiry', 'call/put', 'strike_price', 'date&time', 'open', 'high', 'low', 'close', 'volume', 'col1'])
nf_df = pd.read_csv('/NIFTY.csv', names = ['script_name', 'expiry', 'call/put', 'strike_price', 'date&time', 'open', 'high', 'low', 'close', 'volume', 'col1'])
bnf_date_sep = pd.to_datetime(bnf_df['date&time']).dt.date
bnf_time_sep = pd.to_datetime(bnf_df['date&time']).dt.time
bnf_close = bnf_df['close']
new_bnf_df = pd.DataFrame()
new_bnf_df.insert(0, value = bnf_date_sep, column = 'bnf_date')
new_bnf_df.insert(1, value = bnf_time_sep, column = 'bnf_time')
new_bnf_df.insert(2, value = bnf_close, column = 'bnf_close')
remove duplicate from dates
rem_date_dup = bnf_date_sep.drop_duplicates()
i = 0
for date in rem_date_dup:
print('date =', date)
prev_date = new_bnf_df.loc[new_bnf_df['bnf_date']== date]
#get prev day close (03:30)
prev_day_close = prev_date['bnf_close'].iloc[-1]
print('prev_day_close =', prev_day_close)
print()
#get next day 09:15 to 03:30 close
for j in rem_date_dup.iloc[1]:
print('j=', j)
break``` my code here
my data frame this way..
how i can get close value for next date
now i am getting python date = 2017-03-01 prev_day_close = 20837.85 this output and
Traceback (most recent call last):

  File "F:\nifty_banknifty_data\banknifty_backtest1.py", line 28, in <module>
    for j in rem_date_dup.iloc[1]:

TypeError: 'datetime.date' object is not iterable ``` this errorhow i can get date next to date = 2017-03-01 this that is date = 2017-03-02
ping me when replying
 arctic wedgeBOT
Hey @dull turtle!
It looks like you tried to attach file type(s) that we do not allow (.xlsx). We currently allow the following file types: .gif, .jpg, .jpeg, .mov, .mp4, .mpg, .png, .mp3, .wav, .ogg, .webm, .webp, .flac, .m4a.
Feel free to ask in #community-meta if you think this is a mistake.
dull turtle
my csv file data here
 silver summit
the error is saying you can't iterate over a single datetime object
are you trying to do this for every removed date or just one?
dull turtle
silver summit
are you trying to do this for every removed date or just one?
see i get the first date now i want to get the date next to first date
see now i get date = 2017-03-01 this date how i can get 2017-03-02 this date ?
silver summit
add one day to is?
dull turtle
silver summit
add one day to is?
add one day from that rem_date_dup this variable
silver summit
pd.Timedelta(days=1)
add or subtract this from your timestamp, this is how you get the previous or next day
dull turtle
silver summit
add or subtract this from your timestamp, this is how you get the previous or ne...
can u show how way u are saying?
silver summit
I don't have time but what I said sounds like it addresses your question.
pretty sure you just need a groupby here as opposed to all this loop stuff also
brisk trench
grave frost
I did quite some time ago and personally liked it pretty much; it may be slightl...
I think I will go ahead and do it then. Thanks for the feedback.
brisk trench
tender hearth
It's a crash course so it's fast paced and it throws a lot of terminology at you
I have some basic knowledge on the topic so I think I should be fine. I'm good at self-learning too so I should get by I think.
 winter summit
import math

#****************************AR*EA*****************************#
b = input("Base Here: ")
h = input("Altezza Here: ")
#****************************AR*EA*****************************#
#**************************PERI*M*ETRO************************#
h2 = math.pow(h)
b2 = math.pow(b)

t = b2 + h2
t2 = math.sqrt(t)
t3 = b * h
#**************************PERI*M*ETRO************************#
#****************************TOT*ALE**************************#
print(str("Area: "+ t3))
print(str("Perimetro: "+ t2))
#****************************TOT*ALE**************************#
whats wrong with this code
shut trail
i want some tote ale, any good?
shut trail
winter summit
whats wrong with this code
where's you wana start ?
 wicked grove
@desert oar@serene scaffold hello, could you please tell me if my code is okay , i just wanted to make sure before i train the model
https://paste.pythondiscord.com/uzewaqaqox.py i used the analyzer,i guess i am a little confused with the last bit of code
grave frost
Does the p-value indicate the probability of the sample statistic not following H(0) given some significance threshold alpha, or the probability of an element from the distribution (say bulbs, then does the p-value represent the probability of the bulb being different than the others, or the whole sample)??
wicked grove
wicked grove
<@!389497659087650836><@!253696366952316929> hello, could you please tell me if...
My X_train looks like this and i guess that is incorrect

 hollow ember
how to fix this?
 wicked grove
hollow ember
how to fix this?
wicked grove
hollow ember
how to fix this?
I think you have to pass label='count'
hollow ember
i dont get u
wicked grove
sns.countplot(df['label'],x='label')
prisma mulch
main fox
Change dropna() param to how="any"
thanks. It turns out there was a problem with my data
 formal lava
How do I import specific data from an api?
 arctic crown
 silver summit
formal lava
How do I import specific data from an api?
silver summit
formal lava
How do I import specific data from an api?
how do you call an api you mean? use requests library, here's like the first google result https://stackoverflow.com/questions/49593657/how-to-call-an-api-using-python-requests-library
Stack Overflow
I can't figure out how to call this api correctly using python urllib or requests.
Let me give you the code I have now:
import requests
url = "http://api.cortical.io:80/rest/expressions/similar_t...
formal lava
I figured everything out
 tight walrus
I wanna open a csv file, but it doesn't work fsr, anybody can help?

 finite coral
@tight walrus extra “ at the end of the line looks like to me
tight walrus
oh, ye, thanks
arctic wedgeBOT
:incoming_envelope: :ok_hand: applied mute to @delicate isle until <t:1635026543:f> (9 minutes and 59 seconds) (reason: duplicates rule: sent 4 duplicated messages in 10s).
desert oar
grave frost
Does the `p-value` indicate the probability of the sample statistic not followin...
Neither. It's the probability of, under the null hypothesis obtaining a sample statistic at least as large as what you obtained.
desert oar
wicked grove
https://paste.pythondiscord.com/uzewaqaqox.py i used the analyzer,i guess i am a...
Don't use fit_transform on the test data, just use transform. You don't want to re-fit the transformer on the test data, that makes no sense... I encourage you to think about why
grave frost
desert oar
Neither. It's the probability of, under the null hypothesis obtaining a sample s...
under the null hypothesis?
Doesn't the sample statistic itself dictate which hypothesis to chose, defined by the threshold Alpha/level of significance?
desert oar
@wicked grove also you probably don't need to convert back to dataframe
desert oar
grave frost
Doesn't the sample statistic itself dictate which hypothesis to chose, defined b...
The sample test statistic follows a certain distribution if the null hypothesis is true, eg Normal, T, Chi2, etc. The p-value is the CDF (or difference between CDF values, in a 2-sided test) of that null hypothesis distribution. The whole point is that, if the p-value is below some threshold (the "size" of the test, usually denoted α), then the sample statistic is deemed so improbable that we can reject the null hypothesis.
The size of the test is the cutoff before you say that the test statistic is so improbable as to reject the null in favor of the alternative
 velvet thorn
desert oar
Neither. It's the probability of, under the null hypothesis obtaining a sample s...
velvet thorn
desert oar
Neither. It's the probability of, under the null hypothesis obtaining a sample s...
extreme?
velvet thorn
grave frost
Does the `p-value` indicate the probability of the sample statistic not followin...
you should also distinguish between probability and confidence
is helpful in this case IMO
grave frost
desert oar
The sample test statistic follows a certain distribution _if the null hypothesis...
that's even more confusing lol
velvet thorn
grave frost
that's even more confusing lol
what do you find confusing about it
desert oar
It is definitely brain bending a little
It helps to work through some basic examples
Convince yourself that the distribution of a test statistic assumes and depends on the null being true
Generate datasets from the null and alternative hypothesis, plot the test stat (and p-value) distributions
grave frost
say that we take an example of "lifetime of bulbs", with the true population mean being 10 hours, sample mean being 8 hours. Sigma is 2, sample size = 40. In that case, the resulting p-value shows that the result is significant.
From that example, does it reflect something about the samples?
that the chances of getting the mean to be 8 is the p-value?
grave frost
velvet thorn
what do you find confusing about it
I think its more fundamentally what the p-value represents exactly; my teacher just told us its the probablity that the sample mean is the given value 🤔
desert oar
grave frost
I think its more fundamentally what the p-value *represents* exactly; my teacher...
Your teacher is incredibly wrong
That's disturbing
desert oar
grave frost
that the chances of getting the mean to be `8` *is* the p-value?
Yes, specifically the chances under the null hypothesis
So technically kinda sorta they aren't wrong, but practically it's the most wrong way to teach it i can imagine, because it's such a common misconception and the truth is a lot more subtle
grave frost
desert oar
Your teacher is incredibly wrong
yes, I understood that myself; hence why I am asking my doubt here rather than in the classroom 🙂
well, it has to be the probablity of something - which I don't get at all
it kinda makes sense that for the distribution of sample means, we are simply taking the z-score and seeing if it lies in some pre-set interval of the distribution; from what I interpreted, this would imply the probablity of the sample mean value of values in the end of the tails...
so his logic kinda made sense to me
velvet thorn
grave frost
well, it has to be the *probablity* of something - which I don't get at all
no
or rather, yes
but it's important to distinguish between probability and confidence
velvet thorn
grave frost
well, it has to be the *probablity* of something - which I don't get at all
okay so first
the population mean or whatever you're comparing to is what it is
your experiment doesn't change that
and you've carried it out and gotten a certain experimental value
now the question you're asking is - "how likely was it for me to get this value?" and you can't answer that without making some assumptions about the probability distribution you're experimenting with
those assumptions are your hypotheses
@ that point, if that original assumption holds true (under the null hypothesis), how likely was it that this value would have arisen?
grave frost
velvet thorn
those assumptions are your hypotheses
what
velvet thorn
alpha is the threshold below which we say "okay, this is so unlikely that I would rather believe that my original assumption doesn't hold than that this extreme result came about by chance"
velvet thorn
grave frost
what
you have a bunch of model A machines and a bunch of model B machines
grave frost
ok so now apparently I don't even know what's a hypothesis anymore.... :\
velvet thorn
you start by assuming that there is no difference between their output
that forms your null hypothesis, mu_A = mu_B
for example.
grave frost
but we aren't making any assumptions about the distribution - just a particular... event? outcome?
velvet thorn
grave frost
but we aren't making any assumptions about the distribution - just a particular....
we're assuming that the random values are drawn from the same distribution
or equivalently, two identical distributions
grave frost
k, go on
velvet thorn
velvet thorn
alpha is the threshold below which we say "okay, this is *so* unlikely that I wo...
this is rejecting the null hypothesis
grave frost
well, how does that tie into p-values?
if say the output of some machine is A, and I found experimentally that the sample mean was B. what does the p-value of B even mean, in this context?
velvet thorn
the p-value is the a priori probability that you would have gotten a result at least as extreme, assuming the null hypothesis was true
to put it into context again
it is possible that you just happened to get outputs from A and B that were on either side of the mean respectively
grave frost
velvet thorn
the p-value is the a priori probability that you would have gotten a result at l...
null hypothesis being there was no change? 😖
velvet thorn
the p-value is the quantitative representation of that
velvet thorn
grave frost
null hypothesis being there was no change? 😖
that the two means are the same
grave frost
yes so the p-values just gives the probablity of some value, say C occuring?
velvet thorn
grave frost
yes so the p-values just gives the probablity of some value, say C occuring?
what?
grave frost
given a gaussian distribution, p-values are the area for 2[P(Z > Z_1)]
velvet thorn
grave frost
given a gaussian distribution, p-values are the area for `2[P(Z > Z_1)]`
not necessarily
two-tailed only
okay
you know what
it may be easier for you to think of it this way
grave frost
velvet thorn
not necessarily
🙏
velvet thorn
what's the probability that the difference between the two means is nonzero and more than a certain amount?
if they were from the same distribution
then the mean of A - B (where A and B are the distributions for machines of groups A and B respectively)
should be 0, right?
grave frost
yes
velvet thorn
yeah.
so
now you have a calculated difference
of the sample means
(not going to go into the specifics of e.g. t-distribution here but)
velvet thorn
velvet thorn
should be 0, right?
this
is the null hypothesis.
you are assuming that they come from the same distribution, ergo the mean of the resultant distribution is 0.
velvet thorn
you have a value which is drawn from that resultant distribution.
which leads to 2 cases.
- it is so extreme that the probability of it having come from the distribution you assumed it to be is very low. because of this, you reject your original assumption (the null hypothesis)
- it is insufficiently extreme that you cannot draw the above conclusion
velvet thorn
grave frost
2 distributions are complicating it
it's not complicatingi t
they are conceptually different
they just happen to be equal
grave frost
velvet thorn
1. it is so extreme that the probability of it having come from the distribution...
yes, I get the H(a) and H(0)
grave frost
velvet thorn
it's not complicatingi t
tbh I haven't grasped enough to understand the interplay of 2 distributions
its 2 A.M here, I would probably hunt for a 3B1B vid tmrw 🥴
still, thanks a lot guys - have some inkling of what exactly it is
 past bronze
Hey, I've run an A/B test and I've got my 2 groups with number of conversions and visitors in each group, is there a really simple way to check for statistical significance using a package or something like that?
 stoic musk
Using Tensorflow for the first time, running a CNN on a functional api:
AttributeError: 'Flatten' object has no attribute 'shape'
I must be making a silly tiny mistake
Traceback is:
outputs = tfl.Dense(units= 6 , activation='softmax')(F)
where F = tfl.Flatten()
wicked grove
desert oar
Don't use `fit_transform` on the test data, just use `transform`. You don't want...
alrightt,so i am guessing i should not apply fit_transform on the entire dataset and then split it into x_train and x_test ?
stoic musk
Some one can verify but I believe you're not supposed to apply fit() to the test data because you'll be computing different values of the mean and standard deviation between your test and train sets, if you do
You'd effectively be running two different normalizations on your train and test sets
Does anybody else find the Tensorflow syntax to be a bit confusing?
I just spent like 30 mins trying to figure out why my function calls weren't working, only to find out if you want to run a function on a tensor, you have to do it like
function(params='x' ) (tensor)
instead of
function(tensor, params='x') like... everything else in Python
dull turtle
hello
i am working with pandas and csv file
i have stock market data for 1 year
i want to calculate difference of
previous day close value at time 03:30 or which ever near to 03:30 (15:30) - current day close value for each time interval
import pandas as pd
bnf_df = pd.read_csv('F:/nifty_banknifty_data/BANKNIFTY.csv', names = ['script_name', 'expiry', 'call/put', 'strike_price', 'date&time', 'open', 'high', 'low', 'close', 'volume', 'col1'], parse_dates=['date&time'])
nf_df = pd.read_csv('F:/nifty_banknifty_data/NIFTY.csv', names = ['script_name', 'expiry', 'call/put', 'strike_price', 'date&time', 'open', 'high', 'low', 'close', 'volume', 'col1'], parse_dates=['date&time'])
bnf_df['date'] = bnf_df['date&time'].dt.date
bnf_df['time'] = bnf_df['date&time'].dt.time
grouped = bnf_df.groupby(['date'], sort=False)
#get unique dates from date column
unique_date = grouped.head(1)['date']
print('unique_date')
print(unique_date)
print()
# get 15:30 close of each date
close_each_date = grouped.tail(1)['close']
print('close_each_date')
print(close_each_date)
print()
#get first date and its close value(LTP)
first_date = unique_date.iloc[0]
print('first_date')
print(first_date)
#close price for first date (LTP)
first_close = close_each_date.iloc[0]
print('first_close=',first_close)
next_date = unique_date.iloc[1]
print('next_date=', next_date)
print()```how i can get first day close value at 03:30 pm or whichever near to 03:30pm - current_day close value for each time interval
wicked grove
wicked grove
alrightt,so i am guessing i should not apply fit_transform on the entire dataset...
because it will be learning the features of the testing set too then?
dull turtle
for e.g python prev_day close val = 32563.21 current_day close val at 09:26:12 = 32574.12 32563.21 - 32574.12 = difference here current_day close val at 09:31:12 = 32123.12 32563.21 - 32123.12 = difference here current_day close val at 10:47:52 = 32748.96 32563.21 - 32748.96 = difference here current_day close val at 11:34:49 = 32965.23 32563.21 - 32965.23 = difference here this way
stoic musk
Well you trained your parameters on an existing set of values for mean and std dev, so if you use different values you might skew your predictions I think
prisma mulch
anybody have experience with nltk? pls ping
wicked grove
@desert oar i tried it, i also removed the @lapis sequoias and used multinomial naive bayes.My accuracy is poor. Could you please guide me again https://paste.pythondiscord.com/ifiyivojel.py
dull turtle
dull turtle
for e.g ```python
prev_day close val = 32563.21
current_day close val at 09:26:1...
can anyone help me in this ?
lapis sequoia
pip install pyartificialintelligence
dull turtle
lapis sequoia
I'll help
hii
lapis sequoia
pip install pyartificialintelligence
dull turtle
i am working with pandas dataframe
dull turtle
for e.g python prev_day close val = 32563.21 current_day close val at 09:26:12 = 32574.12 32563.21 - 32574.12 = difference here current_day close val at 09:31:12 = 32123.12 32563.21 - 32123.12 = difference here current_day close val at 10:47:52 = 32748.96 32563.21 - 32748.96 = difference here current_day close val at 11:34:49 = 32965.23 32563.21 - 32965.23 = difference here
this way see this
lapis sequoia
So?
Then
Continue
HELOOOOOOOOOOOOOOOOOOOOO
can someone join vc to help at simple ai im tring to develop
predection ai
simple
dull turtle
lapis sequoia
Continue
i want to do this way as i shown in this
lapis sequoia
Python??
@lapis sequoia
yes
I'll help you
Use my module
god thanks
pyartificialintelligence
pip install pyartificialintelligence
Then
Use pyartificialintelligence.say("hi)
For test
It will speak and print hi
bro
Go through init.py
For music's
And a perfect ai module
what i have is a little different
What??
Show me code
Just basic
So I can understand
man what i have is a huge array of ["a", "b", "c" , ....] going in certain patterns
and i want to predit it
and i have training and pattern data
Wait ok I'll look into It!
#bot-commands
Jesus someone listen to me
dull turtle
hello i have ```python
next_days..
597 2017-03-02
1252 2017-03-03
1904 2017-03-06
2551 2017-03-07
3113 2017-03-08
170463 2018-02-23
171126 2018-02-26
171765 2018-02-27
172425 2018-02-28
173098 NaN
Name: date, Length: 248, dtype: object``` this way
how i can get rows related to these dates from my dataframe
ping me when replying
lapis sequoia
The example is to create # pandas dataframe from lists using zip. import pandas as pd # List1 Name = ['tom', 'krish', 'arun', 'juli'] # List2 Marks = [95, 63, 54, 47] # two lists. # and merge them by using zip(). list_tuples = list(zip(Name, Marks)) # Assign data to tuples. print(list_tuples) # Converting lists of tuples into # pandas Dataframe. dframe = pd.DataFrame(list_tuples, columns=['Name', 'Marks']) # Print data. print(dframe)What??
Shit
It would be nice if I am using pc
 soft temple
hi
i m new to python ai
currently learning pytorch
just wanted to ask wt .backward() does
 ember estuary
hi all. I have a basic neuronetwork, which guesses matrix column. Can anybody explain, what does this line mean?
this one:
adjustments = np.dot( input_layer.T, err * (outputs * (1 - outputs)))
desert oar
wicked grove
alrightt,so i am guessing i should not apply fit_transform on the entire dataset...
Correct. You need to fit and transform the training set, and only transform the test set
@grave frost the basic concept is that, if you obtain data that is incompatible with one of your assumptions, you must reject one of those assumptions. In the case of hypothesis testing, the assumption is "the null is true", and the data is "a test statistic that is wildly improbable if the null is true"
grave frost
desert oar
<@738058085083381760> the basic concept is that, if you obtain data that is inco...
oh yea, but my question is actually too fundamental - what exactly is the p-value, why do we need it? what does it actually represent?
desert oar
grave frost
oh yea, but my question is actually too fundamental - what exactly is the p-valu...
I told you, it's P(abs(T) > abs(t) | H0)
Where t is the sample test statistic, and T follows some theoretically-derived distribution as long as H0 holds
You need it because it's the key to the reject / fail-to-reject process
It is how you decide if the test stat is too improbable under the null to accept the null
desert oar
wicked grove
<@!389497659087650836> i tried it, i also removed the <@456226577798135808>s and...
Hard to say. I don't think i ever actually got good results from naive bayes. But if your accuracy is poor compared to the guide you are following, then you should compare your code to theirs and make sure you didn't make a mistake
desert oar
stoic musk
I just spent like 30 mins trying to figure out why my function calls weren't wor...
They aren't functions as such, they are objects representing layers in the model
wicked grove
desert oar
Hard to say. I don't think i ever actually got good results from naive bayes. Bu...
I got an accuracy of 73 with multinomial nb and they used bernoulii naive bayes and got a 94
desert oar
Can you post the link to the guide again
grave frost
desert oar
I told you, it's `P(abs(T) > abs(t) | H0)`
yes but what does this probablity mean in terms of the nitty-gritty?
dull turtle
hello i am working with pandas dataframe
which has python previous_close date previous_close 597 2017-03-01 20837.85 1252 2017-03-02 20623.00 1904 2017-03-03 20604.85 2551 2017-03-06 20739.80 3113 2017-03-07 20725.05 ... ... 170463 2018-02-22 24953.55 171126 2018-02-23 25404.70 171765 2018-02-26 25714.15 172425 2018-02-27 25470.00 173098 2018-02-28 25178.55 this dataframe
597       2017-03-02
1252      2017-03-03
1904      2017-03-06
2551      2017-03-07
3113      2017-03-08

170463    2018-02-23
171126    2018-02-26
171765    2018-02-27
172425    2018-02-28
173098           NaN
Name: date, Length: 248, dtype: object``` this are dates which i have to work withi have to take each date from this and from main data frame i have to take close column value for same date
dull turtle
dull turtle
which has ```python
previous_close
date previous_close
597 20...
for e.g. i want to do this is my previous day 2017-03-01 and 20837.85 this is close value for that date.
i want to take next date that is 2017-03-02 this and close values for same date
then subtract previous day close value - current day(next day) close value for each time interval
in my case now first date has no previous day data so it will remain as itr is
dull turtle
dull turtle
```python
597 2017-03-02
1252 2017-03-03
1904 2017-03-06
2551 ...
i want to do this for all dates i have inthis
my code here python bnf_df = pd.read_csv('F:/nifty_banknifty_data/BANKNIFTY.csv', names = ['script_name', 'expiry', 'call/put', 'strike_price', 'date&time', 'open', 'high', 'low', 'close', 'volume', 'col1'], parse_dates=['date&time']) nf_df = pd.read_csv('F:/nifty_banknifty_data/NIFTY.csv', names = ['script_name', 'expiry', 'call/put', 'strike_price', 'date&time', 'open', 'high', 'low', 'close', 'volume', 'col1'], parse_dates=['date&time']) bnf_df['date'] = bnf_df['date&time'].dt.date bnf_df['time'] = bnf_df['date&time'].dt.time day_end_close = bnf_df.groupby(bnf_df['date&time'].dt.date)[['date', 'close']].tail(1) day_end_close.rename(columns = {'close':'previous_close'}, inplace=True) print('previous_close') print(day_end_close) print() next_day = day_end_close['date'].shift(-1) print(next_day) for i in next_day: print('i=',i) a = bnf_df.loc[bnf_df['date'] == i] print('a') print(a)
please ping me when u reply
 jolly briar
grave frost
yes but what does this probablity mean in terms of the nitty-gritty?
jolly briar
grave frost
yes but what does this probablity mean in terms of the nitty-gritty?
What exactly does "nitty gritty" mean?
serene scaffold
@dull turtle thank you for providing the data. Remember to provide it in a format that can be copied directly (without the ..., in this case)
serene scaffold
dull turtle
then subtract previous day close value - current day(next day) close value for ...
In [4]: df['previous_close'].diff()
Out[4]:
597           NaN
1252      -214.85
1904       -18.15
2551       134.95
3113       -14.75
170463    4228.50
171126     451.15
171765     309.45
172425    -244.15
173098    -291.45
Name: previous_close, dtype: float64
Is this what you wanted?
dull turtle
serene scaffold
```py
In [4]: df['previous_close'].diff()
Out[4]:
597 NaN
1252 -2...
i want to subtract prev day close - curr day close for each time interval
 torn oxide
Hey guys,
Im new at AI and i just wanted to know, is it worth to train resnet50 or other model on ImaneNet dataset(1k) or just use pretrained model? Because I’d like to create my own model to predict objects in photos, Thank you🤍
dull turtle
can i share u my csv data file?
serene scaffold
dull turtle
i want to subtract prev day close - curr day close for each time interval
your example data only has date and previous_close columns.
serene scaffold
dull turtle
can i share u my csv data file?
do print(df.head().to_csv())
This is the same as copying the first five lines of the CSV file.
dull turtle
serene scaffold
do `print(df.head().to_csv())`
,script_name,expiry,call/put,strike_price,date&time,open,high,low,close,volume,col1,date,time
0,BANKNIFTY,27APR2017,XX,0,2017-03-01 09:15:59,20800.1,20810.0,20796.0,20796.0,640,69360,2017-03-01,09:15:59
1,BANKNIFTY,30MAR2017,XX,0,2017-03-01 09:15:59,20755.05,20774.0,20725.05,20746.85,35800,2640120,2017-03-01,09:15:59
2,BANKNIFTY,25MAY2017,XX,0,2017-03-01 09:16:31,20869.0,20869.0,20869.0,20869.0,40,21720,2017-03-01,09:16:31
3,BANKNIFTY,27APR2017,XX,0,2017-03-01 09:16:44,20809.0,20820.0,20809.0,20815.7,440,69600,2017-03-01,09:16:44
4,BANKNIFTY,30MAR2017,XX,0,2017-03-01 09:16:59,20749.2,20770.0,20747.7,20760.0,30600,2651520,2017-03-01,09:16:59```in granular depth
serene scaffold
dull turtle
```python
,script_name,expiry,call/put,strike_price,date&time,open,high,low,clo...
Thank you, one moment
jolly briar
grave frost
in granular depth
What though, an explanation of a p value?
grave frost
jolly briar
What though, an explanation of a p value?
yes
dull turtle
serene scaffold
Thank you, one moment
just ping me when u back
serene scaffold
dull turtle
which has ```python
previous_close
date previous_close
597 20...
how is previous_close derived from close?
dull turtle
serene scaffold
how is `previous_close` derived from `close`?
previous close means previous day (date) close values
serene scaffold
dull turtle
previous close means previous day (date) close values
so if your rows are ordered by date, that's the same as df['close'].shift(1)
jolly briar
dull turtle
for e.g. for e.g this dates 02/03/2017 previous date is 01/03/2017
so so previous day close mean 01/03/2017 this date close value
serene scaffold
dull turtle
for e.g. for e.g this dates `02/03/2017 ` previous date is `01/03/2017`
so it's by day of the month? what about days of the month that don't exist in one of two adjacent months? like the 31st?
dull turtle
serene scaffold
so it's by day of the month? what about days of the month that don't exist in on...
see as i have indian stock market data for each trading day which does not include saturday , sunday and other holidayes
dull turtle
serene scaffold
so it's by day of the month? what about days of the month that don't exist in on...
yes it is each trading day data
serene scaffold
dull turtle
see as i have indian stock market data for each trading day which does not inclu...
if you want everything to line up, I would do it by every 28 days
because for any day of the week, it will be the same day of the week in 28 days.
dull turtle
serene scaffold
if you want everything to line up, I would do it by every 28 days
see but do u get what i am trying to do ?
serene scaffold
dull turtle
see but do u get what i am trying to do ?
you're trying to see how the price of the stock changes month-to-month, yes?
dull turtle
serene scaffold
you're trying to see how the price of the stock changes month-to-month, yes?
not month to month i am finding difference for each day and for each time interval
can u just look at dataset
so u get better idea what data i have
serene scaffold
Sorry but I'm out of time. Good luck!
dull turtle
see this way my data is
 arctic wedgeBOT
Hey @dull turtle!
Uh-oh! It looks like your message got zapped by our spam filter. We currently don't allow .csv attachments, so here are some tips to help you travel safely:
• If you attempted to send a message longer than 2000 characters, try shortening your message to fit within the character limit or use a pasting service (see below)
• If you tried to show someone your code, you can use codeblocks
(run !code-blocks in #bot-commands for more information) or use a pasting service like:
dull turtle
serene scaffold
you're trying to see how the price of the stock changes month-to-month, yes?
just check the E column of date and time
!pastebin
arctic wedgeBOT
Pasting large amounts of code
If your code is too long to fit in a codeblock in discord, you can paste your code here:
https://paste.pythondiscord.com/
After pasting your code, save it by clicking the floppy disk icon in the top right, or by typing ctrl + S. After doing that, the URL should change. Copy the URL and post it here so others can see it.
 uncut barn
Hi guys I was wondering how to extract/count the number of connected components in an image, I know how to visualize these components based on https://scipy-lectures.org/packages/scikit-image/auto_examples/plot_labels.html ?
wicked grove
desert oar
Can you post the link to the guide again
In this project, we try to implement a Twitter sentiment analysis model that helps to overcome the challenges in Twitter sentiment analysis.
 pliant bone
wise pelican
pliant bone
wise pelican
Can someone help figure out why I'm getting this error for my pandas dataset?
df_scores is a dictionary of DataFrames, where item is the key for that dict, and metric is the key for the actual DataFrame
df_scores[item].transpose()[metric]:
 1    74.912
 2    73.091
 3    71.932
 4    74.912
 5    71.11
 6    70.415
 7    73.083
 8    71.126
 9    70.465
10    71.931
Name: some_metric, dtype: float64

top_score_file[item] = df_scores[item].transpose()[metric].idxmax()

ValueError: The truth value of a Series is ambiguous. Use a.empty, a.bool(), a.item(), a.any() or a.all().
 pastel valley
any website or youtube channel or any source you guys recommend to learn convolutional neural networks
stoic musk
deeplearning.ai is very good
shut trail
wise pelican
Can someone help figure out why I'm getting this error for my pandas dataset?
`d...
did you get it ?
wise pelican
I kind of gave up for the time being since I've been writing code for a few too many hours so my brain is kind of mush
shut trail
for when you get back it it, try df.idmax(axis='columns')[metric]
shut trail
wise pelican
I kind of gave up for the time being since I've been writing code for a few too ...
for when you get back to it, try df.idmax(axis='columns')[metric]
wise pelican
The dataset shown is a Series which ignores the axis argument
Wait I see what you mean
shut trail
wise pelican
idxmax is also a Series method btw
true. and taking your series before getting a max would be more efficient.
what does df_scores[item].transpose()[metric].idxmax() output ?
wise pelican
shut trail
what does df_scores[item].transpose()[metric].idxmax() output ?
same issue
going to try your other way
wise pelican
shut trail
for when you get back to it, try df.idmax(axis='columns')[metric]
Wait I should've realized this won't work either
df_scores is a dict containing different dataframes- you can't do idxmax of a dict
I'm just going to keep testing combinations of commands in different orders
God damn it, I know what's wrong
One of the elements is a list that was carried over from converting a dict to a dataframe, and that element is what is throwing the error
shut trail
df_scores[item] isnt a dataframe? lol ugh glad you got it figured out !
wise pelican
df_scores is a dict, df_scores[item] is a dataframe, but your earlier suggestion was df_scores.idxmax()
 worthy phoenix
suppose there is a set of assembly instructions and i need to identify a certain pattern in each of the assembly instruction functions , which library would be good in such a case?
ping me up if anyone decides to answer
serene scaffold
worthy phoenix
suppose there is a set of assembly instructions and i need to identify a certain...
There really aren't one-size-fits-all answers in AI. what kind of patterns?
worthy phoenix
serene scaffold
There really aren't one-size-fits-all answers in AI. what kind of patterns?
for example , suppose i wanna identify the assembly instruction set of all standard c functions and wanna parse through the disassembly i have to match those patterns
something of that sort
iron basalt
You are trying to reverse engineer something?
worthy phoenix
nope, i am trying to make life easier for reverse engineers with a plugin
thats all
iron basalt
!rule 5
arctic wedgeBOT
5. Do not provide or request help on projects that may break laws, breach terms of services, or are malicious or inappropriate.
iron basalt
It may not violate it, but idk, ask a moderator.
worthy phoenix
how does reverse engineering violet lmao? its literally a thing to save urself from malwares
and understand the inner workings of an executable binary
iron basalt
"that may break laws" - wording
worthy phoenix
weird :/
royal crest

RT International
A Japanese man who removed mandatory censorship from pornography using artificial intelligence and resold the images was arrested on Monday for violating laws on copyright and obscenity.
like this one
reverse engineered censored material -> arrested
so yeah speak to your local moderator
worthy phoenix
but im just making a plugin :/, not reversing something that is not meant to, aight which moderator should i speak to?
iron basalt
There is both legal and illegal use of reverse engineering. A distinction may not be made just to not have to deal with any trouble at all.
royal crest
the best way is to contact the people that made the thing which you are aiming to reverse-engineer
iron basalt
Which is why the "may" is relevant in the wording.
worthy phoenix
i get it but im not reversing anything tho, im just making a plugin for an existing disassembler
iron basalt
That too can be illegal in many states.
I'm not a lawyer though.
And this is not legal advice.
royal crest
speak to your lawyer for the down-to-word details on that
 finite imp
is there a channel for python for quant applications?
 rotund zenith
Does anyone happen to have an Gaussian Naive Bayes classifier implementation from scratch without sikit??
Or know how to do it??
royal crest
yes, but you should be familiar with the mathematical backwork that's involved
rotund zenith
I've got the math down, it's the python that's got me
I've already got working code for it, I was just hoping to be able to compare implementations
arctic wedgeBOT
Hey @rotund zenith!
Uh-oh! It looks like your message got zapped by our spam filter. We currently don't allow .txt attachments, so here are some tips to help you travel safely:
• If you attempted to send a message longer than 2000 characters, try shortening your message to fit within the character limit or use a pasting service (see below)
• If you tried to show someone your code, you can use codeblocks
(run !code-blocks in #bot-commands for more information) or use a pasting service like:
rotund zenith
# training model
def train(trainingFile):
Xtrain = np.loadtxt(trainingFile)
#Seperate dataset into a dictionary by class values
dataset_split = {}
data = Xtrain.tolist()
for i in range(len(data)):
vector = data[i]
class_value = vector[-1]
if class_value not in list(dataset_split.keys()):
dataset_split[class_value] = []
dataset_split[class_value].append(vector)
dataset_summary = mean_std_cal(dataset_split)
return dataset_summary
#probability calculation utility function
def calculate_probability(x, mean, stdev):
exponent = exp(-((x-mean)**2 / (2 * stdev**2 )))
return (1 / (sqrt(2 * pi) * stdev)) * exponent
# Calculate the probabilities of predicting each class for a given row
def calculate_class_probabilities(dataset_summary, row):
total_rows = sum([dataset_summary[label][0][2] for label in dataset_summary])
probabilities = {}
for class_value, class_summaries in dataset_summary.items():
probabilities[class_value] = dataset_summary[class_value][0][2]/float(total_rows)
for i in range(len(class_summaries)):
mean, stdev, num = class_summaries[i]
probabilities[class_value] *= calculate_probability(row[i], mean, stdev)
return probabilities
#Naive Bayes main function
def naive_bayes(dataset_summary,row):
prob = calculate_class_probabilities(dataset_summary, row)
return prob``` golden lance
is R better than python for data analytics
royal crest
depends on your boss
 vocal basin
Does anybody know why plotting a 2nd degree function using np.polyfit() and np.poly1d() I get a weird fitted curve
This is original data

And this is the fit data
 vocal basin
How can I improve my curve-fitting here? Please
arctic wedgeBOT
Hey @tight walrus!
Uh-oh! It looks like your message got zapped by our spam filter. We currently don't allow .csv attachments, so here are some tips to help you travel safely:
• If you attempted to send a message longer than 2000 characters, try shortening your message to fit within the character limit or use a pasting service (see below)
• If you tried to show someone your code, you can use codeblocks
(run !code-blocks in #bot-commands for more information) or use a pasting service like:
uncut barn
Hi guys I was wondering how to extract/count the number of connected components in an image, I know how to visualize these components based on https://scipy-lectures.org/packages/scikit-image/auto_examples/plot_labels.html ?
 flint steeple
i get this error after trying to install tensorflow with pip

ERROR: THESE PACKAGES DO NOT MATCH THE HASHES FROM THE REQUIREMENTS FILE. If you have updated the package versions, please update the hashes. Otherwise, examine the package contents carefully; someone may have tampered with them.
    tensorflow from https://files.pythonhosted.org/packages/3d/c5/0d32c508b2c7d752c8e1061ec77d05b04048b6f2e49a8bd781d9632d624c/tensorflow-2.6.0-cp36-cp36m-win_amd64.whl#sha256=dea97f664246e185d79cbe40a86309527affd4232f06afa8a6500c4fc4b64a03:
        Expected sha256 dea97f664246e185d79cbe40a86309527affd4232f06afa8a6500c4fc4b64a03
             Got        8f8b36581d8f0557e7132a99f5f59d60c15eeb2942ed606f821cc2a36739e4f3
 fresh kraken
guys please share any cool project you have created
fresh kraken
flint steeple
```
ERROR: THESE PACKAGES DO NOT MATCH THE HASHES FROM THE REQUIREMENTS FILE. If...
if you are not getting any solution then you can run it it google colab/kaggle/ide.cs50.io
fresh kraken
royal crest
https://www.rt.com/news/537869-japanese-man-arrested-deepfake/
He thought that he has done a great thing , and he would really make a money but wtf for him , and i still do not understand wtf do japanese censor people think of the genitilia they hide it like some kind of nuclear codes that if the people see the unblurred genetalia the juices would burst of every hole of the viewer , come on man , this is why their are so many anime porn made there , coz ppl want that, maybe they want this hentai to be made more and this is their way of encouraging the anime makers to make more sexual anime to make japan leader in this genre
past bronze
Anyone worked with spicy stats for t-test and p value before?
I have a data frame with just 2 conversion rates for A and B but I get nulls returned!
t_stat , p_val```
Anyone know what the dealio is?
I had it by experiment_day as well, and that worked, except the p-value and t-test was well off what I was seeing using an online ab test calculator serene scaffold
past bronze
Anyone worked with spicy stats for t-test and p value before?
I have a data fra...
serene scaffold
past bronze
Anyone worked with spicy stats for t-test and p value before?
I have a data fra...
With pandas, it's impossible to know why certain operations do or don't work unless you know what's in the dataframes. Please do print(ab_merged.head().to_csv())
desert oar
grave frost
yes but what does this probablity mean in terms of the nitty-gritty?
it is the "strength of evidence" against the null: the smaller the p-value, the greater the strength of evidence against the null (this is the Ronald Fisher interpretation).
it has more meaning in a formal null-hypothesis test, where you have pre-determined a threshold for this strength of evidence, beyond which the null hypothesis must be rejected. if the strength of evidence exceeds the pre-determined threshold, you reject the null in favor of the alternative. if it does not exceed the threshold, you fail to reject the null (which is subtly but importantly different from accepting the null).
 split ruin
How do I better space my axis values such that it doesn't look like a disaster?

My data looks like this, and the date is in quarters, not a number, so is that why it's messing this up?
 grave frost
desert oar
it is the "strength of evidence" against the null: the smaller the p-value, the ...
grave frost
desert oar
it is the "strength of evidence" against the null: the smaller the p-value, the ...
ahh, that indeed clarifies it a bit; but I am still unclear on why it is calculated the way it is done
split ruin
Let's say I already have 2 data points, one (Transport) that is a subset of a total (Export of services). What can I use to plot both by time?

So if I have time separated by quarters (2020 Q1, 2020 Q2, etc) in each row, and all the data to the right of "Exports of Services" is a part of "Exports of Services" which sum up to equal it, is there a way for me to plot the relationship between each subset with the main data over time?
desert oar
grave frost
ahh, that indeed clarifies it a bit; but I am still unclear on why it is calcula...
do you think you can narrow down the nature of your un-clarity?
desert oar
wicked grove
https://www.analyticsvidhya.com/blog/2021/06/twitter-sentiment-analysis-a-nlp-us...
thanks. did you try it with bernoulli instead of multinomial?
grave frost
desert oar
do you think you can narrow down the nature of your un-clarity?
I guess I am just confused in general about why margin of error is sigma/root(n) to calculate Z-score, otherwise your explanation is very clear and enlightening
I assume its complicated stuff - because we weren't even taught the derivation of the central limit theoreom 😦 it makes no sense to me why samples means approach a gaussian distribution
desert oar
grave frost
I guess I am just confused in general about why margin of error is `sigma/root(n...
note that i never said anything about how to actually calculate the test statistic in my explanations! that will depend entirely on the specific test
desert oar
grave frost
I assume its complicated stuff - because we weren't even taught the derivation o...
it is indeed a consequence of the central limit theorem. the CLT specifically says that the sample mean converges to Gaussian(μ, n σ²) where μ is the population mean, n is the sample size, and σ² is the population variance. i agree, it's a bit magical, although i hope at least it's intuitive that E[X̅] = μ
(and i hope you understand the idea that the sample mean X̅ is a random variable)
desert oar
grave frost
I guess I am just confused in general about why margin of error is `sigma/root(n...
in general, the answer to the queston of "why do we calculate the test statistic this way" is that "this is how you obtain a quantity with a known/computable distribution"
why do we use t = (x̅ - μ₀) / (s ÷ √n) for the T test? because we know that quantity follows a T(n-1) distribution!
as for why that particular quantity follows that particular distribution, that's a great question and worth diving into
 swift oxide
Hi guys, needed a help for resources
I learnt plotly for data visualizations
found it better than matplotlib
and wanted to learn Dash for plotly
If anyone has learned it can you send some resources
 edgy brook
Hey guys, I was wondering what kind of machine learning techniques can you use for predicting a continuous variable? I got linear regression as well as k nearest neighbours but are there any others out there?
desert oar
edgy brook
Hey guys, I was wondering what kind of machine learning techniques can you use f...
i wouldn't use knn for continuous variables.
other good options include: generalized additive model (GAM), random forest, gradient boosting (e.g. xgboost, lightboost), and neural networks. support vector regression might be useful in some cases.
if you want to obtain useful estimates of prediction error bounds and/or confidence levels, you might want to use statistical model like non-linear GLMs or bayesian models. you can use these models to answer questions like "with 90% confidence, what is the range of predictions for some given inputs", which imo is usually more important than trying to predict an exact number
wicked grove
desert oar
thanks. did you try it with bernoulli instead of multinomial?
Yupp i didd
I got an accuracy of 74
I havent set random_state,will that make a difference?
desert oar
wicked grove
I havent set random_state,will that make a difference?
no, that shouldn't make a difference
wicked grove
precision    recall  f1-score   support

           0       0.72      0.80      0.75       993
           1       0.78      0.69      0.73      1007

    accuracy                           0.74      2000
   macro avg       0.75      0.74      0.74      2000
weighted avg       0.75      0.74      0.74      2000
check your data to make sure it looks like their data, and make sure you don't have bugs in your code
wicked grove
nope,so they have messed up their data for some reason
edgy brook
desert oar
i wouldn't use knn for continuous variables.
other good options include: genera...
Thanks, I was looking into neural networks and support vector regression, but for neural networks, it looks like a classification data whereas a website said that SVR regression is normally for discrete values
wicked grove
desert oar
check your data to make sure it looks like their data, and make sure you don't h...
they have first split the dataset into positive 20k and negative 20k and combined it
desert oar
edgy brook
Thanks, I was looking into neural networks and support vector regression, but fo...
neither of these things are true. neural networks work just fine for continuous regression problems (i'd argue that they work better for regression than classification by some notions of "better"), and there's nothing inherent in SVR about using discrete values
wicked grove
wicked grove
they have first split the dataset into positive 20k and negative 20k and combine...
after preprocessing they used the entire dataset for model training idk why
wicked grove
desert oar
no, that shouldn't make a difference
my precision and recall are pretty low too compared to theirs
desert oar
wicked grove
they have first split the dataset into positive 20k and negative 20k and combine...
they did that as a lazy way of down-sampling the data in order to train the model more quickly, while also making the dataset balanced (50% positive and 50% negative)
desert oar
wicked grove
after preprocessing they used the entire dataset for model training idk why
i don't think so. it looks like they made a train/test split in section 6
these code samples are so sloppy
edgy brook
desert oar
neither of these things are true. neural networks work just fine for continuous ...
Right, thanks!
desert oar
@wicked grove do the same 50/50 split that they did, at least try to match their results by using their exact same procedure. then you can figure out why the model trained on a different sample behaves differently
edgy brook
although, is there a reason why you wouldn't suggest using knn for continuous variables?
desert oar
edgy brook
although, is there a reason why you wouldn't suggest using knn for continuous va...
for continuous target variables, it makes no sense
you can of course use it for continuous predictors/inputs/features. but i thought you were asking about predicting continuous targets/outputs/labels
edgy brook
@desert oar ahh just to double check, population density is continuous right?
desert oar
edgy brook
<@!389497659087650836> ahh just to double check, population density is continuou...
depends on how technical / philosophical you want to get 😉
for all practical purposes, yes.
but if you want to have some mind-bending fun, consider that population density must be a rational number. so in some sense, population density is an infinitely small subset of all possible outputs of an arbitrary continuous model!
consider also that floating point can only represent a subset of rational numbers (see e.g. https://docs.python.org/3/tutorial/floatingpoint.html)
i think it's actually somewhat important for scientists and other data analysis practitioners to roughly understand the limitations of floating point numbers and floating point math. but not something you need to know as a beginner
edgy brook
Thank you, Imma head off to do some more research!
wicked grove
desert oar
i don't think so. it looks like they made a train/test split in section 6
Yes they did use train test split but on data['text'] which is not preprocessed
 marble niche
I am trying to get a deep learning environment set up on AWS. I have been following FastAI's guide ,https://course.fast.ai/start_aws , but I have run into an issue when I try to install the mamba conda package ```bash
(base) ubuntu@AWS:~/fastsetup$ conda install -y mamba
Collecting package metadata (current_repodata.json): done
Solving environment: failed with initial frozen solve. Retrying with flexible solve.
Solving environment: failed with repodata from current_repodata.json, will retry with next repodata source.
Collecting package metadata (repodata.json): done
Solving environment: failed with initial frozen solve. Retrying with flexible solve.
Solving environment: /
Found conflicts! Looking for incompatible packages.
This can take several minutes. Press CTRL-C to abort.
failed
UnsatisfiableError: The following specifications were found to be incompatible with each other:
Output in format: Requested package -> Available versionsThe following specifications were found to be incompatible with your system:
- feature:/linux-64::__glibc==2.31=0
- python=3.9 -> libgcc-ng[version='>=7.5.0'] -> __glibc[version='>=2.17']
Your installed version is: 2.31
Note that strict channel priority may have removed packages required for satisfiability.
The Course and the Book
wicked grove
desert oar
these code samples are so sloppy
Yeah :// that is why i ended up only training with naive bayes and not the rest of it
grave frost
desert oar
it is indeed a consequence of the central limit theorem. the CLT specifically sa...
that is the problem - it is not really intuitive 😄
grave frost
desert oar
in general, the answer to the queston of "why do we calculate the test statistic...
no, as in more like how exactly were those formulas derived?
and for the gaussian one, supposing I have an underlying distribution of a flat line - all samples being 1. then the sampling distribution won't be gaussian given any sample size?
thick swift
I have a set of x and y values. They should form more or less a line. Does anyone know of some distortion measures that can be calculated on the coordinates to determine how distorted the data is?
desert oar
grave frost
no, as in more like how exactly were those formulas derived?
those answers live in a statistics textbook
thick swift
I thought to just take the mean (as the line should be more or less horizontal and centred on zero), or fit a linear model, but the data could still be distorted in some portions but the statistics still show linearity.
desert oar
@grave frost in the case of the T distribution, a random variable that is the ratio of a standard gaussian rv and a chi-square rv has the t distribution with the same number of degrees of freedom as the chi square. working through those proofs isn't necessarily the most enlightening task, but i think it's important to at least have been exposed to it.
grave frost
alright, I guess its clearly very complicated 😅
know any 3b1b that makes it intuitive?
desert oar
i don't think "clearly very complicated" is an appropriate takeaway
statistics, like all fields, is cumulative
learning it is a process of learning some basics, then combining those basics to form more sophisticated concepts
then combining those concepts to form yet more sophisticated concepts, etc.
grave frost
its not I agree, but at this point my fundamentals are soo unclear that it would take a ton of time
desert oar
well this is why i encourage learning the fundamentals. i don't think 3b1b has any stats fundamentals videos, but there might be some other good content creators out there for it
grave frost
I just hope we revisit more of the fundamentals during the rest of my time in school
desert oar
as for the case of a distribution where all values are the same value, the "constant distribution" - i'm not sure. but this is what you might call a "degenerate case", and it's possible that the formal statement of the clt excludes such cases
desert oar
in the case of a sample that consists of all 1s - that's a different story. one physical sample is one "draw" from a big random variable: the random variable of all possible samples
so that's just one very unfortunate draw from a random variable
oh, i know why it might not apply
the variance of a constant distribution is 0
so you end up dividing by 0 in the statement of the central limit theorem!
in the informal statement of the theorem, you might say that the sample mean has a gaussian distribution with 0 variance - it is itself the constant distribution about the mean
but i'm not sure how this plays out in the full formal statement of the theorem
grave frost
but the assumptions of CLT doesn't mention variance at all
1.The data must follow the randomization condition. It must be sampled randomly
2.Samples should be independent of each other. One sample should not influence the other samples
Sample size should be not more than 10% of the population when 3.sampling is done without replacement
4.The sample size should be sufficiently large.
desert oar
at least according to wikipedia, the classical clt does assume that the population variance is > 0 https://en.wikipedia.org/wiki/Central_limit_theorem#Classical_CLT
In probability theory, the central limit theorem (CLT) establishes that, in many situations, when independent random variables are summed up, their properly normalized sum tends toward a normal distribution (informally a bell curve) even if the original variables themselves are not normally distributed. The theorem is a key concept in probabilit...
i'd have to break out one of my old stats textbooks for a more authoritative source, but i'm sure it's in there e.g. casella & berger
4.The sample size should be sufficiently large.
this is not a formal assumption of any theorem
grave frost
sigma^2 is finite variance, not necessarily >0
grave frost
desert oar
> 4.The sample size should be sufficiently large.
this is not a formal assumptio...
lol its just the watered down version we are taught
desert oar
grave frost
sigma^2 is finite variance, not necessarily >0
it's further down, "in the case σ > 0, convergence in distribution means ..."
grave frost
I thought sigma was the standard deviation?
desert oar
yes, and its square is variance
grave frost
but why squared?
standard deviation is good for interpretation, reporting. For developing the theory the variance is better
doesn't really cut it
desert oar
again, these are fundamental stats questions. i'm not saying i won't answer them, but i'm suggesting that whoever your instructor is, they aren't really doing a good job
there are actually several different interpretations of variance
grave frost
usually they don't, but I sniff up stuff I don't get from YT and Khanacademy
in stats, its pretty much a nightmare.
desert oar
i like to think of it as "euclidean distance from a distribution in which all data points are equal to the mean"
taking the square root just squishes it back down to the scale of the data
grave frost
I guess I could ask my teacher to explain it properly, but a few questions in and its clear he doesn't know stuff in-depth too
desert oar

Cross Validated
In the definition of standard deviation, why do we have to square the difference from the mean to get the mean (E) and take the square root back at the end? Can't we just simply take the absolute v...
i highly encourage browsing stats.stackexchange
and asking your own questions when you don't find an answer
again, i'm not trying to dodge answering, but the users there have answered better and more thoroughly than i ever could
other good ones related to the CLT:
https://stats.stackexchange.com/q/169611/36229
https://stats.stackexchange.com/q/348972/36229
https://stats.stackexchange.com/q/339759/36229
Cross Validated
I've read somewhere that the reason we square the differences instead of taking absolute values when calculating variance is that variance defined in the usual way, with squares in the nominator, p...
Cross Validated
Wikipedia says -
In probability theory, the central limit theorem (CLT) establishes that, in most situations, when independent random variables are added, their properly normalized sum tends to...
Cross Validated
I've always taken issue with, and never been given a good answer, for how it is possible that the central limit theorem - the classical version where the distribution of sample means approaches nor...
note that it is not necessarily a given that variance is the best or only useful dispersion measure for data. but it is fundamentally related to gaussian distributions, and gaussian distributions are 1) very elegant mathematically, 2) ubiquitous in math, 3) naturally related to euclidean distance and thereby to linear algebra with the l2 norm
grave frost
well, stuff like poissons and mathematical formalism aren't helping
desert oar
thick swift
I have a set of x and y values. They should form more or less a line. Does anyon...
you want to measure some kind of deviation from linearity?
grave frost
I don't get what a possion X_i is supposed to mean, because from what I read that's a distribution?
desert oar
marble niche
I am trying to get a deep learning environment set up on AWS. I have been follo...
maybe your operating system doesn't use glibc?
marble niche
desert oar
maybe your operating system doesn't use glibc?
Hmm it was an Ubuntu 20.04 EC2 instance
marble niche
The instance type was g4dn.xlarge which has 4 vCPUs
desert oar
wicked grove
Yes they did use train test split but on data['text'] which is not preprocessed
that's because they are just overwriting data['text'] with the tokens. remember, i had suggesting using the separate "tokens" column. they aren't doing that.
marble niche
desert oar
what cpu architecture is in the vm?
I just spun up a general purpose Ubuntu 20.04 (64-bit x86) instance
desert oar
marble niche
I just spun up a general purpose Ubuntu 20.04 (64-bit x86) instance
what does uname -mp show?
marble niche
desert oar
what does `uname -mp` show?
x86_64
marble niche
desert oar
this is in a clean conda installation?
I installed conda through a script in this, https://github.com/fastai/fastsetup/blob/master/setup-conda.sh , git repo

GitHub
Setup all the things. Contribute to fastai/fastsetup development by creating an account on GitHub.
desert oar
yeah i just found that. you followed these steps exactly?
./setup-conda.sh
source ~/.bashrc
conda install -yq mamba
I did. I'll reinstall it so I can show you my output
desert oar
no that's okay. what does conda env list show?
marble niche
Is there a particular package I am looking for? It appears to have all of the standard libaries
desert oar
conda env list should just list the envs you have installed, not the libraries in them
marble niche
Oh sorry, I forgot env
desert oar
also show the output of conda info. i just want to make sure nothing is awry
feel free to elide information like your username
marble niche
# conda environments:
#
base                  *  /home/ubuntu/miniconda3
And this is the output from conda info ```bash
 active environment : base
active env location : /home/ubuntu/miniconda3
        shell level : 1
   user config file : /home/ubuntu/.condarc
populated config files : /home/ubuntu/.condarc
conda version : 4.10.3
conda-build version : not installed
python version : 3.9.5.final.0
virtual packages : __cuda=11.2=0
__linux=5.11.0=0
__glibc=2.31=0
__unix=0=0
__archspec=1=x86_64
base environment : /home/ubuntu/miniconda3 (writable)
conda av data dir : /home/ubuntu/miniconda3/etc/conda
conda av metadata url : None
channel URLs : https://conda.anaconda.org/fastai/linux-64
https://conda.anaconda.org/fastai/noarch
https://conda.anaconda.org/fastchan/linux-64
https://conda.anaconda.org/fastchan/noarch
https://repo.anaconda.com/pkgs/main/linux-64
https://repo.anaconda.com/pkgs/main/noarch
https://repo.anaconda.com/pkgs/r/linux-64
https://repo.anaconda.com/pkgs/r/noarch
package cache : /home/ubuntu/miniconda3/pkgs
/home/ubuntu/.conda/pkgs
envs directories : /home/ubuntu/miniconda3/envs
/home/ubuntu/.conda/envs
platform : linux-64
user-agent : conda/4.10.3 requests/2.25.1 CPython/3.9.5 Linux/5.11.0-1020-aws ubuntu/20.04.2 glibc/2.31
UID:GID : 1000:1000
netrc file : None
offline mode : False
alright, that all looks pretty normal. you might want to file an issue on that fastly repo
marble niche
desert oar
alright, that all looks pretty normal. you might want to file an issue on that f...
What do you think might be causing the issue?
desert oar
Honestly, no idea
I thought i might be able to identify something weird, but I don't see anything
marble niche
That's okay. Thanks for trying to help me out
i'll just try setting up a TF2.0 environment. Is there a particular instance you recommend? Should I start from scratch or should I use one of Amazon's prebuilt instances?
I was looking at Deep Learning AMI (Ubuntu 18.04) Version 51.0 or Deep Learning AMI (Amazon Linux 2) Version 52.0


 wicked grove
desert oar
that's because they are just overwriting `data['text']` with the tokens. remembe...
wicked grove
desert oar
that's because they are just overwriting `data['text']` with the tokens. remembe...

then it should have been dataset['text"]
 brazen spire


did i understand this well?
we take the max of z not x in Relu right?
this is from the pytorch tutorial
i do not understand what "b.repeat(N,1)" do at line 22. Forget about this, i understand now.
desert oar
wicked grove
I explained it. Re-read my message
there is no tokens column in their example
i had suggested using a separate tokens column, and you took my suggestion
lapis sequoia
Hello guys!! Wanted to know if there is any better way to arrange and achieve the same goal for the code
np.save('coherence_year.npy', coherence_year)
np.save('coherence_topic_year.npy', coherence_topic_year)
np.save('perplexity_per_year.npy', perplexity_per_year)
coherence_year = np.load('coherence_year.npy') # load
coherence_topic_year = np.load('coherence_year.npy')
perplexity_per_year = np.load('perplexity_per_year.npy')
plt.title("Coherence graph")
plt.xlabel("Years")
plt.ylabel("Coherence_per_year")
plt.plot(years_dir, coherence_year, color ="red")
plt.savefig('Coherence.png')
plt.title("perplexity graph")
plt.xlabel("Years")
plt.ylabel("perplexity_per_year")
plt.plot(years_dir, perplexity_per_year, color ="green")
# plt.show()
plt.savefig('perplexity.png')
I want to save two plots with different title,xlabel and ylabel
This feels very cluttered visually
desert oar
!code @lapis sequoia note: you can put code in a "code block" for much better formatting. instructions below 👇
arctic wedgeBOT
Here's how to format Python code on Discord:
```py
print('Hello world!')
```
These are backticks, not quotes. Check this out if you can't find the backtick key.
desert oar
lapis sequoia
This feels very cluttered visually
can you post the plots as they currently look? without your data, nobody can generate a plot from this code (but thank you for posting the code, it's still helpful)
 hearty spade
Could anyone please provide some good reference links to transfer learning using transformers?
thick swift
I thought I'd ask again, as it got kinda buried before, and I also left.
I have a set of x and y values. They should form more or less a line. Does anyone know of some distortion measures that can be calculated on the coordinates to determine how distorted the data is?
I thought to just take the mean (as the line should be more or less horizontal and centred on zero), or fit a linear model, but the data could still be distorted in some portions but the statistics still show linearity.
 twin mantle
thick swift
I thought I'd ask again, as it got kinda buried before, and I also left.
I have ...
twin mantle
thick swift
I thought I'd ask again, as it got kinda buried before, and I also left.
I have ...
Why not fit a linear model?
And then look at the residuals
thick swift
Because that's not exactly what i'm looking for.
thick swift
twin mantle
Why not fit a linear model?
Imagine a uniform distribution over another uniform distribution. The data would have huge residuals but still be "linear"
Like, I need some value that tells me if the points are shaped like a V or U, or some other non-linear shapes.
twin mantle
thick swift
Imagine a uniform distribution over another uniform distribution. The data would...
I still don't understand
Do you have a doodle of what you want?
twin mantle
thick swift
Imagine a uniform distribution over another uniform distribution. The data would...
I mean if you use a linear fit, how are the residuals gonna be huge
 twin mantle
thick swift
twin mantle
thick swift
I don't think you can resume that via a single value
I mean the deviation can be found
But to ascertain shape via value, I don't think that's possible
thick swift
It's just non-linearity, not exactly the shape...
But nevermind. I'll think about it tomorrow. Thanks!
twin mantle
thick swift
But nevermind. I'll think about it tomorrow. Thanks!
OK... Try to think exactly what you want
desert oar
@thick swift it sounds like you are looking for a linear trend amidst random iid noise/errors. the typical goodness-of-fit metrics for linear regression seem like a good choice here
 frozen loom
Does anyone has some examples of how to estimate if a time series is ascending or descending? My data only has date and total (is crime). I need to do it for every crime listed (I just want to have some examples)
desert oar
frozen loom
Does anyone has some examples of how to estimate if a time series is ascending o...
you can fit a linear regression of crime vs date. if the slope is positive, it's increasing over time. if it's negative, it's decreasing over time.
here's a random example i found online: https://people.duke.edu/~rnau/411trend.htm
you can also try computing rolling mean or equivalent, to smooth out the data
you can also do more formal statistical testing for trends, e.g. https://cran.microsoft.com/snapshot/2021-10-10/web/packages/funtimes/vignettes/trendtests.html (although this is an r library using routines that probably aren't available in python unless you write them by hand)
frozen loom
desert oar
you can fit a linear regression of `crime` vs `date`. if the slope is positive, ...
Thank you!! I'll try to do it
wicked grove
desert oar
there is no `tokens` column in their example
I don't mean the columns, they have stored the original data in data and the combined data in dataset
And they have done the entire preprocessing on dataset but stored data.text in X
 desert oar
wicked grove
I don't mean the columns, they have stored the original data in ```data``` and t...
desert oar
wicked grove
I don't mean the columns, they have stored the original data in ```data``` and t...
that's fine, the preprocessing (e.g. tokenizing) doesn't require any "fitting" or "training" so you can do it on both sets at once
however imo you should avoid looking at the test data too early, you don't want to overfit to the test data "inside your brain"
wicked grove
desert oar
that's fine, the preprocessing (e.g. tokenizing) doesn't require any "fitting" o...
So should i repeat the preprocessing by calling the functions on data and then try training the model
In my code, i haven't used the rest of the data. I did the 50/50 split, combined it but didn't use the remaining data anywhere
wicked grove
desert oar
however imo you should avoid looking at the test data too early, you don't want ...
Yess! I thought that is the reason for using tfidf transform and not tfidf fit_transform
desert oar
wicked grove
Yess! I thought that is the reason for using tfidf transform and not tfidf fit_t...
yes! that is correct
desert oar
wicked grove
So should i repeat the preprocessing by calling the functions on data and then t...
So should i repeat the preprocessing by calling the functions on data
i don't know what you mean by that
I did the 50/50 split, combined it but didn't use the remaining data anywhere
imo you should focus on reproducing the result in the blog post, before trying other things
wise pelican
So I hate to keep asking what's essentially the same or a very similar question, I just want to make sure I'm aggregating and ranking the right metrics for my dataset
For the data that I have, the scores range from 0 to 100 where higher values are better
The current metrics I'm measuring for a given piece of data:
Mean
Median
99th Percentile
95th Percentile
90th Percentile
75th Percentile
25th Percentile
1st Percentile
0.1st Percentile
0.01st Percentile
----------------------------------------
Standard Deviation
Mean Absolute Deviation
Median Absolute Deviation
99th Quantile Absolute Deviation
95th Quantile Absolute Deviation
90th Quantile Absolute Deviation
75th Quantile Absolute Deviation
For the first group of metrics, the items that that the highest values are ranked better. The idea is that having the highest mean/median is does not mean that an item is better overall - what if it has really high highs and really low lows? That would be measured with the different percentiles.
For the 2nd group, the items with a lower value are ranked better. The idea would be that you want the data to have the smallest deviation from the upper percentiles, as that would mean that it is closer to those higher and more coveted values.
For the 3nd group, the higher values are ranked better again. The idea here is that yo want the highest deviation from the lower percentiles, as that would mean that you are far away from those lower and less coveted percentiles
I then rank all the metrics between all the pieces of data I have (where rank 1 is best and higher value ranks are worse), and then sum up all the metric's ranks for each piece of data,, where the smallest sum of the ranks is the best overall.
- Is there anything that doesn't make sense for the context I'm using these metrics for?
- Is there anything that's missing that I should add?
- Is there anything that should be removed or is redundant?
desert oar
are you really interested in the extreme tails of the distribution?
i'm not sure there's much value in the 99th, 95th, and 90th percentiles otherwise (same for 0.01, 0.1, and 1)
maybe this data should be measured on some kind of logarithmic scale instead of or in addition to what you have here
consider also drawing pictures, e.g. kernel density plots, depending on what aspects you care about
if you really care about the high end of something, there's no point in report the extreme low end. and vice versa
wise pelican
So more specifically, I'm testing the quality of encoded/compressed videos compared to the source video using Netflix's VMAF library. Similarly, I'm getting the PSNR, SSIM, and MS-SSIM scores (all of which are known metrics used in a similar vein as VMAF)
For each of those 4 types of scores that can be acquired for a given compressed video, you wouldn't want a compressed video to fluctuate wildly in quality from scene to scene. There's something to gain from having a consistent quality throughout a video
In a similar vein, a compressed video may not have a really high score for those 4 items, but it also may not have really low scores either
I'm basically trying to find the compressed video with the highest consistent score for each of those 4 items
The issue with drawing graphs of this information isn't very doable, as 4 metrics per video means I either have 4 different graphs per video OR I have a very packed graph that may be hard to read
And when you can have hundreds of possible combinations of video encoding settings, trying to look at the image graphs is kind of crazy to attempt
desert oar
i see, that makes sense to me. you might still want to make a scatterplot of things like mean video quality vs variance of video quality
imo there's no harm in looking at all these different measurements for your own exploration
would i put them all in a presentation? no
one thing you can do is draw boxplots and violinplots when comparing a handful of encoding settings
it might be enlightening to think of your data as a hierarchical time series
each combination of (video_id, setting_a, setting_b, ...) is a single time series, right? a series of video quality scores over time
or are these quality scores measured across big chunks of each video?
wise pelican
These scores are taken on a per-frame basis for the video - each compressed version of the source video is the exact same length, frame rate, and frame count as the source
The score doesn't change for each new frame that's scanned
IE: frame 5 of compressed video 1 is the same frame as frame 5 of compressed video 2
But yes, each video is grouped like (video_id, setting_a, setting_b, ...)
So would this be a situation where using Exponential Weighted Moving metrics like EWM mean, median, standard deviation,
 slow vigil
Anyone know why my Dash apps might be rendering ugly in Firefox?
or how to fix it?
Here's a basic pandas table that looks ugly

This is what it's supposed to look like according to the Dash documentation
 desert oar
wise pelican
So would this be a situation where using Exponential Weighted Moving metrics lik...
desert oar
wise pelican
So would this be a situation where using Exponential Weighted Moving metrics lik...
for each individual video-setting pair, yes
but if you're interested in modeling the effect of setting A on quality score W, then you might be interested in a hierarchical time series model, wherein the distribution of the quality scores of video V are not considered independent, they are all assumed to be related because they are all measuring the same video
it might not be useful as a modeling approach in this case (maybe the individual video is a lot less important than the settings, for example), but it might be interesting to consider
at least, "video id" might be a relevant feature in some kind of model
or, certain characteristics about the video, like having fast-moving objects or certain kinds of colors
desert oar
slow vigil
This is what it's supposed to look like according to the Dash documentation
looks like there is some CSS missing
wise pelican
desert oar
but if you're interested in modeling the effect of setting A on quality score W,...
Got any tutorials on how would I best handle implementing this? The pandas documentation and stuff I found in search results are quite a bit over my head
slow vigil
desert oar
looks like there is some CSS missing
Yeah I just found there is a section in the docs about styling tables. Strangely the code for styling wasn't included in the example that produced the table I showed above
 pearl beacon
I feel like this channel kinda fits, but I’ve had no luck with
#help-potato message
serene scaffold
pearl beacon
I feel like this channel kinda fits, but I’ve had no luck with
https://discord....
I see that this links to a screenshot of a question. People are more likely to engage if you post the question and everything related to it as text.
The server will probably get more active in the next few hours as the US and Canada wakes up.
pearl beacon
Alright thanks
 lone drum
Hello
I am working with 2 dataframe
I have time column in both data frame common
First data frame is bnf_df
Second data frame is nf_df
Both have time column
Bnf_df has banknifty_diff column
Nf_df has nifty_diff
I want to divide
Banknifty_diff / Nifty_diff based on same date and same time
How I can do this?
Ping me when replying
desert oar
lone drum
Hello
I am working with 2 dataframe
I have time column in both data frame commo...
Set the date and time to be the index, then judge divide
 hasty grail
How can I add rows to a pd.DataFrame while keeping it sorted by index? (There will be frequent insertions and deletions, so calling sort_index() each time would be inefficient.)
(Would also be nice if there is a better way of managing the data, since the dataframe is copied each time a row is inserted.)
desert oar
Indeed this sounds like you might not want a dataframe as your data structure
What kind of program is this?
If you are just building up a dataset row by row, maybe use a list of dicts and convert to dataframe at the end
If this is some kind of gradually updating application, maybe you want an in-memory sqlite database
hasty grail
desert oar
Indeed this sounds like you might _not_ want a dataframe as your data structure
It's the latter. When the application is opened, I read the data from a DB and keep it in memory. The data in-memory can be edited according to operations done by the user. The DB is only updated when the user presses the save button.
I'll take a look at using an in-memory database, thanks!
hasty grail
desert oar
If this is some kind of gradually updating application, maybe you want an in-mem...
From the documentation, we could use sqlite3.Row to fetch a row as a dictionary-like object. Is there a built-in method for the inverse, i.e., insert a row using the contents of a dictionary?
Nvm I could just use df.to_sql() and df.read_sql()
arctic wedgeBOT
Hey @lapis sequoia!
Uh-oh! It looks like your message got zapped by our spam filter. We currently don't allow .txt attachments, so here are some tips to help you travel safely:
• If you attempted to send a message longer than 2000 characters, try shortening your message to fit within the character limit or use a pasting service (see below)
• If you tried to show someone your code, you can use codeblocks
(run !code-blocks in #bot-commands for more information) or use a pasting service like:
lapis sequoia
hmmm
arctic wedgeBOT
Hey @lapis sequoia!
Uh-oh! It looks like your message got zapped by our spam filter. We currently don't allow .txt attachments, so here are some tips to help you travel safely:
• If you attempted to send a message longer than 2000 characters, try shortening your message to fit within the character limit or use a pasting service (see below)
• If you tried to show someone your code, you can use codeblocks
(run !code-blocks in #bot-commands for more information) or use a pasting service like:
 mighty spoke
Hi, I'm not sure about this loop as it's not plotting anything, I think there's also a problem that the x values have to be numbers/Julian dates like 06/05/2001 would be 06052001 here's my code: Iwould really appreciate it if anyone can take a quick look:
'''
import pandas as pd#import pandas package to read data more easily
import matplotlib.pyplot as plt#imported pyplot to plot graphs
import datetime as dt#date time to read first column of csv file
import numpy as np
from datetime import datetime
df = pd.read_csv('LAC.csv')
df2 = pd.read_csv('LIT.csv')
df['Date'] = pd.to_datetime(df['Date'], format='%d/%m/%Y')
df2['Date'] = pd.to_datetime(df['Date'], format='%d/%m/%Y')
#startdate1='20/10/2013'
end = dt.datetime.now() #the end date is the present date
y1=np.array(df['Close'])#refering to the close column in the csv file
y2=np.array(df2['Close'])
x1=np.array(df['Date'])
x2=np.array(df2['Date'])
dcf=[]
def DCF(x1,x2,t0):
d=((x1-np.mean(x1))*(t0-np.mean(x2)))/(np.std(x1)*np.std(x2))
dcf.append(d)
return d
t0=[]
for i in range(len(x1)):
for j in range(len(x2)):
t=x1[j]-x2[i]
while j>i:
x2[j]+=1
if j==len(x2):
x1[i]+=1
t0.append(t)
plt.plot(t0,DCF , ls='-', lw='1', color='red', marker='.')
plt.title('DCF vs Lag')
plt.xlabel('time lag')
plt.ylabel('DCF')
plt.show()
'''
desert oar
@mighty spoke note, you can use code formatting here:
```python
print(123)
```
they are 3 backtick characters ` not single quote characters '
on a US keyboard, it's the same key as ~
import pandas as pd#import pandas package to read data more easily
import matplotlib.pyplot as plt#imported pyplot to plot graphs
import datetime as dt#date time to read first column of csv file
import numpy as np
from datetime import datetime

df = pd.read_csv('LAC.csv')
df2 = pd.read_csv('LIT.csv')
df['Date'] = pd.to_datetime(df['Date'], format='%d/%m/%Y')
df2['Date'] = pd.to_datetime(df['Date'], format='%d/%m/%Y')
#startdate1='20/10/2013'
end = dt.datetime.now() #the end date is the present date
y1=np.array(df['Close'])#refering to the close column in the csv  file
y2=np.array(df2['Close'])
x1=np.array(df['Date'])
x2=np.array(df2['Date'])

dcf=[]
def DCF(x1,x2,t0):
    d=((x1-np.mean(x1))(t0-np.mean(x2)))/(np.std(x1)np.std(x2))
    dcf.append(d)
    return d

t0=[]
for i in range(len(x1)):
    for j in range(len(x2)):
        t=x1[j]-x2[i]
        while j>i:
            x2[j]+=1
        if j==len(x2):
            x1[i]+=1
            t0.append(t)

plt.plot(t0,DCF , ls='-', lw='1', color='red', marker='.')
plt.title('DCF vs Lag')
plt.xlabel('time lag')
plt.ylabel('DCF')
plt.show()
oh thanks
desert oar
so let's start with one thing at a time. first thing: DCF is a function, and you don't actually call it anywhere
i'm surprised this doesn't just result in an error
mighty spoke
ah yes
desert oar
second, this is some pretty convoluted code, e.g. you have this function DCF which implicitly requires a t0 to exist which isn't defined yet... you are going to have a hard time figuring out what this does in 2 weeks
and i'm having a hard time figuring it out now
so if you can also explain what you're trying to achieve in plain words, that would help. if you describe your data (maybe post the first 10 lines of both files in code blocks) and describe the plot you want, that will make it easier to help you
also you don't need to convert things from pandas series objects to numpy arrays, matplotlib works fine with pandas objects
mighty spoke
yeah sure i'll do that rn
mighty spoke
desert oar
second, this is some pretty convoluted code, e.g. you have this function `DCF` w...
Hi, so i'm trying to make 2 loops based on the Discrete Correlation function where you start off with one point, X1, at time t1, in the X-timeseries and you first pair it up with Y1, measuring the time difference, tau_11 between them, Y1 point could have any time. Then I work out the statistic for that pair(using the DCF function) . Next I pair X1 with Y2, etc. When finished with X1 you move on to X2 and repeat the process, starting again at Y1, moving down Y2 timeseries. Then I have to plot DCF vs time lag (t0), I am comparing 2 different stocks and finding the correlation between them using this method, Finally I plot DCF vs time lag
here is the first 10 lines on my csv file LIT.csv, and LAC.csv respectively.
Date Open High Low Close Adj Close Volume
12/10/2011 30.360001 30.98 30.360001 30.74 26.554804 6200
13/10/2011 30.719999 30.799999 30 30.459999 26.312922 9850
14/10/2011 31.08 31.08 30.76 30.98 26.762125 12000
17/10/2011 30.860001 30.860001 30.18 30.280001 26.157433 10250
18/10/2011 29.98 30.959999 29.559999 30.82 26.623909 9400
19/10/2011 30.139999 30.6 29.84 29.879999 25.811888 13200
20/10/2011 29.799999 30.16 29.639999 30.08 25.984657 8750
21/10/2011 30.48 30.92 30.48 30.860001 26.658466 4250
24/10/2011 31.139999 31.799999 31.139999 31.719999 27.401377 9700
 dull turtle
hello
serene scaffold
mighty spoke
Hi, so i'm trying to make 2 loops based on the Discrete Correlation function whe...
it's not clear to me from your problem statement what X1 and Y1 are.
dull turtle
this is my df
 serene scaffold
dull turtle
this is my df
serene scaffold
dull turtle
this is my df
No one can use this if it's a screenshot; try print(df.head().to_csv())
dull turtle
serene scaffold
No one can use this if it's a screenshot; try `print(df.head().to_csv())`
i am getting python ,script_name_x,expiry_x,date&time_x,close_x,prev_day_close_x,banknifty_difference,new_date,script_name_y,expiry_y,date&time_y,close_y,prev_day_close_y,nifty_difference,bnf/nf 0,BANKNIFTY,27APR2017,2017-03-01 09:15:59,20796.0,,,2017-03-01 09:16:00,NIFTY,25MAY2017,2017-03-01 09:15:51,8996.25,,, 1,BANKNIFTY,25MAY2017,2017-03-01 09:16:31,20869.0,,,2017-03-01 09:17:00,NIFTY,25MAY2017,2017-03-01 09:16:49,9002.45,,, 2,BANKNIFTY,27APR2017,2017-03-01 09:17:45,20803.55,,,2017-03-01 09:18:00,NIFTY,25MAY2017,2017-03-01 09:17:30,9001.25,,, 3,BANKNIFTY,27APR2017,2017-03-01 09:18:49,20814.05,,,2017-03-01 09:19:00,NIFTY,25MAY2017,2017-03-01 09:18:50,8999.85,,, 4,BANKNIFTY,30MAR2017,2017-03-01 09:19:58,20748.6,,,2017-03-01 09:20:00,NIFTY,27APR2017,2017-03-01 09:19:38,8962.2,,, this way
serene scaffold
Okay, what do you want to do with this?
dull turtle
my code here https://paste.pythondiscord.com/uduzopexuw.sql
in my new_df i am dividing banknifty_difference column and nifty_difference column and the output i am putting in bnf/nf side column
mighty spoke
serene scaffold
it's not clear to me from your problem statement what X1 and Y1 are.
Hi so X1 is the Date column for LAC.csv and Y1 is the Date column for LIT.csv (they are both timeseries)
serene scaffold
mighty spoke
Hi so X1 is the Date column for LAC.csv and Y1 is the Date column for LIT.csv (t...
Do you mean to say that you're trying to compare every row in one dataframe to every row in another?
dull turtle
dull turtle
my code here https://paste.pythondiscord.com/uduzopexuw.sql
@serene scaffold hav u gone through this code ?
u get better idea what i am trying
serene scaffold
dull turtle
<@!253696366952316929> hav u gone through this code ?
I've looked at it, but I need you to distill what you're trying to do for me.
mighty spoke
serene scaffold
Do you mean to say that you're trying to compare every row in one dataframe to e...
yhh i want to compare the two date columns from both files with eachother
dull turtle
serene scaffold
I've looked at it, but I need you to distill what you're trying to do for me.
in my output df some of values are not get divided as u can see in above SS
serene scaffold
mighty spoke
yhh i want to compare the two date columns from both files with eachother
when you say "compare them", what do you mean exactly?
figure out which of the two happens first?
serene scaffold
dull turtle
in my output df some of values are not get divided as u can see in above SS
do your two dataframes have equivalent sets of indices?
dull turtle
serene scaffold
do your two dataframes have equivalent sets of indices?
means ?
serene scaffold
dull turtle
means ?
every dataframe has an index for the rows. When you do any row-wise operation between two dataframes, it does it between rows with the same index value
so if there's an index that's missing from one dataframe or the other, there won't be a result for that row, or it will be NaN.
mighty spoke
serene scaffold
when you say "compare them", what do you mean exactly?
yhh so I want to calculate the time lag between them using the DCF (discrete correlation function) to see if one stock influences the other
dull turtle
serene scaffold
every dataframe has an index for the rows. When you do any row-wise operation be...
now in my case i am doing bnf2_df['banknifty_difference'] column divide by nf2_df['nifty_difference'] column . I am doing column divide column
mighty spoke
serene scaffold
when you say "compare them", what do you mean exactly?
so the first date in stock 1 minus the first date in stock 2 then go to the next date in stock2 and again subtract date of stock 1 until I have gone through the the full length of the date column in stock 2 then move on to the second date element in stock one and repeat the process
serene scaffold
dull turtle
now in my case i am doing `bnf2_df['banknifty_difference']` column divide by `n...
you usually want to have things set up where a column is a field and a row is an observation.
did bnf2_df['banknifty_difference'] / nf2_df['nifty_difference'] do something other than what you expected?
desert oar
mighty spoke
so the first date in stock 1 minus the first date in stock 2 then go to the next...
it might be helpful if you could construct a very small example of inputs and outputs
actually, i think i understand
dull turtle
serene scaffold
you usually want to have things set up where a column is a field and a row is an...
if u see in this csv ss the highlighted column has missing values

i want there divided value
i am getting empty rows there
can u please guide me in this issue ? @desert oar
dull turtle
serene scaffold
did `bnf2_df['banknifty_difference'] / nf2_df['nifty_difference']` do something ...
can u please the above csv ss
 worn canopy
Hi guys, could someone help me understand this code? I understand that there is inheritance an we use the super function to access the methods of the nn.Module, the thing that I don't understand is why the super has parameters, specifically the Class that I'm creating and the self. I´ve seen that the init could have parameters. If someone could help me understand the syntax would be much appreciated, thanks in advance
 serene scaffold
worn canopy
Hi guys, could someone help me understand this code? I understand that there is ...
serene scaffold
worn canopy
Hi guys, could someone help me understand this code? I understand that there is ...
it's the same as if they had done super().__init__(). I think the parser has a special rule where it provides those arguments if you don't pass them.
dull turtle
@serene scaffold can u please guide me also, in above issue ?
serene scaffold
dull turtle
<@!253696366952316929> can u please guide me also, in above issue ?
I cannot; sorry.
dull turtle
see what you are trying to say can u guide in simple words ? so that i also get idea ? @serene scaffold
desert oar
dull turtle
can u please the above csv ss
did you try what stelercus suggested?
dull turtle
desert oar
did you try what stelercus suggested?
which one ?
desert oar
mighty spoke
so the first date in stock 1 minus the first date in stock 2 then go to the next...
how do you actually compute DCF? i'm not familiar with it (but i looked it up, and it seems like something i could definitely use and would have benefited from in the past)
desert oar
dull turtle
which one ?
bnf2_df['banknifty_difference'] / nf2_df['nifty_difference']
mighty spoke
desert oar
how do you actually compute DCF? i'm not familiar with it (but i looked it up, a...
Hi @desert oar this is how you compute it
 arctic wedgeBOT
Hey @mighty spoke!
It looks like you tried to attach file type(s) that we do not allow (.pdf). We currently allow the following file types: .gif, .jpg, .jpeg, .mov, .mp4, .mpg, .png, .mp3, .wav, .ogg, .webm, .webp, .flac, .m4a.
Feel free to ask in #community-meta if you think this is a mistake.
desert oar
mighty spoke
Hi <@!389497659087650836> this is how you compute it
where x1 and y1 are the actual time series values?
desert oar
yes, very wrong 🙂
well, very wrong python syntax
in total honestly, it was so convoluted i didn't bother to figure out if the actual logic was right
def dcf(x, y):
    xm = np.mean(x)
    ym = np.mean(y)
    xs = np.stdev(x)
    ys = np.stdev(y)
    dcf = []
    for xval in xs:
        for yval in ys:
            d = (xval - xm) * (yval - ym) / xs / ys
            dcf.append(d)
    return dcf
something like this?
although actually this seems like it should be a matrix, no?
def dcf(x, y):
    x_n = len(x)
    y_n = len(y)
    x_mean = np.mean(x)
    y_mean = np.mean(y)
    x_stdv = np.stdev(x)
    y_stdv = np.stdev(y)
    dcf = np.zeros((x_n, y_n))
    for i, x_val in enumerate(xs):
        for j, y_val in enumerate(ys):
            d = (x_val - x_mean) * (y_val - y_mean) / x_stdv / y_stdv
            dcf[i, j] = d
    return dcf
there's probably an efficient way to compute that with numpy instead of looping
!e ```python
import numpy as np
def dcf(x, y):
x_n = len(x)
y_n = len(y)
x_mean = np.mean(x)
y_mean = np.mean(y)
x_stdv = np.std(x)
y_stdv = np.std(y)
dcf = np.zeros((x_n, y_n))
for i, x_val in enumerate(x):
for j, y_val in enumerate(y):
d = (x_val - x_mean) * (y_val - y_mean) / x_stdv / y_stdv
dcf[i, j] = d
return dcf
print(
dcf(
[1, 2, 3],
[11, 12, 13, 14, 15, 16],
)
)
@desert oar :white_check_mark: Your eval job has completed with return code 0.
001 | [[ 1.79284291  1.07570575  0.35856858 -0.35856858 -1.07570575 -1.79284291]
002 |  [-0.         -0.         -0.          0.          0.          0.        ]
003 |  [-1.79284291 -1.07570575 -0.35856858  0.35856858  1.07570575  1.79284291]]
ahh isee so is enumerate counting the values
desert oar
https://ui.adsabs.harvard.edu/abs/1988ApJ...333..646E/abstract http://articles.adsabs.harvard.edu/pdf/1988ApJ...333..646E this looks like the original source paper, i see that they do some kind of binning to get the final dcf
mighty spoke
yeah thats the one
desert oar
mighty spoke
ahh isee so is enumerate counting the values
yep, if you have a, b, c, then enumerate() will give you (0, a), (1, b), (2, c)
mighty spoke
desert oar
yep, if you have `a, b, c`, then `enumerate()` will give you `(0, a), (1, b), (2...
ohhh thanks
mighty spoke
desert oar
yep, if you have `a, b, c`, then `enumerate()` will give you `(0, a), (1, b), (2...
would I have to let the y_val be a variable as it will change?
desert oar
mighty spoke
would I have to let the y_val be a variable as it will change?
what do you mean by that?
mighty spoke
so y(t+lag) where t would be the time at that lag
desert oar
mighty spoke
so y(t+lag) where t would be the time at that lag
how does that relate to variables in code? be more specific
mighty spoke
desert oar
how does that relate to variables in code? be more specific
once i have calculated all the lags and the corresponding time values at each lag e.g. i would calculate the DCF and time lag(tao) at time x1, but then I would have to substitute t+ lag(tao) into y_val
or i think i'm over complicating this
mighty spoke
ahh so the loops to calculate the time lag will be seperate
desert oar
you could do it all in one pass, but doing it in 2 steps is a lot simpler while you're in newbie phase
mighty spoke
desert oar
my code doesn't calculate dcf(τ), it calculates dcf_ij
yhh because after i want to plot DCF vs lag
so i would have to turn it into a function of tao maybe
desert oar
you wouldn't have to
actually, the dcf_ij function doesn't know anything about the time values
so imo it'd make sense to first compute the full dcf matrix, and then bring in the time values and compute the τ version
mighty spoke
i see so once i calculate the τ values I just have to sub t+τ into y_val
and that would make the τ version
also when you do dcf[i, j] = d this will give me a list of the x values first then the y values?
wicked grove
desert oar
> So should i repeat the preprocessing by calling the functions on data
i don't ...
I mean they messed up in the tutorial
The variable data has the original data(160000 tweets) and the variable dataset is a combination of positive and negative data( 40k tweets). This split was their step 1. The preprocessing was done on dataset(40k tweets) But in step 6 they have used data.text( which wasn't preprocessed). I don't get why they did that as the preprocessing was done for training the model.
desert oar
wicked grove
I mean they messed up in the tutorial
The variable data has the original data(1...
no, that's not it.
the preprocessing must be applied to both datasets before they can be used in the model.
however, any preprocessing that requires training or fitting must only be trained/fitted on the training set, not the test set.
dull turtle
desert oar
`bnf2_df['banknifty_difference'] / nf2_df['nifty_difference']`
what i have to do here ?
desert oar
dull turtle
what i have to do here ?
really? i feel like you have been working on this for weeks but still don't understand the basics. i recommend that you spend some time working through the pandas tutorial material, slowly and carefully. at this point we are just feeding you answers, which nobody here really wants to do
dull turtle
desert oar
really? i feel like you have been working on this for weeks but still don't unde...
but can u help me to understand where i am doing wrong ?
desert oar
dull turtle
but can u help me to understand where i am doing wrong ?
i don't think so. your situation is complicated and you consistently refuse to post code or usable samples of data (text, not screenshots). you force people to interrogate you for 10, 20, 30 minutes before they can figure out what you're trying to do. you need to slow down, think through problems on your own before asking for help, and formulate more coherent questions accompanied by relevant code and sample data. i recommend reading this: https://stackoverflow.com/help/minimal-reproducible-example
Stack Overflow
Stack Overflow | The World’s Largest Online Community for Developers
you showed us a picture of an excel sheet with some stuff highlighted, saying "there is data missing, help me!" - nobody can help with that, and nobody wants to spend 30 minutes trying to figure out what it is that you are actually asking for
this probably sounds harsh, but as much as i want to help, i don't think i can continue fielding your questions until you make an effort to make them more answerable
 dusk zephyr
Hey folks!
I know python enough to do dsa. I wanna do ML. But I am really stuck. I can't find a path to get started with.
Can you guys suggest some good free resources for ML and DS
I am okay with theoretical concepts
Something like a 100 day ml challenge would do fine too.
silver summit
What’s dsa?
 true crag
Guys, anyone can navigate me thru googel sheet connection
i ve been trying for 1 hour, cant do it
 undone heron
Hey everyone, weird question but lets go
Do we have papers using Ensemblers inside other ensemblers? (e.g: Stacking with GradiantBoosting inside of it as a base estimator)
Looking everywhere but I just cant find the wording to find material about it
thin palm
Hi all, does anyone know how to get more than 100 tweets on Tweepy API? I create a strategy to use "range" on each count per page (100 being max) and loop over the range 10 times resulting in 1000 tweets. BUT, the tweets become duplicated?
here's my code:
live_tweets = []
def grab_tweets(tickers):
twitter_counter = range(10)
for x in twitter_counter:
tweets = api.search_tweets(q ="$" + tickers, count = 100)
json_f_tweets = [r._json for r in tweets]
for tweet in json_f_tweets:
live_tweets.append({'created_at': tweet['created_at'], 'full_text': tweet['text']})
tweet_df = pd.DataFrame(live_tweets, columns=['created_at', 'full_text'])
return tweet_df
desert oar
thin palm
Hi all, does anyone know how to get more than 100 tweets on Tweepy API? I create...
is there an "offset" or "skip" parameter? you might be querying the same 100 tweets over and over otherwise
wise pelican
Does pandas allow image graphs to have the left y-axis border show one metric while the right one shows another metric, where the x-axis is the same between both (in this case it's runtime)? IE: the left one shows the wattage of a computer part while the right one would show the temperature of that computer part
And on a related note, I'm trying to normalize two different but related sets of data so they can both fit in on the same graph as described above
In terms of the above watts vs temps chart, temperatures in celsius rage from 20 to 100 but wattage can range from 50w to 450w so teh scaling would be whack unless they were normalized
thin palm
desert oar
is there an "offset" or "skip" parameter? you might be querying the same 100 twe...
I don't believe so, I'm looking through their API but doesn't have much detail to avoid this
desert oar
thin palm
I don't believe so, I'm looking through their API but doesn't have much detail t...
you are using this? https://docs.tweepy.org/en/stable/api.html#tweepy.API.search_tweets
does the result object have some kind of "next page" attribute?
desert oar
wise pelican
Does pandas allow image graphs to have the left y-axis border show one metric wh...
note: matplotlib does all the plotting, pandas just provides a high-level interface for it
desert oar
wise pelican
And on a related note, I'm trying to normalize two different but related sets of...
if you have two different y axes, who cares if they have different scales?
wise pelican
That's true
thin palm
desert oar
you are using this? https://docs.tweepy.org/en/stable/api.html#tweepy.API.search...
It does not, I am reading now that both max_id and since_id are ways to deal with this
wicked grove
desert oar
no, that's not it.
the preprocessing must be applied to both datasets before th...
Hello, thank you so much!
I trained it on the entire data, and improved the accuracy to 77%, their accuracy is 84 . They have used ngrams and max features in the vectorizer, should i pass those arguments too?
desert oar
wicked grove
Hello, thank you so much!
I trained it on the entire data, and improved the accu...
like i said, attempt to replicate their results as precisely as you can. use the same 20k/20k split
 valid root
what are some good resources to learn machine learning with python
dusk zephyr
silver summit
What’s dsa?
Data structures and algorithms
dusk zephyr
dusk zephyr
Hey folks!
I know python enough to do dsa. I wanna do ML. But I am really stuck....
Pls help
wicked grove
desert oar
like i said, attempt to replicate their results as precisely as you can. use the...
Alrightt!! Will ngrams and max features make a difference?
lapis sequoia
Hey guys, do anyone of you suspects why my loss/val_loss graph looks like it? It is ANN, which calculated if the credit will be paid or not. Why they are not starting at the same point? Or it is to small information to tell smth? https://ibb.co/rFN0PBk
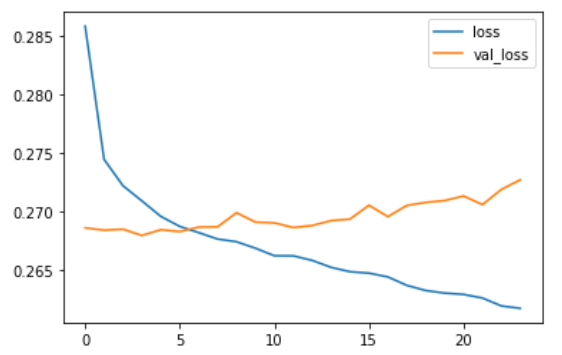
 scarlet cairn
So this is where I can learn to automate stuff?
royal crest
Automation != AI
 chrome wharf
can someone help me how to play songs in spotify using python
desert oar
wicked grove
Alrightt!! Will ngrams and max features make a difference?
i would imagine so
 next phoenix
Hello All. I'm new to Python coding and just completed an amazing Complete Python Bootcamp 2021 : Beginner to Advanced with Hands On Code Implementation: https://t.co/eHcWziXLzE?amp=1

Udemy
Learn Python fast like a pro with Hands On Advanced training: Python Code Implementations and Exercises with Instructor
It covers everything you need to know to go in depth in Python
Right now I'm completing projects. Looking forward to connecting with you all.
 pure gull
Hi, has anyone deployed a yolov5 model after re-training? I see it's easy to run their detect.py script but is there a way to "package and run somewhere else" a yolo model?
 crimson obsidian
@pure gull cloud deploy??
pure gull
Eventually, yes. Just running it in another python program would be fine for now. (The cloud stuff I can find out)
 tepid orbit
Guys
If I have onehot encoded categorical variable
Then I apply TSNE embedding
Then use the data as model input
Is it statically correct?
 calm bison
Hello, I plan to develop my first application with image classification using CNN. Are there any git applications I can try? I just need an idea of how it works.
 quasi parcel
can anyone help with a source where we can read json file which are in this file format yyyy/mm/dd/hh/*.json files in pyspark
lapis sequoia
Hmm, I was wondering if I can get some easy Machine Learning projects in order to test what exactly have I learnt.
wicked grove
desert oar
i would imagine so
I followed their procedure
I implemented it for the 20/20 split,added ngram_range and max features and got 73%
Then i trained it on the entire dataset and got 77
I removed the usernames and tried it and i got this
             precision    recall  f1-score   support

           0       0.77      0.77      0.77     39752
           1       0.77      0.77      0.77     40248

    accuracy                           0.77     80000
   macro avg       0.77      0.77      0.77     80000
weighted avg       0.77      0.77      0.77     80000

 weak tiger
hello my friends I need an help!
why this command turn my variables like a object
df.loc[df['sexo']=='?'] = moda_variavel_sexo
please help me
 slow jewel
pure gull
Hi, has anyone deployed a yolov5 model after re-training? I see it's easy to run...
slow jewel
pure gull
Hi, has anyone deployed a yolov5 model after re-training? I see it's easy to run...
model = torch.hub.load('D:\Drive\yolov5', 'custom', path='D:\Drive\best.pt', source='local')
One option
pure gull
slow jewel
`model = torch.hub.load('D:\Drive\yolov5', 'custom', path='D:\Drive\best.pt', so...
Wow. That was spot on. Please have one internet point
 loud hawk
If I use the train_test_split method from sklearn.model_selection, is there a way to know which data were chosen for the test set? as in, can I somehow get the filename out? or would I have to add the filename as an other feature and then I can get it?
weak tiger
weak tiger
hello my friends I need an help!
anyone may help me?
 boreal summit
Is there a way to check for repeated values in PySpark?
Like check for repeated values in a particular column. Thanks.
 bold timber
how to select only 5 columns without writing the name of columns?

 distant trout
Hi anyone know how to flat list of lists of lists etc.
 wind moat
Hey can anybody point to where I have to look for the following: An AI that creates text responses based on a Movie Character
Or quotes of the character
soft temple
hi i just started learning pytorch
what does .backward() do in pytorch
 tidal bough
Does backpropagation from this tensor, storing in all tensors involved in calculating it the derivatives of this tensor with regards to them, basically.
soft temple
thnx a lot
desert oar
bold timber
how to select only 5 columns without writing the name of columns?
df.iloc[:, :5]
https://stackoverflow.com/q/50122955/2954547 does this answer your question?
Stack Overflow
Is there a simple and efficient way to check a python dataframe just for duplicates (not drop them) based on column(s)?
I want to check if a dataframe has dups based on a combination of columns an...
desert oar
distant trout
Hi anyone know how to flat list of lists of lists etc.
this isn't a data science question. also the answer depends if you need to flatten a known number of layers, or an arbitrary/variable number of layers. be specific.
boreal summit
desert oar
https://stackoverflow.com/q/50122955/2954547 does this answer your question?
Thanks for the response. I know how to check for duplicates. But the question says I should check for repeated titles between years 2000 & 2015. So I was thinking if there's a function for that or I should first get the total counts in those years, then get the distinct and subtract.
I can get the total, and just subtract the distinct from it, but I was thinking if there's a method for that.
desert oar
boreal summit
Thanks for the response. I know how to check for duplicates. But the question sa...
the latter, i don't think there's a specific method for it
boreal summit
Alright, thanks. 👍🏿
 surreal jetty
anyone seen this happen before? The first two lines have usually fixed it, but not in this case
left['time'] = pd.to_datetime(left['time'])
right['time'] = pd.to_datetime(right['time'])

pd.merge_asof(
   left,
   right,
   by="name", on="time", direction="nearest"
)

MergeError: incompatible merge keys [0] dtype('int64') and dtype('O'), must be the same type
it seems to be kinda random whether i get the error or not
the datetimes should be correct on both left and right
if it wasn't, to_datetime should raise an error
desert oar
surreal jetty
if it wasn't, `to_datetime` should raise an error
can you figure out a way to reproduce this reliably? my instinct is that you might need to restart your repl or notebook, you should get neither int64 nor object dtype from to_datetime
sour mango
would I be able to host a Jupyter notebook on a machine connected to some hardware and access the jupyter notebook over the internet from another device to use the hardware?
desert oar
sour mango
would I be able to host a Jupyter notebook on a machine connected to some hardwa...
yes, jupyter notebook is an http server, so you just need to make sure the jupyter tcp port is accessible to the outside
however mind the security risk of exposing a jupyter server on the open web without some kind of authentication. otherwise anyone who can find your server can run arbitrary code through jupyter
one safer option is to have the remote jupyter listen only on localhost, then use ssh to tunnel its port to your machine
jupyter does have a password auth system but i don't know how strong it is
 echo thorn
Im using numpy to multiply an m by m matrix with an m long vector like np.dot(A, b) and I would expect the result to be of the same shape as b but for some reason I get an numpy array that has the shape [x] where x would be the result of A * b
but I want it to just give me back x
because now the shape of r = np.dot(A, b) is not the same as the shape of b but its (1, shape of b)
How do I fix this?
bold timber
desert oar
```python
df.iloc[:, :5]
```
ok thank youu
desert oar
echo thorn
Im using numpy to multiply an m by m matrix with an m long vector like ```np.dot...
what are the actual .shapes of A and b?
desert oar
!e ```python
import numpy as np
A = np.arange(9).reshape((3, 3))
b = np.array([1, 10, 100])
y = A @ b
print(y.shape)
print(y)
@desert oar :white_check_mark: Your eval job has completed with return code 0.
001 | (3,)
002 | [210 543 876]
one of those things must not be the shape you think it is
double check your code and restart your notebook
echo thorn
I run this

and I get this

but I need the np.dot to also be shape (9,)
like I get this [[-2. -1. 4. 3. 0. 7. 16. 11. 22.]]
as the dot product
when I just want [-2. -1. 4. 3. 0. 7. 16. 11. 22.]
desert oar
oh, hah
A is not a ndarray
it is a matrix
stupid quasi-deprecated API
i assume SparseLaplace() returns a scipy sparse matrix?
echo thorn
yeah
desert oar
call A = np.asarray(A)
echo thorn
im implementing a CGM solver