#data-science-and-ml
1 messages · Page 346 of 1
 arctic crown
feature_columns = []
for feature_name in CATEGORICAL_COLUMNS:
  vocabulary = traning_data[feature_name].unique()  # gets a list of all unique values from given feature column
  feature_columns.append(tf.feature_column.categorical_column_with_vocabulary_list(feature_name, vocabulary))
 tacit kraken
Is this channel for machine learning ?
arctic crown
yea
 desert oar
arctic crown
can someone please explain this line
```py
feature_columns.append(tf.feature_co...
desert oar
arctic crown
can someone please explain this line
```py
feature_columns.append(tf.feature_co...
https://www.tensorflow.org/tutorials/structured_data/feature_columns apparently this is "not recommended for new code", they are saying to use keras preprocessing layers instead
but that page should explain how it works
this is the upgraded alternative that they recommend https://www.tensorflow.org/tutorials/structured_data/preprocessing_layers
 slender sand
@desert oar thanks again for the help on that random forest classifier issue the other day. I ended up figuring out how to do those partial dependence plots like you suggested and presented them along with a ton of other data and viz to my manager tonight, and out to the larger team tomorrow.
 calm bison
Hello, may I ask something? I would like to try machine learning that involves facial recognition system.
How many data points do I need?
 bold timber
Hi, i have a question: can I selection feature by pearson correlation without the data normally distributed?
 digital folio
Hi Guys, need some hep to do image classifier. Which playlist would you recommend?
 viral pier
Hey guys 😄 not sure if someone can help me, bit new to numpy and it's amazing!

redArr and percentageArr are 2 2darrays, but I think these operations I'm doing are making right side into a 1d array :/
any ideas?
 serene scaffold
viral pier
serene scaffold
viral pier
For future reference, please always share code as text.
the problem is that your masks are creating 1D arrays.
In [6]: arr
Out[6]:
array([[5, 9, 5, 9, 1],
       [8, 8, 4, 1, 4],
       [3, 8, 9, 2, 9],
       [4, 4, 9, 4, 6],
       [1, 3, 5, 8, 6]])

In [7]: arr[arr > 5]
Out[7]: array([9, 9, 8, 8, 8, 9, 9, 9, 6, 8, 6])
so, what you need to do is have the mask on the left side of the assignment operator (+=, in this case)
red_arr[percent_arr <= step] += percent_arr * (r - r1) / step
this only works if red_arr and percent_arr have the same shape.
@viral pier Please ping me if you have any questions about this.
viral pier
@serene scaffold ahhhhh thank you!!
makes complete sense
GRADIENT_ARRAY_SIZE = 1000


def build_gradient_array(color=DARK_MATTER):
    red_gradient = []
    blue_gradient = []
    green_gradient = []
    step1, (r1, g1, b1) = color[0]
    for step2, (r2, g2, b2) in color:
        step_size = step2 - step1
        red_gradient_step = cp.linspace(r1, r2, GRADIENT_ARRAY_SIZE * step_size)
        green_gradient_step = cp.linspace(g1, g2, GRADIENT_ARRAY_SIZE * step_size)
        blue_gradient_step = cp.linspace(b1, b2, GRADIENT_ARRAY_SIZE * step_size)
        red_gradient.append(red_gradient_step)
        green_gradient.append(green_gradient_step)
        blue_gradient.append(blue_gradient_step)
    red_gradient = cp.concatenate(red_gradient, axis=None)
    green_gradient = cp.concatenate(green_gradient, axis=None)
    blue_gradient = cp.concatenate(blue_gradient, axis=None)
    return red_gradient, green_gradient, blue_gradient
wrote this super convoluted thing in the meanwhile 😄 silly me
thank you @serene scaffold i'm going to try your suggestion
redArr[percentageArr <= step] = percentageArr * (r - r1) / step
ooopsie @serene scaffold looks like i'm still stuck haha
serene scaffold
show error 😮
viral pier
ValueError: operands could not be broadcast together with shapes (248839,) (500, 500) (248839,)
have a 2d array of percentages, that i'm mapping to an rgb gradient
serene scaffold
can you show redArr.shape and percentageArr.shape?
viral pier
both (500, 500)
test gradient (500, 500) (500, 500) (500, 500)
print("test gradient", percentageArr.shape, redArr.shape, greenArr.shape)
serene scaffold
are r, r1, and step arrays or ints/floats?
viral pier
yup i can do a print one sec
serene scaffold
also
redArr[percentageArr <= step] = percentageArr * (r - r1) / step
this is =, not +=
but that probably won't fix it.
viral pier
values 204 88 0 0.5
viral pier
print("values", r, r1, step1, step)
I'm trying everything I can to avoid loops so I can leverage numpy and CUDA as much as possible 😄
all these fancy numpy things are mindblowing
@serene scaffold had this before redArr = percentageArr * (r2 - r1) + r1 which worked fine for a simple gradient yesterday and called it a day haha
serene scaffold
viral pier
ValueError: operands could not be broadcast together with shapes (248839,) (500,...
Can you share the whole error message starting from Traceback?
viral pier
text or image?
serene scaffold
Always text
viral pier
ValueError                                Traceback (most recent call last)
/tmp/ipykernel_4400/1369809907.py in <module>
    167 # adjusted_gravity[adjusted_gravity == -cp.inf] = 0
    168 # adjusted_gravity[adjusted_gravity < -20] = -20
--> 169 rgbArr = get_rgb_array(adjusted_gravity)
    170 im = rgbArr.get()
    171 imageio.imwrite("test.png", im)

~/Projects/dark-matter-theory/app/utils/gradients.py in get_rgb_array(arr)
     65         print("values", r, r1, step1, step)
     66
---> 67         redArr[percentageArr <= step] = percentageArr * (r - r1) / step
     68         greenArr[percentageArr <= step] = percentageArr * (g - g1) / step
     69         blueArr[percentageArr <= step] = percentageArr * (b - b1) / step

cupy/_core/core.pyx in cupy._core.core.ndarray.__setitem__()

cupy/_core/_routines_indexing.pyx in cupy._core._routines_indexing._ndarray_setitem()

cupy/_core/_routines_indexing.pyx in cupy._core._routines_indexing._scatter_op()

cupy/_core/_routines_indexing.pyx in cupy._core._routines_indexing._scatter_op_mask_single()

cupy/_core/_routines_manipulation.pyx in cupy._core._routines_manipulation.broadcast_to()

ValueError: input operand has more dimensions than allowed by the axis remapping
this is with the equals
serene scaffold
oh you're using cupy?
I've never used that.
!e
import numpy as np
red_arr = np.random.random((500, 500))
pct_arr = np.random.random((500, 500))
red_arr[pct_arr <= .5] = pct_arr * (204 - 88) / .5
 arctic wedgeBOT
@serene scaffold :x: Your eval job has completed with return code 1.
001 | Traceback (most recent call last):
002 |   File "<string>", line 4, in <module>
003 | TypeError: NumPy boolean array indexing assignment requires a 0 or 1-dimensional input, input has 2 dimensions
hmm
 wicked grove
hello could someone please tell me why this code is incorrect
stop_words=set(stopwords.words('english'))
stop_words1=sorted(stop_words)
#print(stop_words1)

# dataset['text_length']=dataset['text'].str.len()
# print("yo")
# print(dataset.head())
# for t in dataset.text:
#     s=len(t)

filter=[]
def cleaning(text):
    for w in text.split():
        if w not in stop_words1:
            filter.append(w)
            word="".join(filter)
    print(word)

# for i in range(len(dataset)):
#     if(i==0):
#         dataset['text_rep']=cleaning(df.loc[i,"text"])

print(dataset['text_rep'])=dataset['text'].apply(cleaning())
STOPWORDS = set(stopwordlist)
def cleaning_stopwords(text):
return " ".join([word for word in str(text).split() if word not in STOPWORDS])
dataset['text'] = dataset['text'].apply(lambda text: cleaning_stopwords(text))
dataset['text'].head()
viral pier
@serene scaffold just a dropin replacement for numpy
serene scaffold
wicked grove
```py
stop_words=set(stopwords.words('english'))
stop_words1=sorted(stop_words)
...
print(dataset['text_rep'])=dataset['text'].apply(cleaning())
You're calling the cleaning function when you're supposed to be passing it as an object.
also you can't assign to a function call
print(dataset['text_rep']) is a function call. you can't assign to it.
viral pier
serene scaffold
!e
```py
import numpy as np
red_arr = np.random.random((500, 500))
pct_arr = np....
didn't realise you could run code on the discord server
serene scaffold
@viral pier unfortunately I'm out of time to look into this 
wicked grove
wicked grove
STOPWORDS = set(stopwordlist)
def cleaning_stopwords(text):
return " ".join(...
I want to do this without the lambda or .apply function
wicked grove
serene scaffold
`print(dataset['text_rep'])` is a function call. you can't assign to it.
Okayy yess and what about this
stop_words=set(stopwords.words('english'))
stop_words1=sorted(stop_words)
#print(stop_words1)

# dataset['text_length']=dataset['text'].str.len()
# print("yo")
# print(dataset.head())
# for t in dataset.text:
#     s=len(t)

filter=[]
def cleaning(text):
    for w in text.split():
        if w not in stop_words1:
            filter.append(w)
            word="".join(filter)
    print(word)

for i in range(len(dataset)):
    if(i==0):
        dataset['text_rep']=cleaning(df.loc[i,"text"])

print(dataset['text_rep'])
@serene scaffold SUCCESS!! redArr[percentageArr <= step] *= (r - r1) / step
or almost... colours don't look right haha at least it's progress
serene scaffold
viral pier
<@!253696366952316929> SUCCESS!! `redArr[percentageArr <= step] *= (r - r1) / st...
Why did it work this time?
viral pier
removed percentageArr from the right, but now will need to make sure that redArr keeps the percentages
or I might just combine the 2darrays with colours at the end
still missing a trick though
 lapis sequoia
anyone need any help
 cyan basin
hello
I'm trying to export the model from python to a PMML file, so that it could be called from java code, but when I'm using a catboosterclassifier I receive an error "PMML export currently supports only single-dimensional models". CatBoost documentation is not clear on that error.
I tried to wrap the raining sets, so that it's a single-dimension model, but it's still not working. Does anyone happen to see where lies the issue? Maybe I'm passing those sets in a wrong way? But I tried a different approach and it still didn't help, so I'm not sure if that's it
train_dataset = catboost.Pool(x_train, y_train) saved_to_file_model2 = catboost.CatBoostClassifier() #saved_to_file_model2.fit(x_train, y_train) saved_to_file_model2.fit(train_dataset) saved_to_file_model2.save_model( "modelpmml.pmml", format="pmml" )
lapis sequoia
why do you want a pmml file if you just want to call the model from java
where do you plan to run the final model
try onnx.. else, just run the model as a web service
or.. rewrite the model in java
cyan basin
I just saw in some place that it's convenient to export it to pmml file, so that it can easily be run from java code
lapis sequoia
well,... it's not is it
not all models are supported.. you gotta use what works for you
cyan basin
hmmm, I have already exported the model to .sav file using joblib and it seems to be working, but just wanted to see if I can make it work with pmml, got the impression that it's easier with pmml, but yeah, surely it's not for me
wicked grove
wicked grove
STOPWORDS = set(stopwordlist)
def cleaning_stopwords(text):
return " ".join(...
Is it possible to do it w/o the lambda and .apply functions
serene scaffold
wicked grove
Is it possible to do it w/o the lambda and .apply functions
instead of dataset['text'].apply(lambda text: cleaning_stopwords(text)), do dataset['text'].apply(cleaning_stopwords). cleaning_stopwords is already a function that accepts one string. you don't need to wrap it with another function.
wicked grove
Ohh okayy,thank you!
And could you please where i went wrong w my code
I wanted to iterrate through the rows
And replace each text w/o the stopwords
serene scaffold
when you're working with pandas, avoid thinking of things in terms of iteration. think of things as a transformation of the whole data.
def remove_stopwords(text: str) -> str:
    return ' '.join(word for word in text.split() if word not in stop_words)

dataset['text'] = dataset['text'].apply(remove_stopwords)
Ohh
Because the run time will be too long?
Also do i need to put str(text) ,can i do it w/o that
serene scaffold
wicked grove
Ohh
Because the run time will be too long?
it's more that if you try to think of exactly what steps are involved for every transformation you want to do, you'll waste all your time.
serene scaffold
wicked grove
Also do i need to put str(text) ,can i do it w/o that
what do you mean str(text)?
is dataset['text'] not a series of strings?
wicked grove
serene scaffold
it's more that if you try to think of exactly what steps are involved for every ...
Ohhh okay,thank you!!
wicked grove
serene scaffold
is `dataset['text']` not a series of strings?
It is
serene scaffold
wicked grove
It is
so you can use the code I provided exactly as-is, provided that stop_words is defined.
wicked grove
serene scaffold
what do you mean `str(text)`?
It was given in this format on the internet for some reason
wicked grove
serene scaffold
so you can use the code I provided exactly as-is, provided that `stop_words` is ...
Okay thank you so much
.apply is used to transform the entire df?
serene scaffold
wicked grove
Okay thank you so much
.apply is used to transform the entire df?
not if you're only calling it on one column. if you call it on the dataframe, I'd have to check.
I think DataFrame.apply is column-wise by default.
however this is Series.apply
wicked grove
Ohhh okay,i got it! Thank youu
viral pier
am I allowed to post images? just want to share the funny outcomes as I get through this bug 😄
think i'm getting close
serene scaffold
viral pier
am I allowed to post images? just want to share the funny outcomes as I get thro...
you can post images, yes
(though screenshots of code are bad)
viral pier
here goes my gradient at the moment showing gravirty wells within our neighbouring stars haha

trying to test a theory on dark matter... and i'm here spending 4 hours on the gradients...
 cursive mason
From the looks of it, the image gets compressed but I can't display it as a colour image
viral pier
any advice in storing ndarrays for future use?
serene scaffold
viral pier
any advice in storing ndarrays for future use?
!docs numpy.ndarray.to_pickle
arctic wedgeBOT
Not gonna happen.
No documentation found for the requested symbol.
arctic wedgeBOT
numpy.save(file, arr, allow_pickle=True, fix_imports=True)```
Save an array to a binary file in NumPy `.npy` format.thank you @serene scaffold ! Btw checkout cupy and numba... stuff that would take me like 10 min to run... now runs in like 5s
serene scaffold
viral pier
thank you <@!253696366952316929> ! Btw checkout cupy and numba... stuff that wou...
I use pytorch for that
viral pier
only thing is... try and not use for loops or stream the data in local memory from cpu
@serene scaffold have you played with GPT-J or GPT-NEO?
serene scaffold
nope
viral pier
the adventure continues

this is my gradient 😄

should probably save each iteration of the image to I see how they get updated each step
what an adventure

 grave frost
viral pier
<@!253696366952316929> have you played with GPT-J or GPT-NEO?
grave frost
viral pier
<@!253696366952316929> have you played with GPT-J or GPT-NEO?
what about them?
viral pier
most mindblowing machine learning tech in NLP at the moment I think
this is what I started with before delving into the chaos of custom gradiants 😄
 desert oar
what are you visualizing? something using the network weights?
that last heatmap looks like an alien embryo or something
viral pier
haha so a very simplyfied model of gravity felt in between stars within a galaxy (ignoring all other parameters)
so supposedly there's areas in space where spacetime is almost undistrurbed to an extend and those are the dark areas
trying to find a connection with the cosmic web
desert oar
interesting
using machine learning somehow instead of trying to solve the n-body problem?
viral pier
numpy and CUDA seem fast enough to brute force something out without using n-body problem
viral pier
I just work as a full stack engineer... tried to shoe horn this into TypeScript the other day... and ignored numpy all these years... the regret is real haha
I think I might need some advice on non-linear regression without relying on a black-box machine learning model
if I get a bunch of data it would be awesome if there was a tool, even machine learning related, that could suggest a function rather than give me a prediction model
viral pier
tried curve_fit in scipy and polyfit... but it seems more for prediction analysis than trying to workout a correlation in a human readable way
all simulated for now
desert oar
yeah those are for polynomial fitting... basically ad-hoc nonlinear interpolation
for something this advanced you will definitely want some kind of designed model
what do the colors represent?
 next lance

lapis sequoia
viral pier
if I get a bunch of data it would be awesome if there was a tool, even machine l...
h20
next lance
Why people say it's hard to install tenserflow
viral pier
e.g. this is the formula that represents how density changes in the milky way as radius increases

think is polyfit won't really help me here I think? and a model would just hide the formula from sight into a bunch of matrices
a few years ago I wrote a genetic algorithm that generated random functions and checked the health of the generation with levenshtein, but it was super slow
desert oar
next lance
Why people say it's hard to install tenserflow
because on windows it's hard to install anything
viral pier
@desert oar any suggestions, if i have a bunch of Xs and Ys, having machine learning guessing the relationship between a set of parameters?
lapis sequoia
first of all.. dont use wsl2
viral pier
I'm on Windows, and just use the linux kernel for CUDA and anything else
desert oar
viral pier
<@!389497659087650836> any suggestions, if i have a bunch of Xs and Ys, having ...
yep, especially if it's a complicated nonlinear function that's where neural networks can do really well. especially if you can simulate a huge number of data points
lapis sequoia
surprised it supports gpus
viral pier
@lapis sequoia you can run CUDA enabled docker containers as well... it's pretty shocking
even comes with X Server
next lance
desert oar
because on windows it's hard to install anything
We just have to do this
pip install --updrade tenserflow and done

 desert oar
next lance
We just have to do this
```pip install --updrade tenserflow``` and done
desert oar
next lance
We just have to do this
```pip install --updrade tenserflow``` and done
getting cuda installed seems to be the issue 🤷♂️
and cudnn
viral pier
on Windows?
if on Windows just install the CUDA drivers and do everything in the Linux kernel... anything else is a pain, I have a few links
The guide for using NVIDIA CUDA on Windows Subsystem for Linux.
guide might be targeted at current Ubuntu LTS, and CUDA drivers are the latest version as well
which I think is 11.4
desert oar
idk, i haven't personally had a problem!
viral pier
mine is mainly the need of installing ad-hoc packages like ffmpeg etc..
and compiling them a certain way
and setting the Docker containers up so others can use them easily
@desert oar btw sorry for derelaing this... I'm pretty new to machine learning tbh, I know it excells at non-linear regression...
desert oar
i don't think there's anything to derail, don't worry
viral pier
but is it actually able to suggest potential distributions or formulas?
desert oar
we are just chatting here
viral pier
even a pointer in the right direction would be useful
desert oar
viral pier
but is it actually able to suggest potential distributions or formulas?
a typical neural network can't spit out a formula other than the neural network itself, which is a big pile of matrix multiplications and generally isn't "human-readable"
viral pier
I failed miserably yesterday by using curve fit from a very simple generated set of artificial Xs and Ys haha
desert oar
i believe there has been some research into neural networks that don't just fit parameters but actually can learn a functional form, but i don't know if that's made progress or if it was just some random paper from years ago
if you just want to understand a neural network's learned relationships, you can use partial dependence or techniques like LIME or SHAP
as well of course just plotting the outputs on simulated inputs
viral pier
@desert oar so potentially I'd have to write something bespoke where I use genetic algos and build up a set of formulas that could get close to the end result
desert oar
yes, there's prior art for doing that
viral pier
because the Xs and Ys aren't chaotic like in investments or other areas
kind of like you get data from an apple falling off a tree
desert oar
you could do something like a 3-stage process: 1) generate a functional form from the genetic algorithm, 2) fit its parameters to the data, 3) compute the score of the best-fitted model
so your genetic algorithm search space isn't over "all possible models", it's "all possible functional forms" which can be then optimized with nonlinear least squares, something based on maximum likelihood, gradient descent, etc. etc.
viral pier
so at t0 it's here, at t1 it's there, and so on... so data isn't very chaotic despite maybe wind and such, but eventually a formula will be given that closesly resembles that
desert oar
but if you don't actually need a functional form, neural networks and gradient boosting (e.g. xgboost) can learn arbitrarily complicated functions; you're only limited by having enough data, and by the function not being so complicated that the model never sees a pattern that it can learn
viral pier
thanks a lot for your help!
desert oar
ah i knew there was a term for this buried in my head
"functional regression"
well maybe not exactly the same
that's learning a model where the inputs to the model are functions
might be relevant or just a fun piece of trivia, who knows https://en.wikipedia.org/wiki/Functional_regression
Functional regression is a version of regression analysis when responses or covariates include functional data. Functional regression models can be classified into four types depending on whether the responses or covariates are functional or scalar: (i) scalar responses with functional covariates, (ii) functional responses with scalar covariates...
viral pier
thank you!!
don't know much about the inner workings of NLP, but I'm wondering if there's a way to represent a structured tree in matrices
what I built 2-3 years ago was fun, but super innefficient and slow lol
viral pier
I think a formula e.g. x = y^2 * (a + b) / c, is like a piece of text
at the moment thinking of just generating random functions and feeding them to this https://docs.scipy.org/doc/scipy/reference/generated/scipy.optimize.curve_fit.html
ok
so basically if there'a tree of sorts it needs a way to get stored and extracted from a chromosome
like a seed
desert oar
yeah, you might be able to do some interesting structured learning on "syntax trees" - although i suggest looking into the vast literature of logic programming and AI dating back to the 50s
viral pier
basically i'm trying to reverse engineer the data than having a prediction model
like if I wanted to reverese engineer the physics rules used in a game engine by collecting data
and extract a rough set of formulas and constants used
might not be as accurate as a machine learning model, but could be ELI5 for humans version of it
anyway numpy is lit as hell
wicked grove
serene scaffold
```py
def remove_stopwords(text: str) -> str:
return ' '.join(word for word ...
Heyy, can you please tell me how i can pass the text to the remove_stopwords function without using type hints
I did not get the text: str -> str: part
(It's hinting that the text we receive and return should be a string type?)
serene scaffold
wicked grove
Heyy, can you please tell me how i can pass the text to the remove_stopwords fun...
you can remove the type hints and it won't affect anything.
 serene scaffold
also @wicked grove do you know what a string is?
wicked grove
serene scaffold
you can remove the type hints and it won't affect anything.
Okay yess
Also when i type the list comprehension part with a for loop instead it just starts hanging
wicked grove
serene scaffold
also <@!696373334119546890> do you know what a string is?
Yeah i do
serene scaffold
wicked grove
Okay yess
Also when i type the list comprehension part with a for loop instead ...
you changed the code that I provided? can you show me?
Please ping me if you show me the code; I will not check otherwise.
wicked grove
serene scaffold
you changed the code that I provided? can you show me?
filter=[]
def cleaning(text):
    for w in text.split():
        if w not in stop_words1:
            filter.append(w)
    return "".join(filter)

#def remove_stopwords(text):
#    return ' '.join(word for word in text.split() if word not in stop_words)

dataset['text_rep'] = dataset['text'].apply(cleaning)

print(dataset.head())
```i first did it with the code you gave, it worked perfectly but i am new to list comprehensions so i did that w a for loopa list comprehension is basically just a one-line for loop
also, you defined filter outside of the function, so it's going to be appending to the same list every time forever
and you'll eventually run out of memory
!e
global_list = []

def cleaning(text):
    for w in text.split():
        global_list.append(w)
    return ' '.join(global_list)

print(cleaning("Hello world!"))
print(cleaning("Goodbye world!"))
print(cleaning("The list keeps growing..."))
print(cleaning("And growing..."))
@serene scaffold :white_check_mark: Your eval job has completed with return code 0.
001 | Hello world!
002 | Hello world! Goodbye world!
003 | Hello world! Goodbye world! The list keeps growing...
004 | Hello world! Goodbye world! The list keeps growing... And growing...
Ohhh shit, if i dont declare it outside should it be declared inside instead?
wicked grove
serene scaffold
!e
```py
global_list = []
def cleaning(text):
for w in text.split():
...
Thank you so muchh!!
serene scaffold
wicked grove
Ohhh shit, if i dont declare it outside should it be declared inside instead?
you should define it inside the function so that it's a new list each time.
keep in mind, in Python, you don't "declare" anything
declaring a variable is stating what type it has. in languages like Java, you can declare a variable and define it separately or in the same statement.
 mossy owl
yo, i'm searching for a graph option, preferable with matplotlib, that can display missing numbers in 1D
i have an array that consists of numbers going strictly up. some numbers are missing, though, and i would like to visualise these missing numbers, kind of like in the picture
what's the best approach here? i tried googling, but i couldn't find anything, as i don't even know how you would call such a graph
 wicked grove
serene scaffold
you should define it inside the function so that it's a new list each time.
wicked grove
serene scaffold
you should define it inside the function so that it's a new list each time.
Alrightt, and just to clarify for each row the stopword is removed and added to the list?
wicked grove
serene scaffold
declaring a variable is stating what type it has. in languages like Java, you ca...
Okayy yeah thank youu!!
I think i got confused cause i started learning c++ last week
wicked grove
serene scaffold
!e
```py
global_list = []
def cleaning(text):
for w in text.split():
...
I got the output, thanks a lot! :))
serene scaffold
wicked grove
Okayy yeah thank youu!!
I think i got confused cause i started learning c++ last...
learning C++ will confuse you no matter when.
viral pier
when numpy gets all dat GPU ram
 mossy owl
yo, i'm searching for a graph option, preferable with matplotlib, that can displ...
mossy owl
mossy owl
yo, i'm searching for a graph option, preferable with matplotlib, that can displ...
nvm i figured it out
wicked grove
serene scaffold
learning C++ will confuse you no matter when.
Oh fuck really:/
serene scaffold
wicked grove
Oh fuck really:/
ye
 undone mist
Hi... I had written an article on Decision Tree Algorithm with titile - Classification between Apple and Oranges— Machine Learning example with Images for beginners. Please Dm me your valuable feedback so that i can improve the article.
https://medium.com/@pythonscript007/classification-between-apple-and-oranges-machine-learning-example-with-images-for-beginners-487b3173f50
 wise pelican
So I have a dict where the keys are the name of a company, and the values are the yearly net profit
I can easily get the mean/median and other data points with numpy by converting the values into an array like so:
my_values = list(my_data.values())
values_array = numpy.array(my_values)
mean = numpy.mean(values_array)
The thing is that I want to see what company/companies may have that mean/median value, or are at least the closest to it
I'm just not sure how to go about finding the company name that is 1 above and 1 below the given mean/median
I see I can get the nearest value that is higher than the value I'm looking for with:
item_min = min(my_values, key=lambda x:abs(x-mean))
you might want to use pandas for working with "labeled" data
serene scaffold
@desert oar all non-staff are muted right now, fyi
desert oar
serene scaffold
<@!389497659087650836> all non-staff are muted right now, fyi
ty. some kind of raid?
!e @wise pelican example usage:```python
import pandas as pd
Assume that you loaded this data from somewhere
profits = {
'AAPL': 1_000_000_000,
'GOOG': 1_000_000_000_000,
'UBER': -1_000_000_000_000_000,
'IBM': 5,
}
Setting name=... and index.name=... is optional,
but it helps with printing and debugging
profits = pd.Series(profits, name='profits').rename_axis(index='company')
print(profits)
print()
print('Mean profit: ', profits.mean())
@desert oar :white_check_mark: Your eval job has completed with return code 0.
001 | company
002 | AAPL          1000000000
003 | GOOG       1000000000000
004 | UBER   -1000000000000000
005 | IBM                    5
006 | Name: profits, dtype: int64
007 |
008 | Mean profit:  -249749749999998.75
in pandas, a "series" is like a single column in a spreadsheet
a "dataframe" is like a spreadsheet, i.e. a collection of columns with row ids/labels shared across columns
wise pelican
S'all good, saw the post in #bot-commands
I did find a non-pandas solution that's a little dumb
my_keys = list(my_data.keys())
my_values = list(my_data.values())
values_array = numpy.array(my_values)

results = {}
results["mean"] = {}
results["mean"]["value"] = numpy.mean(values_array)
results["median"] = {}
results["median"]["value"] = numpy.median(values_array)

if results["mean"]["value"] in my_values:
   results["mean"]["Company"] = my_keys[my_values.index(results["mean"]["value"])]
else:
    item_min = min(my_values, key=lambda x:abs(x-results["mean"]["value"]))
    msg = "Sits between {} (${}) and {} (${})".format(
        my_keys[my_values.index(item_min)],
        item_min,
        my_keys[my_values.index(item_min) + 1],
        my_data[my_keys[my_values.index(item_min) + 1]]
    )
    results["mean"]["Comapany"] = msg
Very brute force
Yeah going to put it into a dataframe to better handle this cause it's messy
desert oar
heh you can do that too
if results["mean"]["value"] in my_values: this makes me nervous
beware of exact comparisons with floating point numbers (i.e. non-integer numbers)
wise pelican
Also a valid point
I know pandas uses numpy, but is it pretty much able to replace all functions of numpy?
Hmm now the issue is getting the names of the companies that are nearest the mean/median
desert oar
wise pelican
I know `pandas` uses `numpy`, but is it pretty much able to replace all function...
not really, it's a layer on top of numpy. but yes, it implements a big subset of numpy methods
desert oar
wise pelican
Hmm now the issue is getting the names of the companies that are nearest the mea...
!e i'll show the pandas version because it's so much simpler:
import pandas as pd

# Assume that you loaded this data from somewhere
profits = {
    'AAPL': 1_000_000_000,
    'GOOG': 1_000_000_000_000,
    'UBER': -1_000_000_000_000_000,
    'IBM': 5,
}

profits = pd.Series(profits, name='profits').rename_axis(index='company')

profit_mean = profits.mean()
profit_median = profits.median()

company_closest_to_mean = (profits - profit_mean).abs().idxmin()
company_closest_to_median = (profits - profit_median).abs().idxmin()

print(company_closest_to_mean, company_closest_to_median)
@desert oar :white_check_mark: Your eval job has completed with return code 0.
IBM AAPL
oh that's so sexy
desert oar
doing it with only numpy isn't that different, you'd do something like this
company_names = list(profits_dict.keys())

company_closest_to_mean = company_names[(profits - profit_mean).abs().argmin()]
company_closest_to_median = company_names[(profits - profit_median).abs().argmin()]
obviously you can break that up into more than one line but yes
"sexy" is the right word imo
 fiery dust
help is much appreciated
serene scaffold
fiery dust
help is much appreciated
with what?
wise pelican
So let's say I change my data to be a nested dict:```py
my_data = {}
my_data["Google"] = {}
my_data["Google"]["Ticker"] = "GOOG"
my_data["Google"]["Profit"] = 1_000_000_000_000
... # for all the other companies
I can change the previously mentioned code to be like this:```py

df = pd.DataFrame(my_data).transpose().rename_axis(index="Company")

results["mean"] = {}
val = df["Profit"].mean()
results["mean"]["value"] = locale.currency(val, grouping=True)
results["mean"]["ticker"] = (df["Profit"] - val).abs().idxmin()
But that last line doesn't work anymore
wise pelican
I get that (df["Profit"] - val).abs() returns a pandas Series but I'm not sure why idxmin is no longer something that works on it
desert oar
wise pelican
I get that `(df["Profit"] - val).abs()` returns a pandas Series but I'm not sure...
oh, maybe .abs returns a numpy array. in which case that's my oversight
(and also a weird leak in the pandas abstraction)
!e ```python
import pandas as pd
data_dict = {
{"Google": {"Ticker": "GOOG", "Profit": 1},
{"Apple": {"Ticker": "AAPL", "Profit": 2},
{"DogeMiner69 Inc.": {"Ticker": "MOOON", "Profit": 99},
}
data_df = pd.DataFrame.from_dict(data_dict, orient='index')
print(data_df)
@desert oar :x: Your eval job has completed with return code 1.
001 |   File "<string>", line 9
002 |     data_df = pd.DataFrame.from_dict(data_dict, orient='index')
003 |     ^
004 | SyntaxError: invalid syntax
oh what did i break
wise pelican
Well getting the type((df["Profit"] - val).abs()) says it is a series
desert oar
that's what i thought, as per my example
what is the error you get?
!e ```python
import pandas as pd
data_dict = {
"Google": {"Ticker": "GOOG", "Profit": 1},
"Apple": {"Ticker": "AAPL", "Profit": 2},
"DogeMiner69 Inc.": {"Ticker": "MOOON", "Profit": 99},
}
data_df = pd.DataFrame.from_dict(data_dict, orient='index')
print(data_df)
@desert oar :white_check_mark: Your eval job has completed with return code 0.
001 |                  Ticker  Profit
002 | Google             GOOG       1
003 | Apple              AAPL       2
004 | DogeMiner69 Inc.  MOOON      99
TypeError: reduction operation 'argmin' not allowed for this dtype
I know argmin is from numpy
wise pelican
object
It should be floats
desert oar
!e ```python
import pandas as pd
data_dict = {
"Google": {"Ticker": "GOOG", "Profit": 1},
"Apple": {"Ticker": "AAPL", "Profit": 2},
"DogeMiner69 Inc.": {"Ticker": "MOOON", "Profit": 99},
}
data_df = (
pd.DataFrame.from_dict(data_dict, orient='index')
.rename_axis(index='Company', columns='Feature')
)
print(data_df)
@desert oar :white_check_mark: Your eval job has completed with return code 0.
001 | Feature          Ticker  Profit
002 | Company
003 | Google             GOOG       1
004 | Apple              AAPL       2
005 | DogeMiner69 Inc.  MOOON      99
yeah sounds like the data had some junk in it and pandas left it as strings
wise pelican
Yep changing my initialization of the dataframe to what you posted above works perfectly
wise pelican
Right now the reason they're named is because the original data set is loaded from a json file, eventually being moved into a db
desert oar
no, i meant as a followup to my own example
i very rarely do .rename_axis(columns=...)
i usually only do it when preparing dataframes for export/display, or when doing some really funky stuff and need to keep careful track of what's what
 open pond
Hello
I'm looking for an optimization algorithm that would find solutions that strictly satisfy a constraint on the output variable
I need f(x) to be below a certain requirement, but as close to that requirement as possible
 modest timber
I wonder. What specific ML could I use that could help me load daly chart and show likely paterns occurs. Is it posible?
Is for my graduation engineering project
I know typical RNN find this pattern and show me the result of this recognistion
serene scaffold
modest timber
I wonder. What specific ML could I use that could help me load daly chart and sh...
what patterns?
wise pelican
So I have a pytorch program take some input video, extract the frames, and try to generate new frames to create a new video that's at a higher framerate
Normally the program only supported integer multiples of the framerate, but I was working on adding support for float multiples that are >1 for situations where the input framerate is 24 and the output framerate is something like 60, which is a 2.5 more frames
My initial idea is to generate enough frames to be a multiple of the target framerate
So in the above case with a 24fps source and a 60fps target, I would generate 5 new frames for each existing frame (60/24 = 2.5 -> 1/2.5 = 5 -> 24 * 5 = 120 which is divisible by 60), then I would delete 1/2 the new frames to bring it back down to the target fps of 60
Is there some more efficient way to do this? Because now I'm doing 2x the work
My alternative idea was in this scenario is to alternate generating a certain amount of frames every time I get to an original source frame
IE: that 2.5x frame generation would mean that I would generate 2 frames between the source frame 1 and source frame 2, then generate 3 new frames between source frame 2 and source frame 3
 green phoenix
i just found out about onehotencoder it seems like a direct upgrade from label encoder but im unsure and the documents that SKlearn provides are like entire novels, can anyone give some advice on this?
desert oar
my advice is to read the documents
it helps to understand the concept of multicollinearity
 lilac dagger
i want a book to learn AI and data science
i'v heard nnfs is good but i don't think it uses libs like tensorflow and also doesn't teach you CNN'S
green phoenix
https://www.amazon.ca/Hands-Machine-Learning-Scikit-Learn-TensorFlow/dp/1492032646/ref=sr_1_1?crid=LC I got this one i think its very good

Hands-On Machine Learning with Scikit-Learn, Keras, and TensorFlow: Concepts, Tools, and Techniques to Build Intelligent Systems
 tender hearth
lilac dagger
i'v heard nnfs is good but i don't think it uses libs like tensorflow and also d...
tender hearth
lilac dagger
i'v heard nnfs is good but i don't think it uses libs like tensorflow and also d...
Using a book to learn a lib would be pretty stupid IMO
 lone drum
Hello
I have a variable which has unique dates
Also I have data frame which has open column
How I can get open value for each date
I am using loc method
new_date has unique dates
new_df is dataframe which has open column
My code ```python
For i in new_dates1[0]:
a = new_df.loc[new_df[['date, open`]]
Ping when replying
How I can retrieve row
serene scaffold
@lone drum if you index new_df by the dates, you can just do new_df.loc[new_dates1, 'open'].
lone drum
!pastebin
arctic wedgeBOT
Pasting large amounts of code
If your code is too long to fit in a codeblock in discord, you can paste your code here:
https://paste.pythondiscord.com/
After pasting your code, save it by clicking the floppy disk icon in the top right, or by typing ctrl + S. After doing that, the URL should change. Copy the URL and post it here so others can see it.
lone drum
My code https://paste.pythondiscord.com/abojiyiqoj.py
@serene scaffold
My current output
https://paste.pythondiscord.com/atucabasag.css
I want to get for each date open value only
serene scaffold
So you make a list of Dates
serene scaffold
serene scaffold
<@!680099760836968475> if you index `new_df` by the dates, you can just do `new_...
And do this
lone drum
For e.g.
01-03-2016.   160.80
02-03-2016    165.90


And so on...```You only want the first one?
lone drum
serene scaffold
So you make a list of Dates
Do u get what I am trying to do ?
lone drum
serene scaffold
You only want the first one?
Yes
First one for each daye
Date
Ping me when u reply
 royal crest
one thing i can see is that you've freely mixed ' and `
serene scaffold
@lone drum I always ping when I reply.
Look in to how to group a data frame by time intervals. Then you just need to use .first()
serene scaffold
royal crest
one thing i can see is that you've freely mixed ' and `
They're not saying that they're getting syntax errors
So that must not be the case in the actual code.
royal crest
just making sure 👍
 wide meadow
Hi everyone, I had a doubt regarding Support Vector Machines. Is the hyperplane constructed for classification in SVM always linear?
 rigid zodiac
wide meadow
Hi everyone, I had a doubt regarding Support Vector Machines. Is the hyperplane ...
rigid zodiac
wide meadow
Hi everyone, I had a doubt regarding Support Vector Machines. Is the hyperplane ...
I think so what is your doubt
wide meadow
rigid zodiac
I think so what is your doubt
I just wanted to know if the hyperplane is linear or not.
rigid zodiac
wide meadow
I just wanted to know if the hyperplane is linear or not.
It does. Also svm have another version support polynomial and radial
Training model for that is a bitch…. Well depend on how big is ur data set. Mine is 50000 csv. Take me a week with pro subscription colab
 uneven thistle
why am i getting a blank canvas when trying to plot this pie chart using plotly on google collab ?
 wide meadow
rigid zodiac
It does. Also svm have another version support polynomial and radial
wide meadow
rigid zodiac
It does. Also svm have another version support polynomial and radial
In polynomial and radial, is the hyperplane linear?
wide meadow
rigid zodiac
Training model for that is a bitch…. Well depend on how big is ur data set. Mine...
Oh!!
rigid zodiac
wide meadow
In polynomial and radial, is the hyperplane linear?
Yep
rigid zodiac
uneven thistle
why am i getting a blank canvas when trying to plot this pie chart using plotly ...
have you try to restart the kernel?
wide meadow
rigid zodiac
Yep
Thank you!
 buoyant adder
In this video, I went over the 1 most important thing many data science projects lack and how they can incorporate it to get their dream jobs. If you are confused about how to go about a project that can make your portfolio stronger and stand out from others then this video is for you! If you like our content, subscribe to our channel for similar content. Link to the video: https://youtu.be/LV795lNx_4I

In this video, we delve into the 1 project tip that can help you build the project that can get you your dream job in Data Science. We also provide some project ideas with this trick and how you can use it to land your dream job. Join this telegram group if you are serious about learning data science and want to avail free organized resources th...
uneven thistle
no @rigid zodiac and i dont know how to do that
rigid zodiac
uneven thistle
no <@!380930360407621646> and i dont know how to do that
on top of your colab click run time
then reset it
 prisma mulch
model = keras.Sequential([
  preprocessing.RandomContrast(0.3),
  preprocessing.RandomFlip('horizontal'),
  layers.Conv2D(64, kernel_size=(3, 3), activation='relu', padding='same'),
  layers.Conv2D(128, kernel_size=(3,3), activation='relu', padding='same'),
  layers.BatchNormalization(),
  layers.MaxPool2D(),
  layers.Conv2D(256, kernel_size=(3,3), activation='relu', padding='same'),
  layers.MaxPool2D((2,2)),
  layers.Conv2D(256, kernel_size=(3,3), activation='relu', padding='same'),
  layers.BatchNormalization(),
  layers.Conv2D(400, kernel_size=(3,3), activation='relu', padding='same'),
  layers.MaxPool2D(),
  layers.Conv2D(512, kernel_size=(3,3), activation='relu', padding='same'),
  layers.BatchNormalization(),
  layers.Flatten(),
  layers.Dropout(0.18),
  layers.Dense(256, activation='relu'),
  layers.Dense(128, activation='softmax'),
    ])
this is my model architecture. I was tring out CIFAR-10
compile has these arguments:
model.compile(
  optimizer='adam',
  loss='categorical_crossentropy',
  metrics=['accuracy']
  )
and when I try to fit the model,
history = model.fit(
  train_x, train_y, validation_data=(test_x, test_y), epochs=16
  )
It throws the following traceback:
  ValueError                                Traceback (most recent call last)
<ipython-input-12-9e5a8c6f7271> in <module>()
      1 history = model.fit(
----> 2   train_x, train_y, validation_data=(test_x, test_y), epochs=16
      3   )

9 frames
/usr/local/lib/python3.7/dist-packages/tensorflow/python/framework/func_graph.py in wrapper(*args, **kwargs)
    992           except Exception as e:  # pylint:disable=broad-except
    993             if hasattr(e, "ag_error_metadata"):
--> 994               raise e.ag_error_metadata.to_exception(e)
    995             else:
    996               raise

//there was some logging stuff here
    ValueError: Shapes (None, 1) and (None, 128) are incompatible
 timid sluice
I'm trying to create dataframe with youtube comments for an NLP thing. Can someone help out with getting the code to scroll to the bottom of the page so that the comments section starts to load in? Selenium doesn't find anything. tried maxing window size and sending the DOWN key repeatedly. New to this.
lapis sequoia
Whats thd diference betwen a data scientist and ai engineer
timid sluice
There's a lot of overlapping skills but AI engineers focus more on the models themselves i assume. Data scientist is a general term for working with all sorts of data and making the best of it.
modest timber
serene scaffold
what patterns?
pattern, meaning the specific layout in the charts
like 5min timeframe candles (or linear ) start lower go higher and medium etc...
another start higher end medium at middle of day
 jade acorn
is machine learning only used to predict stuff?
jade acorn
yes i understand deep learning is different
serene scaffold
deep learning is a subset of machine learning
rigid zodiac
😄
jade acorn
supervised machine learning ,what can it do other than predicting?
serene scaffold
what does "predict" mean, to you?
jade acorn
for example if i have a set of data with house price, location , space in square feet, amount of rooms
how can i apply machine learning in this scenario?
serene scaffold
yes, you could predict the price of a house based on the location, square footage, and number of rooms.
that is to say, you could develop a model that is able to make those predictions.
how does that sound @jade acorn?
jade acorn
i guess thats what i was getting at
i suppose my confusion would be more oriented towards what specific things would be interesting to predict via ML
wide meadow
jade acorn
supervised machine learning ,what can it do other than predicting?
Classification
serene scaffold
jade acorn
i guess thats what i was getting at
the trick would be how you represent locations. GPS coordinates would be difficult to work with.
serene scaffold
wide meadow
Classification
classification is where you predict the classes 
desert oar
(however you might want to consider that gps coordinates are better than zip codes etc. because they vary smoothly)
(note that you should probably gps coords to 3-4 decimal places)
(you can combine categorical features like school districts w/ gps coords)
jade acorn
my current data set is quite simple , its just the city
serene scaffold
desert oar
(however you might want to consider that gps coordinates are better than zip cod...
yes, one might want to figure out what "kind" of location the coordinates are (urban neighborhood, suburban, rural). or the name of the city.
jade acorn
the location would just be city
serene scaffold
chances are, you'd just discover that larger houses with more rooms cost more. so it might be most interesting to figure out what the outliers are and why this is the case.
jade acorn
Cant all that be done with just linear regression though?
serene scaffold
if one of the features is the name of a city, you can't use regression without encoding the city name differently.
desert oar
serene scaffold
yes, one might want to figure out what "kind" of location the coordinates are (u...
fun fact: i've tried that using census classifications and it's not as informative a feature as you'd think for a lot of things. i've tried with census statistical areas, census block pop density, etc. pop density is useful in general though. census publishes that data for free but you have to download and clean it all
serene scaffold
desert oar
fun fact: i've tried that using census classifications and it's not as informati...
boo cleaning
desert oar
serene scaffold
if one of the features is the name of a city, you can't use regression without e...
serene scaffold
unless I get to use regex.
desert oar
A data.frame processor/conditioner that prepares real-world data for predictive modeling in a statistically sound manner.
vtreat prepares variables so that data has fewer exceptional cases, making
it easier to safely use models in production. Common problems vtreat defends
against: Inf, NA, too many categorical levels, rare categoric...
“80% of data analysis is spent on the process of cleaning and preparing the data”
– Dasu and Johnson 2003
In the glamorous world of big data and deep learning the get your hands into the dirt of real world data is often left as an exercise to the analyst with hardly a footnote in the resulting paper or software.
With the advent of open source s...
 jade acorn
so i guess what to predict is just up to the individuals imagination for what would be interesting? but in rough terms: ML is for prediction right?
desert oar
prediction is one of many things you can do with ML, albeit probably the most popular
 inland imp
ML is part of AI. So AI engineer's scope is broader
serene scaffold
@lapis sequoia generally, data science > ai > machine learning > deep learning
I suspect the only difference between "AI engineer" and "ML engineer" is which of the two terms the employer picked.
desert oar
i'd suggest that an AI engineer might be working with hardware, robotics, computer vision, etc. possibly symbolic/logic programming
whereas ML is a bit more general
lapis sequoia
So which one is better
 jaunty pasture
Hello, I am trying to fit the model for multiple data frames using joblib parallel. I don't want use the for loop iteration list data frames. cause it taking too much time.
def rf_hyper_parameter_model(df,feature_number, sample_size):

    class_name = df.iloc[:, -1].name
    #print(class_name)
    le = LabelEncoder()
    df[class_name] = le.fit_transform(df.iloc[:, -1])
    data = df.groupby(class_name).apply(lambda x: x.sample(n=sample_size)).reset_index(drop=True)
    X_train, X_test, y_train, y_test = train_test_split(data.iloc[:, 0:feature_number], data.iloc[:, -1], test_size=0.2,random_state=42)

    n_estimators = [int(x) for x in np.linspace(start=100, stop=5000, num=10)]
    max_features = ['auto', 'sqrt']
    max_depth = [int(x) for x in np.linspace(10, 310, num=11)]
    max_depth.append(None)
    min_samples_split = [2, 5, 10]
    min_samples_leaf = [1, 2, 4]
    bootstrap = [True, False]
    random_grid = {'n_estimators': n_estimators, 'max_features': max_features,
                   'max_depth': max_depth, 'min_samples_split': min_samples_split,
                   'min_samples_leaf': min_samples_leaf, 'bootstrap': bootstrap}
    rf_clf = RandomForestClassifier(random_state=42)
    rf_cv = RandomizedSearchCV(estimator=rf_clf, scoring='f1', param_distributions=random_grid, n_iter=100, cv=2,verbose=2, random_state=42, n_jobs=-1)
    rf_cv.fit(X_train, y_train)
    rf_best_params = rf_cv.best_params_
    rf_clf = RandomForestClassifier(**rf_best_params)
    model = rf_clf.fit(X_train, y_train)
    joblib.dump(model, "rf_class1_device_" + str(i) + '.sav')
    return model

result = Parallel(n_jobs=10 ,backend="threading")(delayed(rf_hyper_parameter_model)(df, 20,10000 )for i,df in enumerate(class3_df))
can anyone please help me with it?
result variable is still running even if after the model fits for each iteration of dataframe.
desert oar
@jaunty pasture it looks like you are doing the loop inside the model at every iteration
oh, you're fitting the same model to many different dataframes?
desert oar
jaunty pasture
result variable is still running even if after the model fits for each iteratio...
what do you mean by this?
jaunty pasture
 desert oar
don't use n_jobs=-1 inside each parallel job
you can only have so many processes before you make things slower
also keep in mind that the random forest implementation might itself be multi-threaded
jaunty pasture
@desert oar yes, I am fitting same model to different data data frames.
desert oar
and you might want to try the loky or multiprocessing backends
also this is a really wasteful way to fit 100-5000 trees
because you're re-fiting the first 100 trees when you try 110
jaunty pasture
desert oar
and you might want to try the loky or multiprocessing backends
okay
desert oar
use warm_start=True
scikit-learn
The goal of ensemble methods is to combine the predictions of several base estimators built with a given learning algorithm in order to improve generalizability / robustness over a single estimator...
however this probably requires you to write your own loop over ParameterSampler instead of using RandomizedSearchCV

scikit-learn
a bit clunkier, i admit
jaunty pasture
thank you i will try with the locky or multiprocessing
desert oar
also consider using logspace for crossing orders of magnitude and not linspace
this seems like you're trying way too many combinations of parameters
if you need to do this on a regular basis and/or quickly, you might want to try heuristically narrowing down the parameter space as you increase the number of trees
consider HalvingRandomSearch with resource='n_estimators'
scikit-learn
Examples using sklearn.model_selection.HalvingRandomSearchCV: Release Highlights for scikit-learn 0.24 Release Highlights for scikit-learn 0.24, Successive Halving Iterations Successive Halving Ite...
desert oar
@jaunty pasture here's my (untested) rewrite of your code, demonstrating the ParameterSampler usage https://paste.pythondiscord.com/uwocodigey.py
it's just a bit of extra looping
(and i attempted to clean up the code in general)
jaunty pasture
desert oar
<@!763666918744915968> here's my (untested) rewrite of your code, demonstrating ...
TypeError                                 Traceback (most recent call last)
/tmp/ipykernel_2083168/2556996831.py in <module>
      1 results = Parallel(n_jobs=10)(
----> 2     delayed(fit_model)(i, df, random_state) for i, df in enumerate(class3_df)
      3 )

TypeError: 'ellipsis' object is not iterable
that's what you get for copying and pasting 😉
i didn't write the whole code of course... you can see i left ... in some places
it was just for illustration
jaunty pasture
okay
let me check
I forgot to change the data frames list
@desert oar ```py
_RemoteTraceback Traceback (most recent call last)
_RemoteTraceback:
"""
Traceback (most recent call last):
File "/illukas/home/rkalak/.local/lib/python3.8/site-packages/joblib/externals/loky/process_executor.py", line 431, in _process_worker
r = call_item()
TypeError: init() missing 1 required positional argument: 'n_iter'
i probably made other mistakes too
like i said, just for demonstration
also there might be some other specific requirements around the multiprocessing backend that i can't remember
i also think you should try halving random search, i've had very good experiences with it - much faster convergence than bayesian search or undirected random search
grave frost
serene scaffold
<@456226577798135808> generally, data science > ai > machine learning > deep lea...
its more like
AI --> [Machine learning, Deep Learning] --> Data science --> data engineering
IMO
serene scaffold
grave frost
its more like
AI --> [Machine learning, Deep Learning] --> Data science --> dat...
I don't agree with this, but if you give each one a formal definition, I'm not sure that you can definitively say which are complete encapsulated in another.
royal crest
job titles are not the best description of what you actually do in your job. I've a mate with a "data scientist" title who just works with Excel
sure there may be different expectations but that doesn't mean you actually do what you think you'll do as a said <insert job title>
also i am very surprised to only see this library mentioned twice but i highly recommend it for an almost exhaustive list of stats functions
!pypi pingouin
arctic wedgeBOT

Pingouin: statistical package for Python
prisma mulch
prisma mulch
```
ValueError Traceback (most recent call last...
Can I bump now?
royal crest
you effectively did it already
prisma mulch
royal crest
you effectively did it already
I know that 😂
prisma mulch
is a 98.5% accuracy on mnist satisfactory?
prisma mulch
tender hearth
state of the art is 99.87
welp, good thing I am not doing state of the art
prisma mulch
tender hearth
as long as you didn't overfit that's good
yeah, about that
I set the batch size 500 and 12 epochs. It did well but gave 97.8% accuracy. at 100 bachsize and 12 epochs, the accuracy went down to 95.8, cuz it was overfitting. I set the batch size to 300, and it went up to 98.6. But during the 10th-11th epoch, the val_accuracy was actually higher

Should I add early stopping?
@tender hearth
wise pelican
I'm doing a personal project where I've already generated the data, but now I'm trying to properly rank all the different things in it
I have multiple items that I got 4 arrays of data called A, B, C, and D.
I'm then getting the mean, median, 1% lows, 99th percentile, 0.1% lows, 0.01% lows, and the standard deviation for a total of 28 metrics per item that I'm testing
For each item, I rank the metrics in terms of what has the highest value (except for the standard deviation metric, which the highest rank goes to whatever has the lowest value)
I then have an overall rank which is just the sum of all the metric's ranks for a given item, and whichever item has the lowest overall rank is the best.
Are there other metrics I should be trying to get and rank for each item I'm testing? I'm doing this all programmatically with numpy and pandas and there are a bunch of functions I'm not really familiar with / not sure if they are even important to rank
prisma mulch
how is 81% on CIFAR-10?
arctic wedgeBOT
:incoming_envelope: :ok_hand: applied mute to @toxic scaffold until <t:1633676570:f> (9 minutes and 59 seconds) (reason: duplicates rule: sent 4 duplicated messages in 10s).
prisma mulch

Tinker with a real neural network right here in your browser.
prisma mulch
Hey I found something interesting:
If you run this on colab, it will create an ngrok tunnel to the colab instance and spit out a url
!pip install jupyterlab==2.2.9 pyngrok -q

# Run jupyterlab in background
!nohup jupyter lab --ip=0.0.0.0 &

# Make jupyterlab accessible via ngrok
from pyngrok import ngrok
print(ngrok.connect(8888))
And if you add this to vscode's notebook interface, you can connect directly to colab through your vscode. I tried it and it worked fine.
viral pier
thought I'd post this here for who's worried that in WSL2 runs slower than on Windows itself

 rigid ledge
hello guys, hope y'all are well.
anyone of you have encountered this error using transformers (version: 4.11.3) package: 'BertTokenizer' object has no attribute 'tokens_trie' ?
the error raised when predicting a text block using a trained bert model model_bert.predict([txt])
lapis sequoia
Hello people! I am getting lil messed up with generating the string of the path for the below folder structure.

I want to fetch train.txt.npy and test.txt.npy for every year's folder and create the string as below:
train = 'D:\Years\1987\train.txt.npy '
test= "D:\Years\1987\test.txt.npy"
data_train = np.load(r"train ")
data_val = np.load(r'test')
Can someone please help me with this?
rigid ledge
you should loop over the years dirs
years_path = r'D:\Years\'
for year in os.listdir(years_path):
    train = os.path.join(years_path,year,'train.txt.npy')
    test = os.path.join(years_path,year,'test.txt.npy')
    data_train = np.load(train)
    data_val = np.load(val)
@lapis sequoia
don't forget to import os
 solar oar
@keen fable YOU HAVE TO DO THE SENIOR MATHS CHALLENGE
lapis sequoia
rigid ledge
you should loop over the years dirs
```
years_path = r'D:\Years\'
for year in os...
OMG!!! you made my so easy today!! thanks so much yo!! tried and tested, it worked smooth as butter. 😄
Thanks a ton again @rigid ledge
rigid ledge
lapis sequoia
OMG!!! you made my so easy today!! thanks so much yo!! tried and tested, it work...
glad to help 😄
lapis sequoia
Have a nice day mate!
rigid ledge
you too
lone drum
Hello I have pandas series
Init_close =   0    160.6
End_close = 0     162.85```
How I can subtract this and save output in another variableI want to subtract
End_close - init_close this way
Ping me when replying
serene scaffold
lone drum
Hello I have pandas series
```python
Init_close = 0 160.6
End_close = 0 ...
I can't tell what this means. Can you call print on the series?
desert oar
wise pelican
I'm doing a personal project where I've already generated the data, but now I'm ...
I usually like to see 25th and 75th percentiles
 sick wedge
I'm using K means clustering on some data, but the K Means takes 4 columns into account, how can I plot and visualise the results?
obviously 2D scatter graph won't work, so would I use a 4D graph?
I'm finding the whole dimension thing kind of difficult to grasp
basically I want to make a scatter plot graph based on these 4 columns, and have them coloured by what cluster they are a part of (4 clusters to be precise)
 viral pier
can DeepSpeed be used to train bigger models on smaller cards?
trying to train GPT NEO that usually required 20Gb VRAM, but I have a 1080ti which only has 11GB VRAM
 sharp beacon
can someone point me to some learning information that can teach me:
how i can use ML/statistics to develop a pattern/learn from 30 days worth of plots to predict what the next day would be
desert oar
sick wedge
I'm finding the whole dimension thing kind of difficult to grasp
You and everyone else 🙂 Two options: 1) use dimension reduction to 3 or 2 dimensions and plot that, 2) plot all pairs of dimensions in a grid
Dimension reduction includes: PCA, multidimensional scaling, UMAP
Once you do that you can color points by assigned cluster
You can also plot the distance matrix as a heatmap, i.e. a grid of colored rectangles
For which I highly recommend seriation - finding "interesting" orderings of the rows and columns of a matrix, especially a distance matrix
https://pypi.org/project/seriate/
http://www.atgc-montpellier.fr/permutmatrix/manual/SeriationCorps.htm
https://gmarti.gitlab.io/ml/2017/09/07/how-to-sort-distance-matrix.html
https://www.datanovia.com/en/blog/seriation-in-r-how-to-optimally-order-objects-in-a-data-matrice/
Following the Ecole Polytechnique - Data Science Summer School where I got several times questions about how I produced the sorted correlation matrices displ...

This article describes seriation methods, which consists of finding a suitable linear order for a set of objects in data using loss or merit functions. There are different seriation algorithms. The input data can be either a dissimilarity matrix or a standard data matrix. You will learn how to perform seriation in R and visualize […]
sick wedge
Thanks !
 prime hearth
hello, would like to please ask for naive bayesm algorithm, does theta from ML estimator respresnt X if. we were to plot it?
or how to plot theta?
where theta = P(x|y)
not sure if it just theta * x inputs
or in form theta x + b etc
desert oar
naive bayes doesn't specify a specific functional form. however for continuous features you usually need to make a distributional assumption, e.g. that the feature is gaussian conditional on the class. it helps to write out the definition of naive bayes.
p(Class = k | X_1 = x_1 , ... , X_J =  x_J ) ∝
  p(Class = k) × ∏_j=1..J p( X_j = x_j | Class = k)
oh ok thanks
desert oar
@prime hearth if you do have categorical features and you assume a multinomial model, then you can re-express the probabilities as a linear model
In statistics, naive Bayes classifiers are a family of simple "probabilistic classifiers" based on applying Bayes' theorem with strong (naïve) independence assumptions between the features (see Bayes classifier). They are among the simplest Bayesian network models, but coupled with kernel density estimation, they can achieve higher accuracy leve...
that's probably the most common case, but it's also one specific case
prime hearth
thanks! What i have is binary classification and no catergorical featues
serene scaffold
What's the difference between cupy and pytorch/tensorflow?
other than the latter two having explicit deep learning support. But in terms of what you can do with cupy arrays vs tensors.
viral pier
@serene scaffold cupy is basically numpy, just uses CUDA under the hud
basically when you talk about cupy, you're basically talking about numpy
serene scaffold
viral pier
<@!253696366952316929> cupy is basically numpy, just uses CUDA under the hud
right, but what can you do with a cupy array that you can't do with a tensor?
viral pier
@serene scaffold tbh have no idea haha 😄 Is there anything numpy can do better or is more readable than tensorflow?
hey guys any recommendation on a Discord server about ML?
serene scaffold
 elfin merlin
What is the best way for free sql database hosting
I am going to try to host a sql database on my local machine for my ML project but I dont know what the good options are
 vocal basin
Hey guys, quick one:
I downloaded the Iris dataset off kaggle. Turns out there no null values. A simple random forest scored 1.0 without any preprocessing of data etc. No tuning either. No CV done.
Why is that?
grave frost
serene scaffold
I don't agree with this, but if you give each one a formal definition, I'm not s...
that's the accepted convention; no?
modest timber
columns = {'18:30', '13:30', '20:30', '18:00', '19:30', '16:30', '14:30', '17:30', '15:30'}
how could I add this columns to df = pd.Dataframe()
 edgy brook
Hey guys, im using matplotlib rn and is there a way to set the second legend so that instead of taking all that space, it is split into 2 rows?

 rain temple
I am trying to make a terrain classification using a Convolutional Neural Net, but just cant seem to find a good dataset to do this. Does anyone know a large dataset of urban terrain images, or a large dataset containing urban terrain images that I could use to tackle this project?
 tidal bough
edgy brook
Hey guys, im using matplotlib rn and is there a way to set the second legend so ...
tidal bough
edgy brook
Hey guys, im using matplotlib rn and is there a way to set the second legend so ...
While this isn't quite what you are asking, maybe you can just put a \n into that string to split it manually?
wise pelican
desert oar
I usually like to see 25th and 75th percentiles
Do these other metrics not really matter so much?
Unbiased Variance (pandas.DataFrame.var)
Standard Error of Mean (pandas.DataFrame.sem)
Mean Absolute Deviation (pandas.DataFrame.mad)
Percent Change between data points (pandas.DataFrame.pct_change)
Kurtosis (pandas.DataFrame.kurt)
Exponential Weighted X (older values are less important as newer data is introduced) (pandas.DataFrame.ewm)
EW Mean
EW Median
EW Standard Deviation
EW Correlation
EW Covariance
desert oar
wise pelican
Do these other metrics not really matter so much?
Unbiased Variance (`pandas.Dat...
- Unbiased Variance - don't need it, standard deviation (its square root) is better
- Standard Error of Mean - don't need it
- Mean Absolute Deviation - good, use it
- Percent Change between data points - not applicable, not a single summary statistic
- Kurtosis - meh, not that useful, only include it if you know what it means and can explain it
- Exponential Weighted X - not applicable, this is for time series
jade acorn
i am studying datascience and ive wondered how solving a system of linear equations is important in the field on ML, i know that data is represented as matrices but why would i need to know Matrix factorization algorithms etc etc?
 iron basalt
jade acorn
i am studying datascience and ive wondered how solving a system of linear equati...
iron basalt
jade acorn
i am studying datascience and ive wondered how solving a system of linear equati...
Finding the matrix inverse is very useful (solving a system of linear equations). Often it's too hard to find the exact solution, so one finds the pseudoinverse (such as finding the line of "best fit" (least squares)). The pseudoinverse can be computed with singular value decomposition (a matrix factorization). In general (not just matrices, abstractly in all of math), factorization can help break a problem up into separate parts that you know how to deal with. A simple example is multiplying say 23 and 26 in your head. You can break up the problem by factoring it into easier to multiply numbers 23 * 26 = (20 + 3) * (20 * 6) = 400 + 120 + 60 + 18 = 520 + 78 = 598.
desert oar
I'd say that more generally, it's very natural to represent tabular as a matrix
And a lot of things in statistics turn out to have elegant representations in linear-algebraic terms
iron basalt
Bonus mental math tip, squaring numbers: 17^2 = 10 * 24 + 7 * 7 = 240 + 49 = 289 (Did you catch what I did?).
jade acorn
iron basalt
Bonus mental math tip, squaring numbers: `17^2 = 10 * 24 + 7 * 7 = 240 + 49 = 28...
no
iron basalt
(17 - 7) and (17 + 7)
(I leave the algebra of showing how I got that form to the reader as an exercise)
jade acorn
iron basalt
Finding the matrix inverse is very useful (solving a system of linear equations)...
isnt this mostly used for PCA
iron basalt
jade acorn
isnt this mostly used for PCA
Probably most know it from PCA, or where introduced to it there.
(Or in a linear algebra class, but no context for its uses)
The example (not the squaring one) I gave about factorization is somewhat tangential to factorization, but get's the idea across of how important the concept is (realizing the (a + b) form of a number which shows up in stuff like (a+b)^2 = aa + 2ab + bb, if you were given the right side of that equation for something more complex, you might not know how to solve anything, but if you convert it to the left side (factor it), it becomes obvious). Factoring specifically means rewriting it in terms of a product of several factors, which I did not do in the example, I split each into a summation of parts, but realizing that it gives me a form of (a + b) * (c + d), which is a factorization of the end solution that is easier to un-factorize in my head. In ML your problem will be the other way around, finding the factorization from the end result (sort of undoing the end result which is being observed into its parts (which assumes there are some patterns in the data)) (starting with the right side of the previously mentioned equation, which looks complex at first glance).
 worldly lake
hello again, anyone know,
can i convert dateframe to csv where enum goes to [] list brackets?
then some strange error comes out when I try to read this df.


I need to list the names of the photos separated by commas, and .join does not quite work for me. full code:
code is here: https://pastebin.com/wBXSYMSC.
thanks u
 main fox
Has anyone else found scikits chi2 odd when compared to scipy chi2 contingency? I've performed a chi square test of independence using no libraries and the output matches the calculations done by SciPy chi2 contigency. Sklearn's selectKBest using chi2 is returning different scores.
This person seems to have made the same observation
desert oar
main fox
Has anyone else found scikits chi2 odd when compared to scipy chi2 contingency? ...
The email thread suggests that the two versions use two different models underlying the chi2 test
main fox
desert oar
The email thread suggests that the two versions use two different models underly...
From what I understood, scikit performs a sum over the array such that it doesn't consider 0 as an event, rather the absence of an event?
If that's the case, would I be better off using SciPy for feature selection when performing a Chi2 test?
Almost every chi2 test for feature selection tutorial I've followed seems to be unaware of the difference between the two. Had they performed the calculations to try and understand the math behind what they were doing, they would have noticed the difference.
main fox
desert oar
Let me take a look at the implementations
Thank you
 river zephyr
Hey, would this be the correct channel to ask about MatPlotLib?
wise pelican
Yep, as per the channel description at the top
river zephyr
Oh Duh. Lol
Ok. So I have a graph I'm trying to create but it has a few... odd rules
So the dates need to be continuous, but if there's a break in the data where a day isn't recorded, then the plotted line should break there.
I was thinking of using bendichter/brokenaxes but that's not exactly what I want
the axes should remain continuous
But the actual plot line should break
The dates are on the x axis and a "score" is on the y axis. When there are two or more days in a row where a score is gathered, the line should continue, but on days where there isn't a score, the line should stop at the last point before the break and start again with the next point after that break
 thorn bobcat
has anyone here used both tacotron 2 and talknet? I'm just wondering which is the better model to use for converting my ebooks to audio-books.
 fickle bolt
I have 15 images and I want to make a dataset out of them using data augmentation so I'm using ImageDataGenerator from Keras. But when i try using it, it says "Invalid shape (1, 256, 256, 3) for image data". Why is this happening and how can I fix it?
royal crest
lone drum
Hello I have value
```
09:15:00+05:30```
How I can get
```
09:15:00
``` this ...
https://pandas.pydata.org/docs/reference/api/pandas.to_datetime.html
in the documentation for to_datetime(), there's a format option
which follows strftime format
which is here
lapis sequoia
what can i do with AI?
 timid rivet
lapis sequoia
what can i do with AI?
timid rivet
lapis sequoia
what can i do with AI?
automation, face and speech detection, cyber security and robotics
lapis sequoia
what is AI actually?
timid rivet
lapis sequoia
what is AI actually?
its an abbreviation for artificial intelligence
like, artificial brains
artificial neurons
like the ones in the human brain
lapis sequoia
so its actually can think like human?
timid rivet
timid rivet
artificial neurons
they're called artificial neural networks
timid rivet
lapis sequoia
so its actually can think like human?
yup
and maybe even more intelligent than humans
lapis sequoia
so then robot can make robot?
timid rivet
maybe
lapis sequoia
i have to get ready for the end of the world
timid rivet
elon musk says that AI is more dangerous than nukes
 idle venture
timid rivet
idle venture
timid rivet
hopefully that doesnt happen
and we find a way to make AI safe
and in a way that it can be controlled
and doesnt destroy the human race
lapis sequoia
hopefully i don't have kids
 velvet thorn
lapis sequoia
so then robot can make robot?
velvet thorn
lapis sequoia
so then robot can make robot?
this is sometimes termed a technological singularity
@ the moment we're (apparently) nowhere near
timid rivet
velvet thorn
this is sometimes termed a technological singularity
the singularity is a theory about AI wiping out humans
timid rivet
velvet thorn
@ the moment we're (apparently) nowhere near
true
velvet thorn
lapis sequoia
so its actually can think like human?
specific networks can solve specific problems at (or sometimes above) the level of a human being
timid rivet
velvet thorn
specific networks can solve specific problems at (or sometimes above) the level ...
well a robot did beat the world's chess champion
i think its IBM's robot
not sure
velvet thorn
timid rivet
well a robot did beat the world's chess champion
which is why I said "specific problems"
timid rivet
but a robot called deep blue beat a chess champion
velvet thorn
which is a specific problem...?
timid rivet
yea
velvet thorn
there's nothing approaching general intelligence
timid rivet
lapis sequoia
Hello, someone expert in NLP VAE, could explain how they are using the word embeddings in this repo. Getting hell confused what are they passing where are they passing and things like that. I tried debugging line by line. still couldnt trace it. If someone would help me, it would really help me.
GitHub
PyTorch implementation of AVITM (Autoencoding Variational Inference For Topic Models) - pt-avitm/nypl_menus.py at master · vlukiyanov/pt-avitm
in the file nypl_menus.py file, autoencoder = ProdLDA(
in_dimension=len(vocab), hidden1_dimension=100, hidden2_dimension=100, topics=50
)
which directs to the definition, which is in VAE.py.
They are not passing the word embeddings at all?
or how are they passing the word embeddings?
 shut hound
class Net(nn.Module):
  def __init__(self, num_classes):
    super().__init__()
    self.l1 = nn.Linear(4, 14, bias=False)
    self.l2 = nn.Linear(14, 14, bias=False)
    self.l3 = nn.Linear(14, num_classes, bias=False)

  def forward(self, x):
    x = F.relu(self.l1(x))
    x = F.relu(self.l2(x))
    x = F.relu(self.l3(x))

    return x
It is ok to do my forward like this, with only relus?
I am using nn.MSELoss() as loss function
 pale mural
I unfortunately have very little knowledge of mv calc, and I'm getting stuck really quick here.
When I have b as a constant, and I'm just trying to optimize the slope, it's very easy because I know the residual plot is going to be a parabola, and I can just run a simple system of equasions.
### RESIDUAL PLOT WITH DIFFERENT LINES ###
b = yint
errors = []
slopes = []
for i in range(-100, 100, 5):
  m = i
  res = calc_residuals(m, b)
  error = sum([r**2 for r in res])
  errors.append(error)
  slopes.append(m)

slopes = np.array(slopes)
errors = np.array(errors)

# y = ax^2 + bx + c
points = [0, 1, 2]
rows = []
for point in points:
  x = slopes[point]
  a = x ** 2
  b = x
  c = 1
  rows.append([a, b, c])

# Ax = B
A = np.array(rows)
B = np.array([errors[point] for point in points])
X = np.linalg.inv(A).dot(B)
a, b, c = X

x = slopes
plt.plot(slopes, errors, 'o')
plt.plot(x, a*x**2 + b*x + c)
plt.show()
However, trying to optimize both the y-int and slope is a different story. I'm not really sure what plot I even get (I think its a parabolic cylinder but I'm not sure?). How can I get the equation of this 3d residual plot?
### RESIDUAL PLOT WITH DIFFERENT LINES ###

errors = []
slopes = []
ints = []
for i in range(-100, 100, 5):
  for j in range(-1000, 1000, 50):
    m = i
    b = j
    res = calc_residuals(m, b)
    error = sum([r**2 for r in res])
    errors.append(error)
    slopes.append(m)
    ints.append(b)


slopes = np.array(slopes)
ints = np.array(ints)
errors = np.array(errors)

fig = plt.figure()
ax = plt.axes(projection='3d')
ax.scatter3D(slopes, ints, errors)

fig = plt.figure()
ax = plt.axes(projection='3d')
ax.scatter3D(ints, slopes, errors)
visualizations of the two if it helps

 wide meadow
Which should be learnt first, Pytorch or Tensorflow?
 round glade
wide meadow
Which should be learnt first, Pytorch or Tensorflow?
round glade
wide meadow
Which should be learnt first, Pytorch or Tensorflow?
I recommend learn pytorch first
jade acorn
"Interpolation is not often something that’s useful in machine learning, but rather something that we often use AI for. Feeding data to a computer and allowing it to make educated guesses for us, especially when it comes to millions of lines of data, is helpful in many different fields. "
Why is it not useful for machine learning? And i suppose by AI they mean neural networks, so why is interpolation good for NN?
wide meadow
round glade
I recommend learn pytorch first
Thank you!
 sweet cobalt
What’s the best RNN structure for sentiment analysis
rigid zodiac
sweet cobalt
What’s the best RNN structure for sentiment analysis
I want to know about it too thank you for asking this question
serene scaffold
sweet cobalt
What’s the best RNN structure for sentiment analysis
What are you trying to determine the sentiment of?
worldly lake
Hello, anyone know how solve this?:
df_temp = [{'sku': 45051, 'photos': ['4514212.jpg', '2929138.jpg', '2929149.jpg', '2929157.jpg', '2217647.jpg', '6089863.jpg', '6089862.jpg', '4509474.jpg']}]
photos_DF = pd.DataFrame(df_temp).set_index('sku')

csvConvert = pd.read_json(photos_DF)  # reading then converting
csvConvert.to_csv('test.csv', encoding='utf-8', index=None)

 eager imp
timid rivet
yup
eager imp
timid rivet
yup
no, no, and no! a brain does NOT operate like a computer and an AI does NOT think like a human
that notion is completely off for several reasons
you can think of a human brain operating on three different levels - architectural (-> neuro surgeons), chemical/biological (-> psychiatrists) and experience (psychologists)
a human brain is much more like soup rather than a well-defined, clean hardware
there are electrical impulses, but that's where the similarities end, pretty much
you can't scan a brain's architecture and hope to get anything remotely resembling as human thought - the blue brain project might be interesting for science to see how far you can go and maybe to inspire artificial neural network architectures, but without the chemistry you won't get an AI that thinks like a human - and that is totally fine!
there's absolutely no reason why we would want AIs to think like humans beside vanity
 warm gyro
Hey everyone this is probably a less than detailed question but I am curious if I can find some direction here. I have a list of equipment users have been able to add to for a long time. This has led to multiple items of the same things such as "Laptop with Windows 10" or "windows 10 laptop" Is there some NLP or something I can look into to help consolidate and clean up this list?
eager imp
warm gyro
Hey everyone this is probably a less than detailed question but I am curious if ...
that sounds like a simple case of normalization and pattern matching.. maybe you could use NLTK for tokenization
you'd tokenize each item, normalize it (word roots maybe) then have a dict with terms and match it against those tokens
warm gyro
I will look into that thank you for the quick response
eager imp
sure!
desert oar
shut hound
It is ok to do my forward like this, with only relus?
As far as I know that's standard right? linear with relu activations
desert oar
worldly lake
Hello, anyone know how solve this?:
```
df_temp = [{'sku': 45051, 'photos': ['45...
The fact that it's type method suggests you forgot to write () on some method call
worldly lake
It turns out I forgot to convert the test case back to Json. decided everything. thank you.
desert oar
@Twiibz#3306 hm... the difference does seem to be in how the "expected" distribution is constructed
@main fox
I admittedly don't quite understand the scipy version
arctic wedgeBOT
scipy/stats/contingency.py line 128
expected = reduce(np.multiply, margsums) / observed.sum() ** (d - 1)```
`sklearn/feature_selection/_univariate_selection.py` line 225
```py
expected = np.dot(class_prob.T, feature_count)```margsums is [crosstab.sum(axis=0), crosstab.sum(axis=1)]
Now that I think about it, those don't seem all that different
I think I need to write this out on paper
grave frost
timid rivet
the singularity is a theory about AI wiping out humans
that's not the core promise of the singularity
grave frost
eager imp
a human brain is much more like soup rather than a well-defined, clean hardware
nope
grave frost
eager imp
there's absolutely no reason why we would *want* AIs to think like humans beside...
accelerating science and making humanity obsolete sounds pretty great goals to me
eager imp
grave frost
nope
there's no contradiction there
grave frost
eager imp
you can't scan a brain's architecture and hope to get anything remotely resembli...
that's probably the closest you got; the brain's chemical processes are vital for life maintenance of its core parts but has nothing to do with intelligence
eager imp
actually, it has
grave frost
citation please?
eager imp
search on ncbi, there's enough studies on that subject
grave frost
the chad researcher
"I don't know, just look it up"
eager imp
i do know, i'm just too lazy
human memory is build on protein biosynthesis, which is tightly connected to gene transcription, which by itself is controlled by intercellular chemical communication
and memory is connected to intelligence - there are dozens of studies how brain chemistry affects intelligence, decision-making and behaviour
all the effects of psycho-pharmaceuticals are based on that fact
grave frost
unfortunately, you are looking through a biological perspective rather than a neuroscientific one - and there lies the divergence
eager imp
they are tightly connected
i'm working with people in the field of electro-physiology, researching BMI etc
well, it doesn't mean that AI couldn't become an existential threat to humanity, on the contrary - there's no reason to believe that we couldn't build a machine that can replicate and improve itself and could regard humans as threat to self-preservation, but there's no need for human thought anywhere in there
if we build a computer virus that seeks out medical equipment due to some adaptive algorithm and it kills patients in the process it would be much the same
and i don't doubt human's ability to weaponize anything
grave frost
As of currently published works, chemicals are simply there to aid in the (again) operation of core life-maintaining functions of the cortical columns in the neocortex as well as being used as a neurotransmitter. Their impact on actually helping and pruning the hierarchies has been negligent - or not proved yet atleast [1]
psycho-pharma stuff may impact the functioning of some parts of your brain but they do not affect the management of new reference frames [2] in your brain structure nor do they directly impact the development of our memory function
[3] such externally provided chemicals only alter the function if they interfere in the development stage. since no chemical has yet been discovered that changes the biochemistry of the brain fundamentally, safe to assume their minimal role of in the brain.
Now Mountcastle's theory is still a theory, so no hard evidence has been there to determine the major impactful factor relating to the fundamental replication stage apart from the DNA - unless you have some citation that unambiguously proves it
i'm working with people in the field of electro-physiology, researching BMI etc
BMI is absolutely irrelevant to the source, functioning and origin of higher forms of intelligence
So Far your arguments have been lacklustre and outdated - though you are welcome to challenge them and have a constructive debate in the process 🤗
[1] = https://link.springer.com/chapter/10.1007/978-3-319-30070-2_11
[2] = https://www.frontiersin.org/articles/10.3389/fncir.2018.00121/full
[3] = https://www.annualreviews.org/doi/10.1146/annurev-publhealth-031912-114413

SpringerLink
According to the fail fast principle in Chap. 4, we need to learn from systems’ abnormal behavior and downright failures to achieve anti-fragility to classes of negative events. The earlier we can...

How the neocortex works is a mystery. In this paper we propose a novel framework for understanding its function. Grid cells are neurons in the entorhinal cortex that represent the location of an animal in its environment. Recent evidence suggests that grid cell-like neurons may also be present in the neocortex. We propose that grid cells exist t...
 agile cobalt
eager imp
if we build a computer virus that seeks out medical equipment due to some adapti...
agile cobalt
eager imp
if we build a computer virus that seeks out medical equipment due to some adapti...
sorry, how did whatever happened here escalate to that?
 crimson siren
agile cobalt
sorry, how did whatever happened here escalate to that?
crimson siren
agile cobalt
sorry, how did whatever happened here escalate to that?
lol
grave frost
agile cobalt
sorry, how did whatever happened here escalate to that?
lol waiting for that clarification too
eager imp
agile cobalt
sorry, how did whatever happened here escalate to that?
heh, i might've skipped a thought step there or two. let's say someone wants to build the "ultimate cryptotrojan" which seeks out potential targets on its own, has the ability to learn and counteract previous attempts at stopping it
it would learn over time that humans pay more money if the target involves especially vulnerable people - patients, children, elderly etc
so you don't need to program it to be especially malicious, it would simply learn while trying to optimize towards the goal "get me as much money as you can, by any means necessary"
 mystic sparrow
eager imp
heh, i might've skipped a thought step there or two. let's say someone wants to ...
mystic sparrow
eager imp
heh, i might've skipped a thought step there or two. let's say someone wants to ...
I'm hoping humans will be responsible with their advanced AI, but if history serves as a guide, they probably won't be. 😉
grave frost
eager imp
so you don't need to program it to be especially malicious, it would simply lear...
yes, that's called the problem of alignment. Nick Bostrom has quite some good resources on it https://intelligence.org/stanford-talk/

What is it?: A talk by Eliezer Yudkowsky given at Stanford University on May 5, 2016 for the Symbolic Systems Distinguished Speaker series. Talk: Full video. Transcript: Full (including Q&A), partial (including select slides). Slides without transitions: High-quality, low-quality. Slides with transitions: High-quality, low-quality. Abstract: I...
mystic sparrow
A rogue intelligence connected to autonomous weapons systems and swarms of drones could be a huge threat to humankind.
eager imp
over time it might even figure out that having more computational resources is beneficial to achieve the goal, so it would try to hack into supercomputers and maybe get to military equipment in order to extort whole countries
grave frost
the point is we are atleast a decade from AGI by optimistic standards, so this stuff doesn't matter. bringing up nukes won't do you any favours
eager imp
i don't think AGI is actually necessary to do any of that
grave frost
its not yes, I agree. my SVM just cracked NSA's securities - gotta see what the Govvy guys have been doing 🤤
eager imp
a machine doesn't need the ability to reason about itself and the world in order to take down governments
grave frost
I think that I should have used linear regression though 🤔 because the Goverment so dumb that they put all their security in a line, and my state of the art 50 line model can draw a perpendicular to it, bypassing securities
Keyboard clacking noises I'm in 💪
eager imp
grave frost
As of currently published works, chemicals are simply there to aid in the (again...
have fun with over 45147 hits
there are many chemicals that affect brain chemistry and thinking processes very directly
coffein, for example - otherwise programmers wouldn't consume it to that extend
grave frost
eager imp
https://www.ncbi.nlm.nih.gov/pmc/?term=how%20alcohol%20affects%20brain%20chemist...
www.google.com
have fun with over a trillion hits! 🤗
www.google.com is the only citation you need - Awesome_Ruler et al.
eager imp
🥱
 azure beacon
This might be a simple question, but I'm having trouble figuring out how to do something in Pandas. Basically, I have a dataframe and there are certain conditions that indicate a success, which I check by using loc to compare the columns row-wise
As of right now, I grow the dataframe by one column and put the success/failure results in there, but I know that that's really bad since these tables are large
But I'm not sure how to fix it
 umbral skiff
I need to add a dataframe's values to the end of the last row of records in my Google spreadsheet, but I can't. Each time I use the code below, it subscribes to the above information.
I'm using a gspread library to update the data in the Google Sheets spreadsheet.
sheet.update([df_data.columns.values.tolist()] + df_data.values.tolist())
I want to add new data after the last filled line.
 desert oar
azure beacon
As of right now, I grow the dataframe by one column and put the success/failure ...
desert oar
azure beacon
As of right now, I grow the dataframe by one column and put the success/failure ...
That doesn't seem bad, adding columns is cheap and usually the column-vectorized computation is the bottleneck, not the looping in Python or the data frame insertion
Growing by row is bad
azure beacon
desert oar
Growing by *row* is bad
Ohhhhh okay that makes sense
desert oar
Ty, i will look into this more during the week.
azure beacon
I only grow it by one column, but I wanted to make sure there wasn't a more efficient way I should be doing things
Thanks!!
desert oar
azure beacon
I only grow it by one column, but I wanted to make sure there wasn't a more effi...
There might be, e.g. with .apply
Depends on the specifics
 charred umbra
Is using unsupervised learning to classify images like in my paper a viable approach or nah?
Ive found some sucess with both but idk which is better
 summer mural
asked a tensorflow question in #help-cherries
 ember remnant
Hey guys,
In used car prediction using Machine Learning problem, can we extract the final result table (real price and predicted price) to an excel sheet? It was solved in Python3
main fox
ember remnant
Hey guys,
In used car prediction using Machine Learning problem, can we extract ...
df.to_excel()
I'm assuming you're using pandas
desert oar
charred umbra
Is using unsupervised learning to classify images like in my paper a viable appr...
It looks like you used unsupervised feature extraction? Sure, why not
 tough bolt
Heyo - could somebody help me understand a few things?
So I have 10 labels and 10 nodes.
Goal is to classify, which label belongs to which node
Problem:
 Confusion matrix:
 [[  176   126    75   242   154   226     5   135   238   239]
 [    0     0     0     0     0     0     0     0     0     0]
 [    0     0     0     0     0     0     0     0     0     0]
 [24292 24354 24390 24229 24314 24242 24479 24341 24229 24226]
 [    0     0     0     0     0     0     0     0     0     0]
 [    0     0     0     0     0     0     0     0     0     0]
 [    0     0     0     0     0     0     0     0     0     0]
 [    0     0     0     0     0     0     0     0     0     0]
 [   20     8    23    17    20    20     4    12    21    23]
 [    0     0     0     0     0     0     0     0     0     0]]
my confusion matrix always end up looking somewhat like this
which seems terribly wrong

something is fundamentally wrong
velvet thorn
it always irritates me how
confusion matrices
don't show which axis is actual
and which is predicted
tough bolt
(loss curve, precision caps at 0.1)
velvet thorn
😔
velvet thorn
tough bolt
So I have 10 labels and 10 nodes.
Goal is to classify, which label belongs to ...
can you elaborate further
on your model
tough bolt
velvet thorn
don't show which axis is actual
oh yeah, using sklearn
but it doesn't really matter which axis is which as it still would be awfully wrong
velvet thorn
tough bolt
oh yeah, using sklearn
I believe sklearn's has horizontal actual and vertical predicted?
I don't remember
velvet thorn
tough bolt
but it doesn't really matter which axis is which as it still would be awfully wr...
what model
tough bolt
So - I am using pytorch geometric
hold on, let me get an example of what the data looks like
 tough bolt
velvet thorn
can you elaborate further
tough bolt
velvet thorn
can you elaborate further
there's another one

Data(x=[10, 2], edge_index=[2, 80], edge_attr=[2, 80], y=[10])
x= x and y positions
edge index = adjacency matrix that represents the graph
edge attr = distance between each node
y = labels
tough bolt
velvet thorn
what model
import torch
from torch.nn import Linear
import torch.nn.functional as F
from torch_geometric.nn import GCNConv

class MLP(torch.nn.Module):
    def __init__(self, dataset, hidden_channels):
        super(MLP, self).__init__()

        num_classes = dataset[0].y.size(-1)
        num_classes = 10

        torch.manual_seed(12345)
        self.conv1 = GCNConv(dataset.num_features, hidden_channels)
        self.conv2 = GCNConv(hidden_channels, num_classes)
        #self.classifier = Linear(5, num_classes)

    def forward(self, x, edge_attr, edge_index, batch_index):
        x = self.conv1(x, edge_index)
        x = x.relu()
        x = F.dropout(x, p=0.5, training=self.training)
        x = self.conv2(x, edge_index)
        #x = self.classifier(x)
        return x
Going of pytorch geometric's tutorials this is what I thought I'd use as a model
Thing is, I'm very new to this so I have no idea if any of what I'm doing makes sense 😅
basically I'm going of this google collab https://colab.research.google.com/drive/14OvFnAXggxB8vM4e8vSURUp1TaKnovzX#scrollTo=p3TAi69zI1bO but trying to adjust it for my needs
 tough bolt
velvet thorn
what model
tough bolt
velvet thorn
what model
Is there anything you could recommend me?
Like, I have no idea if it's my model, the data, or the training that's wrong. I don't know where to start debugging
desert oar
velvet thorn
it always irritates me how
I made a whole confusion matrix library to work with confusion matrices that removes the ambiguity... kind of forgot about it and never open sourced it. I'll have to get around to it
It was just a dataframe with labeled axes, but it had a big catalog of summary statistics derived from the confusion matrix and some matplotlib routines
Made things a lot easier to work with

 tough bolt
desert oar
I made a whole confusion matrix library to work with confusion matrices that rem...
tough bolt
desert oar
I made a whole confusion matrix library to work with confusion matrices that rem...
actually would be great ngl. those matrices are awful to interpret imo
i have no idea what I'm doing
 desert oar
tough bolt
doesn't train properly at all
desert oar
tough bolt
doesn't train properly at all
How many data points do you have? Each datapoint is a graph?
tough bolt
desert oar
How many data points do you have? Each datapoint is a graph?
yes - my dataset consist of 50.000 of those graphs I've shown above

I have a feeling the output of my model isn't correct.
But please tell me - how do I interpret those predictions the model makes?
        [ 4.2866e+00,  4.2625e+00, -6.0775e+00, -2.9181e-01,  3.7153e+00,
          4.5689e+00, -2.7646e+00, -7.9956e-01,  1.1256e+00, -6.1972e+00]
this is one line for example
I'm not sure if the model is actually predicting the label for each node
tough bolt
Thing is, I know something is wrong with the code
But I have no idea what it is
and it could be anything
I don't know where to start looking

yikes
accuracy caps at 0.16
For how many epochs should one train in general?
And after how many epochs is it usually clear that the training has concluded?
Optimizer shouldn't be the problem - Adam instead of Gradient Descent behaves very similar
serene scaffold
tough bolt
For how many epochs should one train in general?
for one project, I used between 4 and 40
tough bolt
serene scaffold
for one project, I used between 4 and 40
ah, thanks.
this clearly won't change anymore after 42 epochs
 serene scaffold
tough bolt
ah, thanks.
this clearly won't change anymore after 42 epochs
serene scaffold
tough bolt
ah, thanks.
this clearly won't change anymore after 42 epochs
looks to me like you could have stopped at like 7
desert oar
tough bolt
I'm not sure if the model is actually predicting the label for each node
How is the data structured? Or does the graph library you are using take care of it?
I would have expected each graph to be a matrix, row = node, column = class score
tough bolt
tough bolt
edge index = adjacency matrix that represents the graph
@desert oar this is what the data object looks like
So the adjacency matrix I pass in represents the connections
Thing is, I'm not actually sure if the way I construct my data is correct as there isn't a lot of info I could find online
Nearly every example uses a prebuilt dataset
It's the first time I'm doing anything like this so I really have no idea what I am doing
I feel like I lack the knowledge
But I also feel like it should be very possible to solve my problem with this technology
 merry leaf
hi all! new to this channel - i just finished a take home case study for a job interview, would love to discuss it more if possible and would appreciate any feedbacks or improvements!
serene scaffold
merry leaf
hi all! new to this channel - i just finished a take home case study for a job i...
You should probably say what it was about so that people can know if it would be of interest to them.
merry leaf
serene scaffold
You should probably say what it was about so that people can know if it would be...
Sure! Its regarding Data Science and AI, based around Quantitative Strategy. DM me if you would like to discuss further!
 pliant bone
merry leaf
Sure! Its regarding Data Science and AI, based around Quantitative Strategy. DM ...
pliant bone
merry leaf
Sure! Its regarding Data Science and AI, based around Quantitative Strategy. DM ...
so you are doing quant trading ?
merry leaf
pliant bone
so you are doing quant trading ?
not quite, the role ive applied for is Quantitative Strategy Consulting essentially for Government services
 granite flame
def build_model(hp):
    for i in range(hp.Int('num_layers', 2, 20)):
        input1 = Input(1, name='output_temp')
        input2 = Input(1, name='output_flow')
        input_layer = tf.keras.layers.concatenate([input1, input2], name='input_layer')
        x = input_layer
        xx = Dense(units=hp.Int('units' + str(i), min_value=2, max_value=512, step=4), activation="relu")(x)
        # x = Dropout(rate=0.5)(x)
        output1 = Dense(1, activation='linear', name='cold_temp')(xx)
        output2 = Dense(1, activation='linear', name='hot_temp')(xx)
        output3 = Dense(1, activation='linear', name='cold_flow')(xx)
        output4 = Dense(1, activation='linear', name='hot_flow')(xx)

        model = keras.Model(inputs=[input1,input2], outputs=[output1, output2, output3, output4])

        # hp_learning_rate = hp.Choice('learning_rate', values=[1e-2, 1e-3, 1e-4])

        optimizer = hp.Choice("optimizer", ['adam','rmsprop','sgd','nadam'])
        # loss = hp.Choice("loss", ['mse','mae'])


        model.compile(optimizer=optimizer,
                     loss={'cold_temp': mse, 'hot_temp': mse, 'cold_flow': mse, 'hot_flow': mse},
                     metrics='mse')

        print((model.summary()))
        plot_model(model, to_file='my_model.png', show_shapes=True)
        print(plot_model)

        return model


tuner = kt.Hyperband(build_model,
                     objective ="val_mse",
                     max_epochs=10,
                     factor=3,
                     hyperband_iterations=1,
                     directory='my_dir',
                     project_name='functional1')

print(type(X_train_scaled), type(Y_train), type(X_test_scaled), type(Y_test))
tuner.search(X_train_scaled, Y_train, epochs=5)
---------------------------------------------------------------------------
ValueError                                Traceback (most recent call last)
<ipython-input-61-1a32b056f5c4> in <module>()
     40
     41 print(type(X_train_scaled), type(Y_train), type(X_test_scaled), type(Y_test))
---> 42 tuner.search(X_train_scaled, Y_train, epochs=5)
ValueError: Layer model expects 2 input(s), but it received 1 input tensors. Inputs received: [<tf.Tensor 'IteratorGetNext:0' shape=(None, 2) dtype=float32>]
hi does anyone know what i have done wrong
 austere swift
granite flame
hi does anyone know what i have done wrong
austere swift
granite flame
hi does anyone know what i have done wrong
you have 2 inputs in your model but you only passed one input into it when training
granite flame
aha
the X_train_scaled consists the two inputs i wonder why it receives 1 input tensors
any process i can make it work?
@austere swift
austere swift
what do your inputs look like
it should be a list of arrays that look like [input1array, input2array]
granite flame
df = pb.read_csv('data3.csv')
training_data = df
# print(training_data.values[0:30])

# split into input (x) and output (y) variables #min max scaling
x1 = list(df[df.columns[5]])  # output temperature
x2 = list(df[df.columns[4]])  # output flow rate
inputs = list(zip(x1, x2))


y1 = list(df[df.columns[0]])  # Cold temperature
y2 = list(df[df.columns[1]])  # Hot temperature
y3 = list(df[df.columns[2]])  # Cold flow rate
y4 = list(df[df.columns[3]])  # Hot flow rate
outputs = list(zip(y1, y2, y3, y4))


X_train = np.array(inputs)
Y_train = np.array(outputs)

print('input array', X_train[0:5])

X_train_dim = X_train.shape[1]
Y_train_dim = Y_train.shape[1]

print('input shape:', inputs_dim)
print('output shape:', outputs_dim)

X_train, X_test, Y_train, Y_test = train_test_split(X_train, Y_train, test_size=0.2, random_state=0)

scaler = MinMaxScaler()
scaler.fit(X_train)

X_train_scaled = scaler.transform(X_train)
X_test_scaled = scaler.transform(X_test)
print('Normalization: \n', X_train_scaled[:5], '\n Test Normalisation \n', inputs_test_scaled[:5])
this is how i did it
austere swift
don't turn the list into an array, it'll then think it is 2 values that go into the same input
granite flame
oh
austere swift
you can just process the inputs separately then put x=[input1, input2] in your fit() call
granite flame
inputs = list(zip(x1, x2)) should i change this line as well
austere swift
remove that, preprocess x1 and x2 separately, then in your model.fit call pass x=[x1, x2]
or in your case it would be the tuner.search call since you're using keras tuner
granite flame
yup
sorry im kinda new ```py
x1 = list(df[df.columns[5]]) # output temperature
x2 = list(df[df.columns[4]]) # output flow rate
are u telling me to remove this?
austere swift
no leave that
austere swift
granite flame
inputs = list(zip(x1, x2)) should i change this line as well
remove this
granite flame
oh ok
austere swift
then do all your scaling and train test split stuff on x1 and x2 as separate arrays
after that just pass x=[x1, x2] into the tuner.search
granite flame
must i do the same steps for outputs as well
austere swift
yes
granite flame
okay ill try that and get back to you thanks !
austere swift
but anyways, why do you need to have multiple inputs and multiple outputs in this case?
you can just have an input with a size of 2 and an output with a size of 4
since your inputs are directly concatenated in the model, theres no branching or anything
granite flame
my two inputs have a non linear relationship
austere swift
that doesnt matter
granite flame
so your telling me to consider it as one layer with 2 neurons?
austere swift
you doing
input1 = Input(1, name='output_temp')
input2 = Input(1, name='output_flow')
input_layer = tf.keras.layers.concatenate([input1, input2], name='input_layer')
is pretty much the same thing as
input_layer = Input(2, name='input_layer')
input layers don't have neurons
that's just the direct input, theres no actual weights for them
granite flame
sorry i mean the number of inputs
austere swift
yes
one input with 2 values
and then you can just have
output = Dense(4, activation='linear', name='output')(xx)
okay i did that because they both have a non linear relationship thats why
austere swift
granite flame
okay i did that because they both have a non linear relationship thats why
neural networks are meant for things that have non-linear relationships
granite flame
austere swift
and then you can just have
```py
output = Dense(4, activation='linear', name='o...
i have four different outputs so this is ok?
austere swift
granite flame
i have four different outputs so this is ok?
yes
it'll just output [output1, output2, output3, output4]
granite flame
do you think i should use sequentional API or functional API
austere swift
in this case, sequential
functional is useful for if you want to have branching models
but in this case you don't need that
granite flame
because according to what i read for multiple input and output models with non linear relationship they suggested to use functional
actually my sequential keras tuner works
my functional keras tuner only had the issue
austere swift
so you could just do:
model = keras.Sequential([
    Input(2, name='input_layer'),
    Dense(units=hp.Int('units' + str(i), min_value=2, max_value=512, step=4), activation="relu"),
    Dense(4, activation='linear', name='output')
])
yup this is what i did
i thought it was wrong
austere swift
granite flame
because according to what i read for multiple input and output models with non l...
having multiple inputs and outputs like that would conceptually be the same thing as having one input layer with 2 and one output layer with 4
if you think about it, each dense layer with 1 neuron will be fully connected with the previous layer, but one dense layer with 4 neurons would also have all 4 neurons fully connected to the previous layer
so in the end it's the same
granite flame
oh okay i got confused hehe that it was something else
cus in the keras site they mentioned this ```py
The Keras functional API is a way to create models that are more flexible than the tf.keras.Sequential API. The functional API can handle models with non-linear topology, shared layers, and even multiple inputs or outputs.
and an input with a size of 2 is just a tensor with 2 inputs, and having 2 tensors concatenated would also just be a tensor with 2 inputs
austere swift
granite flame
cus in the keras site they mentioned this ```py
The Keras functional API is a wa...
non linear topology doesnt mean non linear inputs
granite flame
oh
 limpid oak
how can i add 0.5m shift to my point geometry column?
austere swift
granite flame
oh
this is an example of something with a nonlinear topology, the layers arent just directly connected to each other, there are different branches for the different inputs etc

or this
 granite flame
austere swift
this is an example of something with a nonlinear topology, the layers arent just...
granite flame
austere swift
this is an example of something with a nonlinear topology, the layers arent just...
this is prolly for CNN right
granite flame
okay nice
austere swift
that's likely used for language processing (based on the fact that it uses embeddings)
granite flame
so for mine ill just go with my sequential model right
austere swift
yes
austere swift
austere swift
this is an example of something with a nonlinear topology, the layers arent just...
in this case it would technically not be necessary to have 2 different outputs, but the reason they did that was because they wanted to use a different loss algorithm for each output
granite flame
whats your advise on the loss function
should i create a custom loss
or use MSE or MAE
austere swift
mse/mae
granite flame
mae gives me lower loss than mse
austere swift
those are the most common for regression problems (which this would appear to be based on the layer names)
granite flame
when i tried
austere swift
granite flame
mae gives me lower loss than mse
they're not directly comparable
granite flame
austere swift
they're not directly comparable
oh
austere swift
different loss algorithms can give different loss values for the same model quality
mse is mean squared error, while mae is mean absolute error
granite flame
yeah true
austere swift
so mse will square the error, mae will just take the absolute value of it
squaring will obviously give you a higher value
austere swift
yes
if you want to test out different loss algorithms and compare them, have a fixed metric that you can use to check it
i.e use mae as a metric and compare mse vs mae for loss
see which gives the lower metric score
granite flame
im using scikit-learn r2score
austere swift
that's good too
granite flame
because other metric like accuracy dont help
austere swift
yeah accuracy is for classification problems, it wont work for regression
granite flame
i cant include that in the model.compile right?
i must do it seperately after training?
austere swift
the metric? you can
granite flame
model.compile(optimizer=keras.optimizers.Adam(hp.Choice('learning_rate', [1e-2, 1e-3, 1e-4])),
                  loss='mean_absolute_error',
                  metrics=['mean_absolute_error'])
like in the case for metrics
austere swift
yeah you can put r2score there
granite flame
r2_score(outputs_test, predictions, multioutput='uniform_average') this is type it says on the site
austere swift
yeah just put the function into the metrics list
metrics=[r2_score] (after you import it ofc)
it will accept any function that takes in y_true, y_pred as arguments, which r2score does
granite flame
so i dont have to define the r2_score right
austere swift
granite flame
so i dont have to define the r2_score right
you have to import it from sklearn.metrics
granite flame
yes i have
i mean i dont have to say this line py (outputs_test, predictions, multioutput='uniform_average')
austere swift
you don't
granite flame
okay nice
austere swift
and don't put the parenthesis after it, you're not calling it you're just passing it into the metrics
granite flame
alright
thanks man uve been a savior for me
cus ive been killing my head for hours past few days
 gleaming radish
Can anyone explane me, what is the role of Data Scientist?
And also what is the diference of machine learning and artifical inteligence?
serene scaffold
gleaming radish
Can anyone explane me, what is the role of Data Scientist?
And also what is th...
the exact role of a "data scientist" is going to vary between companies, but in general, a data scientist is someone who extracts insights from large amounts of data.
artificial intelligence is when you have a computer program that emulates having knowledge about something. A program that can play chess has artificial intelligence, even if it's following a hard-coded heuristic for how to decide the next move.
machine learning is a subset of artificial intelligence where a program "learns" from data. An example would be a program that changes its own state based on a series of example chess games.
@gleaming radish does that make any sense?
tough bolt
tough bolt
```py
import torch
from torch.nn import Linear
import torch.nn.functional as F
f...
Gonna bump this
 somber prism
guys i am currently working on nlp based classification dataset ( spam or ham ) . i am planning to test out countven, tf-df and gensim word2vec so i tried converting the sparse array of countven and tf-idf to pandas df but how do i do it for gensim word2vec ? model = gensim.models.Word2Vec( sentences = df.CleanBody, min_count= 2, window = 5 ) i want to know how to get all the vectors like i got it got countvec and tf-idf
gleaming radish
serene scaffold
<@!635847787518361631> does that make any sense?
Yes, thanks a lot!
serene scaffold
somber prism
guys i am currently working on nlp based classification dataset ( spam or ham ) ...
what do you mean, spam or ham?
lapis sequoia
hi guys
what do you think about this: https://www.youtube.com/watch?v=ax5EkckwYjk&ab_channel=Swiper

Plain White T's - Hey There Delilah but the verses are sung by Juice WRLD AI
(Made with uberduck.ai)
Copyright Disclaimer: Under Section 107 of the Copyright Act 1976, allowance is made for "fair use" for purposes such as criticism, comment, news reporting, teaching, scholarship and research. Fair use is a use permitted by copyright statute tha...
wise pelican
Looks like a spam post to me there, bud
lapis sequoia
how?
wise pelican
How is it related to this channel
lapis sequoia
read the first word of that video's title
wise pelican
ah now I see
lapis sequoia
im glad
wise pelican
Still not really python related tough, is it?
lapis sequoia
well idk, i found this video and its magical to me and i want to learn about how these things are made
ping me with response
wise pelican
I mean you'd need to learn how to program in python and then learn how to create machine learning training for speech synthesis
There's plenty of resources here in the pinned posts
 burnt knot
I want to talk about my voice cloning stuff again
I sent my data to somebody to diagnose it and see what was wrong but I think he's sick
And intimidated by me
So I want to try somebody else to talk me through this
This is what I'm basing my work on
https://github.com/vlomme/Multi-Tacotron-Voice-Cloning/wiki/Training-(and-for-other-languages)
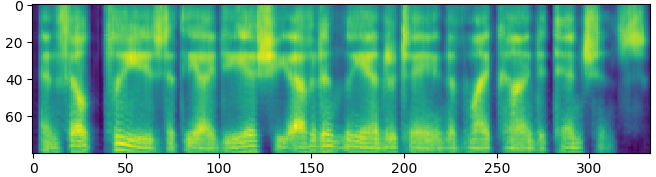
GitHub
Phoneme multilingual(Russian-English) voice cloning based on - Training (and for other languages) · vlomme/Multi-Tacotron-Voice-Cloning Wiki
I'm following the instructions on substituting the data in for my own languages
Where this is English-Russian, I want English-Japanese
I got as far as the step that develops the grapheme to phoneme dictionary
But then there's everything else
Explaining my situation is a bit elaborate because it's a weird web of technical problems
burnt knot
The problem I have is trying to discuss it with other voice cloners
They don't tend to test this software so I feel alone in trying to figure it all out
 grave burrow
Given a subject (a name, like "Joe") and a sentence, I want to detect if that sentence says that the subject will do something in the future at a location. Example of a valid sentence with subject Joe: "Joe will eat at the university". I just need to detect the concept of someone doing something in the future at a location. Any ideas on how to go about this? I don't have any background in NLP.
 magic dune
I am using matplotlib to plot some graphs but I want all the graphs to be on one big graph how would I do something like that?
 loud marlin
question about drop_duplicates
say the code here will drop any record if their date is the same:
df.drop_duplicates(subset=['date], keep='first', inplace=True)
what is the code that I want to drop the duplicate records, which the entire row has the same value?
 ripe forge
Don't use the subset arg, and then it checks entire row
loud marlin
i know it should be something simple, thanks!
somber prism
guys i am trying out this dataset spam no spam classification https://www.kaggle.com/nitishabharathi/email-spam-dataset?select=completeSpamAssassin.csv, i cleaned the dataset by tokenizing and other basic nlp clean process, now after that i am trying to use countvec, tf-idf and word2vec but i want to know how to get the vector representation of the dataset back from gensim word2vec ? i got it from countvec and tf-idf by just calling toarray() after fit_transform. model = gensim.models.Word2Vec( sentences = df.CleanBody, min_count= 2, window = 5, ) what should i do after this ?

LingSpam, EnronSpam, Spam Assassin Dataset containing ham and spam email
lone drum
How to fix
AttributeError 'Series' object has no attribute 'time'
My code
end_time = time.time()
``` this way
Ping me when replyingRename the "time" variable to something else and try again
 junior igloo
Hi ! Is data science a sub field of computer science? If not, how are the two different?
main fox
junior igloo
Hi ! Is data science a sub field of computer science? If not, how are the two d...
You could say it combines statistics and computer science. However, computer science is a large field. I'd say data science is more so statistics and certain elements of computer science.
lone drum
main fox
Rename the "time" variable to something else and try again
U mean ```python
end_time = last_time.time()
Yes. Also update any references you had to "time" to reflect the new variable name
junior igloo
main fox
You could say it combines statistics and computer science. However, computer sci...
So since computer science is a large field, near the end of the university you will have to narrow down to a specific field in CS right?
lone drum
main fox
Yes. Also update any references you had to "time" to reflect the new variable na...
Let me try
main fox
junior igloo
So since computer science is a large field, near the end of the university you w...
Yeah. You'd decide if you would want to go into web/app development, cyber security, data science, etc
junior igloo
main fox
Yeah. You'd decide if you would want to go into web/app development, cyber secur...
Oh i see...thx
lone drum
main fox
Yes. Also update any references you had to "time" to reflect the new variable na...
I am getting
Traceback (most recent call last):

  File "D:\BACKTESTING\python files\backtest4.py", line 97, in <module>
    end_time = last_time.time()

NameError: name 'last_time' is not defined
``` thisGo to the top of your code where you had assigned a value to "time" and rename it to "last_time"
lone drum
main fox
Go to the top of your code where you had assigned a value to "time" and rename i...
U mean
Begin_time = last_time.time()
``` this way ?Line 7 of your code
lone drum
main fox
Line 7 of your code
Thanks
It worked
main fox
lone drum
Thanks
It worked
Cool
Happy to help
somber prism
somber prism
guys i am trying out this dataset spam no spam classification https://www.kaggl...
can someone help me with this ?
lone drum
I tried for list comprehension
Instead of for loop ```python
b = [ i for i in rem_dup_dt]
a = df.loc[df['date'] == b] This way I am gettingpython
Valueerror length must match to compare (34341, ), (1379,)) ```
Ping me when replying
granite flame
OperatorNotAllowedInGraphError: using a `tf.Tensor` as a Python `bool` is not allowed: AutoGraph did convert this function. This might indicate you are trying to use an unsupported feature.```def build_model(hp):
model = keras.Sequential()
for i in range(hp.Int('num_layers', 2, 20)):
model.add(layers.Dense(input_dim=2, units=hp.Int('units_' + str(i), min_value=32, max_value=512, step=32),
activation='relu'))
model.add(layers.Dense(4, activation='linear'))
model.compile(optimizer=keras.optimizers.Adam(hp.Choice('learning_rate', [1e-2, 1e-3, 1e-4])),
loss='mean_absolute_error',
metrics=[r2_score])
return model
tuner = RandomSearch(
build_model,
objective='val_mean_absolute_error',
max_trials=5,
executions_per_trial=3,
directory='final',
project_name='just9')
tuner.search_space_summary()
tuner.search(X_train_scaled, Y_train, epochs=10, validation_data=(X_test_scaled, Y_test))
best_hps = tuner.get_best_hyperparameters()[0]
print('*****', best_hps.values)
best_model = tuner.get_best_models()[0]
best_model.summary()
hi guys why do i get this error
 sudden inlet
hello i need a bit of help with this, is there a way to read the last line of my csv except the last column, and then store it in a csv? for context im using it in this line of code in reg_predict
import pandas as pd
import numpy as np
from sklearn import linear_model

df = pd.read_csv('data.csv')

def predict_noinfec():
    reg = linear_model.LinearRegression()
    reg.fit(df[['pop', 'novac', 'occup', 'location']],df.noinfec)
    reg.coef_
    reg.intercept_
    print(reg.predict([[4000,800,15,1]]))


predict_noinfec()
 valid finch
Hi there does anyone have any suggestions on best resources to learn data cleaning scripts? I'm handling a nasty Excel file need to summon the troops
 coral kindle
Hey everyone, what do you think about PySpark overall?
Is it enough to be considered as an industry standard?
velvet thorn
coral kindle
Is it enough to be considered as an industry standard?
for big data?
why not?
coral kindle
velvet thorn
for big data?
Because some people find it counter-intuitive over Dask and I haven't done much big data to judge over it.
Also kinda premature in ML or so I've heard.