#data-science-and-ml
1 messages · Page 345 of 1
 harsh bear
im having 2 problems
- It isnt writing to the database
- I want it to display a graph, but since it is a graph i was thinking if it cld be a webapp or smth it wld be cool
 wicked grove
i have a doubt in this code
data_pos = data_pos.iloc[:int(20000)]
why have they used int(20000), can i just write it as data_pos.iloc[0:20000,:]
 quick kestrel
guys someone tell me can i make a ai model with scikit-learn or do i need pytorch or tensorflow
?
 fading burrow
depends on what you mean by ai model there. sklearn is a machine learning module
 desert oar
wicked grove
i have a doubt in this code
data_pos = data_pos.iloc[:int(20000)]
why have they ...
desert oar
wicked grove
i have a doubt in this code
data_pos = data_pos.iloc[:int(20000)]
why have they ...
yes, and you can also write data_pos.iloc[0:20000] or data_pos.iloc[:20000]
there is no good reason to ever write int(20000)
wicked grove
Ohh alrightt,thankss
 velvet thorn
desert oar
there is no good reason to ever write `int(20000)`
velvet thorn
desert oar
there is no good reason to ever write `int(20000)`
to create a copy?
in case you wanna do identity comparisons?
😔
wicked grove
velvet thorn
in case you wanna do identity comparisons?
What is identity comparison?
Wanted to ask you a doubt in this
Would it be possible to figure something out using the nltk library?
velvet thorn
wicked grove
What is identity comparison?
is
 eager imp
there are lots and lots of papers, books, youtube videos etc. about ML and NLTK
 tough bolt
Is anyone familiar with PYG (pytorch geometric)?
 next lance
eager imp
there are lots and lots of papers, books, youtube videos etc. about ML and NLTK
next lance
eager imp
there are lots and lots of papers, books, youtube videos etc. about ML and NLTK
My aim is to create a chat bot like Google assistant which can also detect images and also has voice features
I was browsing Tenserflow and Keras today
But it's hard to figure out what's going on in the code
eager imp
next lance
My aim is to create a chat bot like Google assistant which can also detect image...
you're aware that any one of these features alone is worth years of research and work?
next lance
eager imp
you're aware that any one of these features alone is worth years of research and...
Yes I am aware
I am just a student in class 9th for now
And it takes takes much of time making so many samples
Learning all this
I think I am going in the right direction
I have heard of raspberry is it similar to AI and Machine Learning
eager imp
next lance
I am just a student in class 9th for now
not sure what that means..
next lance
I am a student
Studies in Class 9th
What about you
I think you have been learning from a very long time
eager imp
that's right
next lance
Oh
So Do you have any idea what should I do in first
Should I watch YouTube tutorials first ?
next lance
Huh?
eager imp
pick a project
next lance
Inspiration with Sci fi ?
next lance
eager imp
pick a project
Let's say a simple without graphic chat bot
next lance
eager imp
yep
But is there any realtion between Machine learning and AI with Iron Man
Machine learning is all about Data and kinda of Robotics ?
eager imp
iron man is full of inspiration in areas of robotics, AI, material design etc
pick whatever that inspires you the most and stick with it
next lance
Oh so Iron Man is a project I am gonna be working on
next lance
eager imp
pick whatever that inspires you the most and stick with it
Ya Iron Man is good 😄
Then what should I do after selecting a Project
eager imp
read research papers, watch youtube videos on those topics you don't fully understand
and always keep visualizing the thing you want to achieve
the real effort is to discern irrelevant stuff from relevant information to achieve your goal
don't let shiny new research etc. distract you
next lance
Yes I know Thanks a lot
So What should I read first
Like is there any good yt tutorial
I know about Sendex
eager imp
well, you said you want to achieve something like google assist, can you visualize, imagine how you want to interact with it?
next lance
Yes I can imagine a lot about it
eager imp
what's the most important feature you want it to have?
next lance
Like there can be a assistant which Can call a robot for you
eager imp
chatting is boring
next lance
I am a school student so I cannot work on big projects
eager imp
what's useful about chatting?
eager imp
anyone can work on big projects, it's not a matter of what or who you are or how much time you have at hand
eager imp
if you invest 10 minutes every day in your vision, it's more than someone who doesn't invest those 10 minutes
 yes I know about it
eager imp
yes I know about it
eager imp
what's useful about a robot with GPS?
next lance
Like if you need tea
What you have to do is just call the robot and the robot will use GPS to find the way in your home. not sure if I am right
eager imp
next lance
A image detector
image detection is interesting also, but how could it be useful to your grandma?
or neighbour?
next lance
Like they can get information using a image that is in the mobile
Without searching keywords on Google
eager imp
so basically a wikipedia extension?
next lance
Yes maybe
eager imp
or maybe a tool identifier
just imagine you get in a workshop for the first time and there are all the new and old tools and you don't know what to do with any of those
next lance
What about a voice lock and voice search service
I can say Open phone and my phone will automatically by detecting my voice. Then I can say search the meaning of this word and it will search it for me
Or another example is like Open YouTube, search Python basics and play the first video
next lance
eager imp
just imagine you get in a workshop for the first time and there are all the new ...
Oh looks great
eager imp
maybe it could help identify tools and provide instructions for use?
next lance
We can extend it to like you are in a plane and you don't know anything about controls
next lance
eager imp
maybe it could help identify tools and provide instructions for use?
Exactly
eager imp
or maybe a car?
next lance
Yes
eager imp
"what's that knob for?"
tough bolt
tough bolt
Is anyone familiar with PYG (pytorch geometric)?
bump
next lance
Automatically understand what part does what by using it's image
eager imp
that would certainly be useful
eager imp
i'm not sure about easy, but certainly interesting
next lance
I can use Tenserflow for image detection
Then something else maybe for searching it
Can we just create a data group where I will add so many data sets
eager imp
i think it's a goal worth pursuing, sure - and potentially quite profitable if you do it right 🙂
eager imp
much better than a boring chatbot
next lance
Ya true
So I will start learning Image detection now
Can I add you as a friend as to talk to you later maybe
Bye
eager imp
cya
tough bolt
tough bolt
bump
.
 pliant bone
for image related stuff I would go with opencv https://github.com/opencv/opencv

GitHub
Open Source Computer Vision Library. Contribute to opencv/opencv development by creating an account on GitHub.
next lance

Hello and welcome to a miniseries and introduction to the TensorFlow Object Detection API. This API can be used to detect, with bounding boxes, objects in images and/or video using either some of the pre-trained models made available or through models you can train on your own (which the API also makes easier).
Text tutorials and sample code: h...
desert oar
wicked grove
Wanted to ask you a doubt in this
Would it be possible to figure something out ...
nltk has some primitive tools that could help with text processing in general, but i'm not sure about this particular task
by the way, in american and british english we say "ask a question". i see a lot of people on this server in particular treat "doubt" as synonymous with "question" and it seems very foreign to me. a "doubt" is more about being pessimistic or skeptical. you might "doubt your understanding" of a topic in that you are feeling unconfident in your understanding, but you wouldn't say that "i have a doubt" as in "there is something specific i don't understand"
it's such a common issue that i never say anything about it, but i felt compelled in this case because my original response was "i doubt it", and that gave me pause
 frank roost
Hi, I am currently doing a project in predicting Collective Variables for studying Molecular Dynamics using Deep Learning. If possible, I would like to check models using some datasets already available online. I need multiple trajectories of a single system(like a simple protein) with the same conditions. If anybody could provide me some resources, it would be really helpful.
 serene scaffold
Look into time series forecasting
desert oar
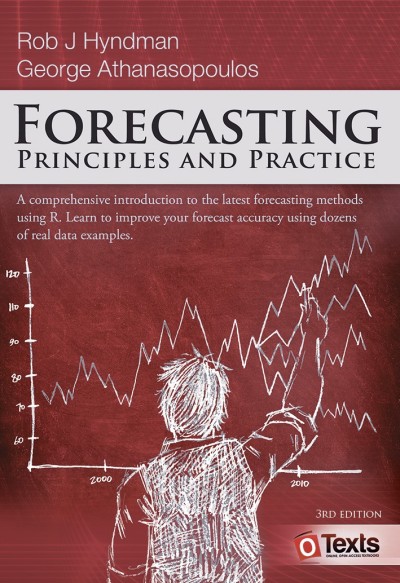
3rd edition
 smoky stone
hey guys, im a beginner and i've put up a small question on #help-cupcake
this is the question:
Question: Please help me understand how to solve this. I've already tried installing openpyxl, with pip and pip3.
Error: ImportError: Missing optional dependency 'openpyxl'. Use pip or conda to install openpyxl.
Code: import pandas as pd
import matplotlib.pyplot as plt
import seaborn as sns
df = pd.read_excel('superstore_sales.xlsx') #importing the data
Explain: I'm running this on VS Code with a Jupyter extension, but i'm just not able to import data from a file to start the analysis
next lance
Hello I think that creating something virtual is better than creation something real like.
If I create a Real Robot, it's good but not better than other AI projects.
Am I Right
smoky stone
smoky stone
this is the question:
**Question**: Please help me understand how to solve this...
Could anyone help me with this?
 halcyon gust
smoky stone
this is the question:
**Question**: Please help me understand how to solve this...
halcyon gust
smoky stone
this is the question:
**Question**: Please help me understand how to solve this...
you need to install openpyxl
smoky stone
halcyon gust
you need to install openpyxl
I have it installed, checked with pip freeze too
desert oar
smoky stone
I have it installed, checked with pip freeze too
You probably have multiple python installations, or are in the wrong virtual environment
smoky stone
halcyon gust
can you import it?
no it says there's no such module as openpyxl
smoky stone
desert oar
You probably have multiple python installations, or are in the wrong virtual env...
is there a way i can check and correct this?
pliant bone
smoky stone
is there a way i can check and correct this?
import openpyxl
this is a more general issue. in python it's important to understand what environment you are using and what packages are installed for this specific environment.
for the sake of discussion, every python.exe file is configured to use a different pip system that has its own packages installed on it.
serene scaffold
smoky stone
no it says there's no such module as openpyxl
you can do which python to see where the python you're using is located.
halcyon gust
and it does indeed sound as though, for example, when you do 'pip freeze', you are not getting the packages data from the actual environment you are using when trying to do 'import openpyxl'
pliant bone
guessing it's the wrong python virtual env or the virtual env is not activated
tough bolt
tough bolt
Is anyone familiar with PYG (pytorch geometric)?
bump
smoky stone
serene scaffold
you can do `which python` to see where the `python` you're using is located.
Okayy I'll do that, thanks
desert oar
smoky stone
Okayy I'll do that, thanks
Are you using conda/anaconda?
 obtuse osprey
hello
am trying to get into government bootcamp , and i got stuck in two question about machine learning models , any one can offer a help pls
its very basic 2 question's

 prime hearth
if trying to get in, its best that you find the answer yourself
giving answer is not helping in long run
however, you can find many examples for each of those from quick google search or examples from your own experience
obtuse osprey
my problem is i really dont know anything about Sql , if i knew what he want from the Q i could search for it , but i got lost
prime hearth
You can ask then for clarification and im sure they will help. Even in coding test like during job, if there is something dont understand it. always best to email the recruiter otherwise if just doing something dont understand it does not give a good impression, compared to asking for clarification it shows good communication
desert oar
fortunately this has nothing to do with sql
wicked grove
desert oar
nltk has some primitive tools that could help with text processing in general, b...
Haha 😂🙈you are right,my bad
I do have another question tho
If have the coordinates of each word in the pdf ,would that be helpful for this tool?
^I
smoky stone
desert oar
Are you using conda/anaconda?
I use pip, I'm not very sure what I'm using☹️
 arctic crown
@serene scaffold you there?
serene scaffold
arctic crown
<@!253696366952316929> you there?
yes, but I don't know what you would like help with
arctic crown
Can you please explain tensor
serene scaffold
A tensor is the name for arrays used in PyTorch and Tensorflow. I believe the only difference is what methods they have, and that they can go on a GPU.
There's a distinction between "array" and "tensor" in pure mathematics, but I don't really understand it.
serene scaffold
it's an n-dimensional array, yes
arctic crown
got it thx
 azure marsh
serene scaffold
There's a distinction between "array" and "tensor" in pure mathematics, but I do...
azure marsh
serene scaffold
There's a distinction between "array" and "tensor" in pure mathematics, but I do...
Yeah, it's a bit obtuse:

Mathematics Stack Exchange
What is the difference between a matrix and a tensor? Or, what makes a tensor, a tensor? I know that a matrix is a table of values, right? But, a tensor?
serene scaffold
azure marsh
Yeah, it's a bit obtuse:
https://math.stackexchange.com/questions/412423/what-a...
isn't a matrix an array that is strictly two-dimensional? so the question remains about arrays vs tensors specifically.
azure marsh
No
A matrix is 2 dimensions or higher
a list is 1 dimensional, and array is N dimensional
list/matrix/array are more about the format
tensor is about interpretation
serene scaffold
I thought a vector was one-dimensional and that "list" doesn't have a specific meaning here.
azure marsh
but yes the more direct comparison is array and tensor, but the question deals with format vs meaning
vector and list can be thought of as similar in this scenario
vector is probably better suited like you mention
serene scaffold
I'm adamant that we avoid the term "list" in these sorts of discussions as the python list data type does not support mathematical operations.
 snow harbor
Hi, whos meeting with development app for kinect 2.0 on python
I search on other forums, and i don't show more details
 chilly geyser
"vector" for 1D is just convention though, since matrices, tensors are all elements of some vector space (and so 'vectors' are elements of said spaces). There is no 'tensor space' in common language, tensors are multilinear maps
 winter flume
hello,
- I have a video, and I want to identify the objects that move in it (movement in some direction, rotation, magnification, reduction ..), how can I calculate these changes between any two consecutive frames?
- In addition, I also want a breakdown of all the details I can conclude are on the same object, for example for a person shirt color, pants color, hair, glasses ... or for example if it is a car, what is the license plate number, color, type. ..
azure marsh
Object tracking and object descriptors
 edgy hearth
guy i have a doubt
it is a really simple one
really simple
data = pandas.read_csv("3.1 cost_revenue_clean.csv")```you see i wanna run the csv file using pandas
but i cant

i get this error
edgy hearth
desert oar
...does the file actually exist?
yes it does
edgy hearth
 drifting summit
put the file in the same directory as the code file
drifting summit
put the file in the same directory as the code file
oke
lemme try that
i've heard that you should do that
but oke lemme try
drifting summit
if that doesnt work
drifting summit
directory is folder
desert oar
you might need to figure out what VS Code's "current working directory" is
drifting summit
lol u wud know that
desert oar
it might not be where your code is
for now, try using the full path to the filename instead of just the filename
e.g. C:/Users/.../data.csv
(use forward slashes in python)
drifting summit
edgy hearth
where all my vs codes are there ?
send the file path
of the
code file
drifting summit
edgy hearth
lemme try something
that wont work
drifting summit
drifting summit
send the file path
do this
prime hearth
it could also be that the file has a space
edgy hearth
drifting summit
that wont work
lol can you wait
prime hearth
but i not sure about this
desert oar
prime hearth
it could also be that the file has a space
python can handle files with spaces
edgy hearth
have some patency my guy
drifting summit
ok homie
prime hearth
oh okay thanks , i dint know that
drifting summit
noo
edgy hearth
then ?
drifting summit
the file in which u r writing the code
edgy hearth
you mean the vs code right ?
drifting summit
tkinter project.py
drifting summit
drifting summit
tkinter project.py
the file path of this file
HOMIE u there?
my guy
edgy hearth
yeah yeah
drifting summit
lol
edgy hearth
C:\Users\aasim\OneDrive\Desktop\Visual Studio Codes\data science(2).py
will this work ?
drifting summit
@desert oar salty boi help me out here
drifting summit
edgy hearth
``C:\Users\aasim\OneDrive\Desktop\Visual Studio Codes\data science(2).py``
yeah
yeah
edgy hearth
oke
edgy hearth
when ever i try to run the code
i get this error
FileNotFoundError: [Errno 2] No such file or directory: "C:/AASIM'S STUFF/Python/videos/ml/Complete 2020 Data Science & Machine Learning Bootcamp/Complete 2020 Data Science & Machine Learning Bootcamp/2. Predict Movie Box Office Revenue with Linear Regression/3.1 cost_revenue_clean.csv"
drifting summit
edgy hearth
``FileNotFoundError: [Errno 2] No such file or directory: "C:/AASIM'S STUFF/Pyth...
damn homie be flexing
 edgy hearth
drifting summit
yeah ik u do
edgy hearth
drifting summit
yeah ik u do
lol
atleast someone belives me
because the code definetly does not
drifting summit
yeah
 lapis sequoia
@edgy hearth is the py file located in the same folder?
desert oar
@edgy hearth what does import os; print(os.getcwd()) show?
desert oar
i noticed that they had "ENG" in their taskbar. i wonder if this could be a unicode issue, where they accidentally typed 2 characters that look identical but have different character codes
e.g. greek, turkish, and cyrillic all have various letters that look like latin letters, but are actually different code points
lapis sequoia
desert oar
i noticed that they had "ENG" in their taskbar. i wonder if this could be a unic...
i also have ENG in my task bar but i can access other files without anything extra
i dont think that would be the issue
desert oar
right, i am just suspecting that maybe they had switched input modes and something got messed up
it's a totally wild guess at a weird issue
(which btw has nothing to do with pandas or data science)
lapis sequoia
desert oar
right, i am just suspecting that maybe they had switched input modes and somethi...
what input mode?
desert oar
idk! i'm not them
i meant "the language that appears in your computer when you type on your keyboard"
lapis sequoia
oh the "ENG" or whatever just means the keyboard layout
drifting summit
desert oar
i noticed that they had "ENG" in their taskbar. i wonder if this could be a unic...
SALTY BOI at it hard
desert oar
yes, and if it's greek then you can have both T (LATIN CAPITAL LETTER T) and T (GREEK CAPITAL LETTER TAU) in the same document, which literally use the same glyph in pretty much every font
consider also that -–—− are 4 different code points, and some programs like MS Word might "helpfully" convert the first one into any of the other 3
drifting summit
desert oar
consider also that `-–—−` are 4 different code points, and some programs like MS...
SALTY BOI at it even harder
 azure marsh
@edgy hearth How about opening an rich terminal like IPython and letting it tab completing the filename
You might also be bumping up against window's path length limit. There's a way you can change it, but try just moving it to C:\tmp\ and see if you can access it. It's supposed to be 260 characters (the above path is 229), but I've had issues with less than that for some reason, around the 200 mark, even with the supposed fix
serene scaffold
arctic crown
<@!253696366952316929> you there?
Yes, but it's best to just put your question out there rather than depend on the availability of one person.
Please paste that as text.
arctic crown
"
Now that we've talked about the rank of tensors it's time to talk about the shape. The shape of a tensor is simply the number of elements that exist in each dimension.
TensorFlow will try to determine the shape of a tensor but sometimes it may be unknown. To get the shape of a tensor we use the shape attribute.
rank2_tensor.shape"
@arctic crown if the shape of a tensor is (3, 5, 2), how many dimensions do you think it has?
arctic crown
3?\
serene scaffold
Yes. It's like how a square is two dimensional, and a cube is three dimensional.
serene scaffold
It is the shape of a three dimensional array or tensor.
It's not a perfect analogy. "Square matrix" has a specific meaning
Namely a two dimensional array where the lengths of each dimension are the same.
arctic crown
ok now can you please explain Rank/Degree of Tensors
desert oar
"rank" is a linear algebra term
arctic crown
@serene scaffold sorry for the pings but can you please explain
Changing Shapes of tensors
serene scaffold
what is your question?
arctic crown
how Changing Shapes of tensors works
 iron basalt
serene scaffold
arctic crown
how Changing Shapes of tensors works
iron basalt
serene scaffold
arctic crown
how Changing Shapes of tensors works
why are you interested to know how to change the shape of a tensor?
arctic crown
i am learning tesorflow
serene scaffold
arctic crown
i am learning tesorflow
In [8]: tensor
Out[8]: tensor([ 0.,  1.,  2.,  3.,  4.,  5.,  6.,  7.,  8.,  9., 10., 11.])

In [9]: tensor.shape
Out[9]: torch.Size([12])

In [10]: tensor.reshape(6, 2)
Out[10]:
tensor([[ 0.,  1.],
        [ 2.,  3.],
        [ 4.,  5.],
        [ 6.,  7.],
        [ 8.,  9.],
        [10., 11.]])

In [11]: tensor.reshape(4, 3)
Out[11]:
tensor([[ 0.,  1.,  2.],
        [ 3.,  4.,  5.],
        [ 6.,  7.,  8.],
        [ 9., 10., 11.]])

In [12]: tensor.reshape(3, 2, 2)
Out[12]:
tensor([[[ 0.,  1.],
         [ 2.,  3.]],

        [[ 4.,  5.],
         [ 6.,  7.]],

        [[ 8.,  9.],
         [10., 11.]]])
This is with pytorch rather than tensorflow
do you see what (6, 2), (4, 3), and (3, 2, 2) all share in relation to 12?
arctic crown
serene scaffold
*?
serene scaffold
yes, good job!
serene scaffold
arctic crown
so (x,y) x is the number of columns you want and y is the amount of rows
backwards 😄
look at this one again
In [10]: tensor.reshape(6, 2)
Out[10]:
tensor([[ 0.,  1.],
        [ 2.,  3.],
        [ 4.,  5.],
        [ 6.,  7.],
        [ 8.,  9.],
        [10., 11.]])
It's like this
 arctic crown
hm?
serene scaffold
The original tensor is 0 to 11. So it divides that into three equal parts, and then divides each of those three into two equal parts (with two remaining in each)
You can see how each of the four values in the outermost dimension are consecutive numbers.
In [12]: tensor.reshape(3, 2, 2)
Out[12]:
tensor([[[ 0.,  1.],
         [ 2.,  3.]],

        [[ 4.,  5.],
         [ 6.,  7.]],

        [[ 8.,  9.],
         [10., 11.]]])
did you try reading the documentation? https://www.tensorflow.org/api_docs/python/tf/ones
I'm going to be gone for the next few hours btw
 stark zenith
arctic crown
can someone please explain linear regression
stark zenith
arctic crown
can someone please explain linear regression
regression is used to predict continuous values
linear means along a line, but that might be a very simplistic explanation
linear regression "tries to find a line where the mean of the squared errors between estimated points on the line and the actual points is minimal"
 worldly lake
hello, do u know how i can with my code:
    for n in photos_data['data']['product_images']:
        print(n['url'])
Out:
product_images/with_watermark/877/2225877.jpg
product_images/with_watermark/848/2225848.jpg
product_images/with_watermark/849/5973849.jpg
product_images/with_watermark/851/5973851.jpg
product_images/with_watermark/852/5973852.jpg
product_images/with_watermark/850/5973850.jpg
product_images/with_watermark/507/7246507.jpg
select only .jpg name?
desert oar
worldly lake
hello, do u know how i can with my code:
```
for n in photos_data['data']['p...
what is photos_data? a dict? a dataframe? something else?
but in general you can just use if inside the loop
and either use .endswith() or regex
!d str.endswith
 arctic wedgeBOT
str.endswith(suffix[, start[, end]])```
Return `True` if the string ends with the specified *suffix*, otherwise return `False`. *suffix* can also be a tuple of suffixes to look for. With optional *start*, test beginning at that position. With optional *end*, stop comparing at that position.@desert oara dict
desert oar
then do what i said. and this isn't a data science question. see #❓|how-to-get-help for general python questions
worldly lake
oh, im sorry, and thank u 🙂
desert oar
that's ok. "data science" has to do with statistics, machine learning, etc
 eager night
serene scaffold
Look into time series forecasting
eager night
serene scaffold
Look into time series forecasting
I am having troubles with classifying the different groups. For example, how would I differentiate between Store A, Store B, Store C when I am processing the data?
serene scaffold
eager night
I am having troubles with classifying the different groups. For example, how wou...
What format is the data in again? Doesn't one of the columns tell you this?
eager night
Yes it does, but is there a specific way I need to process the data? Like how would I specify the class
stark zenith
Would a Pandas question be appropriate here @desert oar ? I've been working on a work thing but can't seem to figure it out.
I have to be really vague too since it's a work thing. 😛
serene scaffold
stark zenith
Would a Pandas question be appropriate here <@!389497659087650836> ? I've been w...
You can ask pandas questions, yes. The best way to get help with that is to provide a sample of your data frame as text that can be copied and pasted, and the desired output.
Remember that just displaying the dataframe will usually clip columns, which might make the example useless.
 slender wyvern
I was tinkering around with numpy dtypes and noticed that when using structured data types, while all the relevant attributes for an iterable object are exposed, I can't iterate the data type. Any ideas, why this is not allowed?
!e example:
import numpy as np

# see https://docs.python.org/3/reference/datamodel.html#special-method-names
class A:
    a = [0, 1, 2]

    def __len__(self):
        return len(self.a)

    def __getitem__(self, key):
        return self.a[key]

a = A()

print([i for i in a])  # [0, 1, 2]
print(a[0], a[1], a[2], len(a), '\n')  # 0 1 2 3

xyz = np.dtype([("x", np.float_), ("y", np.int8), ("z", np.int8)])
print(xyz[0], xyz[1], xyz[2], len(xyz))  # float64 int8 int8 3
print(hasattr(xyz, "__getitem__"), hasattr(xyz, "__len__")) # True, True

# I have to use this, but...
print([x[0] for x in xyz.fields.values()])  # [dtype('float64'), dtype('int8'), dtype('int8')]
# ...why does that not work though:
[x for x in xyz]  # 'numpy.dtype[void]' object is not iterable
@slender wyvern :x: Your eval job has completed with return code 1.
001 | [0, 1, 2]
002 | 0 1 2 3
003 |
004 | float64 int8 int8 3
005 | True True
006 | [dtype('float64'), dtype('int8'), dtype('int8')]
007 | Traceback (most recent call last):
008 |   File "<string>", line 25, in <module>
009 | TypeError: 'numpy.dtype[void]' object is not iterable
Thanks. Not sure what I can share though, since it's company data, but I also don't know how much I can relay just by asking broad questions.
serene scaffold
stark zenith
Thanks. Not sure what I can share though, since it's company data, but I also do...
You can make random data of the same types with arbitrary column names
velvet thorn
slender wyvern
I was tinkering around with numpy dtypes and noticed that when using structured ...
you can't iterate through a class with __getitem__ if __iter__ is set to None, which I would guess is the case
!e
class X:
    __iter__ = None

    def __len__(self):
        return 1

    def __getitem__(self, key):
        return 1

print([x for x in X()])
@velvet thorn :x: Your eval job has completed with return code 1.
001 | Traceback (most recent call last):
002 |   File "<string>", line 10, in <module>
003 | TypeError: 'X' object is not iterable
That's a good idea, but I think I have half of it figure out so far. But I'm also halfway into 'best approach paralysis' too. :/
slender wyvern
but then it should have the attribute __iter__ I'd assume
!e
import numpy as np
xyz = np.dtype([("x", np.float_), ("y", np.int8), ("z", np.int8)])
print(hasattr(xyz, "__iter__")) # False
@slender wyvern :white_check_mark: Your eval job has completed with return code 0.
False
probably done on the C side
I would guess that the interpreter checks tp_iter first
serene scaffold
stark zenith
That's a good idea, but I think I have half of it figure out so far. But I'm als...
If you explain what you're trying to do generally, I may or may not be able to point you in the right direction
stark zenith
serene scaffold
If you explain what you're trying to do generally, I may or may not be able to p...
At this point, I have a bunch of one-hot encoded columns in Pandas - what is a good way of going through the columns and setting values to another column value if it's greater than 1?
For context, what I'm trying to do is get a picture of the same-ness between a bunch of different 3rd party hotel booking channels grabbed through metasearch.
serene scaffold
I think I can make an example when I get back to my desktop in a few hours.
 old thorn
what would be the best way to even out sample size to reduce bias, I just trained a Logistic Regression and the bias is crazy

I actually am not sure what to do
velvet thorn
stark zenith
At this point, I have a bunch of one-hot encoded columns in Pandas - what is a g...
do you have a more concrete example
which source/destination columns?
stark zenith
velvet thorn
which source/destination columns?
I've already created 20 columns from the top 20 Channels as one-hot encoding. I want to change the 1's in those columns to match the values in another column, which is the Channel Rate column.
velvet thorn
stark zenith
I've already created 20 columns from the top 20 Channels as one-hot encoding. I ...
all of them?
stark zenith
velvet thorn
all of them?
All of the 1's, yes, and all of the new columns.
velvet thorn
stark zenith
I've already created 20 columns from the top 20 Channels as one-hot encoding. I ...
are there any columns other than those 21
stark zenith
velvet thorn
are there any columns other than those 21
Yes, but I've already sorted a lot of them - some are categorical that I've had to sort for only one type. One of those columns is the Hotel Name, which I'm hoping to Group By on - this way I have a single hotel for each line, with columns of the individual Channel Rate in each applicable column.
velvet thorn
stark zenith
Yes, but I've already sorted a lot of them - some are categorical that I've had ...
hm
I have this as a first approximation
!e
import pandas as pd

s = pd.DataFrame([[0, 1, 'one'], [1, 0, 'two'], [1, 1, 'three'], [0, 0, 'four']], columns=['a', 'b', 'r'])

print(s)

print(s[['a', 'b']].where(~s[['a', 'b']].astype(bool), s['r'], axis=0))
@velvet thorn :white_check_mark: Your eval job has completed with return code 0.
001 |    a  b      r
002 | 0  0  1    one
003 | 1  1  0    two
004 | 2  1  1  three
005 | 3  0  0   four
006 |        a      b
007 | 0      0    one
008 | 1    two      0
009 | 2  three  three
010 | 3      0      0
Thanks! I'm having a look. I appreciate the help.
stark zenith
velvet thorn
!e
```py
import pandas as pd
s = pd.DataFrame([[0, 1, 'one'], [1, 0, 'two'], [1...
Yes, this is really close to what I'm thinking. would anything change if the s['r'] column is an integer instead of string?
velvet thorn
stark zenith
Yes, this is *really* close to what I'm thinking. would anything change if the s...
no
stark zenith
velvet thorn
no
So to get an idea of what it is doing, it's replacing with values from 'r' if it isn't considered 'bool'? or if it isn't considered 'True'?
velvet thorn
stark zenith
So to get an idea of what it is doing, it's replacing with values from 'r' if it...
the latter
.astype converts values to boolean
then that's passed into .where
stark zenith
Ah, and 1 is True and 0 is False?
velvet thorn
left.where(condition, right) basically replaces values from left with those from right if the corrresponding value in condition is False
but we want to replace the True values
so we invert with ~
velvet thorn
stark zenith
Ah, and 1 is True and 0 is False?
yes
desert oar
stark zenith
Would a Pandas question be appropriate here <@!389497659087650836> ? I've been w...
Yes this is a good channel for pandas
 quasi torrent
can I ask a question about keras python here?
serene scaffold
quasi torrent
can I ask a question about keras python here?
Yes
quasi torrent
ok so I am trying to build a regression model where the inputs are x,y, and z (which are floats) and the output is a mathematical function f(x,y,z)=0.1x*cos(2y+5z)
here is how I generated the data set

the inputFunc function is simply f(x,y,z)
this is the sequential model that I built. The input shape is a numpy array in the form [x y z] and the output is the corresponding f(x,y,z). I normalized the input data from 0 to 1

This is the compiling and I am using the Adam optimizer

this is the model.fit method line

the problem is my loss functions are not changing when I train the model
Any clue what could be the reasons?
 arctic wedgeBOT
Pasting large amounts of code
If your code is too long to fit in a codeblock in discord, you can paste your code here:
https://paste.pythondiscord.com/
After pasting your code, save it by clicking the floppy disk icon in the top right, or by typing ctrl + S. After doing that, the URL should change. Copy the URL and post it here so others can see it.
desert oar
Maybe learning rate is way too low?
 austere swift
it looks like its going down, but very slowly
yeah try increasing your learning rate
desert oar
That or the features are so totally unrelated to the labels that there's nothing to learn
austere swift
it could also just be a case of underfitting, if increasing the learning rate doesnt help you can try increasing the complexity of your model
quasi torrent
Epoch 89/100 45/45 - 0s - loss: 0.2182 - mse: 0.2182 - mae: 0.3756 - val_loss: 0.2556 - val_mse: 0.2556 - val_mae: 0.4205 Epoch 90/100 45/45 - 0s - loss: 0.2179 - mse: 0.2179 - mae: 0.3757 - val_loss: 0.2554 - val_mse: 0.2554 - val_mae: 0.4226 Epoch 91/100 45/45 - 0s - loss: 0.2186 - mse: 0.2186 - mae: 0.3748 - val_loss: 0.2554 - val_mse: 0.2554 - val_mae: 0.4214 Epoch 92/100 45/45 - 0s - loss: 0.2183 - mse: 0.2183 - mae: 0.3748 - val_loss: 0.2554 - val_mse: 0.2554 - val_mae: 0.4210 Epoch 93/100 45/45 - 0s - loss: 0.2183 - mse: 0.2183 - mae: 0.3753 - val_loss: 0.2554 - val_mse: 0.2554 - val_mae: 0.4210 Epoch 94/100 45/45 - 0s - loss: 0.2180 - mse: 0.2180 - mae: 0.3753 - val_loss: 0.2554 - val_mse: 0.2554 - val_mae: 0.4212 Epoch 95/100 45/45 - 0s - loss: 0.2189 - mse: 0.2189 - mae: 0.3753 - val_loss: 0.2555 - val_mse: 0.2555 - val_mae: 0.4209 Epoch 96/100 45/45 - 0s - loss: 0.2179 - mse: 0.2179 - mae: 0.3746 - val_loss: 0.2554 - val_mse: 0.2554 - val_mae: 0.4210 Epoch 97/100 45/45 - 0s - loss: 0.2180 - mse: 0.2180 - mae: 0.3749 - val_loss: 0.2557 - val_mse: 0.2557 - val_mae: 0.4203 Epoch 98/100 45/45 - 0s - loss: 0.2185 - mse: 0.2185 - mae: 0.3756 - val_loss: 0.2554 - val_mse: 0.2554 - val_mae: 0.4226 Epoch 99/100 45/45 - 0s - loss: 0.2182 - mse: 0.2182 - mae: 0.3747 - val_loss: 0.2560 - val_mse: 0.2560 - val_mae: 0.4200 Epoch 100/100 45/45 - 0s - loss: 0.2189 - mse: 0.2189 - mae: 0.3765 - val_loss: 0.2554 - val_mse: 0.2554 - val_mae: 0.4222
quasi torrent
quasi torrent
`Epoch 89/100
45/45 - 0s - loss: 0.2182 - mse: 0.2182 - mae: 0.3756 - val_loss: ...
This is changing the learning rate to 0.01
quasi torrent
austere swift
it could also just be a case of underfitting, if increasing the learning rate do...
by increasing complexity do you mean adding more layers?
austere swift
yes or making the layers larger
quasi torrent

here is also the full program
so I changed my model to this:model = Sequential([ Dense(units=64,input_shape=(3,),activation='relu'), Dense(units=120,activation='relu'), Dense(units=100,activation='relu'), Dense(units=100,activation='relu'), Dense(units=1) ])
Epoch 1/100 45/45 - 1s - loss: 0.2311 - mse: 0.2311 - mae: 0.3865 - val_loss: 0.2580 - val_mse: 0.2580 - val_mae: 0.4207 Epoch 2/100 45/45 - 0s - loss: 0.2209 - mse: 0.2209 - mae: 0.3771 - val_loss: 0.2636 - val_mse: 0.2636 - val_mae: 0.4218 Epoch 3/100 45/45 - 0s - loss: 0.2221 - mse: 0.2221 - mae: 0.3784 - val_loss: 0.2564 - val_mse: 0.2564 - val_mae: 0.4242 Epoch 4/100 45/45 - 0s - loss: 0.2200 - mse: 0.2200 - mae: 0.3768 - val_loss: 0.2627 - val_mse: 0.2627 - val_mae: 0.4225 Epoch 5/100 45/45 - 0s - loss: 0.2190 - mse: 0.2190 - mae: 0.3774 - val_loss: 0.2557 - val_mse: 0.2557 - val_mae: 0.4204 Epoch 6/100 45/45 - 0s - loss: 0.2185 - mse: 0.2185 - mae: 0.3753 - val_loss: 0.2554 - val_mse: 0.2554 - val_mae: 0.4212 Epoch 7/100 45/45 - 0s - loss: 0.2180 - mse: 0.2180 - mae: 0.3756 - val_loss: 0.2555 - val_mse: 0.2555 - val_mae: 0.4208
the losses are sort of still going down really slowly
if not the same
desert oar
Honestly those labels look really random
Wait
Oh i see this is a simulated dataset
That min max scaler seems questionable
Well i guess you know the input data is bounded
Hm
Can you also print the gradients somehow
I'd be curious if this works with a smaller network
That's a lot if parameters for 500 data points, maybe it's ok but my instinct would be to generate a lot more simulated points or make the network a lot smaller
quasi torrent
How do I print the gradients? I'm pretty new to machine learning
quasi torrent
desert oar
That's a lot if parameters for 500 data points, maybe it's ok but my instinct wo...
is 20,000 data points ok?
 tender hearth
How do I apply a function to the 2nd dimension of a Tensor?
For context, I'm writing a custom collate_fn to process a batch of audio waveforms
I'm padding them using torch.nn.utils.rnn.pad_sequence which returns a Tensor 1 rank higher
now I need to apply torchaudio.transforms.MelSpectrogram which produces a 2D Tensor to each Tensor in dim 0
 rough fulcrum
My code keeps on stopping after i use my if statement and i want to use my if statement multiple times `import speech_recognition as sr
import pyautogui
import time
r = sr.Recognizer()
mic = sr.Microphone()
with mic as source:
r.adjust_for_ambient_noise(source)
audio = r.listen(source)
recognition = {
"success": True,
"error": None,
"transcription": None
}
Number = 0
try:
recognition["transcription"] = r.recognize_google(audio)
except sr.RequestError:
recognition["success"] = False
recognition["error"] = "API unavailable"
except sr.UnknownValueError:
pass
if recognition["transcription"] == "left":
pyautogui.press('w')
`
next lance
I see many people using Jupiter Notebook while Image detection using tenserflow
Can I not use Pycharm?
 royal crest
next lance
I see many people using Jupiter Notebook while Image detection using tenserflow ...
royal crest
next lance
I see many people using Jupiter Notebook while Image detection using tenserflow ...
you can use jupyter nb on pycharm
 pastel valley
is this what numpy.linalg.solve() do?
 stark zenith
pastel valley
is this what numpy.linalg.solve() do?
stark zenith
pastel valley
is this what numpy.linalg.solve() do?
I think so, I remember making a notebook to cheat in Precalc earlier this year using Numpy.
mostly to do the really tedious shit
actually I'd use sympy to do sympy.apart because that was tedious
np.cross is good for cross-product stuff
very useful
pastel valley
sir can you help understand this very confusing math
i dont ask for code but what should i implement in this

is it a program to find a basis given a vectors and scalars?
 quaint bloom
How does Wasserstein loss affect CycleGANs? I've seen ppl using it for other GANs but not much for CycleGAN
worldly lake
hello, does anyone know how to combine all the elements of the SKU column by listing the URL column separated by commas?
Like:
{"sku": 43956, "url": "7222021.jpg, 7222019.jpg, 7222017.jpg, 4176997.jpg, 2518544.jpg, 2518520.jpg, 2518488.jpg, ..."}
 velvet thorn
worldly lake
hello, does anyone know how to combine all the elements of the SKU column by lis...
velvet thorn
worldly lake
hello, does anyone know how to combine all the elements of the SKU column by lis...
', '.join(row['url'] for row in data)
would be a good start

 heavy crow

My loss resets after each epoch for some reason. Any ideas why?
I'm training a efficient net V2 backbone to recognize a bunch of classes
 drifting mason
drifting mason
drifting mason
any idea guys?
 primal tulip
drifting mason
any idea guys?
primal tulip
drifting mason
any idea guys?
try
plt.boxplot(cortisone.Cushings)
or
plt.boxplot(cortisone['Cushings'])
The issue being python thinks Cushings is a variable and not part of your pandas Dataframe. You need to specify correctly the Pandas syntax.
drifting mason
@primal tulip Thanks a lot, how can I plot two box plots at the same time, please can you help me?
primal tulip
drifting mason
<@!234094728805613569> Thanks a lot, how can I plot two box plots at the same t...
You need to create multiple graphs in the same plot. For that you need to specify it when you create the fig and ax elements. Then you create your graphs with different labels and finally you plot.
You can read this stackoverflow question for reference.
https://stackoverflow.com/questions/42734109/two-or-more-graphs-in-one-plot-with-different-x-axis-and-y-axis-scales-in-pyth
 upper granite
Hi guys
have you ever seen this error in DBeaver
SQL Error [16777232]: Query failed (#20211004_115307_00151_s2r9w): Error reading tail from s3://some-bucket/folder/folder/part-00010-0287d64b-292f-428e-9da5-10e61bd353c1-c000.snappy.parquet with length 16384
I have delta table in S3
royal crest
try #databases ?
lapis sequoia
Good guys @primal tulip always there to help 😜
drifting mason
@primal tulip My data looks like this

and the box-plot looks like this, with the second box-plot being null
like this
 desert oar
drifting mason
Can someone guide me where am I going wrong?
desert oar
drifting mason
Can someone guide me where am I going wrong?
to explain what's happening from a python perspective: Cushings is not a variable name, it's a column in the cortisone dataframe
drifting mason
I got it, but now, am I going wrong somewhere, pls can u look into it
2 seems null
there is data tho
basically, the box-plot for healthy is not being generated
harsh bear
Hello. I need help with making graph from csv.. Basically I know nothing abt CSV
drifting mason
this may help

Stack Overflow
I am reading data from a CSV file (xyz.CSV) which contains below data:
col1,col2,col3,col4
name1,empId1,241682-27638-USD-CIGGNT ,1
name2,empId2,241682-27638-USD-OCGGINT ,1
name3,empId3,241942-3719...
 graceful birch
Do anyone have experience with the turtle module of python
harsh bear
just one sec
graceful birch
Because I need to import an image and it hates me
drifting mason
drifting mason
like this
can somebody please help
harsh bear
harsh bear
Hello. I need help with making graph from csv.. Basically I know nothing abt CSV
I have 2 csv files, with different data, and same date
I want it to plot a graph
drifting mason
Read about Matplotlib
harsh bear
i did
drifting mason
Which part exactly do you need help at
drifting mason
drifting mason
can somebody please help
guys please help
arctic wedgeBOT
Hey @harsh bear!
Uh-oh! It looks like your message got zapped by our spam filter. We currently don't allow .csv attachments, so here are some tips to help you travel safely:
• If you attempted to send a message longer than 2000 characters, try shortening your message to fit within the character limit or use a pasting service (see below)
• If you tried to show someone your code, you can use codeblocks
(run !code-blocks in #bot-commands for more information) or use a pasting service like:
Hey @harsh bear!
Uh-oh! It looks like your message got zapped by our spam filter. We currently don't allow .csv attachments, so here are some tips to help you travel safely:
• If you attempted to send a message longer than 2000 characters, try shortening your message to fit within the character limit or use a pasting service (see below)
• If you tried to show someone your code, you can use codeblocks
(run !code-blocks in #bot-commands for more information) or use a pasting service like:
harsh bear
These r my 2 csv files which automatically get daily data from my bot
I want to be able to get the date as the horizontal column
And 2 bar graphs, with one being the server count other member count
Can any1 understand me?
desert oar
sure, thanks for providing the csv data
 dense lintel
where can i learn some machine learning?
im a beginner in ai
i know python pretty well
desert oar
we have some pinned resources
desert oar
if you already know python, i recommend:
-
starting to learn probability and stats, maybe try "Bayesian Methods for Hackers" https://camdavidsonpilon.github.io/Probabilistic-Programming-and-Bayesian-Methods-for-Hackers/
-
start messing around with pandas; get some csv datasets and practice making useful data visualizations. start reading Tufte "The Visual Display of Quantitative Information", then Wilke "Fundamentals of Data Visualization"(https://clauswilke.com/dataviz/), and at least skim Cleveland "The Elements of Graphing Data"
-
start messing around with scikit-learn, xgboost, and pytorch (i think it's easier to use than tensorflow). load up some easy datasets like kaggle Titanic, and/or simulate some data, and start fitting models, try stuff, see what works, make nice visualizations thereof, practice writing up / explaining your process and results
Bayesian Methods for Hackers : An intro to Bayesian methods + probabilistic programming with a computation/understanding-first, mathematics-second point of view.
dense lintel
alright thanks!
desert oar
added a link to the first book @dense lintel
dense lintel
yep ill read it
desert oar
also great resources:
http://themlbook.com/
https://otexts.com/fpp3/

All you need to know about Machine Learning in a hundred pages. Supervised and unsupervised learning, support vector machines, neural networks, ensemble methods, gradient descent, cluster analysis and dimensionality reduction, autoencoders and transfer learning, feature engineering and hyperparameter tuning! Math, intuition, illustrations, all i...
3rd edition
and definitely start learning linear algebra and calculus if you don't know them already
you will need them in order to understand how this stuff works
sometimes even in order to understand the software documentation
dense lintel
i dunno calculus but i do know linear algebra
 bold timber
whether we should transform the target variable into normal distributions?
desert oar
harsh bear
https://paste.pythondiscord.com/kozoreroja.lua
maybe like this?
import matplotlib.pyplot as plt
import pandas as pd

# Read members from CSV
members = pd.read_csv('members.csv', header=None)
members.columns = ['date', 'count']

# Read servers from CSV
servers = pd.read_csv('servers.csv', header=None)
servers.columns = ['date', 'count']

# Make a new "figure" with two side-by-side plotting areas
# A plotting area is an "axes" in matplolib terms
fig, ax = plt.subplots((1, 2))

# Plot each dataset onto one of the plotting areas
members.plot.bar('date', 'count', ax=ax[0])
servers.plot.bar('date', 'count', ax=ax[1])

# Display the plot
plt.show()
doesn't have to be normal specifically, but if it has a "nicer" distribution it might be easier for the model to learn. normality assumptions are usually about conditional normality anyway, which isn't something you can easily transform to
bold timber
desert oar
doesn't have to be normal specifically, but if it has a "nicer" distribution it ...
I recently seeing a practical use transform to target variable by using logarithmic. And now, I'm confuse
desert oar
bold timber
I recently seeing a practical use transform to target variable by using logarith...
yes, that's a very typical thing to do. if the data is spread over several "orders of magnitude", the logarithmic transformation helps put all the data onto a similar scale
bold timber
desert oar
yes, that's a very typical thing to do. if the data is spread over several "orde...
how do we know when we should use transform for target variable?
desert oar
bold timber
how do we know when we should use transform for target variable?
there's no single rule. but generally if the data distribution crosses several orders of magnitude, you should do something to bring it all within a similar order of magnitude
similarly, if the numbers are very large or very small, you might need to center and scale, e.g. subtract the training set mean and divide by the training set standard deviation
you might want to look into the "box-cox" family of transformations, of which the logarithm is one special case. you can also look into the "inverse hyperbolic sine (IHS)" transformation if your data can be zero or negative
bold timber
desert oar
there's no single rule. but generally if the data distribution crosses several o...
if the target variable have a skewed we should be transform it?
desert oar
yes, heavily skewed data or data with other "weird" statistical properties like "fat tails" can benefit from transformation
square roots are another valid transformation. anything differentiable and monotonic can work

Medium
The real-world data is not always distributed the way we want, that is Normal-Distribution It is always distributed in some distribution…
bold timber
desert oar
you might want to look into the "box-cox" family of transformations, of which th...
yeah I use transform the data by using 'yeo-johnson' in Pipeline but not in target variable. is that true?
serene scaffold
12-year-old me can be quoted saying "I will never understand why I need to know square roots."
desert oar
yes, that is the right way to use it @bold timber . the scikit-learn pipeline will derive the parameters required to perform the transformation from the training set, and it will apply them to the test set
bold timber
desert oar
yes, heavily skewed data or data with other "weird" statistical properties like ...
despite a target variable? isn't target variable should be naturally exist?
desert oar
bold timber
despite a target variable? isn't target variable should be naturally exist?
i don't know what you mean by that
bold timber
desert oar
i don't know what you mean by that
I mean the target variable is should be naturally exist, isn't it?
velvet thorn
bold timber
I mean the target variable is should be naturally exist, isn't it?
ah
you mean
you should leave the target variable unmodified?
primal tulip
drifting mason
like this
There must be something wrong over the way you're trying to plot the second graph. Read a bit on duplicating the same axis in matplotlib. If I recall correctly it would be something like declaring the first ax, then call a special method for the second ax variable and assigning both with different labels.
import pandas as pd
import matplotlib.pyplot as plt

df = pd.DataFrame(<the data you are using>)

fig, ax = plt.subplots()

ax.barplot(df[col_1])
ax2 = ax.twinx()

ax2.barplot(df[col_2])

plt.plot()
plt.show()
Read on '''ax.twinx()'''. I hope it's enough to point you in the right direction, I can't help more than that right now.
@drifting mason
bold timber
velvet thorn
you should leave the target variable unmodified?
Yes, that's right
velvet thorn
bold timber
Yes, that's right
not necessarily
okay
think about this
say you have 3 predictors
x1, x2, x3
and a target, y
imagine if you just perform a logarithmic transformation
so
now your predictors are
ln x1, ln x2, ln x3
against y
that's the same as
x1, x2, x3 against e^y
right?
bold timber
velvet thorn
not necessarily
Despite of target variable have a skewed?
velvet thorn
bold timber
Despite of target variable have a skewed?
read my example
and tell me if it makes sense
 warm valley
Hello, I am having trouble filtering a data frame,
I am using it on text classification,
mask = np.logical_and(y_pred_class==5, y_test==1) #Both of these are np array cond= x_test[mask] #x_test in np array with text reviews[reviews['Text'].isin(cond)].
I am specifically telling, I want those values whose predicted is 5 and original is 1, even then the last code is returning those with original value 5
bold timber
velvet thorn
imagine if you just perform a logarithmic transformation
In this case only transformation for predictors?
bold timber
velvet thorn
right?
And then?
desert oar
@bold timber you can transform the target variable, as long as you can also un-transform it to get predictions
so transformations should also be invertible as well as monotonic and differentiable
bold timber
desert oar
<@!786960616664727572> you can transform the target variable, as long as you can...
If I not use transform and only use cross validation that's okay?
velvet thorn
desert oar
so transformations should also be _invertible_ as well as monotonic and differen...
hold up
doesn't invertibility imply strict monotonicity?
velvet thorn
desert oar
<@!786960616664727572> you can transform the target variable, as long as you can...
actually is that true?
I mean like you can group outcomes, for example, right
worldly lake
@velvet thorn, oh, thank u, i started learn groupby() from itertools, but gonna use ur method too. thanks 😉
 lusty stag
say I have data from 50 users and I want to normalize features before training
should I fit on 1 user and transform the rest? or fit on whole?
 vale hedge
Pretty new to unstructured learning. I want to cluster some text then I want to order clusters and samples in a 1D list. I'm wondering if there are any packages to help do something like this. (Mainly wondering about last part in ordering in 1D)
drifting mason
primal tulip
There must be something wrong over the way you're trying to plot the second grap...
Thanks, I will try that out
desert oar
vale hedge
Pretty new to unstructured learning. I want to cluster some text then I want to...
order them how?
that is: what would be a good ordering in your use case? there's no package for this because there's no general-purpose definition of an ordering on clusters
vale hedge
desert oar
order them how?
Order them by distance. But doesn't matter if they are first or last. Just need something that somewhat makes sense.
Maybe optimizing like traveling salesman would be nice but I don't need it
 foggy blade
Hey anybody able to recommend a more advanced natural language processing resource than what I could find? The YouTube videos are quite introductory. I wouldn't mind diving into some maths
vale hedge
foggy blade
Hey anybody able to recommend a more advanced natural language processing resour...
What did you find and what packages did you work with?
And what problem are you trying to solve
foggy blade
@vale hedge first I started with NLTK, basic youtube guide for sentiment analysis and a few other topics. I'm really interested in generation, ie something in the lines of a generative neural network but for nlp. I'm not sure how it would work for NLP. I was inspired by all of these copywriter ai startups. I'd love to delve into that, even if just to understand it rather than have an effective model
but the guides on youtube are basically just do this and parrot learn. A book would be nice, but they all seem really outdated.
Maybe papers?
I have tons of machine learning with classic machine learning and neural networks. Not so much with NLP haha. It just seems fun
vale hedge
You want to look into transformers: GPT-3 or perhaps bert
foggy blade
But isn't GPT-3 like beta exclusive? I signed up on open.ai a while ago, but as far as I understand it, it's quite difficult to get in if you're not gonna provide them with an income.
I'll check out bert
vale hedge
GPT latest version is not public so you might look into some variants
vale hedge
I think gpt-2 is public and you can download a fully pretrained model to use it. Not sure about API.
foggy blade
Nice I just found it. Epic. I thought it was all proprietary. Thanks man! Will definitely check our BERT too. Looks pretty cool.
Thanks!
vale hedge
Np gl it's pretty interesting stuff
foggy blade
I can imagine!
vale hedge
For a lot of these models you usually start with pretrained models for general text. You can also train on specific types of text or corpora if you want it to specialize in different types of language.
desert oar
vale hedge
Order them by distance. But doesn't matter if they are first or last. Just nee...
Distance from what exactly?
 slender sand
Don't want to torpedo a conversation here but can ya'll stomach a noob question? I'm new to ML/DS and really don't want to put bogus findings in front of my boss.
desert oar
slender sand
Don't want to torpedo a conversation here but can ya'll stomach a noob question?...
That's what this channel is for, go ahead
slender sand
much apprecciated
I've got your basic ecomm dataset and I'm trying to find out if there are one or more features that lead to a sale/no sale outcome. Been using Random Forest Classifier, which gives me a pretty wild (overfit?) accuracy of 99%, 80% on cross-val. The #1 feature (price) scores 23 in feature importance. So far so good, I feel.
But if I run a point biserial correlation on that feature and the Y/N purchase goal, it's totally untethered
does that just mean it's not a contributing factor? or have i botched something
vale hedge
desert oar
Distance from what exactly?
Er I think the basis for clustering is distance. So that distance. Like a cluster can have a centroid so then I want to use the distance to another centroid.
slender sand
Like maybe price is the most important, but still not really that telling in the actual outcome?
desert oar
vale hedge
Er I think the basis for clustering is distance. So that distance. Like a clus...
the basis of (most) clustering algorithms is the distance between points, not the distance from some particular point to every other point
it would help if you explained why you want this and what you're trying to achieve
desert oar
slender sand
But if I run a point biserial correlation on that feature and the Y/N purchase g...
don't forget that correlation is a linear phenomenon, and that a pairwise correlation is a lot like an average over the entire dataset. what if there is a non-linear relationship that depends on other variables in the data? maybe price is very meaningful once you account for market segment, or maybe it's only meaningful in certain segments but not others
you might want to look at mutual information instead of correlation, for example
scikit-learn has a routine for it
slender sand
oh?
desert oar
https://scikit-learn.org/stable/modules/generated/sklearn.feature_selection.mutual_info_classif.html

scikit-learn
slender sand
and this would still ultimately be measuring those two "columns"
desert oar
yes, but mutual information is more general than correlation - it (attempts to) measure the statistical dependence between two variables, not necessarily linear dependence
but it won't help with the conditional dependence issue - that's essentially what all models do, learning conditional dependence structures
slender sand
so then I can't defensibly say "changing price X% will have Y effect", because it seems to be a certain perfect storm of other features that lend it that oomph!
lapis sequoia
anyone know how to get a deep learning ai with tensorflow and tkinter to respond to a message by the user like a chat bot
vale hedge
desert oar
it would help if you explained why you want this and what you're trying to achie...
I want to display all samples as 1D list similar to text segmentation (rather than visualize in higher dimensional space). So then I can look at text representation and as well as for evaluating performance.
If you don't know of anything then it's fine. I can just try to look or test some solutions out by myself.
desert oar
slender sand
so then I can't defensibly say "changing price X% will have Y effect", because i...
you can recover an "average effect" of sorts with a technique called partial dependence
look up "partial dependence plots" and also techniques for model explainability like LIME and SHAP
desert oar
vale hedge
I want to display all samples as 1D list similar to text segmentation (rather th...
one option is to use something like multidimensional scaling, principal components, or some other dimension reduction that can emit 1 dimension
"text segmentation" isn't something you can usually visualize as a 1-d list either, unless you mean visualizing the sequence of segmented sections of text? which would require you to define some notion of "sequence"
i'm asking these questions because the task is ill-defined, not because i'm trying to dodge giving an answer
vale hedge
I am trying to do some kind of topic modeling. The primary feature from my understanding should be some description that describes the topic. I want it in 1D list so I can look at a line of descriptions.
desert oar
ok, that helps clarify more
are you looking at topics for each document? if so, you can sort by relevance to the document
otherwise you can sort by frequency or total score across the dataset or something
if you want to try to put topics on some kind of 1-d spectrum, then i recommend what i recommended above: multidimensional scaling or pca
vale hedge
From what I understand PCA is based on orthogonality.
So (3,0) and (0,3) might get reduced to 3. But that is not what I want to do.
I want to find closest distance so (3,1) should be closer to (3,0)
desert oar
i still don't really know what you're asking or how that relates to "I want it in 1D list so I can look at a line of descriptions."
and (3, 0), (0, 3) might get reduced to 3 and 0 with 1-d PCA
stark zenith
How do I return a dataframe, but only for rows that have a value in the last column?
desert oar
stark zenith
How do I return a dataframe, but only for rows that have a value in the last col...
by "have a value" do you mean "not null"? do you know the column name, or do you want to do it by the position of the column (not usually something you want to do)?
stark zenith
Yes, not null, and by the position of the column as last column.
@desert oar
I'm hoping to use it to pull values from different pages of a report that is being made.
desert oar
last_column = data.iloc[:, -1]
last_column_has_value = last_column.notnull()
data = data.loc[last_column_has_value].copy()
i broke it into 3 steps so you can see what the individual sections are. you can of course write this as a one-liner. note the use of .copy() after subsetting with .loc - it isn't strictly necessary, but if you are making any "in-place" changes to the dataframe later in the code, this will avoid warnings about "setting a copy on a slice"
stark zenith
desert oar
```python
last_column = data.iloc[:, -1]
last_column_has_value = last_column.not...
Thanks! Yeah, I'm aware of the perils of slicing views vs copies. I'll give this a shot. I appreciate the help!
 glad tundra
Hey can anyone tell why why there is significant difference between the loss function of sklearn's linear regression and my own coded linear regression algorithm?
 quiet vault
So I have data normalized or scaled between 0 and 1
For some reason my model is predicting 2
and then i turn up the scaling range to like 50, it starts predicting in the 60s
does someone know why this happens
prime hearth
depends, scaling shouldnt affect output in this sense
what haopens when you dont scale
it might be maybe using more output labels somewhere in code and depends the algo and how it is implemented
lapis sequoia
can someone fill me in on what kernel density estimation plots are for.. when trying to understand distribution of data
 feral lodge
It gives a smoother plot of the data than a histogram would and tries to fill in the gaps
The density estimation itself can also be used for sampling new points, and compute likelihood values at arbitrary data points. Which can be used to build a bigger model, composed of several smaller ones
Imo the plots themselves are much less interesting than the sampling and likelihood aspects. It can be very useful to construct a probabilistic model of your data points
 fading quarry
how can i change the column name of my dataframe? I have old name and new name in a csv file?
vale hedge
quiet vault
and then i turn up the scaling range to like 50, it starts predicting in the 60s
Would you happen to be accidentally scaling the Y some how as well? It sounds like a very abnormal situation.
 edgy brook
Hey guys! I'm a bit new to data science but has anyone here got an example of a graph that shows 4 attributes? It could be about anything as I haven't really got a clue on how to visualise it. There's this one I had found but it's only for 3, i think

 quasi parcel

RapidAPI
WeatherAPI.com is a powerful fully managed free weather and geolocation API provider that provides extensive APIs that range from the weather forecast, historical weather, IP lookup, and astronomy through to sports, time zone, and geolocation.
you can use api @slate verge
Hi i have a trouble in this code, like i have to even consider customer_ids but the customer_ids are encrypted so if there is encrypted string this line of code is working or else its not working there is an error saying attribute error how to pass this
https://paste.pythondiscord.com/ixepotupox.pl in this snippet we have line 9 i need to consider even if the customer_id is empty
how can i do that
please do help
thank you
feral lodge
@edgy brook your type of plot is called a scatter plot. For more than 2 variables, people usually use a scatter plot matrix. That's just a grid of all possible 2-variable plots. Like this

The colors on those plots are class labels. So they have 3 classes of flowers, and 4 properties of the flowers
 old grove
Hi Guys Can anyone help me with this ?
What's The difference Between Data Scientist and Bussiness intelligence analyst or ba,data analyst.
I mean whatever you say the base goal work is on finding useful insights and relevant information,target audience to provide the insights found to benifit Bussines so What's different in each or they are just names given ?
 tiny geyser
old grove
Hi Guys Can anyone help me with this ?
What's The difference Between Data Scien...
tiny geyser
old grove
Hi Guys Can anyone help me with this ?
What's The difference Between Data Scien...
I'm not sure there is a formal definition but I'd expect a data scientist to be expert in advanced statistics and artificial intelligence (ML, deep learning, algorithms, text mining etc) and I'd expect a BI analyst to be more geared towards data visualisations and domain knowledge (dashboards, tools like tablau, Qlik etc) with basic stats knowledge
old grove
tiny geyser
I'm not sure there is a formal definition but I'd expect a data scientist to be ...
so data science is Doing visualizations to determine past and present insights as well use ml model to predict future information and use that insight to benifit business.
Bi/da analyst will look only for visualization using Tableu,Power Bi and focus on visualization and get insights from the data present to benift the Bussiness and thats it
Am i correct ?
 floral junco
hey does anyone know how to make a sentence generator?
eager imp
there are different approaches
what kind of sentences?
NLTK can help with meaning, structure etc
if you want to produce sentences that look legitimate without further concern of meaning, you'll probably want to go the GPT road
combining both approaches would be the king's discipline, but i'm not aware of any project that got there yet (successfully)
there's of course the simplest approach of all
templates
edgy brook
feral lodge
The colors on those plots are class labels. So they have 3 classes of flowers, a...
I see.. thank you! Just wondering that if it was in 1 class of flower, would it still be a scatter matrix or just just a normal scatter line graph?
eager imp
floral junco
hey does anyone know how to make a sentence generator?
does that answer your question?
floral junco
well it uses noam chomsky's phrase structure
tiny geyser
old grove
so data science is Doing visualizations to determine past and present insights a...
I'd agree. BI analysts usually 'look back' where as DS's will be predicting the future
eager imp
floral junco
well it uses noam chomsky's phrase structure
what is "it"?
floral junco
this is what the sentence generator will use as a base for the sentence structure
 eager imp
is that some kind of homework?
floral junco
thats the thing im a bit new to python and i dont know where to start with this sentence generator
eager imp
ah
well, then you should read the NLTK book
it also covers sentence generation afaik
floral junco
ill check it out thanks
feral lodge
@edgy brook it would still be a scatter matrix. If we have 4 variables, we always end up with a 4x4 matrix like in the previous picture. No relation to the number of classes at all 🙂 here's another example with 3 variables without the class coloring

The reason they added colors is just to make extra clear that certain flower types cluster in certain ways when we plot their properties against each other. A common use case of scatter plots is to see which features (variables) are the most useful for separating classes.
lapis sequoia
Anyone familiar with azure formfields? any idea how to turn that into a dataframe? Im stuck
I can turn it into a dictionary, but then it puts all the values on one line
in the dataframe
Im so confused, cant find anything online.
next lance
The more the smaples we give to train the AI the more better it becomes then why don't Google uses sooooo many images for training Google lenses
next lance
lapis sequoia
thats not what I asked
It is my question!! 😄

 humble spade
i am doing a classification problem and when I visualize the features with the hue being the class i found 2 classes overlapped on each other HOW can i separate them??
or is it not possible ?
desert oar
lapis sequoia
I can turn it into a dictionary, but then it puts all the values on one line
what does the dict look like? it's usually possible to turn a dict into a dataframe
desert oar
is there a schema for it?
lapis sequoia
what do you mean?
serene scaffold
lapis sequoia
what do you mean?
If it's nested consistently
lapis sequoia
No idea
the dataframe.from_dict just puts random column names, and all of the values and keys on on cell
one cell
desert oar
lapis sequoia
the dataframe.from_dict just puts random column names, and all of the values and...
well yeah that's because it's guessing
what is the format of the data?
lapis sequoia
its a formfield, that i turn into a dict
How can i choose which column and data to put in the dataframe from dict?
desert oar
i'm asking you to provide more details
what's the format of the data? what are the keys? how many are they? what is the nesting structure? are there lists of things anywhere in there? etc. etc.
if you give an illustrative example that would be even better
lapis sequoia
ok hold on
its too big to paste here
Ill show a tiny part of it then
dont have nitro
bold timber
how to switch the plot from bottom to top?
 lapis sequoia
Item table: {'1': FormField(value_type=dictionary, label_data=None, value_data=None, name=1, value={'Description': FormField(value_type=string, label_data=None, value_data=FieldData(page_number=1, text=mercedes, bounding_box=[Point(x=2.505, y=4.96), Point(x=3.77, y=4.96), Point(x=3.77, y=5.08), Point(x=2.505, y=5.08)], field_elements=None), name=Description, value='bmw', confidence=1.0), 'Quantity': FormField(value_type=float, label_data=None, value_data=FieldData(page_number=1, text=30,00, bounding_box=[Point(x=5.91, y=4.975), Point(x=6.255, y=4.975), Point(x=6.255, y=5.095), Point(x=5.91, y=5.095)], field_elements=None), name=Quantity, value=3000.0, confidence=1.0), 'Amount': FormField(value_type=float, l
@desert oar
where i want columns to be Description, quantity, amount etc, and data for them to be mercedes, bmw etc etc
desert oar
ok, and this item table 1 is one whole dataframe, right?
lapis sequoia
item table is the dictionary/formfield
desert oar
bold timber
how to switch the plot from bottom to top?
swap the order of the cells?
lapis sequoia
its some kind of strange hybrid made by azure
desert oar
that's not what i'm asking. i see {'1': ... indicating that there are more of these things
lapis sequoia
Ah yes, that is row number 1
and it repeats
row 2, same columns etc etc
i couldnt paste the entire thing
desert oar
that's fine, i don't need it. i just need a sense of the structure
!paste we do however have a "paste site" for bigger files 👇
arctic wedgeBOT
Pasting large amounts of code
If your code is too long to fit in a codeblock in discord, you can paste your code here:
https://paste.pythondiscord.com/
After pasting your code, save it by clicking the floppy disk icon in the top right, or by typing ctrl + S. After doing that, the URL should change. Copy the URL and post it here so others can see it.
desert oar
just fyi in the future
lapis sequoia
oh ok thanks
but the structure is the same, if you stop at quantity as the last one
to keep it simple
desert oar
first thing i do in this situation is re-format the data to make the nesting structure visually clear
lapis sequoia
Exactly, and how in the world would I do that
lapis sequoia
I only want, Key and value not all of the rest
desert oar
and format it with indentation
lapis sequoia
Manually?
desert oar
otherwise i don't have a damn clue what's in here if it's not visually formatted
if you have to, sure
bold timber
desert oar
swap the order of the cells?
it doesn't works
lapis sequoia
You mean how I want it to be?
desert oar
no i mean take the data that you have and give it indentation so you can see the nesting structure
desert oar
Item table:
{
  '1': FormField(
    value_type=dictionary,
    label_data=None,
    value_data=None,
    name=1, value={
      'Description': FormField(
        value_type=string,
        label_data=None,
        value_data=FieldData(
          page_number=1,
          text=mercedes,
          bounding_box=[Point(x=2.505, y=4.96), Point(x=3.77, y=4.96), Point(x=3.77, y=5.08), Point(x=2.505, y=5.08)],
          field_elements=None),
          name=Description,
        value='bmw',
        confidence=1.0),
      'Quantity': FormField(
        value_type=float,
        label_data=None,
        value_data=FieldData(
          page_number=1,
          text=30,00,
          bounding_box=[Point(x=5.91, y=4.975), Point(x=6.255, y=4.975), Point(x=6.255, y=5.095), Point(x=5.91, y=5.095)],
          field_elements=None
        ),
        name=Quantity,
        value=3000.0,
        confidence=1.0),
      'Amount': ...
ok, progress
now the question is: how, conceptually, does this need to look when you flatten it?
what columns do you want?
bold timber
bold timber
how to switch the plot from bottom to top?
I mean switch the line plot
desert oar
bold timber
I mean switch the line plot
be more specific
 swift mist
does anyone here knows how to decrypt caesar cipher?
 clever island
Hi everybody ! I have a quick (I hope) question on how to store ML coeff in a database. I'll have to store an unknown number of point who are vectors of dimension ~300. It feel way too bruteforce to declare a table with 300 column but don't find much 'good practice' with some search.... Any Idea ? Is it legit to have so many columns ?
lapis sequoia
@desert oar oh you fixed it for me, okay well what is the next step here?
desert oar
lapis sequoia
<@!389497659087650836> oh you fixed it for me, okay well what is the next step h...
now the question is: how, conceptually, does this need to look when you flatten it?
desert oar
clever island
Hi everybody ! I have a quick (I hope) question on how to store ML coeff in a da...
what database? postgresql for example supports array-valued columns
 gray tartan
Hey everyone ! I'm having an horribly weird bug with pandas
I'm basically trying to do a df.groupby(["A", "B"], sort=False, as_index=False).apply(some_lambda)
And sometimes the dataframe that the lambda gets has its columns shifted, like it doesn't have A and B columns anymore, but their value goes in later columns, which is ultra weird
I thought it was a bugged version issue at first but i can't even reproduce it in a python console using the same interpreter and the same packages versions, the same code applied on the same exact dataframe returns me the expected result
(sry if i'm interrupting stuff, i can always ask it in an help channel but it's quite urgent :/, thanks for the help !)
lapis sequoia
I only need 'Description' and bmw
desert oar
swift mist
does anyone here knows how to decrypt caesar cipher?
see #algos-and-data-structs but this sounds like a homework question, so keep our rules in mind
lapis sequoia
and like, quantity and 3000 and so on
bold timber
desert oar
be more specific
the line plot from higher value to lower value as a life expectancy, how to switch the line plot from lower value to upper value against life expectancy?
desert oar
gray tartan
Hey everyone ! I'm having an horribly weird bug with `pandas`
I'm basically tryi...
can you post a reproducible example? what is "sometimes"? that would be a very weird bug indeed, but the standard of evidence for a bug like that should be high
gray tartan
desert oar
can you post a reproducible example? what is "sometimes"? that would be a very w...
well i can't reproduce it myself :/ but i can show you an input and output
(that's what i mean by "sometimes")
desert oar
bold timber
the line plot from higher value to lower value as a life expectancy, how to swit...
maybe reverse the order of the rows in the dataframe? sns.lineplot(..., data=a.iloc[::-1])
desert oar
gray tartan
well i can't reproduce it myself :/ but i can show you an input and output
that's a start
lapis sequoia
@desert oar Basically, i want to make it readable by the dataframe.from_dict
desert oar
lapis sequoia
<@!389497659087650836> Basically, i want to make it readable by the dataframe.fr...
you're thinking about this backwards. don't try to hammer this into one particular function that you think you need. instead think of "what columns do i need in my dataframe?", then figure out how to make that happen
lapis sequoia
Yeah, and Im stuck, ive tried it all
I tried looping through but that didnt work either
Im so confused
gray tartan
desert oar
that's a start
should i put it there or open an help channel ?
desert oar
gray tartan
should i put it there or open an help channel ?
here is fine, it's pandas
bold timber
desert oar
maybe reverse the order of the rows in the dataframe? `sns.lineplot(..., data=a....
still doesn't works
 desert oar
bold timber
still doesn't works
desert oar
bold timber
still doesn't works
that was a bad suggestion 😆 let me see if there's a way in seaborn
@lapis sequoia stop thinking about code! be specific about what you want in the dataframe. you said "description", but "description" is itself a big nested blob of stuff, so that doesn't help
arctic wedgeBOT
:incoming_envelope: :ok_hand: applied mute to @gray tartan until <t:1633439500:f> (9 minutes and 59 seconds) (reason: newlines rule: sent 111 newlines in 10s).
desert oar
!paste @gray tartan
arctic wedgeBOT
Pasting large amounts of code
If your code is too long to fit in a codeblock in discord, you can paste your code here:
https://paste.pythondiscord.com/
After pasting your code, save it by clicking the floppy disk icon in the top right, or by typing ctrl + S. After doing that, the URL should change. Copy the URL and post it here so others can see it.
desert oar
<@&831776746206265384> can we unmute our hapless friend? ☝️
lapis sequoia
 desert oar
lapis sequoia
https://tenor.com/view/calculating-puzzled-math-confused-confused-look-gif-14677...
desert oar
lapis sequoia
https://tenor.com/view/calculating-puzzled-math-confused-confused-look-gif-14677...
ideas first, code second
 zenith nova
!unmute 165918545975181312
arctic wedgeBOT
:incoming_envelope: :ok_hand: pardoned infraction mute for @gray tartan.
lapis sequoia
You are basically saying that there is no way to get that into a dataframe
desert oar
i'm serious, this is how you have to solve these kinds of problems
gray tartan
thanks, i thought it'd be ok since it wasn't so big :/
desert oar
lapis sequoia
You are basically saying that there is no way to get that into a dataframe
no, that is not at all what i am saying. i am saying that there is no generic all-purpose magic one-and-done way to get that into a dataframe. you need to use your brain to come up with a mapping between "things in that form field" and "columns in a dataframe", and then you can write code to implement that mapping.
lapis sequoia
@desert oar I see. I came here when my brain ran out of ideas.
zenith nova
gray tartan
thanks, i thought it'd be ok since it wasn't so big :/
no worries, it was just a liiitle bit too big. Best to use paste for it anyway
gray tartan
so here's the input dataframe (in records orient)
https://paste.pythondiscord.com/yowuhevavu.json
here's the code
new_dates_impact_df.groupby(
                ["deviceCategory", "segment"], sort=False, as_index=False
            ).apply(
                lambda dates_df: print(dates_df.to_dict(orient="records"))
            )
and here's the output of the first group
[{'date': '2021-10-03', 'users': 'desktop', 'transactions': 'A_buyers', 'transactionRevenue': 366}]
but when i try to reproduce it, i get, as expected :
[{'date': '2021-10-03', 'deviceCategory': 'desktop', 'segment': 'A_buyers', 'users': 1830, 'transactions': 1311, 'transactionRevenue': 32129.88}]
how to solve?
desert oar
bold timber
how to solve?
try ax.invert_axis
desert oar
lapis sequoia
<@!389497659087650836> I see. I came here when my brain ran out of ideas.
so back up. what individual specific pieces of data do you want?
something like this:
for each car in this dataset, i need X Y and Z specific fields
lapis sequoia
Yes but this nested mess
If description, amount and quantity were at the same location I would fix it
desert oar
lapis sequoia
but its so messed up
desert oar
lapis sequoia
If description, amount and quantity were at the same location I would fix it
do you see how much shit is in Description? you're not answering my question. what parts of that field do you need?
you just keep complaining how it's a mess
of course it's a mess, and it's your job to unfuck it
serene scaffold
 lapis sequoia
 serene scaffold
data-science-and-ai-and-gifs
gray tartan
gray tartan
so here's the input dataframe (in records orient)
https://paste.pythondiscord.co...
To add informations to it, as i think it is a pandas or an environment bug, idk how it could happen otherwise : i have version 1.3.3 of pandas in both contexts.
Both are ran on the same machine, the bugged one being ran with uvicorn and the ok one with a standard python console
desert oar
gray tartan
To add informations to it, as i think it is a pandas or an environment bug, idk ...
👀 if you can reproduce it with uvicorn, maybe file a bug report? that's super weird
bold timber
desert oar
<@!786960616664727572>
https://matplotlib.org/stable/api/_as_gen/matplotlib.axe...
still doesn't work, any clue?
desert oar
bold timber
still doesn't work, any clue?
show your code
"doesn't work" is a phrase that "doesn't mean anything" to me
bold timber
desert oar
show your code
 gray tartan
I reproduce it with uvicorn each time, but idk to who file the bug exactly :/ pandas github ?
desert oar
gray tartan
I reproduce it with uvicorn each time, but idk to who file the bug exactly :/ pa...
yes
desert oar
bold timber
...you didn't call the function, you just wrote the name of it with ; after it
bold timber
desert oar
...you didn't call the function, you just wrote the name of it with `;` after it
I wrote the function
 gray tartan
ok i'm gonna make a standalone script runnable with uvicorn that reproduces it and send that...
That's so annoying since it's blocking me from deploying my stuff to production 
eager imp
desert oar
of course it's a mess, and it's your job to unfuck it
data science: 90% data unfucking 10% science 😉
gray tartan
more like 99% 0.5%
and 0.5% of package weirdness 👀
gray tartan
ok, i just ran it with pandas 1.2.5 and it works fine
so it affect one of the later versions
desert oar
lapis sequoia
If description, amount and quantity were at the same location I would fix it
ok here: if you just want the text value and you want to ignore all the other shit like the bounding box, you can do this (and i really hope i'm not doing your homework for you):
data_flat = {}
for record_id, formfields in table.items():
    record = {}
    record['Description'] = formfields.value['Quantity'].value
    record['Quantity'] = formfields.value['Quantity'].value
    record['Amount'] = formfields.value['Amount'].value
    data_flat[record_id] = record

data = pd.DataFrame.from_dict(data_flat, orient='index')
but this is also largely a guess, i have no idea what the actual API for this python code is
desert oar
gray tartan
so it affect one of the later versions
i wonder if this is some weird thread-safety/concurrency issue
eager imp
oh man, how much time i wasted on convoluted, badly documented inconsistent xml metadata to extract useful data
lapis sequoia
@desert oar im 30 years old I dont have any homework, thank you Ill give it a try.
desert oar
lapis sequoia
<@!389497659087650836> im 30 years old I dont have any homework, thank you Ill g...
we get lots of university students and teenagers here begging for homework help, it wasn't meant to be a dig at you
eager imp
i wonder if there's an online tool that lets you pick WYSIWYG-style and generates that kind of extraction code
gray tartan
desert oar
i wonder if this is some weird thread-safety/concurrency issue
well there is already a known bug with groupby if you don't use as_index=False
the first few groups generated does have the group keys as column until it's cached and you get them only as index/name after then
i wonder if it's linked to that
actually it's not really a bug since having as_index=True means you expect to get the group keys as index/name anyway, but still, it's pretty weird behavior
clever island
desert oar
what database? postgresql for example supports array-valued columns
Sorry missed your reply, had a meeting.... we are on mariadb
 prisma mulch

Deepmind
This post presents WaveNet, a deep generative model of raw audio waveforms. We show that WaveNets are able to generate speech which mimics any human voice and which sounds more natural than the best existing Text-to-Speech systems, reducing the gap with human performance by over 50%. We also demonstrate that the same network can be used to syn...
this seems quite interesting
desert oar
gray tartan
well there is already a known bug with `groupby` if you don't use `as_index=Fals...
the first few groups generated does have the group keys as column until it's cached and you get them only as index/name after then
really? that's strange. this is only in 1.3.x? you're saying that if i doas_index=Trueit will omit the group columns from the individual groups in the first few groups? wtf.
desert oar
clever island
Sorry missed your reply, had a meeting.... we are on mariadb
you can use an array in a json column then, not sure about the performance implications though
clever island
desert oar
you can use an array in a json column then, not sure about the performance impli...
kind of what I was thinking... and the details I was hopping someone here know..
thanks for your response !
bold timber
What is the best chart for discrete and continuous variables?
desert oar
bold timber
What is the best chart for discrete and continuous variables?
there's no single best chart, it depends on how many discrete levels you have, among other things. what are the variables?
bold timber
desert oar
there's no single best chart, it depends on how many discrete levels you have, a...
total adult mortality (discrete) vs life_expectancy (continuous)
gray tartan
desert oar
> > the first few groups generated does have the group keys as column until it's...
na the contrary, it will put them with as_index=True
GitHub
Code Sample, a copy-pastable example if possible nth doesn't inlcude group key as the same as first and last. df = pd.DataFrame({'A': [1, 2, 3, 4, 5], 'B': [...

GitHub
I found another oddity while digging through #13966. Begin with the initial DataFrame in that issue: df = pd.DataFrame({'A': [1] * 20 + [2] * 12 + [3] * 8, 'B': np.a...
 waxen girder
I have a Boolean series and I'm looking to copy a value in the column if my condition is true, how can I do this?

My data isn't tidy and I'm trying to make it so.
I'm pattern matching the first name row and I want to copy first name, last name, and date into their own separate columns matching the row number they come from.
 scarlet bronze
 desert oar
@waxen girder can you give an example of the output you want from this? i don't understand the example
scarlet bronze
I have data like this, i want to plot the contour line of temperature on the map do any one best libraries fot this?
waxen girder
@desert oar So far I want something like this:

But I'm getting an issue:

So I probably should be making a copy not a view.
desert oar
waxen girder
But I'm getting an issue:
how did you create ex_df2? personally i wouldn't try to read this all into one big df, i would read each "sub-table" separately, using row offsets to only read the rows i needed (skip_rows and nrows)
waxen girder
The issue is the tables are not uniform, each "sub-table" has it's own size.
desert oar
how many of them are there?
waxen girder
~6k
going off how many first, last and date categories there are.
each tuple of (first, last, date) corresponds to it's own sub-table.
it's possible to do it in one dataframe.
desert oar
oh that's a fuckton
at that point i might consider loading this all into a list and pandas-ifying it at the end
waxen girder
There's a solution posted, I was trying to go at it before watching. I feel like I need to concede.
desert oar
waxen girder
But I'm getting an issue:
well to answer this specific question: you can use .copy() after .loc[] defensively to avoid this issue
arctic crown
@serene scaffold can i dm you?
serene scaffold
arctic crown
<@!253696366952316929> can i dm you?
technically yes, but I won't be able to respond for a while
it's best to put questions here so you're not dependent on one person
 arctic wedgeBOT
Here's how to format Python code on Discord:
```py
print('Hello world!')
```
These are backticks, not quotes. Check this out if you can't find the backtick key.
serene scaffold
what are you trying to do, anyway?
arctic crown
learning tf
# Load dataset.
dftrain = pd.read_csv('https://storage.googleapis.com/tf-datasets/titanic/train.csv') # training data
dfeval = pd.read_csv('https://storage.googleapis.com/tf-datasets/titanic/eval.csv') # testing data
# print(dftrain.head()) shows the first 5 lines/entries in the traning dataset
y_train = dftrain.pop('survived')
y_eval = dfeval.pop('survived')

CATEGORICAL_COLUMNS = ['sex', 'n_siblings_spouses', 'parch', 'class', 'deck', 'embark_town', 'alone']
NUMERIC_COLUMNS = ['age', 'fare']

feature_columns = []
for feature_name in CATEGORICAL_COLUMNS:
  vocabulary = dftrain[feature_name].unique()  # gets a list of all unique values from given feature column
  feature_columns.append(tf.feature_column.categorical_column_with_vocabulary_list(feature_name, vocabulary))

for feature_name in NUMERIC_COLUMNS:
  feature_columns.append(tf.feature_column.numeric_column(feature_name, dtype=tf.float32))

print(feature_columns)```@arctic crown the first for loop builds up a list of all the text features, the second loop appends all the numerical features to that list
arctic crown
whats does this do?
tf.feature_column.categorical_column_with_vocabulary_list(feature_name, vocabulary)```and this
tf.feature_column.numeric_column(feature_name, dtype=tf.float32)``` solar oar
@keen fable DM me to join a neural network discussion server !
 keen fable
solar oar
<@!421362214558105611> DM me to join a neural network discussion server !
keen fable
solar oar
<@!421362214558105611> DM me to join a neural network discussion server !
Oh you son of a gun! I’m in 😎
quiet vault
vale hedge
Would you happen to be accidentally scaling the Y some how as well? It sounds l...
Yeah I am, even if I don't scale it, it predicts much higher than the output should be
serene scaffold
Has anyone worked with PySpark? This isn't me trying to field a question. I'm just going to be learning how to use it for work and I've gathered that the API design is a bit controversial.
From what I understand, it's a platform for distributing AI stuff?
 pseudo wren
I am currently in a data science bootcamp and am relatively new at python
i feel like i have no issue reading code or understanding it when someone is explaining
but writing is my issue
i completely blank when i have to do it on my own
but i get it when it's in my face
my other classmates in my group have a bit more experience than i do
and i really wanna catch up
serene scaffold
@pseudo wren can you give me an example of something you were asked to do where you were completely blank?
pseudo wren
well for example today
they wanted us to create a lambda function
of a list of our classmates
and randomize them into groups
when asked to write it, i blanked a little and felt like i didn't know the first place to start
i usually understand it when i'm reading it
or someone is explaining
but i just
blank
serene scaffold
I don't quite understand why a lambda would need to be part of that
serene scaffold
suppose you had a list of 15 strings, where each string is a name of a classmate. How would you make that into three lists of five classmates each, where each list is random?
(so not the first five, then the next five, then the next five)
the answer involves import random
pseudo wren
well yeah that part i get
first we import random
we create a list name
and then create a list with strings inside that have the class names in it
serene scaffold
you can just type the solution into the chat, letting students be the list of strings.
serene scaffold
pseudo wren
and then create a list with strings inside that have the class names in it
the class names?
pseudo wren
people in the class
serene scaffold
ah yes.
pseudo wren
for example
import random
class_names = ["Amy", "Adam","Alex",]
etc.
i can get that far
arctic wedgeBOT
Source code: Lib/random.py
This module implements pseudo-random number generators for various distributions.
For integers, there is uniform selection from a range. For sequences, there is uniform selection of a random element, a function to generate a random permutation of a list in-place, and a function for random sampling without replacement.
On the real line, there are functions to compute uniform, normal (Gaussian), lognormal, negative exponential, gamma, and beta distributions. For generating distributions of angles, the von Mises distribution is available.
Similar names: django.random
serene scaffold
hmm, what does random.choice do?
serene scaffold
it just picks one at random, it doesn't "randomize the names"
pseudo wren
it picks one at random
the issue is
i feel like i have trouble writing this
i know what i want to do
but i have a lot of trouble actually getting there
serene scaffold
pseudo wren
i know what i want to do
so, what do you want to do?
pseudo wren
well i want to randomize the list and pull a random name out
i have provided the list
and imported the random module
but i get lost in the syntax ig
serene scaffold
pseudo wren
well i want to randomize the list and pull a random name out
if you pull a random name out with random.choice, does that remove it from the list?
keep in mind that "pull" doesn't have a formal meaning here. We would usually say "select" or "pop".
serene scaffold
pseudo wren
No it doesn’t remove it from the list
so, if you use random.choice, do you understand why this wouldn't solve what you're trying to do?
pseudo wren
The random choice bit was part of a larger problem
Let me see if I can explain
We created a list that has the names of everyone in the class
And we wanted it to randomize it
After we randomized it
We wanted to remove a name from the list
After it had already been chosen
serene scaffold
pseudo wren
And we wanted it to randomize it
what do you mean by randomize it?
pseudo wren
@serene scaffold basically we make a random choice
serene scaffold
no
pseudo wren
to assign someone as group leader
here i'll show the code
team_1 = []
team_2 = []
team_3 = []
while len(team_1) < 6:
team_1.append(random.choice(list_of_names))
for name in list_of_names:
if name in team_1:
list_of_names.remove(name)
while len(team_2) < 6:
team_2.append(random.choice(list_of_names))
for name in list_of_names:
if name in team_2:
list_of_names.remove(name)
while len(team_3) < 6:
team_3.append(random.choice(list_of_names))
for name in list_of_names:
if name in team_3:
list_of_names.remove(name)
team_4 = list_of_names
print(team_1)
print(team_2)
print(team_3)
print(team_4)
velvet thorn
pseudo wren
here i'll show the code
!code
arctic wedgeBOT
Here's how to format Python code on Discord:
```py
print('Hello world!')
```
These are backticks, not quotes. Check this out if you can't find the backtick key.
pseudo wren
velvet thorn
!code
thank u
velvet thorn
👋
serene scaffold
@pseudo wren
import random

random.shuffle(list_of_names)

team_1 = list_of_names[:5]
team_2 = list_of_names[5:10]
team_3 = list_of_names[10:]
i tried that but my group didn't think it was a good idea
serene scaffold
why not
pseudo wren
Don’t know!
Idk I have a lot more practice to do
But for rn I’m feeling pretty defeated
serene scaffold
pseudo wren
But for rn I’m feeling pretty defeated
I wouldn't worry about it. just keep coding and it will come together
pseudo wren
Eh it’s week 4
serene scaffold
the worst code you'll ever see will be your own
pseudo wren
And I’m not feeling too much closer