Hello, i have been working on a project to extract text from various invoices and convert it to json
So far i have tried pdfplumber, pymupdf to extract the text
I am stuck with this project. As the invoices keep changing i cant understand how i should go about it.
Pdf plumber extracts the text from left to right and not top to bottom and I'm unable to tackle that either
Looking for guidance and help with this.
#data-science-and-ml
1 messages · Page 344 of 1
 wicked grove
 desert oar
Yeah it really changes how you think of pandas. I never thought of it that way until I was teaching pandas to a coworker and they had that realization. That's how I explain it from now on
 uncut barn

how would I make my model stop when it reaches above 0.5
as if I dont have a patience argument it stops at the first epoch
desert oar
wicked grove
Hello, i have been working on a project to extract text from various invoices an...
PDFs really suck, it's a hard problem. You might have more success using some kind of OCR on the PDF instead of trying to actually extract the text, if the text is not extracting cleanly
What information do you already have?
 river plume
Not sure if this is the right place to ask - looking to help open source maintainers in developing/implementation of AI models
Is it against the terms of this server?
 bronze lichen
You want to contribute to some open source code?
I mean its not against the terms of the server to say that
Are you asking for open source projects to contribute to? Thats not against the server either..
Or are you asking for someone to contribute to your project
river plume
Alright
bronze lichen
Yeah if your looking for open source, Github makes more sense
Just scrolling through the results
Then read the contributing rules :)
river plume
AI engineer with 2 years exp here - anyone looking for devs to help in the development of models, feel free to ping me
bronze lichen
Non paid right?
Well you said open source, so yeah
Because Paid work is against the rules 😉
river plume
Non paid, completely free
river plume
Back here because of hacktoberfest - when I was in college, there is one amazing dude who taught me so much that time
More than I learnt in college's ML class LOL
Here to return back to the community
 dawn lark
Hey, I'm working on a project where we need to label some videos, we were gonna use CVAT but we have had some issues with setup and documentation and are looking for alternatives. Currently testing UDT, but was wondering if anyone had any experience annotation tools for square annotations in video with interpolation and had any good suggestions
wicked grove
desert oar
PDFs really suck, it's a hard problem. You might have more success using some ki...
Few of the pdfs are computer generated so the text is clean, but with the pdf plumber i am unable to get the text in the same layout
I also don't understand how i should the tackle it when the inputs keep varying
desert oar
wicked grove
Few of the pdfs are computer generated so the text is clean, but with the pdf p...
This isn't really an answer, but at a previous company we had explored something deep learning for this problem, however we didn't get very far and moved on to other things
We were using HTML so it was a little easier than PDF
Such a project is a deep and dark rabbit hole best left to well-funded research teams imo...
wicked grove
Ohhh i had no idea, i was trying it w these pdf parsers
Can i show you my code?
wicked grove
desert oar
This isn't really an answer, but at a previous company we had explored something...
Which deep learning model did you use?
desert oar
I don't know enough about PDF parsing to be of any use in looking at that code
We were developing one from scratch, which was probably the mistake
This was a couple years ago, nowadays there is probably some pre-trained model for HTML
Did you try using OCR?
 ebon lynx
Google OCR is really good
even for business purposes
the only problem you're left with is making sense of what the parsed output it
 uncut dagger
currently learning ML and was recreating: https://towardsdatascience.com/object-detection-with-neural-networks-a4e2c46b4491
But i get vastly different results.
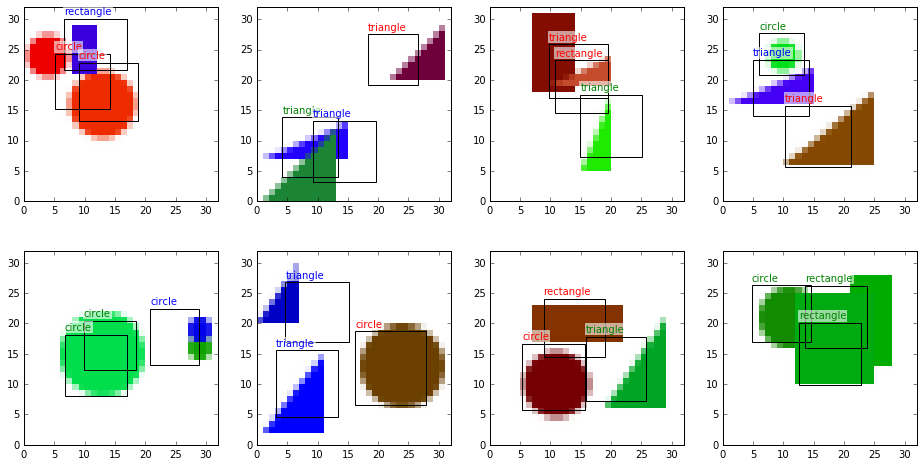
Question is, can hardware/module versions/whatever cause results to VASTLY differ?? (my loss is different by a factor of 10^3)
wicked grove
desert oar
This was a couple years ago, nowadays there is probably some pre-trained model f...
Oh alrightt
Ah i have no idea about that,i have recently started learning ml
wicked grove
ebon lynx
Google OCR is really good
Yess! I used tesseract as my first option but i couldn't really do it with that as the output was bad
wicked grove
ebon lynx
the only problem you're left with is making sense of what the parsed output it
I am unable to understand how i should do this
I am able to extract the text with pdf parsers like pdfplumber but I'm stuck after that
uncut dagger
uncut dagger
https://github.com/jrieke/shape-detection/blob/master/single-rectangle.ipynb
re...
or can someone else run this and see if they get vastly different results (<5mins to do everything on my old laptop) (ping me if you do)
wicked grove
desert oar
Did you try using OCR?
Problem with ocr was,it wasn't able to read everything well
After which i stopped trying with that
 delicate violet
Context
Currently I have a project where I do a bunch of data transformations in pandas and then store and create a excel file with multiple sheets from these data frames using the pd.to_excel method.
However over time as these data frames have been growing in size (excel files close to 100MB and some data frames have 500,000 rows with approx 20 columns) which leads to the python file taking awhile to run and hence excel file takes awhile to form (which I think is majority due to the writing to excel part).
Questions
Is there a better way to do this same process (writing to excel) that can improve this speed?
Note: The data frames need to be sent as an excel file (cant do a csv option etc)
Perhaps via another method or a different library which is designed to handle lots of rows etc.
desert oar
i don't think writing 500k rows to excel is going to be fast ever
pandas internally uses openpyxl by default, maybe engine = 'xlsxwriter' is faster but i have no idea
you might be better off writing to csv and then importing to excel afterwards?
wicked grove
wicked grove
Problem with ocr was,it wasn't able to read everything well
After which i stoppe...
Once i get the text extracted
What is the method to make sense out of that text
delicate violet
desert oar
you might be better off writing to csv and then importing to excel afterwards?
Yeah I was thinking that but based on the circumstances I don't think that's an option.
That would take longer than just waiting for the excel file to be created since in each excel file has multiple sheets which would probably have to be separate csv files if I were to use that.
desert oar
wicked grove
Once i get the text extracted
What is the method to make sense out of that text
there are no off-the-shelf solutions for this that i know of. you might have to start making up some heuristics, or find a company that already specializes in this kind of thing to pay them
desert oar
delicate violet
Yeah I was thinking that but based on the circumstances I don't think that's an ...
a least you can write multiple sheets to csv in parallel. not sure about the excel import process though
 plush leaf
    labels=np.array(['Dribbling',
                     'Crossing',
                     'Long Passing',
                     'Ball Control',
                     'Acceleration',
                     'Sprint Speed',
                     'Aggression',
                     'Stamina',
                     'Positioning',
                     'Finishing'
                    ]
                   )
    angles=np.linspace(0, 2*np.pi, len(labels), endpoint=False)
    angles=np.concatenate((angles,[angles[0]]))

    fig=plt.figure(figsize=(6,6))
    plt.suptitle(title, y=1.04)
    for player in players:
        stats=np.array(fifa22_df[fifa22_df["Name"]==player][labels])[0]
        stats=np.concatenate((stats,[stats[0]]))
        ax = fig.add_subplot(111, polar=True)
        ax.plot(angles, stats, 'o-', linewidth=2, label=player)
        ax.fill(angles, stats, alpha=0.25)
        print(angles * 180/np.pi)
        ax.set_thetagrids(angles * 180/np.pi, labels)

    ax.grid(True)
    #plt.legend(loc="upper right",bbox_to_anchor=(1.2,1.0))
    ax.legend(loc='upper center', bbox_to_anchor=(0.5, -0.10),
      fancybox=True, shadow=True, ncol=5, fontsize=13)
    plt.tight_layout()
    plt.savefig('images/' + filename, bbox_inches = "tight")
    plt.show()

radar_chart()
ValueError: The number of FixedLocator locations (11), usually from a call to set_ticks, does not match the number of ticklabels (10).
How can I fix it?
desert oar
@plush leaf show the full error output including the "traceback" part - otherwise nobody can see where the error is coming from
but it looks like something is length 10 and something else is length 11
are you supposed to concatenate this at the end? maybe that's the problem
angles=np.concatenate((angles,[angles[0]]))
 old grove
The VIF for Fly Ash column <5 and p_value<0.05,But the coeff is positive as the correlation in reality between target and Fly Ash is negative. Should i m confused whether or not should i remoove Fly Ash or Keep that column ??


 wicked grove
desert oar
there are no off-the-shelf solutions for this that i know of. you might have to ...
wicked grove
desert oar
there are no off-the-shelf solutions for this that i know of. you might have to ...
Okayy,thanks a lot!
wicked grove
wicked grove
Okayy,thanks a lot!
It will be difficult to do it with regex right?
desert oar
wicked grove
It will be difficult to do it with regex right?
yes
but you might end up using some regex in the process
desert oar
old grove
The VIF for **Fly Ash** column <5 and p_value<0.05,But the coeff is positive as ...
conditional on the other variables, it's possible that the coef is indeed positive. see https://en.wikipedia.org/wiki/Simpson's_paradox
 wicked grove
desert oar
but you might end up using some regex in the process
wicked grove
desert oar
but you might end up using some regex in the process
Alrightt
 dull turtle
hello my code here https://paste.pythondiscord.com/bukurifiku.py i want to get data from my dataframe i am using loc method
wicked grove
Also i wanted to know if it is necessary to use jupyter notebook while working on ml projects cause i find it really hard to use that
Currently i just use atom and the command prompt
desert oar
wicked grove
Also i wanted to know if it is necessary to use jupyter notebook while working o...
not at all necessary. a lot of data people like it because they can see the "history" of their data exploration all in one place, with plots/output intermixed with code and plain text notes
use the tools that you find comfortable to use
wicked grove
Ohhh okayy,thank you
dull turtle
i want to get data based on strike_price column i have. i want to get seprate data frame for each strike_price so i am using loc method . ping me when replying
 oblique kiln
Hello guys, what material do you recommend me to start learning Data Science with python?
 wary dirge
hey, can someone help me for a webscraping project?I want to scrape names off of my college website (it is for a project) and I am unable to do so, for some reason.
https://www.pesuacademy.com/Academy/ is the link.
in the "know your class and section" prompt, if you enter PES1UG20CS<any 3 digits less than 500> example: PES1UG20CS111
you get the students details by doing that, and i want to scrape the names off of that
 tall reef
how do you transpose the 2nd axis of a 3d tensor?
 serene scaffold
tall reef
how do you transpose the 2nd axis of a 3d tensor?
serene scaffold
tall reef
how do you transpose the 2nd axis of a 3d tensor?
if the dimensions of your tensor are currently in the order (0, 1, 2), what order do you want to change to?
tall reef
i'm trying to transpose the 2d matrix there

into this

is there a way to apply that operation to all the 2d matrices in the 2nd axis?
serene scaffold
Let me see
dull turtle
dull turtle
i want to get data based on `strike_price` column i have. i want to get seprate ...
can anyone help me in this ?
serene scaffold
@tall reef I think I solved it https://paste.pythondiscord.com/dadiwefelu.yaml
 forest willow
can anyone recommend me a good tutorial for tensor flow and numpy?
tall reef
serene scaffold
<@!792740395389288458> I think I solved it https://paste.pythondiscord.com/dadiw...
thx a lot. did you change the order of the axes first before transposing there?
ebon lynx
serene scaffold
<@!792740395389288458> I think I solved it https://paste.pythondiscord.com/dadiw...
fucking dope
serene scaffold
tall reef
thx a lot. did you change the order of the axes first before transposing there?
isn't changing the order of the axes the point?
serene scaffold
ebon lynx
that solution was so cool that I decided to try to find another way
what other way?
ebon lynx
>>> A = np.arange(27).reshape(3,3,3)
>>> A
array([[[ 0,  1,  2],
        [ 3,  4,  5],
        [ 6,  7,  8]],

       [[ 9, 10, 11],
        [12, 13, 14],
        [15, 16, 17]],

       [[18, 19, 20],
        [21, 22, 23],
        [24, 25, 26]]])
>>> np.einsum('ijk->ikj', A)
array([[[ 0,  3,  6],
        [ 1,  4,  7],
        [ 2,  5,  8]],

       [[ 9, 12, 15],
        [10, 13, 16],
        [11, 14, 17]],

       [[18, 21, 24],
        [19, 22, 25],
        [20, 23, 26]]])
>>>```that function will let you do unspeakable things 👻
serene scaffold
wtf
serene scaffold
good docs. I'll take that.
ebon lynx
but basically the thing can do 3 different operations
- reorganize axes, 2) take sums, 3) take products (if I recall)
but the syntax how you combine those is wonky as fuck
tall reef
"ijk", cuz of the basis vector notation or something?
ebon lynx
@tall reef you can name them anything
the arrow is the only part that is part of the syntax
you can do crazy stuff with it. depending on whether you leave some axis on the left side or the right side, it does different things. then there are commas
tall reef
i see. that's a badass function
ebon lynx
Haphazard investigations
🤔 I guess at the end of the day it wasn't that crazy
the syntax was just difficult to remember
 earnest wadi
Hello, im having some weird problems where my network is only managing to reach around 12 - 17% accuracy, ive messed around with the data size and the network shape, nothing seems to be working.
I've made a simple game where the agent must reach a red apple, the training data is generated by a perfect algorithm and is structured like this}
[x_pos_player, y_pos_player, x_pos_goal, y_pos_goal] -> network -> [up, down, left, right]
the inputs are intagers ranging from 0 to 600, the outputs are floats 0 to 1, only 1 key can be pressed per cycle.
The only pattern is that every time its trained, no matter the inputs it will always give the same output, that may be only going down, then ill train it again and it will only go left. etc.
Any help would be appreciated :)
 wide helm

trying to train a neural network with mnist's database, it contains 60k pics 28 on 28 px. the class im using is my school implemented but it shouldnt be much different from tf

can someone spot the error?
the shape of x_train is (20000,28,28)
i guess the problem is one of the broadcasting rules because their dimensions
 wooden forge
Hi, currently having little issues so there is this #help-apple message
If you would like to help me in #help-apple
I am terribly lazy to copy pasta everything, I'm sorry for that
If the thing is expired in the help channel I'll copy pasta
 white flint
Is there something called a checkerror if the check in await bot.wait_for() fails?
serene scaffold
white flint
Is there something called a ``checkerror`` if the check in ``await bot.wait_for(...
Is this a #discord-bots question?
 pastel valley
yo what is tensorflow is it an ide for machine learning or library or something?
serene scaffold
pastel valley
yo what is tensorflow is it an ide for machine learning or library or something?
it is a machine learning library
pastel valley
by that its like you can create and train models there without using python or other languages?@serene scaffold
oh its a python machine learning library
tensorflow is beginner friendly yeah?
😅
 lapis sequoia
skikit learn is quite friendly for simple classifications.(IMO)
pastel valley
i want something like image classifications for different types of something like that
btw i can learn tensorflow without any background on machine learning or i should watch something else first?
 celest light
pastel valley
btw i can learn tensorflow without any background on machine learning or i shoul...
celest light
pastel valley
btw i can learn tensorflow without any background on machine learning or i shoul...
Start with Tensorflow when you are comfortable doing machine learning using sklearn. Tensorflow is used for deep learning and has a steep learning curve. It should not be your entry into machine learning in my opinion.
pastel valley
celest light
Start with Tensorflow when you are comfortable doing machine learning using skle...
i see thank you sir
 lusty stag
say I have a model that can classify cats and dogs another model classifies crowd and pigeons
is it possible to merge the models?
any resources on this appreciated
serene scaffold
lusty stag
say I have a model that can classify cats and dogs another model classifies crow...
It Depends™️
For instance, can your cat-dog classifier predict "neither"?
 ocean swallow
Hey I have a question in NLP. I have supermarket pamplets product info read (pretty robust with object detection and OCR) as
DR. OETKER
Oven-fresh or traditional pizza
different kinds of
each 345 - 435 g pack.
(1kg = 3.66 - 4.61)
Now I want to categorize them as
Manufacturer: DR.OETKER,
Title: Oven fresh or traditional pizza
Description: different kinds of
each 345 - 435 g pack.
(1kg = 3.66 - 4.61)
Basically Title constitutes of what the product is. It could be broom, jelly beans, Kaffee etc. Manufacturer is self-explonatory I guess. But sometimes it doesn't exist on the product. And the everything else is description. (usually they contain how much per money, how many in packs etc. Where should I start doing that?
I am looking at spaCy but I feel like I will have to train something on my own I guess right? If so do you know any robust model that I could start on?
I feel like if I had something that would recognize objects and that could parse them with their adjectives for title and a look up table for manufacturers, I could get away with it but I would really like it if it was robust.
wide helm
celest light
What is a DLModel?
a class my school implemented
 azure marsh
pastel valley
tensorflow is beginner friendly yeah?
azure marsh
pastel valley
tensorflow is beginner friendly yeah?
Have you looked into keras or is that also too much?
ocean swallow
wide helm
without the source hard to track, but the tradition is, you don't let user have the batch size as input size. Try only (28, 28)
and use data shape with 20000, 28, 28
lusty stag
serene scaffold
For instance, can your cat-dog classifier predict "neither"?
ok let's assume I retrain my classifier to identify "neither" what's my next step?
serene scaffold
lusty stag
ok let's assume I retrain my classifier to identify "neither" what's my next ste...
Pass the sample to the next classifier after that.
lusty stag
so basically next classifier will see cats and dogs as "neither"?
serene scaffold
lusty stag
so basically next classifier will see cats and dogs as "neither"?
without knowing what the architecture of your classifiers are, if the first classifier can predict "neither", then you can simply pass it to the next classifier when you get a "neither" answer from the first classifier.
lusty stag
or am I supposed to reuse the output of the 1st classifier?
oh so 1st classifier says neither and I simply just use 2nd one?
serene scaffold
yes
serene scaffold
though you'd need to take into account the possibility that your first classifier, for reasons unknown, will classify a dog as a pigeon sometimes
lusty stag
I can understand
serene scaffold
I don't know enough about computer vision to comment
lusty stag
what can be the reason behind that?
serene scaffold
I don't really know. the composition of the training data and neural net weirdness.
lusty stag
I'll look into that
serene scaffold
I assume you were planning to use a neural net architecture of some kind?
lusty stag
not really
I'm planning to experiment different models
likely svm or knn should perform better in 3 case classification
serene scaffold
how do you plan to represent the images?
lusty stag
not sure I'm still learning 🤣
serene scaffold
I thought one usually represents an image as a 3d array of the pixels for red, green, and blue.
lusty stag
yeah 3 different sets
serene scaffold
sets?
serene scaffold
!e
import numpy as np
print(np.random.random((3, 2, 2)))
 arctic wedgeBOT
@serene scaffold :white_check_mark: Your eval job has completed with return code 0.
001 | [[[0.87113711 0.34877455]
002 |   [0.9368724  0.41451682]]
003 |
004 |  [[0.49822135 0.50391219]
005 |   [0.19002236 0.98541248]]
006 |
007 |  [[0.70875216 0.51459165]
008 |   [0.95961755 0.61594888]]]
Why not just like this?
desert oar
serene scaffold
I thought one usually represents an image as a 3d array of the pixels for red, g...
with svm or especially knn you will probably want a lower dimensional approximation to each image
serene scaffold
desert oar
with svm or especially knn you will probably want a lower dimensional approximat...
I didn't think one could do svm for image related stuff
 iron basalt
serene scaffold
though you'd need to take into account the possibility that your first classifie...
iron basalt
serene scaffold
though you'd need to take into account the possibility that your first classifie...
Second classifier's last fully connected layer take input from previous classifiers (make sure the weight / importance is kinda big).
lusty stag
well actually I'm not working on image classification that was just a placeholder question to ask how to merge classifiers efficiently with imbalanced dataset
desert oar
serene scaffold
I didn't think one could do svm for image related stuff
"back in the day" that's all they had. i never did much image stuff but afaik they used RBF SVMs and a lot more feature engineering
like they didn't just dump 128x128 pixels into the SVM
they would do PCA or something first
iron basalt
The only way to get away with stuff like SVM is to do some very heavy dimension reduction first. But even then, it has many issues.
It works fine in trivial problems.
SVMs are just not abusing the fact that you are dealing with an image, which has certain properties that you can take into account (see CNNs as an example).
Not making use of the all the knowledge about the problem is one way to think about it.
lusty stag
well I was following this paper and they did some matrix multiplication to merge(?) classifiers


my question is did they merge multiple knns or am I reading it wrong?
desert oar
it's better to just ask your question the first time 🙂
# N = number of data points
# K = number of classes
# J = number of KNN classifiers
knn_output = np.zeros((N, K, J))

for j, knn in enumerate(fitted_knn_classifiers):
    for n, item in enumerate(training_dataset):
        # Each prediction is a probability distribution over K classes
        knn_output[i, :, j] = predict_proba_dist(knn, item)
that's the structure of the data
and yes, they merge the KNNs, each Qk in the paper is the sum of the probabilities for class k across all data points
actually sorry, they don't merge them
lusty stag
interesting
thanks I'll try to experiment with it ❤️
also if it's not merging then what is it called?
so that I can look into more resources from google
if I search about merging in google they show me stacking and voting classifier which isn't the thing I need
desert oar
i'm not sure this has a name
it's basically "majority voting"
@lusty stag 👇
# Each outer "layer" of this array is "gi" in their paper
# Each element of each layer is "pnk(i)" in their paper
knn_probas = np.array(
    # Outermost: each KNN (i=1..m)
    # Middle: each data point (j=1..n)
    # Innermost: each class (k=1..6)
    [[[0.0       , 0.1       , 0.2, 0.3       , 0.4]        ,
      [0.14285714, 0.17142857, 0.2, 0.22857143, 0.25714286] ,
      [0.16666667, 0.18333333, 0.2, 0.21666667, 0.23333333] ,
      [0.17647059, 0.18823529, 0.2, 0.21176471, 0.22352941]],
     [[0.18181818, 0.19090909, 0.2, 0.20909091, 0.21818182] ,
      [0.18518519, 0.19259259, 0.2, 0.20740741, 0.21481481] ,
      [0.1875    , 0.19375   , 0.2, 0.20625   , 0.2125]     ,
      [0.18918919, 0.19459459, 0.2, 0.20540541, 0.21081081]],
     [[0.19047619, 0.1952381 , 0.2, 0.2047619 , 0.20952381] ,
      [0.19148936, 0.19574468, 0.2, 0.20425532, 0.20851064] ,
      [0.19230769, 0.19615385, 0.2, 0.20384615, 0.20769231] ,
      [0.19298246, 0.19649123, 0.2, 0.20350877, 0.20701754]]]
)

result = (
    knn_probas
    # Sum over j=1..n data points
    .sum(axis=1)
    # Sum over i=1..m classifiers
    .sum(axis=0)
    # Max-scoring class over k=1..6 classes
    .argmax()
)
basically, the score for each class is the "total probability" over all data points and classifiers
 lapis sequoia
guys how should i start learning data science?
any suggesstions?
till now i knowabout mean, median, mode, data distribution, standard deviation, plotting, variance and percentile what should i do next?
i'm confused
lusty stag
lapis sequoia
till now i knowabout mean, median, mode, data distribution, standard deviation, ...
so what I did is I had statistics course in my college then I practiced some classification problems and now I'm practicing in kaggle
lusty stag
one of my friends suggested me to get a project so I worked with a team on a ML challenge
kaggle.com is a platform for practicing data science
lapis sequoia
ok
lusty stag
or basically a site with challenges
wicked grove
Hello, i have been trying to plot a bar graph and i have come across various methods to do it. Using plt.plot,ax.plot.I am really confused,could someone please help me out
This is my code
ax1=df.groupby('target').count()
#print(ax1)
#ax.bar(ax1)
#plt.show()
fig=plt.figure()
ax=plt.subplot()
ax1.plot(kind='bar',title='Distribution of data',legend=False)
#ig=plt.ax()
#plt.xlabel('label')
#plt.plot()
plt.show()
 tender hearth

eFinancialCareers
Why banks went for the dumbed-down option.
Yikes
"Personally I like R a lot," says Giller. "R is much more of a tool for professional statisticians, meaning people who are interested in inference about data, rather than computer scientists who are people interested in code." As the computer scientists in banks have gained traction, Giller says banks have "replaced quants with IT professionals or with quants who deep down want to be IT professionals," and they've brought Python with them.
What an article
 royal crest
"When programmers (more numerous than statisticians) want to work with data, Python has the appeal of a single language that "does it all" - even if it technically does none of this by design."

lusty stag
wicked grove
```py
ax1=df.groupby('target').count()
#print(ax1)
#ax.bar(ax1)
#plt.show()
fig=...
not sure what you want but
ax1= df.groupby('target').count()
ax1.plot(kind = 'bar' , title = 'Distribution of data', legend = False)
plt.show()
should do the job
and if you need subplots then add the subplot part
lusty stag
tender hearth
Yikes
> "Personally I like R a lot," says Giller. "R is much more of a tool for ...
excel > R 🤣
 blazing dragon
I'm currently trying to implement an lstm in tf/keras for classification of time series data but I can't figure out what the error message means ValueError: slice index 0 of dimension 0 out of bounds. for '{{node strided_slice}} = StridedSlice[Index=DT_INT32, T=DT_INT32, begin_mask=0, ellipsis_mask=0, end_mask=0, new_axis_mask=0, shrink_axis_mask=1](Shape, strided_slice/stack, strided_slice/stack_1, strided_slice/stack_2)' with input shapes: [0], [1], [1], [1] and with computed input tensors: input[1] = <0>, input[2] = <1>, input[3] = <1>. Is anyone able to explain this? I'm happy to share source code.
That's the model I'm using
import tensorflow as tf
from tensorflow import keras
from tensorflow.keras import Model
from tensorflow.keras.layers import LSTM, Dropout, Dense

class LSTMModel(Model):
    def __init__(self, class_count, input_dim, **kwargs):
        super(LSTMModel, self).__init__(**kwargs)
        self.lstm_1 = LSTM(512, input_shape=input_dim, return_sequences=True)
        self.lstm_2 = LSTM(256, return_sequences=True)
        self.lstm_3 = LSTM(128, return_sequences=True)
        self.lstm_4 = LSTM(64)

        self.linear_1 = Dense(1024, activation='relu')
        self.dropout_1 = Dropout(0.5)
        self.linear_2 = Dense(512, activation='relu')
        self.dropout_2 = Dropout(0.5)
        self.linear_3 = Dense(256, activation='relu')
        self.dropout_3 = Dropout(0.5)

        self.outputs = Dense(3, activation='softmax')

    def call(self, x):
        print(x)
        x = self.lstm_1(x)
        x = self.lstm_2(x)
        x = self.lstm_3(x)
        x = self.lstm_4(x)

        x = self.linear_1(x)
        x = self.dropout_1(x)
        x = self.linear_2(x)
        x = self.dropout_2(x)
        x = self.linear_3(x)
        x = self.dropout_3(x)

        x = self.outputs(x)
        return x
with an input dim of (1, 1350) at the moment
tender hearth
Share your training loop
blazing dragon
import os
import tensorflow as tf
from dataset import create_crypto_dataset
from model import LSTMModel

if __name__ == '__main__':
    train_directory = '/project/Datasets/crypto/train/'
    test_directory = '/project/Datasets/crypto/test/'
    model_filepath = './model'
    checkpoint_path = './checkpoints'
    learning_rate = 8e-2
    batch_size = 2^11
    epochs = 5
    class_count = 3
    input_dim = (batch_size, 1, 30*45)

    training = True

    train_dataset = create_crypto_dataset(train_directory, training=training)
    test_dataset = create_crypto_dataset(test_directory)

    train_dataset.batch(batch_size)
    test_dataset.batch(batch_size)

    if os.path.exists(model_filepath):
        model = tf.keras.models.load_model(model_filepath)
    else:
        model = LSTMModel(class_count, input_dim[1:])

    loss_fn = tf.losses.SparseCategoricalCrossentropy()
    metrics = [tf.metrics.SparseCategoricalAccuracy()]
    optimizer = 'adam'

    model.compile(optimizer=optimizer, loss=loss_fn, metrics=metrics)

    callbacks = [tf.keras.callbacks.ModelCheckpoint(filepath=checkpoint_path,
                                                    save_weights_only=True,
                                                    verbose=1)]
    model.build(input_dim)
    print(model.summary())

    model.fit(train_dataset, epochs=epochs, validation_data=test_dataset, callbacks=callbacks)

    print('Finished training\n Saving model...')
    model.save(model_filepath)
    print('Done!')
import tensorflow as tf

def process_crypto_data_path(filepath):
    label = tf.strings.split(filepath, '-')[-2]

    lines = tf.strings.split(tf.io.read_file(filepath), '\n')
    record_defaults = [float()]*3
    output = tf.io.decode_csv(lines, record_defaults)

    data = tf.squeeze(tf.slice(output, [0, 1], [tf.shape(output)[0],1]))

    data_max = tf.math.reduce_max(tf.math.abs(data))
    data = tf.math.scalar_mul(tf.squeeze(tf.math.divide(tf.constant([1], dtype=tf.float32),data_max)), data)

    label = tf.strings.to_number(label, out_type=tf.float32)
    data = tf.reshape(data, [1, 1, 30*45])
    return (data, label)

def create_crypto_dataset(directory, training=False):
    file_list = tf.data.Dataset.list_files(directory)
    loss_file_list = file_list.filter(lambda x: tf.strings.split(x, '-')[-2] == '0')
    neutral_file_list = file_list.filter(lambda x: tf.strings.split(x, '-')[-2] == '1')
    gain_file_list = file_list.filter(lambda x: tf.strings.split(x, '-')[-2] == '2')
    class_size = min([loss_file_list.cardinality(), neutral_file_list.cardinality(), gain_file_list.cardinality()])
    loss_file_list = loss_file_list.take(class_size)
    neutral_file_list = neutral_file_list.take(class_size)
    gain_file_list = gain_file_list.take(class_size)

    dataset = loss_file_list.concatenate(neutral_file_list)
    dataset = dataset.concatenate(gain_file_list)

    dataset = dataset.map(process_crypto_data_path)
    return dataset
Hey @blazing dragon!
Uh-oh! It looks like your message got zapped by our spam filter. We currently don't allow .csv attachments, so here are some tips to help you travel safely:
• If you attempted to send a message longer than 2000 characters, try shortening your message to fit within the character limit or use a pasting service (see below)
• If you tried to show someone your code, you can use codeblocks
(run !code-blocks in #bot-commands for more information) or use a pasting service like:
 tacit agate
I'm doing a small data analysis with python, anyone can help me the syntax please?
blazing dragon
The data looks like ```,data,label
0,4767.208185355979,1
1,4767.079638078791,1
2,4766.92125546102,1
3,4766.740969534313,1
4,4766.547295869458,1
5,4766.338378800197,1
6,4766.108097933698,1
7,4765.866360712133,1
8,4765.620018361842,1
9,4765.362928012405,1
10,4765.112995211604,1
11,4764.878571496358,1
12,4764.652011346324,1
13,4764.457274239044,1
14,4764.267987604806,1
15,4764.117458781299,1
16,4764.009862668019,1
17,4763.939436397789,1
18,4763.912159513428,1
19,4763.920757848941,1
20,4763.963623708916,1
21,4764.059900714212,1
like I don't know nowwhere to stảt
blazing dragon
Where there are 1350 rows and I only care about the centre column
wicked grove
lusty stag
not sure what you want but
```python
ax1= df.groupby('target').count()
ax1.plot(...
Thanks a lot!!
When should we use fig=plt.figure and ax1=plt.subplot
I'm not getting the difference
One of the documentation also had,ax.bar()
wicked grove
lusty stag
and if you need subplots then add the subplot part
I should add the subplot part after ax.plot?
We add the subplot to change the axes,etc?
 ripe forge
tender hearth
https://www.efinancialcareers.com/news/2021/09/banks-python-vs-r
ripe forge
tender hearth
https://www.efinancialcareers.com/news/2021/09/banks-python-vs-r
Look at their first sentence. "Most serious data scientists prefer R to Python," and then look at the article they're using to supposedly justify that sentence. That article itself literally saying nothing like that in the first place. Sounds like you should consider alternative sources of reading material 😅
tender hearth
ripe forge
Look at their first sentence. "Most serious data scientists prefer R to Python,"...
Aw. But my time spent on the loo will be wasted
blazing dragon
Should I consider moving away from using tf.data? It appears that it only runs in graph mode which makes everything very difficult to debug.
I need the ability to keep the gpu fed with data all the time and I can't have all of the data in memory as I've only got 32GB of RAM and 72GB of data.
celest light
blazing dragon
I need the ability to keep the gpu fed with data all the time and I can't have a...
One approach I use is to subclass the tf.keras.utils.Sequence class. Then I can define a custom data loading process using native python. I guess you can add your debug code there as well alongside the data loading process. It is, I believe, not as fast as tf.data
old grove
If the target column has outliers,should they be treated ? I have already treated all outliers via log transformation but still my target column has outlier,so should i treat them ? Asking bcoz its a target column and my independent variables have no outliers.
 dapper forum
Hi all, I have a general question with regards to NLP and how it works. I am a general Python user, mostly chopping up JSON to message the data to generate a report. I am interested in a use case. Say I have two sets of structured data with almost similar fieldnames which may contain identical value or close enough values. I wish to be able to process them and have an output that states the following relationship: set1.fieldname1 is related to set2.fieldname2 etc. I wish to have a model where I can give any pairs of sets and have this relationship(s) identified. Is this possible? Has there been work done on this? Thank you in advance.
arctic wedgeBOT
format(value[, format_spec])```
Convert a *value* to a “formatted” representation, as controlled by *format\_spec*. The interpretation of *format\_spec* will depend on the type of the *value* argument; however, there is a standard formatting syntax that is used by most built-in types: [Format Specification Mini-Language](https://docs.python.org/3.10/library/string.html#formatspec).

The default *format\_spec* is an empty string which usually gives the same effect as calling [`str(value)`](https://docs.python.org/3.10/library/stdtypes.html#str "str").

A call to `format(value, format_spec)` is translated to `type(value).__format__(value, format_spec)` which bypasses the instance dictionary when searching for the value’s `__format__()` method. A [`TypeError`](https://docs.python.org/3.10/library/exceptions.html#TypeError "TypeError") exception is raised if the method search reaches [`object`](https://docs.python.org/3.10/library/functions.html#object "object") and the *format\_spec* is non-empty, or if either the *format\_spec* or the return value are not strings.@final light sorry is that a reply to my question? I am not looking to format the data.
The data are in a form of 2 sets of structured data with their own domain specific fieldnames. A fieldname in one JSON can be related to another fieldname in the other JSON.
I am looking for a way to quickly identify these relationships.
 final light
dapper forum
<@!632102801555587088> sorry is that a reply to my question? I am not looking to...
final light
dapper forum
<@!632102801555587088> sorry is that a reply to my question? I am not looking to...
No I'm sorry, was just showing a friend how the bot worked, might have been bad timing and/or wrong channel. Sry!
dapper forum
final light
No I'm sorry, was just showing a friend how the bot worked, might have been bad ...
Hahaha no worries. All is good. 🙂
 midnight cliff
hello
blazing dragon
celest light
One approach I use is to subclass the tf.keras.utils.Sequence class. Then I can ...
I'm trying it now and it is working but it is really slow. My gpu average utilisation with this method is ~5%
midnight cliff
my friend did a team prediction from dataset what algorith he must have used
pls help me
lapis sequoia
midnight cliff
pls help me
what kind of questions is that.
 rigid zodiac
quick question, how can you categorize the entire csv? because I have like 5000 csv for the fall and 1000 csv for nonfall.
 limpid snow
I try to training neural network on Windows by tensorflow but it throw Broken pipe error
On my laptop
 hard pelican
Hey,
I want to count unique occurrences in pandas, that are followed by different occurrences, do you have any idea?
 desert oar
rigid zodiac
quick question, how can you categorize the entire csv? because I have like 5000 ...
desert oar
rigid zodiac
quick question, how can you categorize the entire csv? because I have like 5000 ...
Think of it this way: you have a dataset of 6000 items; each item is an entire CSV file. How you represent that data in a model will depend on what exactly it is and what you want to do with it
rigid zodiac
hard pelican
Hey,
I want to count unique occurrences in pandas, that are followed by differe...
np.unique()
desert oar
hard pelican
Hey,
I want to count unique occurrences in pandas, that are followed by differe...
Pandas generally struggles with "sequential" operations, you might need a window function or something, or just use a for loop
hard pelican
desert oar
Pandas generally struggles with "sequential" operations, you might need a window...
Hmm yeah that's what I thought, thanks!
rigid zodiac
desert oar
Think of it this way: you have a dataset of 6000 items; each item is an entire C...
but how can I do that?
like I keep searching it on google and i cant find it
desert oar
I don't know pandas window functions all that well, let me see what i can find in the docs
hard pelican
desert oar
I don't know pandas window functions all that well, let me see what i can find i...
Your'e the best
desert oar
rigid zodiac
like I keep searching it on google and i cant find it
Because "how do calssify csv pls" is not an answerable question. What does the data represent, what is its shape, data types, etc, and what are you trying to discover? Data science requires creativity. You learn the fundamentals not in order to be able to apply them verbatim, but to be so comfortable with them that it's easy to build new and creative solutions out of them
 velvet thorn
hard pelican
Hey,
I want to count unique occurrences in pandas, that are followed by differe...
velvet thorn
hard pelican
Hey,
I want to count unique occurrences in pandas, that are followed by differe...
so basically
number of contiguous groups
of each unique element?
hard pelican
velvet thorn
so basically
Yup,
I think I should be using "shift" is some way haha
velvet thorn
hard pelican
Yup,
I think I should be using "shift" is some way haha
yeah
that's the idea
then filter
on inequality of the shift
and .value_counts
at least, that's my initial impression
like df['status'] != df['status'].shift(1)
desert oar
That's a good one
velvet thorn
I actually kinda miss this kind of problem
with pandas and numpy
when I was active on SO
the kind of algorithm problem I actually like
hard pelican
Oh i'm doing a lot of that now, I will send you some more challenges if you like it haha
velvet thorn
guess I just love declarative stuff
desert oar
Yeah some good brain teasers if you weed out the "halp how do tensorflow" stuff
rigid zodiac
desert oar
Because "how do calssify csv pls" is not an answerable question. What does the d...
Like I know if I want to feed into the ML or DL, I need to separate them as predictor and the response. so I probably use array for the csv and each huge array will stand for either fall or no fall... but idk what the response will be
desert oar
rigid zodiac
Like I know if I want to feed into the ML or DL, I need to separate them as pred...
The response will be "fall" or "no fall" right? Sounds like binary classification
rigid zodiac
desert oar
The response will be "fall" or "no fall" right? Sounds like binary classificatio...
Yeah but you can you code it and to let it know that this or that csv stand for it
desert oar
rigid zodiac
Yeah but you can you code it and to let it know that this or that csv stand for ...
How exactly you represent that in code will depend on what you want to do with it. The naive solution is just 2 lists. The first list has 6000 dataframes. The second list is 6000 True or False depending on the class
rigid zodiac
desert oar
How exactly you represent that in code will depend on what you want to do with i...
aghh so I need to create a list then append it. and it will automatically be the response.... But can I feed it into the ml with that approach?
desert oar
rigid zodiac
just to be sure array is some thing that look like this right?
[ [.....................], [...............] ]
desert oar
I think you're under the impression that you can just dump this data into a pre-existing model
Given that this is not a standard way to organize data, you probably can't do that
It would help if you described what was actually in each of these files
rigid zodiac
Each csv file contains: x, y, z, velocity_x, vel_y, vel_z, acceleration_x, acc_y, acc_z
desert oar
And what is each row? A measurement taken at a certain time?
And you are trying to determine if this is an object falling or not?
rigid zodiac
each row in the csv measure in second. yes, I'm trying to determine whether the object falling or not
desert oar
OK, this would fall under a problem called "time series classification"
Specifically, "multivariate time series classification"
Each data point is a time series, consisting of multiple variables at each time step
That will at least give you some search terms to start with
blazing dragon
rigid zodiac
each row in the csv measure in second. yes, I'm trying to determine whether the ...
Why do you want to use ML to do this? Wouldn't you be able to use that information to determine it without ML?
desert oar
I was just going to say, you might be able to do this with heuristics
That is, just look at the data and come up with rules by hand
blazing dragon
It would be faster than using ML
rigid zodiac
blazing dragon
Why do you want to use ML to do this? Wouldn't you be able to use that informati...
well because in the future I may want to predict idk
desert oar
The next-simplest thing to do would be to try and reduce each CSV to a list of summary statistics about each motion path. So instead of each data point being an entire multivariate time series, you reduce each data point to a list of things like "difference between start and stop position" and "max velocity"
It's almost always a good idea to try to avoid ML at first and use as much heuristics as possible
blazing dragon
rigid zodiac
well because in the future I may want to predict idk
Predict the movement of it in advance?
desert oar
Even if you do need to use ML at the end, if you start with the heuristics you will gain a much better understanding of the data and the problem
And you will develop better features
rigid zodiac
blazing dragon
Predict the movement of it in advance?
yeah
rigid zodiac
desert oar
I was just going to say, you might be able to do this with heuristics
what is heuristics?
desert oar
If you need to forecast the trajectory of a particular object, that's a different problem. Focus on one thing at a time
desert oar
rigid zodiac
what is heuristics?
Hand-crafted rules
Look at things like max velocity, direction of motion, etc.
If an object is in freefall it should be pretty easy to figure it out from data like that
Without trying to use machine learning to do it
wide helm
ocean swallow
without the source hard to track, but the tradition is, you don't let user have ...
I have the source code, 28,28 doesn't work
blazing dragon
I've been starting to learn more and more about ML lately on my own and I've noticed that on this particular problem if I reduce the batch size from 2^11 to 2^8 the training accuracy increases faster and the loss decreases faster. Is there an intuitive explanation for this?
wide helm
blazing dragon
I've been starting to learn more and more about ML lately on my own and I've not...
there's a thing called overfitting
rigid zodiac
desert oar
Look at things like max velocity, direction of motion, etc.
I did before but my senior was like dont do that.... i will look into the heuristic
wide helm
wide helm
there's a thing called overfitting
but i do't think its neccesarily related
blazing dragon
It's on the first epoch and it hasn't seen any data more than once so it can't be overfitting yet
It's also got large amounts of dropout

When the batch size was at 2^11 I would barely move from a random guess but now it seems to be getting much better
desert oar
rigid zodiac
I did before but my senior was like dont do that.... i will look into the heuris...
don't do "what" exactly? those are heuristics
what do you mean by "senior"? is this at work? are you being given a problem that is already solved, and they're expecting you to learn by working on it?
rigid zodiac
desert oar
don't do "what" exactly? those _are_ heuristics
I noticed before that if the data suddenly decrease in y-acceleration pair with either x-acceleration of z-acceleration will be consider as fall. Other wise is non fall. But when I feed it into ML .... idk how to tell the machine to do it
rigid zodiac
desert oar
what do you mean by "senior"? is this at work? are you being given a problem tha...
well this problem no body solved it yet.
lusty stag
wicked grove
Thanks a lot!!
When should we use fig=plt.figure and ax1=plt.subplot
I'm not g...
fig = plt.figure
creates a figure object
you can use
ax = fig.add_subplot(1,1,1)
to draw axis
I'm not exactly sure but
plt.subplot should remove previously drawn subplots and put it over all of the plots
.
ax.bar() is same as kind= 'bar'
wicked grove
Ohhh okay,so if i want to make changes in the subplot how do i go about it
labels=['Negative','Positive']
ax=df.groupby('target').count()
ax.plot(kind='bar',title='Distribution of data',legend=False)
ax=plt.subplot()
ax.set_xticklabels(labels,rotation=0)
plt.xlabel('Target')
I did this,but idk
Is there a better a way w a loop ?
lusty stag
what would you like to loop through?
you can define subplot axises like
ax1= plt.subplot(111)
ax2= plt.subplot(211)...
old grove
In Classification We have precision,recall and this things but in regression what do we evaluate to check model performance ?
lusty stag
MSE/ MAE /R-squared value @old grove
wicked grove
lusty stag
you can define subplot axises like
ax1= plt.subplot(111)
ax2= plt.subplot(211).....
The dataframe indexes and columns
Using ax1=plt.subplot(111) how can i set xtick labels
lusty stag
wicked grove
The dataframe indexes and columns
Using ax1=plt.subplot(111) how can i set xtick...
you iterate through each row and column in the dataframe
.
plt.sca(axes[1, 1]) #axes[column,row]
plt.xticks(range(3), ['A', 'Big', 'Cat'])
should change the xtick for subplot (1,1)
desert oar
rigid zodiac
I noticed before that if the data suddenly decrease in y-acceleration pair with ...
figure out a way to represent each trajectory as a "vector" - a sequence of numbers. so you can represent the entire dataset of trajectories as a matrix, with each row being one trajectory and each column being some feature of the trajectory
desert oar
lusty stag
fig = plt.figure
creates a figure object
you can use
ax = fig.add_subplot(1,1,...
i believe plt.subplot creates a new figure, and sets the "current figure" to that new figure
the "current figure" being the one that is operated on by top-level plt.* functions
velvet thorn
desert oar
i believe `plt.subplot` creates a _new figure_, and sets the "current figure" to...
yes, that is correct (if you mean plt.subplots)
plt.subplot adds/retrieves an Axes
to/from the current figure
yes...bad naming. 🥴
lusty stag
oh didn't know the details thanks for correcting me ❤️
desert oar
velvet thorn
yes, that is correct (if you mean `plt.subplots`)
yep that's what i meant, good catch
maybe matplotlib 4.0 will have a new-new-new interface with actually consistent naming
having a class called Axes is also a nightmare... why isn't it AxisCollection or something??
(i get why, the "axes" are a single plot area.. ugh)
plush leaf
    labels=np.array(['Dribbling',
                     'Crossing',
                     'Long Passing',
                     'Ball Control',
                     'Acceleration',
                     'Sprint Speed',
                     'Aggression',
                     'Stamina',
                     'Positioning',
                     'Finishing',
                    ]
                   )
    angles=np.linspace(0, 2*np.pi, len(labels), endpoint=False)
    #angles=np.concatenate((angles,[angles[0]]))

    fig=plt.figure(figsize=(6,6))
    plt.suptitle(title, y=1.04)
    for player in players:
        stats=np.array(fifa22_df[fifa22_df["Name"]==player][labels])[0]
        #stats=np.concatenate((stats,[stats[0]]))
        ax = fig.add_subplot(111, polar=True)
        ax.plot(angles, stats, 'o-', linewidth=2, label=player)
        ax.fill(angles, stats, alpha=0.25)
        ax.set_thetagrids(angles * 180/np.pi, labels)

        ax.tick_params(axis='both', which='major', pad=15)
        ax.set_ylim(0, 100)

    ax.grid(True)
    #plt.legend(loc="upper right",bbox_to_anchor=(1.2,1.0))
    ax.legend(loc='upper center', bbox_to_anchor=(0.5, -0.10),
      fancybox=True, shadow=True, ncol=5, fontsize=13)
    plt.tight_layout()
    plt.savefig('images/' + filename, bbox_inches = "tight")
    plt.show()

radar_chart() ```I have an issue in drawing a radar chart.
ValueError: The number of FixedLocator locations (11), usually from a call to set_ticks, does not match the number of ticklabels (10).
I also added labels=np.concatenate((labels,[labels[0]])) after defining labels array but nothing changed. How can I fix it?
rigid zodiac
@desert oar this is what I have for the nonfall data
 wicked grove
lusty stag
you iterate through each row and column in the dataframe
.
```python
plt.sca(axe...
wicked grove
lusty stag
you iterate through each row and column in the dataframe
.
```python
plt.sca(axe...
Thank you!! I will try this
desert oar
rigid zodiac
<@!389497659087650836> this is what I have for the nonfall data
is this from one single trajectory? and you have 5000 3000 non-fall trajectories like this?
rigid zodiac
this is the 3000 non fall trajectory when I graph it using the acceleration
desert oar
that doesn't make sense, how are the 3000 trajectories represented there?
did you average the accelerations across all 3000 trajectories?
rigid zodiac
desert oar
that doesn't make sense, how are the 3000 trajectories represented there?
each csv has 10 row of data (after I convert them into second). and I have 3000 csv
these are just a snipet from a loop
velvet thorn
desert oar
(i get why, the "axes" are a single plot area.. ugh)
yeah, and then
you have
Axis
😔
rigid zodiac
desert oar
so you looped over all 3000 csvs and plotted each one?
Well I split from 1 big csv to each of the 10 second when the non fall happen. Then break them down into csv (stage1). In this stage, I Have like 10,000 row / csv. Most of them have similar frame number. So I have to combine them into second (stage 2). Then plot it using loop
desert oar
rigid zodiac
Well I split from 1 big csv to each of the 10 second when the non fall happen. T...
i don't really understand what you're describing but this sounds kind of complicated. what is the original format of the data? it sounds like it's kind of like this
id | time | x | y | ...
---|------|---|---|-----
 1 |    0 | ...
 1 |    1 | ...
 1 |    2 | ...
 2 |    0 | ...
 2 |    1 | ...
 3 |    2 | ...
originally, it was in csv, but some columns was formatter as json
desert oar
you can load this all into pandas as a single dataframe
data = pd.read_csv('data.csv', index_col=['id', 'time'])
then deal with processing the embedded json after you load it
arctic wedgeBOT
Hey @rigid zodiac!
Uh-oh! It looks like your message got zapped by our spam filter. We currently don't allow .csv attachments, so here are some tips to help you travel safely:
• If you attempted to send a message longer than 2000 characters, try shortening your message to fit within the character limit or use a pasting service (see below)
• If you tried to show someone your code, you can use codeblocks
(run !code-blocks in #bot-commands for more information) or use a pasting service like:
desert oar
ok, well you can recombine all that into a single dataframe still. that'd be easier to me
in this format
id | time | x | y | ...
---|------|---|---|-----
 1 |    0 | ...
 1 |    1 | ...
 1 |    2 | ...
 2 |    0 | ...
 2 |    1 | ...
 3 |    2 | ...
you can use a multi-index with (id, time), or leave the default index
rigid zodiac
I can do that, but how can I make ML out of it
desert oar
you can do .gropuby('id') for example
desert oar
rigid zodiac
I can do that, but how can I make ML out of it
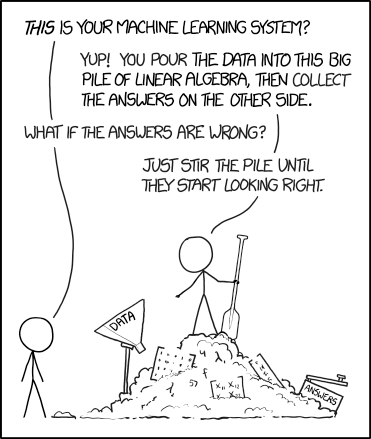
The pile gets soaked with data and starts to get mushy over time, so it's technically recurrent.
rigid zodiac
ohhh ok let me try that part
rigid zodiac
desert oar
you can do `.gropuby('id')` for example
not bad suggest, thank you so much let me try that
desert oar
dfs = {}
for i, p in enumerate(Pathlib('data-files').glob('*.csv')):
    df = pd.read_csv(p, index_col='time')
    dfs[i] = df
data = pd.concat(dfs)
that is for combine all of the data correct?
pastel valley
azure marsh
Have you looked into keras or is that also too much?
no i am so blanked as where to start
i watched this video
desert oar
rigid zodiac
that is for combine all of the data correct?
yes, i encourage you to read some documentation and figure out what this does
!d pathlib.Path.glob
arctic wedgeBOT
Path.glob(pattern)```
Glob the given relative *pattern* in the directory represented by this path, yielding all matching files (of any kind):

```py
>>> sorted(Path('.').glob('*.py'))
[PosixPath('pathlib.py'), PosixPath('setup.py'), PosixPath('test_pathlib.py')]
>>> sorted(Path('.').glob('*/*.py'))
[PosixPath('docs/conf.py')]
``` Patterns are the same as for [`fnmatch`](https://docs.python.org/3.10/library/fnmatch.html#module-fnmatch "fnmatch: Unix shell style filename pattern matching."), with the addition of “`**`” which means “this directory and all subdirectories, recursively”. In other words, it enables recursive globbing...!d pandas.concat
arctic wedgeBOT
pandas.concat(objs, axis=0, join='outer', ignore_index=False, keys=None, levels=None, names=None, verify_integrity=False, sort=False, copy=True)```
Concatenate pandas objects along a particular axis with optional set logic along the other axes.

Can also add a layer of hierarchical indexing on the concatenation axis, which may be useful if the labels are the same (or overlapping) on the passed axis number.!d enumerate
arctic wedgeBOT
enumerate(iterable, start=0)```
Return an enumerate object. *iterable* must be a sequence, an [iterator](https://docs.python.org/3.10/glossary.html#term-iterator), or some other object which supports iteration. The [`__next__()`](https://docs.python.org/3.10/library/stdtypes.html#iterator.__next__ "iterator.__next__") method of the iterator returned by [`enumerate()`](https://docs.python.org/3.10/library/functions.html#enumerate "enumerate") returns a tuple containing a count (from *start* which defaults to 0) and the values obtained from iterating over *iterable*.

```py
>>> seasons = ['Spring', 'Summer', 'Fall', 'Winter']
>>> list(enumerate(seasons))
[(0, 'Spring'), (1, 'Summer'), (2, 'Fall'), (3, 'Winter')]
>>> list(enumerate(seasons, start=1))
[(1, 'Spring'), (2, 'Summer'), (3, 'Fall'), (4, 'Winter')]
``` Equivalent to...ok so you suggest to combine all of the data and give it id correct?
desert oar
i'm suggesting that might make it easier to work with, instead of a list of thousands of individual dataframes
rigid zodiac
desert oar
i'm suggesting that might make it easier to work with, instead of a list of thou...
ik ik, but I currently have a hard time to combine it
rigid zodiac
 delicate lodge
Hi,
have anyone here use lstm or convLstm before ?
delicate lodge
Hi,
have anyone here use lstm or convLstm before ?
i asked the same question like 7 weeks ago... no one answer it yet so idk
delicate lodge
@rigid zodiac lol ..actually I am stuck in some input_shape
my input shape is like 4d and lstm is taking 2d
I mean lstm is taking 3d*
ebon lynx
@delicate lodge I've written a conv LSTM
I don't know remember components I used for it but I fed it in a bunch of black+white pictures and then made it compress them and then decompress them with a similar decoder
the architecture works 👍
the LSTM cells themselves are '1D' so you need to force the 2D pictures into them first with additional things per Cell
wicked grove
Hello,
Can someone please help me out w the heuristics required for pdf parsing,how i should go about it?
I have got the entire pdf information in a list of dictionaries and i thought of converting it to json
How do i go about it after that, to make sense of the information extracted
ebon lynx
@wicked grove that's normally a supervised learning job
wicked grove
Really?
How can i fit that data in a model, and which model
ebon lynx
you either know well before how to extract them (i.e. where is what field) and then just pick them up from the correct JSON, or, then you have a shitload of labeled data
@wicked grove I've worked for a company that did precisely that. we had a metric shit ton of labeled data.
the ones that were "pre-known" used templates (hand-coded rules)
wicked grove
ebon lynx
<@!696373334119546890> I've worked for a company that did precisely that. we had...
Oh my god!! Could you please help me out w this
I would like to show you my output and get some insight
ebon lynx
@wicked grove the solution is to have data... but yes, you can show me something. I probably can't help.
wicked grove
ebon lynx
you either know well before how to extract them (i.e. where is what field) and t...
The invoices vary so i have a shitload of labeled data
ebon lynx
@wicked grove labeled data
wicked grove
ebon lynx
the ones that were "pre-known" used templates (hand-coded rules)
Can you explain a little more about this
ebon lynx
do you have the correct (as in: labels) for each of the fields where they are supposed to be?
 wicked grove
ebon lynx
do you have the correct (as in: labels) for each of the fields where they are su...
wicked grove
ebon lynx
do you have the correct (as in: labels) for each of the fields where they are su...
I don't have for each of the fields
I just have for the characters
wicked grove
ebon lynx
the ones that were "pre-known" used templates (hand-coded rules)
But in my case there is no template so i converted the pdf in such a way that i could get the coordinates of the words
ebon lynx
@wicked grove I have to go in 1 minute. I will be back later. do you know what Supervised Learning is? if not, figure that out first.
ebon lynx
then you know what a labeled dataset is
wicked grove
Yes
ebon lynx
are you trying to say you need to form words out of those characters first?
well some seem to be already words
define your problem first.
wicked grove
@1900sombrero
Yes i am getting coordinates each word
I have various invoices,i need to extract the text and convert that to json and pick a few key and value pairs and map it to the company's database
The problem is when i extract the text it is not in the proper order and i need to make sense out of the text i have gotten
tacit agate

I'm trying to find the mode of the dataframe's columns
but I don't know why there is a 2nd column ( index = 1) with NaN values
and some of my values in SkinThickness, Insulin has the value of 0, which doesn't make sense, should I replace the 0 values to mean?
rigid zodiac
desert oar
i'm suggesting that might make it easier to work with, instead of a list of thou...
how can you label it or give it a unique ID... like for each dataframe that you add in
 civic elm
tacit agate
but I don't know why there is a 2nd column ( index = 1) with NaN values
civic elm
tacit agate
but I don't know why there is a 2nd column ( index = 1) with NaN values
A single column can have more than one mode if two (or more) elements are the most common, so the NaN show up for the columns that don't
desert oar
rigid zodiac
how can you label it or give it a unique ID... like for each dataframe that you ...
i gave you one example using enumerate() in a loop
civic elm
tacit agate
and some of my values in SkinThickness, Insulin has the value of 0, which doesn'...
it depends on why those values are 0. it might make sense if it just happens to be that those particular values are trash, but it could also be the case that the entire row is trash. hard to say without knowing more about the dataset
rigid zodiac
desert oar
i gave you one example using `enumerate()` in a loop
I have this issue when using your code
TypeError: 'module' object is not callable
desert oar
well i probably made a mistake
it's untested code written by strangers on the internet
rigid zodiac
desert oar
it's untested code written by strangers on the internet
this is what I substitude on your code
dfs = {}
for i, p in enumerate(pathlib('/content/drive/MyDrive/Huy_2/train_test_val/test/fall_2ft_groupby/').glob('*.csv')):
    df = pd.read_csv(p, index_col='time')
    dfs[i] = df
data = pd.concat(dfs)```well that isn't what i wrote
TypeError: 'module' object is not callable
i bet you can figure out why that happened
hint: pathlib is a module
rigid zodiac
desert oar
hint: `pathlib` is a module
may sound dumb, but what is module?

 earnest shuttle
Hi !
I need to use a for loop to predict the auc score for all my column(feature) values do let me know how can I do that
Newdata is the name of my dataset, I have used list1 as my target value and the others I need column wise but the compiler is throwing an error
list1 = newdata['diagnosis']
for i in range(len(columns)):
auc = roc_auc_score(list1, newdata.columns[i])
print(auc)
desert oar
@earnest shuttle what is columns?
a list of column names?
.columns is for getting the names of the columns. i think you meant this:
# Columns to compute ROC AUC
columns_for_scoring = ['a', 'b', 'c']
for colname in columns_for_scoring:
    auc = roc_auc_score(newdata['diagnosis'], newdata[colname])
    print(auc)
Here is there a way to replace this? columns_for_scoring = ['a', 'b', 'c'] since I have 32 columns
desert oar
earnest shuttle
Here is there a way to replace this? columns_for_scoring = ['a', 'b', 'c'] since...
you want to loop over all columns? it looked like you already had a columns variable in your code
i asked you what that variable was
rigid zodiac
desert oar
https://www.learnpython.org/en/Modules_and_Packages
thank you so much, I see what you mean there. silly package
desert oar
rigid zodiac
thank you so much, I see what you mean there. silly package
it's best to think of modules only. "package" is a poorly-chosen name for a "module that can contain other modules".
earnest shuttle
desert oar
you want to loop over _all_ columns? it looked like you already had a `columns` ...
I used columns as - columns = list(newdata)
 obsidian crystal
hey i have a question! So here in this package given by Yahoo finance, theres kinda like 3 data frames in one? Idk its weird.
Basicallly what i want to do is index is by number. So if theres 3 dataframes or wtv. How do I acess MSFT by data[0]

 earnest shuttle
desert oar
i asked you what that variable was
earnest shuttle
desert oar
i asked you what that variable was
So basically what I coded was this
columns = list(newdata)
list1 = newdata['diagnosis']
for i in range(len(columns)):
auc = roc_auc_score(list1, newdata.columns[i])
print(auc)
And what I looking for as an output is a list of auc values for all my features
obsidian crystal
See like i have to do "SPY" to acess the SPY dataframe. How do i instead acess by index?
 desert oar
earnest shuttle
So basically what I coded was this
columns = list(newdata)
list1 = newdata['dia...
desert oar
earnest shuttle
So basically what I coded was this
columns = list(newdata)
list1 = newdata['dia...
what is newdata?
i assumed it was a pandas dataframe, but maybe it's something else?
@obsidian crystal can you please:
- share your code as text, either using a code block or our paste site.
- share sample data in a form that i can easily copy and paste and read into pandas, e.g. csv. again, use a code block or our paste site.
!paste
arctic wedgeBOT
Pasting large amounts of code
If your code is too long to fit in a codeblock in discord, you can paste your code here:
https://paste.pythondiscord.com/
After pasting your code, save it by clicking the floppy disk icon in the top right, or by typing ctrl + S. After doing that, the URL should change. Copy the URL and post it here so others can see it.
obsidian crystal
gt it
got it
import yfinance as yf

ticks = "SPY TLT MSFT"


# get historical market data
data = yf.download(  # or pdr.get_data_yahoo(...
        # tickers list or string as well
        tickers = ticks,

        # use "period" instead of start/end
        # valid periods: 1d,5d,1mo,3mo,6mo,1y,2y,5y,10y,ytd,max
        # (optional, default is '1mo')
        period = "15y",

        # fetch data by interval (including intraday if period < 60 days)
        # valid intervals: 1m,2m,5m,15m,30m,60m,90m,1h,1d,5d,1wk,1mo,3mo
        # (optional, default is '1d')
        interval = "1mo",

        # group by ticker (to access via data['SPY'])
        # (optional, default is 'column')
        group_by = 'ticker',

        # adjust all OHLC automatically
        # (optional, default is False)
        auto_adjust = True,

        # download pre/post regular market hours data
        # (optional, default is False)
        prepost = False,

        # use threads for mass downloading? (True/False/Integer)
        # (optional, default is True)
        threads = True,

        # proxy URL scheme use use when downloading?
        # (optional, default is None)
        proxy = None
    )
Thats all my code
earnest shuttle
desert oar
what is `newdata`?
its actually the dataset
 burnt knot
I've been thinking
I asked here about troubleshooting my work on running existing voice cloning programs to construct my own program for cloning voices
But I wonder
Is there a reasonably straightforward way I'm missing for doing this?
(I haven't gotten any results from the troubleshooting yet and was considering trying it all from another angle.)
obsidian crystal
obsidian crystal
```py
import yfinance as yf
ticks = "SPY TLT MSFT"
# get historical market da...
@desert oar This is all the code. That data variable will have the dataframes package thing
desert oar
earnest shuttle
its actually the dataset
a "dataset" isn't a standalone concept in python. is it a pandas dataframe? a numpy array" something else?
desert oar
obsidian crystal
<@!389497659087650836> This is all the code. That data variable will have the da...
data variable will have the dataframes package thing
i don't know what this means
however i think i know what you're asking
use data.loc[idx] to get rows by index
data.loc[idx, col] for both row and column
data[col] is (usually but not always) equivalent to data.loc[:, col]
lapis sequoia
very sorry, im abit new to python but im confused as to y this wont work:

it wont return the correct price
hence 0 at bottom
desert oar
@lapis sequoia when asking for help here, please post your code as text, not a screenshot. also include a description of what you were expecting and how it differs from the actual output
!paste 👇 use this for longer pieces of code
arctic wedgeBOT
Pasting large amounts of code
If your code is too long to fit in a codeblock in discord, you can paste your code here:
https://paste.pythondiscord.com/
After pasting your code, save it by clicking the floppy disk icon in the top right, or by typing ctrl + S. After doing that, the URL should change. Copy the URL and post it here so others can see it.
lapis sequoia
oh thank you
desert oar
also this isn't a data science question. general python questions belong in a help channel, see #❓|how-to-get-help
obsidian crystal
desert oar
> data variable will have the dataframes package thing
i don't know what this me...
so like paste this in ur IDE.
That data variable.
It has the combination of 3 dataframes basically. I dont know how. It has a dataframe for MSFT,TLT, SPY.
If i wanna acess TLT for example, i can do data['TLT'] and it would give me the TLT dataframe. HOWEVER. I dont wanna do it that way. I want to acess TLT by index.
 desert oar
it appears that data is in this case one dataframe with a "multi-index" in the columns https://github.com/ranaroussi/yfinance/blob/main/yfinance/multi.py#L32-L136
my recommendation to use .loc for accessing rows is still valid
obsidian crystal
multi index in columns?
desert oar
yes, it has multiple "levels" of column names
wicked grove
ebon lynx
are you trying to say you need to form words out of those characters first?
No i am getting position of each word
I have various invoices,i need to extract the text and convert that to json and pick a few key and value pairs and map it to the company's database
desert oar
you can see it in your screenshot here: https://cdn.discordapp.com/attachments/366673247892275221/893210872472805436/unknown.png

the outer level is ["MSFT", "SPY", "TLT"], the inner level is ["Open", "High", ...]
obsidian crystal
ok so lets say i wanna acess the SPY index
how can i do so
(Without doing data['SPY'])
desert oar
pandas conveniently lets you select datetime index values with strings, so you can do this:
data.loc["2021-08-01", "SPY"]
and that gives you the SPY OHLCV for 2021-08-01
you can use : to get a range:
data.loc["2021-08-01":"2021-09-01", "SPY"]
Waittt how come your putting SPY on the second part which is designated for Columns?
desert oar
see here for an extended overview of date time functionality https://pandas.pydata.org/pandas-docs/stable/user_guide/timeseries.html#time-series-date-functionality
desert oar
obsidian crystal
Waittt how come your putting SPY on the second part which is designated for Colu...
because i'm demonstrating how you'd get the SPY data for a date or date range
if you want all the tickers, just don't pass the 2nd argument to .loc[]
data.loc["2021-08-01":"2021-09-01"]
I want a specific ticker BUT i dont want to pass in the title of the ticker
desert oar
or use :
data.loc["2021-08-01":"2021-09-01", :]
but there isn't any need to do that
obsidian crystal
i wanna do it my number
obsidian crystal
waitttt
desert oar
(remember these are 0-indexed, so the first element is 0)
desert oar
iloc[] is for getting things by position, loc[] is for getting things by label
obsidian crystal
so basically a FULL ass dataframe is acting as a column?
usually i use iloc for acessing columns
desert oar
i personally always prefer using labels and loc instead of iloc
desert oar
obsidian crystal
so basically a FULL ass dataframe is acting as a column?
kind of. a better way to think about is, the columns are pairs of values, e.g. ("MSFT", "Close")
data[("MSFT", "Close")] would select only the Close column for the MSFT ticker, and return a Series
data[[("MSFT", "Close")]] would select only the Close column for the MSFT ticker, and return a DataFrame
data["MSFT"] would select all of the columns whose first value is "MSFT", returning a DataFrame of all the MSFT columns
multi-indexes are extremely useful in pandas
obsidian crystal
let me tell u what im basicallly trying to do.
You see how the data has this "none" row. I want to loop through each ticker and delete the none rows.
BUT i wanna do this dynamically though. If i change the tickers from MSFT, TLT, SPY. To something else.... then i would have to change names over and over again. Thats why instead, i wanna acess by number.
desert oar
data = yf.download(...)
data.dropna(inplace=True)
or
data = yf.download(...)
data = data.dropna()
that said, i don't see why you need iloc at all here
if you really do need to loop over columns, you can loop over them by name
for c in data.columns:
    series = data[c]
    ...
or even better
for colname, series in data.items():
    ...
wait
waitttt
im so confused now
thast what i dont get
so how is a ticker a column?
desert oar
it's not a column, it's a grouping of columns
earnest shuttle
desert oar
it's not a column, it's a grouping of columns
I have executed the code that I mentioned before now its done
obsidian crystal
how do i use this?
for colname, series in data.items():```Also now i have another doubt lmao
desert oar
obsidian crystal
how do i use this?
```py
for colname, series in data.items():```
!d pandas.DataFrame.items
arctic wedgeBOT
DataFrame.items()```
Iterate over (column name, Series) pairs.

Iterates over the DataFrame columns, returning a tuple with the column name and the content as a Series.for colname in columns_for_scoring:
auc = roc_auc_score(newdata['diagnosis'], newdata[colname])
print(auc)
For this I am getting a lot of values and I want to sort them... auc.sort() doesnt work what do i do
obsidian crystal
how do i actually see the contents of colname, series?
i essentially want to for instance loop only through the close
desert oar
obsidian crystal
acess the close
you want the close of all tickers?
all_close = data.loc[:, pd.IndexSlice[:, "Close"]]
that's just a regular for loop, don't overthink it
i recommend carefully reading through the docs i linked
obsidian crystal
ok got it thanks!
lapis sequoia
Can someone provide an explanation of what low-level features and high-level features are? (talking about images)
 grave frost
lapis sequoia
Can someone provide an explanation of what low-level features and high-level fea...
grave frost
lapis sequoia
Can someone provide an explanation of what low-level features and high-level fea...
low level means simple features like straight lines
high level might mean more squiggler stuff like curves, ellipses etc.
grave frost
lapis sequoia
So basically a high-level feature consists of many low level ones?
yes, that's why they are stacked
 chilly finch
Can anyone help? I'm losing my mind over this:
I am reading in a JSON file contains all of the information coming from an API request. The file isn't very large, only about 200 items. I am attempting to loop through each item, store it as a pandas DataFrame, append it to a list, and concat the results into one DataFrame.
df_list = []
list_length = 53
for i in range(list_length):
df = pd.DataFrame(contenders_list[i]).T.reset_index()
df_list.append(df)
new_df = pd.concat(mylist)
new_df.head()
If I run this, it works. I have a DataFrame with the first 53 items from the JSON file. However, if I go above 53, like the actual length of the list, I get the following error:
ValueError: If using all scalar values, you must pass in an index
serene scaffold
chilly finch
Can anyone help? I'm losing my mind over this:
I am reading in a JSON file conta...
why are you iterating over range(list_length) and not over contenders_list directly? In either case, please provide the whole error message as it's likely to contain information that will help with this.
Please ping me if you see this and decide to provide the whole error message.
 errant parcel
does anyone have a good explanation of how PCA works that doesnt require knowledge of eigenvectors/lagrange
royal crest
errant parcel
does anyone have a good explanation of how PCA works that doesnt require knowled...
no, because PCA is a form of eigenvector-based multivariate analysis
errant parcel
sure i guess i want as much of an insight into the process that doesn't touch on that
but that might not be possible
royal crest
errant parcel
but that might not be possible

Medium
At the beginning of the textbook I used for my graduate stat theory class, the authors (George Casella and Roger Berger) explained in the…
have a read
notably the introductory paragraphs
tacit agate
can anyone help me answer this question
A new ≥40 year-old obese Pima Indian Women named Chenoa has the data as follows: Chenoa had 6 or more pregnancies, has a glucose reading of 140 or more, and has hypertension (Bloodpressure > 80). What is the probability that Chenoa has diabetes?
I'm working with a dataset to predict if the patient will have diabetes
here is where to download

Predict the onset of diabetes based on diagnostic measures
thank you!
royal crest
what do you need help with exactly
velvet thorn
tacit agate
A new ≥40 year-old obese Pima Indian Women named Chenoa has the data as follow...
is this a school assignment
tacit agate
royal crest
what do you need help with exactly
Can you guide me the ideas or some sample syntax that will help me to do it?
I don't know where to start
 prime hearth
if just learning machine learning, one resource i like is tech with tim machine learning, can learn the algos theres and libraries and dataframes and numpy etc.
However, the labels 0 or 1. So this can be a classifier algorithm. But it good to discuss with teacher what to know, or resources provided to learn what need to know.
chilly finch
serene scaffold
Please ping me if you see this and decide to provide the whole error message.
Okay, so I was making the original problem way more complicated. I revised my code and saved the API request straight into a DataFrame:
with open('horse.json') as f:
data = json.load(f)
contenders = []
base_url = 'https://www.breederscup.com/equibase/horse?horses[]='
for value in data:
re = requests.get(base_url+value['horse']).json()
df = pd.DataFrame(re).T
contenders.append(df)
new_df = pd.concat(contenders)
For reference, here's a snippet of the JSON file I'm loading from:
[
{"race": "Juvenile Turf", "horse": "AAA20EED"},
{"race": "Juvenile Turf", "horse": "19005288"},
{"race": "Juvenile Turf", "horse": "19000215"},
{"race": "Juvenile Turf", "horse": "19001752"}
]
So I'm using the value from the 'horse' key of the external JSON file to make the endpoint for the API.
However, like before, I'm hitting the scalar value error when there's more than 53 objects. If I mainly go into the JSON file and remove everything after line 53, it works great and I get the DataFrame I'm needing. Any idea on what's causing this?
chilly finch
serene scaffold
Please ping me if you see this and decide to provide the whole error message.
Here's the whole message:
ValueError: If using all scalar values, you must pass an index
ValueError Traceback (most recent call last)
<ipython-input-17-c2aad065bcc4> in <module>
7 for value in data:
8 re = requests.get(base_url+value['horse']).json()
----> 9 df = pd.DataFrame(re).T
10 contenders.append(df)
11
~/Library/Python/3.8/lib/python/site-packages/pandas/core/frame.py in init(self, data, index, columns, dtype, copy)
527
528 elif isinstance(data, dict):
--> 529 mgr = init_dict(data, index, columns, dtype=dtype)
530 elif isinstance(data, ma.MaskedArray):
531 import numpy.ma.mrecords as mrecords
~/Library/Python/3.8/lib/python/site-packages/pandas/core/internals/construction.py in init_dict(data, index, columns, dtype)
285 arr if not is_datetime64tz_dtype(arr) else arr.copy() for arr in arrays
286 ]
--> 287 return arrays_to_mgr(arrays, data_names, index, columns, dtype=dtype)
288
289
~/Library/Python/3.8/lib/python/site-packages/pandas/core/internals/construction.py in arrays_to_mgr(arrays, arr_names, index, columns, dtype, verify_integrity)
78 # figure out the index, if necessary
79 if index is None:
---> 80 index = extract_index(arrays)
81 else:
82 index = ensure_index(index)
~/Library/Python/3.8/lib/python/site-packages/pandas/core/internals/construction.py in extract_index(data)
389
390 if not indexes and not raw_lengths:
--> 391 raise ValueError("If using all scalar values, you must pass an index")
392
393 if have_series:
ValueError: If using all scalar values, you must pass an index
 hexed yew
Quick question, how can I fit code that is too large to send as a normal message?
Danke sir
 onyx drum
But if you didn't set a variable to store for np.savetxt(), how do you locate the array that corresponds to np.savetext()
wicked grove
desert oar
the "current figure" being the one that is operated on by top-level `plt.*` func...
If i use plt.subplot after ax.plot,ax being df.groupby('target').count()
Does that mean I can then use ax to set xticklabels etc
desert oar
wicked grove
If i use plt.subplot after ax.plot,ax being df.groupby('target').count()
Does t...
can you be more specific? if you use plt.subplots() it returns a new figure and a new axes object
wicked grove
yes exactly,everytime i used that it created a new one.
labels=['Negative','Positive']
ax=df.groupby('target').count()
ax.plot(kind='bar',title='Distribution of data',legend=False)
ax=plt.subplot()
ax.set_xticklabels(labels,rotation=0)
plt.xlabel('Target')
plt.show()
but when i use ax.plot it plots the graph for the groupby df,i'm having an issue in changing the xtick labels
 novel elbow
the result of ax=df.groupby('target').count() is a dataframe not a matplotlib axes
when you use the plot method you can give an ax: df.groupby('target').count().plot(..., ax=ax)
lapis sequoia
Is anyone here experienced with object detection networks for python? I have a few questions
tender hearth
lapis sequoia
Is anyone here experienced with object detection networks for python? I have a f...
Go ahead, ask your questions
tender hearth
I think YOLO is the go-to for fast inference in the field currently
lapis sequoia
tender hearth
I think YOLO is the go-to for fast inference in the field currently
Yes
But which yolo version?
There are sooo many
V5 yolor yolov3 etc

tender hearth
Last time I did some object detection work I used YOLOv5. I believe it's incrementally less efficient than YOLOv4, but is significantly faster to train + inference + transfer learning, so I used that
I believe they wanted the pre-trained models of YOLOv5 to be more generalizable. So it's easier and faster to retrain on another dataset.
lapis sequoia
tender hearth
Last time I did some object detection work I used YOLOv5. I believe it's increme...
Great
I only have one question left
But don't know how to ask it
As it might break a server rule
tender hearth
Go ahead, you can always delete it if it does break a rule
lapis sequoia
tender hearth
Go ahead, you can always delete it if it does break a rule
How much do you want in return for improving a neural network program
Like improving inference times, detection, etc
lapis sequoia
No because I don't no shit about python
I'm doing this to show a proof of concept to someone
And I'm willing to pay
tender hearth
That's great, because we are a Python server 😆 Lots of Python help here, no compensation required
My DMs are always open if you prefer that
wicked grove
novel elbow
when you use the plot method you can give an ax: `df.groupby('target').count().p...
Ohh thank you!
When i put ax=ax am i indicating that the ax subplot should plot the ax dataframe?
novel elbow
wicked grove
Ohh thank you!
When i put ax=ax am i indicating that the ax subplot should plot...
you indicate the dataframe plot method to use the axes subplot you created
wicked grove
Ohhh okayy
earnest shuttle
Hi
Need some help
for colname in columns_for_scoring:
auc = roc_auc_score(newdata['diagnosis'], newdata[colname])
print(auc)
For this I am getting a lot of values of auc and I want to sort them in ascending order but auc.sort() doesnt work what do i do
velvet thorn
earnest shuttle
for colname in columns_for_scoring:
auc = roc_auc_score(newdata['diagnosis']...
put everything in a list and sort that
earnest shuttle
velvet thorn
put everything in a `list` and sort that
It's raising an error - nonetype object is not callable
earnest shuttle
velvet thorn
put everything in a `list` and sort that
Can you show me the code for this?
 undone mist
Hi... I had written an article on face detection using OpenCV. Please DM me your valuable feedback so that I can improve the article.
Medium
To begin, we need to download the Haar cascade files from the following github link ….
 ocean briar
If there are people who know how to work with a json file that contains the history of correspondence and then use it to create a chat bot with AI, please contact me. Need your help!
pastel valley
what is the difference with image processing and image classification?
serene scaffold
chilly finch
Okay, so I was making the original problem way more complicated. I revised my co...
It's a lot easier to turn that json into a dataframe than you've made it out to be.
In [5]: data
Out[5]:
[{'race': 'Juvenile Turf', 'horse': 'AAA20EED'},
 {'race': 'Juvenile Turf', 'horse': '19005288'},
 {'race': 'Juvenile Turf', 'horse': '19000215'},
 {'race': 'Juvenile Turf', 'horse': '19001752'}]

In [6]: pd.DataFrame(data)
Out[6]:
            race     horse
0  Juvenile Turf  AAA20EED
1  Juvenile Turf  19005288
2  Juvenile Turf  19000215
3  Juvenile Turf  19001752
Also if each instance of {'race': ..., 'horse': ...} is its own response, you can accumulate all of them into one list and then convert the whole thing to a dataframe once.
ocean briar
who knows how to fix it?
 serene scaffold
ocean briar
who knows how to fix it?
serene scaffold
ocean briar
who knows how to fix it?
you've imported a module called config. I don't know what this module does, but it probably has a config reader. So the config that you have is probably not the configuration data.
ocean briar
solution?
serene scaffold
I don't know enough about what you're trying to do to say for sure. Look at where config is coming from and see what is in it.
ocean briar
I wanna import openai and gpt-3, idk, I just copypast from forum
serene scaffold
ocean briar
I wanna import openai and gpt-3, idk, I just copypast from forum
you can't really blindly copy and paste code as the people who provide it often make assumptions about how much you know. I would do print(config.__file__), find that file on your computer, and see what is in it.
ocean briar
ok,i'll try
prime hearth
Hello, i would like to please ask, would a machine leaening course from my school help me stand out in DS field? I have basic background of ML already but would showing an A for a ML course at my school help?
serene scaffold
prime hearth
Hello, i would like to please ask, would a machine leaening course from my schoo...
it certainly wouldn't hurt, but what would you have to give up to take that course?
 feral patrol
Does temporary saving your dataframe as parquet in a cluster before doing more operations help out? I do not need the temp dataframe, but I figure this could be a "recovery point" or help spark redistribute the data.
then creating a new dataframe by selecting * from this saved parquet
desert oar
feral patrol
Does temporary saving your dataframe as parquet in a cluster before doing more o...
Recovery point in case of failure yes, redistribution no. You need to explicitly re-partition for the latter
I wouldn't re-create the df every time, that's just wasteful
feral patrol
thanks, not sure why I had as a "fact" this in my head.
lapis sequoia
When to use a statistical model and when machine learning?
prime hearth
@serene scaffold oh nothing, im still in school so i taking that course
@lapis sequoia would it be okay what do you mean? Machine learning does use statistics, however for presentation purposes would use graphs or charts to show
lapis sequoia
hmm?
I was in specific wondering how regular A/B-Testing differs from a machine learning approach in my case
prime hearth
oh okay
well they are similar in that use math
however, ML is like continusly being adjusted and can handle large changing data then just regular math model
lapis sequoia
I got a set of images (say 10 images per product) and I want to predict for each specific customer which product image appeals them the most
prime hearth
oh okay, so A/B testing would. need to actually implement that
however, ML you can predict based on current or past data
lapis sequoia
So to get some kind of valuation for the ML prediction part, I need to implement an A/B-Test to gather that initial data?
And with just A/B-Testing I can't make customer-specific predictions based on collected data?
Since every customer is different, this could be taken into account. Also every product image is different in shape, color, texture etc.
prime hearth
oh okay, maybe someone else can answer this... i never worked with AB testing but i am familar what it does. Not sure what would be best for your case
lapis sequoia
A/B-Testing compares two different variations of some product image and checks which one leads most to a conversion (purchase of the product)
prime hearth
yes, i am familar with it, it just i dont have much experience to give professional answer
im just a student doing Machine learning and software development
lapis sequoia
Ah okay, yeah I need some professional answer, this is for my thesis
prime hearth

hello, how can i please vectorize this?
i have a 2d array filled with 1s
and would like to apply transformation for each x using this formula
however, i wanted to avoid using a for loop because time complexity
whereas vectorizing is fasteer
this function (the image or formula)is for an individual x
my issue is i not sure how to apply this transformation via vectorize form, with a for loop i would just assign [i][j] = new trasnformation, but not sure vectorize form since the x param is for single x...
hm okay i have one idea , but would appreciate feedback
 lilac dagger
hello! i found a course on EDX but not sure if it's worth taking, do yall have any free courses i can take?
prime hearth
i was thinking if making a copy of the array and subtracting it with. "u" and apply trasnformation individually then multiply to another array to get new values?
its kinda hard to see @lilac dagger since need to be signed up to see syllabus
but usually, if it free then why not if it a learning path that suits you best. If paid, then again its up to you but it good to do research because most ML courses can be learned on youtube really/open ml courses, like freecodecamp which will release ML course soon.
desert oar
prime hearth
however, i wanted to avoid using a for loop because time complexity
time complexity is a statement about the number of operations that need to occur, it has nothing to do with how fast those operations are. generally vectorized operations don't have any better time complexity than for loops, but they are much faster because the processor does a lot less work
prime hearth
oh okay salt thanks for that clarification, but in practice inn professional environemtn its always prefer vectorizing over loops?
lapis sequoia
lapis sequoia
Ah okay, yeah I need some professional answer, this is for my thesis
bumping up my question
desert oar
prime hearth
hint: try writing this with numpy arrays. numpy arithmetic operations like -, -, and np.exp are already vectorized over arrays.
prime hearth
yeah, that was one of my idea to apply transformatino individually as you said, okay. i. will do this thanks!!
desert oar
prime hearth
oh okay salt thanks for that clarification, but in practice inn professional env...
not always. but in python specifically, looping with for is a lot lower than using numpy-vectorized operations, which loop very efficiently in highly-optimized C code
desert oar
prime hearth
i was thinking if making a copy of the array and subtracting it with. "u" and ap...
i'm not see why you need to explicitly make a copy. you might want to re-read the numpy basics documentation, including the information on "broadcasting"
prime hearth
oh right numpy actually returns a new array
desert oar
prime hearth
so it doesnt actually modify existing one
desert oar
correct
prime hearth
oh okay thanks
 twilit fiber
I'm working on an News Classification task. The dataset I'm using is from ACLED and it contains 1M+ samples (1,034,527) which is highly imbalanced and contains 25 classes. The majority class (PEACE_PROTEST) has 305,383 samples and the minority class (CHEM_WEAP) has just 4.
I have use pre-trained RoBERTa-base that I trained for 3 epochs (weights of the 2nd epoch were retained due to callback after 3rd epoch).
For Preprocessing = I've cleaned the text (removing date, months and all symbols) + removing stopwords + lemmatization.
In this, in-order to handle imbalance I resampled the data in the following method :
1. All classes with 20K+ samples under sampled (capped) to 20K.
2. All classes b/w 20K and 5K retained as they are.
3. All classes b/w 5K and 1K samples were oversampled to twice the number.
4. All classes below 1K are oversampled by 500%.
5. Along with this I used class_weights in-order to land on correct weights during training.
--After Resampling--
Final training Data Size = 257,967
Final validation Data Size = 28,664
training results:
categorical_accuracy: 0.8789 - f1_score: 0.8767 - val_loss: 0.3644 - val_categorical_accuracy: 0.9134 - val_f1_score: 0.9137
Still the model fails to generalize well. When I used on Test Data.
F1 score (test) = 0.66 and F1 score for CHEM_WEAP class = 0.
**My Questions : **
- How can I improve this overall F1 score and especially for CHEM_WEAP class? Can you suggest to me some other methods / models for preprocessing / handling imbalanced data in order to get better results?
- What different heuristics or the features can I use for an ablation study.
Colab Notebook Link : https://github.com/kartickgupta/shared-task-2021/blob/main/Shared_Task_2021_RoBERTa_base.ipynb
classification report is at the last of the Notebook.


GitHub
Contribute to kartickgupta/shared-task-2021 development by creating an account on GitHub.
desert oar
@twilit fiber seems like it's probably overfitting to the train data. i'm not sure if bert performs well after removing stopwords, since it's trained on natural language and originally intended for sequence translation
did you inspect the bert vectors to made sure that they actually make sense? e.g. similar sentences should be similar in the vector space
did you inspect any of the misclassified instances to see if you could figure out a reason?
you're not using any regularization?
maybe even plotting this data with umap and coloring by class label could help
or coloring by classified correctly vs incorrectly
looking at the distribution of predicted class scores too
lapis sequoia
how can i make AI for snake game?
desert oar
lots of little ways to get more information about what exactly is going wrong
 chilly geyser
desert oar
time complexity is a statement about the number of operations that need to occur...
chilly geyser
desert oar
time complexity is a statement about the number of operations that need to occur...
I would say no. Vectorized operations can be due to Time-Space tradeoffs
desert oar
chilly geyser
I would say no. Vectorized operations can be due to Time-Space tradeoffs
that's true too, but i didn't want to go there 🙂
also some vectorized operations are "slower" in that they make more passes over the data, even though they are still asymptotically linear (edit: this is what the numexpr library is for)
serene scaffold
The figure that I have and the code that made it
# result.shape  >>> (90900,)
fig = plt.figure(figsize=(10, 8))
ax1 = fig.add_subplot(311)
a, b, c, d = plt.specgram(result, Fs=10, aspect='auto', interpolation='none')
fig.colorbar(mappable=d, orientation='horizontal', ax=ax1)

What I want:
 chilly geyser
desert oar
also some vectorized operations are "slower" in that they make more passes over ...
chilly geyser
desert oar
also some vectorized operations are "slower" in that they make more passes over ...
Yeah it's quite the rabbit hole and I'm not an expert. I would say the easiest possibility is parallelization over Monte Carlo which wants and likes independent calculations
desert oar
serene scaffold
The figure that I have and the code that made it
```py
# result.shape >>> (9090...
is it like "smearing out" the data somehow? i had this problem years ago with ggplot2 and it turned out that the plotting backend was doing its own interpolation/smoothing
rather, it was the PDF renderer

Stack Overflow
When I save a ggplot that uses geom_raster, the tiles come out "smeared". It's the same result if I use ggsave() or pdf(). I don't have this problem with geom_tile or image. I don't have this problem
serene scaffold
desert oar
is it like "smearing out" the data somehow? i had this problem years ago with gg...
plt.specgram is making decisions about how it should look that I don't understand. But then, I don't understand the code that created the image I'm trying to replicate, either.
desert oar
serene scaffold
plt.specgram is making decisions about how it should look that I don't understan...
i don't know what specgram does, but maybe you can redo whatever it does manually with imshow
lapis sequoia
https://paperswithcode.com/sota/image-classification-on-imagenet this is actually very impressive

The current state-of-the-art on ImageNet is CoAtNet-7. See a full comparison of 465 papers with code.
 odd hound
can anyone explain link prediction to me? in brief.
i have to make my semester project on that and i asked my prof. and he told me to study a bit about the topic and then he'll assign me the actual project
i'm looking for some code examples, i read the theory part but dont have any idea about how to implement that as i've never done anything in ML/AI
uncut barn
Hi guys I have a problem my images are named of this type with the last number i.e. 244 ranging from 1 to 3 digits, "img42_patch_104_244" is there a way to extract the last number for each image file name?
lapis sequoia
odd hound
i'm looking for some code examples, i read the theory part but dont have any ide...

Link prediction explores the problem of predicting new relationships in a graph based on the topology that already exists.
This has been an area of research for many years, and in the last month we've introduced link prediction algorithms to the Neo4j Graph Algorithms library.
In this session Amy and Mark will explain the problem in more detai...
odd hound
lapis sequoia
https://www.youtube.com/watch?v=5tuWnq_18Qw
thanks i'll check it out
 coral sage
how do I use pandas to see only the rows where a specific column doesn't have a unique value?
df.specific_column.duplicated() returns a series with true/false
but I wanna see the entire row and only the ones that are duplicated
twilit fiber
desert oar
<@!316916448935018498> seems like it's probably overfitting to the train data. i...
Hi @desert oar ! I've already added a dropout layer. Should I add a regularization layer? Can you suggest me other methods to prevent overfitting?
`def create_model(roberta_model):
# Input Layer for RoBERTa
input_ids = tf.keras.Input(shape=(max_length,),dtype='int32')
attention_masks = tf.keras.Input(shape=(max_length,),dtype='int32')
# RoBERTa
output = roberta_model([input_ids,attention_masks])
output = output[1]
Adding Layers for Classification on RoBERTa
output = tf.keras.layers.Dense(32,activation='relu')(output)
output = tf.keras.layers.Dropout(0.2)(output)
output = tf.keras.layers.Dense(units=max_classes,activation='softmax')(output)
model = tf.keras.models.Model(inputs = [input_ids,attention_masks],outputs = output)
Model Compilation
model.compile(optimizer= opt,
loss= loss,
metrics = metrics)
return model` This is the current architecture I'm using.
lapis sequoia
can someone suggest me some good videos on youtube to learn all the basic data science skills?
like something related to data analysts//data architects
desert oar
twilit fiber
Hi <@!389497659087650836> ! I've already added a dropout layer. Should I add a r...
ah, i don't know if you need both
burnt knot
@quasi parcel Out of curiosity, how has it been going the past week with my data and machine structure?
lapis sequoia
Is some1 able to find a good definition of what low and high level features are?
Or provide one
I know what they are I just can't find the right wording
(Regarding images)
plush leaf
    r = requests.get(label,
                  stream=True, headers={'User-agent': 'Mozilla/5.0'})
    img = plt.imread(r.raw)
plt.imshow(img, extent=[value - 8, value - 2, i - height / 2, i + height / 2], aspect='auto', zorder=2)``` I get an error (TypeError: No loop matching the specified signature and casting was found for ufunc true_divide ) in ```img = plt.imread(r.raw)``` .How can I fix it?@lapis sequoia for data scientist , i found one that really gives practical insight into industry, sure there are more but just one is Krish Naik, check out his youtube channel
he is self taught ML, and he gives lots of helpful resrouce on application to DS, resume for DS, and everything really featureing engineering, deep learning, and explains everything in depth even the math and stats required, he has really good channel to like learn and apply to ML jobs.
but if would liek a video that shows just how to implement basic ml, and how to get data and just like to wet your appetite is the expression, then tech with tim ML course would be one.
prime hearth
Hello, i would like to please do think a text summarizer and classifcation postive or bad is good ML project to employers as someone gettingg into DS industry? This project is also end to end with react and flask. How the app works is a user types in a restaurant name and it will give reviews for that place and summarize reviews and also classify as positive or negative
 arctic crown
can someone please explain supervised learning
novel elbow
arctic crown
can someone please explain supervised learning
you want to get y from x, you have examples of such pairs, then supervised learning is trying to approxiamte a function f such that f(x) = y
royal crest
define good
velvet thorn
arctic crown
what exactly are tensors? in simple terms
okay
so
you know what scalars and vectors are?
velvet thorn
say you have
a car, right
it weighs maybe
1000 kg?
that's a scalar
a number
without any sort of "direction"
now imagine that you're in the car and it's moving
at maybe 50 km/h?
but you're travelling northeast, so that's 30 km/h north and 40 km/h east
does that make sense?
arctic crown
mhmm
velvet thorn
so you can represent your speed
with a vector
which can be thought of as a grouping of scalars
[30, 40]
all g?
royal crest
arctic crown
what exactly are tensors? in simple terms
i'd say n-dimensional data structures
arctic crown
and whats n?
royal crest
n being an arbitrary number
some tensors have their own names, such as vectors (n=1) and matrices (n=2)
arctic crown
velvet thorn
does that make sense?
mhmm
velvet thorn
arctic crown
mhmm
okay.
so now imagine
you have like 10 cars going all over the place
each of them
has its own velocity vector
and you can stack them together to produce a matrix
e.g.
[
  [30, 40] <- this is our car from just now
  [45, 20]
  [70, 0] <- the 0 means that this car is going due north
  ... <- 7 more cars here
]
get this part?
arctic crown
wait wait
arctic crown
velvet thorn
but you're travelling northeast, so that's 30 km/h north and 40 km/h east
how does this work?
velvet thorn
arctic crown
how does this work?
how does what work
arctic crown
"but you're travelling northeast, so that's 30 km/h north and 40 km/h east"
"that's 30 km/h north and 40 km/h east" this part
arctic crown
how is it 30 km/h north and 40 km/h east
velvet thorn
arctic crown
how is it 30 km/h north and 40 km/h east
well
you know
like
right-angled triangles?
arctic crown
mhmm
velvet thorn
the hypotenuse is 50 km/h
your actual speed
and the other 2 sides
are hte components
arctic crown
shit maybe i need to revise math
any other way of learning this? @velvet thorn
you there?
 abstract torrent
Can anyone spare some time to help me with a dataset that is confusing the hell outta me?
it's a classification problem, but idk how to use the dataset because it's the first time im seeing a dataset like this
any help will be appreciated, thanks!
dm me if you can spare some time 🙂
tender hearth
arctic crown
what exactly are tensors? in simple terms
in computer science, an N-dimensional array
when N = 1, that tensor is a vector
when N = 2, that tensor is a matrix
[0, 1] this is a vector, [[0, 1], [1, 2]] this is a matrix
for example, let's say you wanted to predict prices of houses given their coordinates and their size
a house would be represented as a vector of length 3, [latitude, longitude, size]
velvet thorn
arctic crown
shit maybe i need to revise math
you should
like past 2D it gets pretty abstract
like I can give reasonably layperson accessible explanations but
there’s no substitute for theory when you actually want to work with these things
 quick kestrel
Guys I want to make a chat bot api but I need ml in it so can anyone tell me how can I get started
serene scaffold
quick kestrel
Guys I want to make a chat bot api but I need ml in it so can anyone tell me how...
What topics should the chat bot be able to talk about?
quick kestrel
@serene scaffold anything
serene scaffold
@quick kestrel a general purpose chat bot is going to be exceptionally difficult, and probably not as interesting as if you make a chat bot that's uniquely good at one thing.
quick kestrel
Ok so plz tell me how to make it
serene scaffold
@quick kestrel well, have you come up with a narrower range of topics?
Look at it this way: your chat bot isn't a real person. They don't have any life experiences to draw from. So what would it even talk about?
serene scaffold
@quick kestrel one of the OG chat bots was a therapist bot, and because people only expected it to talk about things that you tell it about, some people thought it was a real human therapist
But if you know it's a bot, your expectations change and you can see through the illusion.
quick kestrel
Got it
 eager imp
real chat bots are exceptionally difficult, conceptionally and practically
there's the concept of using GPT-3 for this purpose, which has produced some good results
you could try to look into research done on nltk and keras
eager imp
you should check one of the help-channels for this kind of question
wicked grove
And is using .loc or .iloc better for this purpose?
wicked grove
eager imp
you should check one of the help-channels for this kind of question
Alrightt
prime hearth
Hello, i would like to please ask do think a text summarizer and classifcation postive or bad is good ML project to employers as someone gettingg into DS industry? This project is also end to end with react and flask. How the app works is a user types in a restaurant/business name and it will give reviews for that place and summarize reviews and also classify as positive or negative. It uses naive bayes algo and RNN encoder decoder lstm
 charred umbra
Have any of you guys ever used a fast foruier transform to reduce calculated error between images to observe image data distribution? I haven't seen it used in this context very much or at all. I used it to develop a math model this year, but dont know if that's normal. Is this a viable way to calculate reduced error in image data?
eager imp
calculated error between images?
charred umbra
eager imp
calculated error between images?
yeah to examine the distribution of images (with an MSE)
desert oar
Maybe it's like for reducing noise?
Like you compare the fourier transforms instead of differencing pixels?
 copper dirge
Could someone assist me in #help-dumpling ?
charred umbra
desert oar
Like you compare the fourier transforms instead of differencing pixels?
I did it to reduce the error associated with diff feature locations. Since a FFT would relocate the pixel values so that the images would all look similar to the human eye, but a computer could analyze them for a more true expression of error between the image data
charred umbra
eager imp
why do you need that?
to relocate the pixel values of an image entirely instead of extranous processing
desert oar
charred umbra
I did it to reduce the error associated with diff feature locations. Since a FFT...
Makes sense, but where does MSE come in? You are using the frequency spectrum of the image as input to some model?
charred umbra
desert oar
Makes sense, but where does MSE come in? You are using the frequency spectrum of...
So I did it to observe the distribution of image data cuz I like to visualize stuff. Basically did FFT, then compared MSE, and then bootstrapped to same freq
desert oar
MSE relative to what?
charred umbra
desert oar
MSE relative to what?
MSE just between the images (comparing the error between 2 randomly selected images) and bootstrapped the vals to visualize
desert oar
Bootstrapped what exactly?
RMSE is maybe better called "euclidean distance" in this case 🙂
But then you get a single point for each pair of images
Did you just plot the squared difference between two images frequency spectra?
charred umbra
yeah all those distances or errors gathered into a list, and then bootstrapped to 5000 samples for distribution
with a random sample of means
eager imp
i still don't get the point of MSE in this case besides plotting something
also, FFT of what
pixel over time? pixel per image?
eager imp
charred umbra
I did it to reduce the error associated with diff feature locations. Since a FFT...
"feature locations" sounds like the exact opposite of an FFT
it sounds much more like wavelets
charred umbra

I used it like this to relocate feature dense pixels to the outside and the feature void pixels to the iside to have the images in somewhat the same format
eager imp
that.. doesn't make any sense to me
charred umbra
Since Im relocating based on FFT, the data is changed from a space domain into the frequency one right?
therefore the locations of features in an image wouldnt matter, just how many of them are there.
which was more ideal for comparig the error for my visualization
eager imp
why not just compare FFTs directly?
charred umbra
eager imp
why not just compare FFTs directly?
what do you mean by this?
eager imp
FFT per row for instance
charred umbra
eager imp
FFT per row for instance
I just needed a distribution of error for data (that was a requriement for my school project lmao), and in this case, it was images. Comparing FFTs for entire images would be much easier to represent in a graph than by row, which was why I did ti
 eager imp
what was the full problem description?
charred umbra
The idea was to use FFT on data in some way thats relatively uncommon
eager imp
eh.. okay
azure marsh
Sounds reasonable, as long as you are aware of FFT collisions (if you're just using magnitude) and sensitivity to noise
It's not used much in practice for those reasons, there are much better embedding spaces that could be used
charred umbra
azure marsh
It's not used much in practice for those reasons, there are much better embeddin...
Yeah I heard about that, so I decided to only use it for visualization and not for the actual model
azure marsh
eager imp
"feature locations" sounds like the exact opposite of an FFT
From what I am grokking, they're just interpreting high frequency information as "features"
Ignoring their spatial location, but placing their values on the edges of the FFT magnitude image
eager imp
azure marsh
From what I am grokking, they're just interpreting high frequency information as...
i wouldn't call that "features" but that's just me..
azure marsh
I wouldn't either, but I could understand why one would think that has the most useful information
eager imp
isn't it often the other way round?
azure marsh
If you have a very consistent source of images it could be reasonable
eager imp
high frequency is most often the noisiest
charred umbra
eager imp
i wouldn't call that "features" but that's just me..
Yeah I didnt want to call them that, but non CS people would always get confused If I didnt explain it that waay
azure marsh
With say medical scans or something, maybe not
charred umbra
azure marsh
If you have a very consistent source of images it could be reasonable
yeah they were all X-rays, so the source of images was very similar
azure marsh
Yup that last graph made me understand that
eager imp
charred umbra
yeah they were all X-rays, so the source of images was very similar
doesn't "consistent" here mean random noise across all spectra?
i'd think that pink noise would easily make a mess out of this approach
azure marsh
Depends on the magnitude of the noise relative to signal
But if it's from the same source it could be prefilteted easily
eager imp
hm
charred umbra
I mean idk the superspecifics, but it generally did what I wanted it to do. The error between the FFT compiled images was way less than the regular ones
azure marsh
I agree that if the x-rays were noisy in different ways, it wouldn't have worked
In this case I assume they were pretty clean to begin with
charred umbra
yeah since the medical records kinda have to be that way for the radiologists to analyze
azure marsh
Humans can ignore noise very easily
eager imp
i'm still not 100% convinced it's something you'd want to work with in practice, but as a school experiment - why not
charred umbra
Yeah for this specific situation it worked out, but we'd have to test it out more to find out if it's really viable
eager imp
try to test against augmented data
apply different kinds of noise
or some "pixel errors" - set random spots to 0
charred umbra
for my school project I needed to talk about sources of error, but natually, a computer project has less error than a lab experimnt (which is what most of my classmates did). I had to have one thing to talk about for flaws in the procedure, so I took a risk lol
charred umbra
eager imp
try to test against augmented data
Yeah I might try it out with RGB data too, since all of the x-rays were greyscale
azure marsh
Most likely the differences between those classes ended up being texture on the organs, not the shape of the organs, for example, so higher frequencies make sense here instead of say consistent landmarks for naturall images
charred umbra
with certain things RGB does matter, but for pure testing purposes, I might try it there too
its kinda something not many do, so I couldnt really find much info available on it
azure marsh
We used it all the time before AlexNet
charred umbra
azure marsh
We used it all the time before AlexNet
I was 6 when AlexNet was invented, so im not too aware lol
azure marsh
Hah, I figured, but you most certainly can find information online about FFT for image analysis
It might be buried in conference papers or books though
not blog posts
charred umbra
azure marsh
It might be buried in conference papers or books though
yeah I had to kinda dig deep to even find it
Id never even heard of it before
desert oar
charred umbra
yeah all those distances or errors gathered into a list, and then bootstrapped t...
What does bootstrapping achieve? Bootstrapping is usually for estimating the distribution around point estimates...
desert oar
azure marsh
It might be buried in conference papers or books though
There are lots of course slides etc on ddg if you search "fourier analysis images"
If you only want a distribution of distances just do KDE or a histogram
charred umbra
desert oar
What does bootstrapping achieve? Bootstrapping is usually for estimating the dis...
I did it cuz there were diff amounts of images for Corona, TB, Cancer, and Pneumonia, So I wanted to observe the shape of error when there were the same # of samples. So I bootstrapped 5k samples for each of them \
desert oar
Unless it's a really small dataset in which case bootstrapping just makes the numbers bigger and doesn't change anything
charred umbra
and I didnt wanna just omit images
desert oar
Why would you need them to all be the same size?
Just normalize the distance distribution
And really these are distances, not errors
charred umbra
So I did consider just normalizing the distribution, but I figured that since some of my data had like 5k samples and others had only a couple hundred, Id want to resample some of them at least a little
desert oar
You wouldn't need that unless you were fitting a model
 next lance
How can we make a chat bot using Python for Deep learning and Java for graphics
I am leaning Numpy and Tenserflow by Sentedex
Are there any good tutorials on it
Or a video
Can I get a someone to help me with this
eager imp
looks like chatbots with ML are the new todo list
 pliant bone
has anyone run pytorch code on amd gpus ? last time checked the support wasn't there
https://pytorch.org/blog/pytorch-for-amd-rocm-platform-now-available-as-python-package/


 austere swift
rocm support was added in pytorch 1.8
but you can't use it with windows (because you can't use rocm at all in windows anyways)
so if you wanna use rocm you have to use linux
arctic crown
please help
whats a vector?
grave frost
arctic crown
please help
whats a vector?
its exactly what you learned in high school
arctic crown
i forgot
serene scaffold
arctic crown
please help
whats a vector?
a one-dimensional array. A sequence of numbers. What you do with them from there is up to you 😄
There are also row vectors and column vectors, which are two dimensional, but where one of the dimensions has a length of 1.
does that help?
pliant bone
austere swift
so if you wanna use rocm you have to use linux
thanks for the info, no problem with linux 🙂
austere swift
pliant bone
thanks for the info, no problem with linux 🙂
fair warning though, rocm support is still beta so it may be finicky
i've heard of a few issues with people running rocm
 eager night
Im new to ML, how can I develop a modular model that predicts based on location? For example, I have 5 different stores and I have data sorted monthly for each of the stores, how can I predict sales based on location? Right now I have only worked on linear regressions, and I was wondering if something like this is possible.
serene scaffold
eager night
Im new to ML, how can I develop a modular model that predicts based on location?...
It depends on what information you have about the stores. Can you give a literal example of what data you have? (So if it's a csv, a few lines if it)
 misty flint
so for sklearn, you can easily apply L1 or L2 regularization with the penalty parameter (https://scikit-learn.org/stable/modules/generated/sklearn.linear_model.LogisticRegression.html), but is there an equivalent if you need to use tensorflow? i think im blind since i cant find it in the documentation.
oh this is for logistic regression, not any neural net models
desert oar
https://www.tensorflow.org/tutorials/keras/overfit_and_underfit#add_weight_regularization it looks like you have to add regularization to each layer individually

TensorFlow
misty flint

tender hearth
I'm trying to think of a clean way to stack PyTorch tensors like so
>>> stack([[0, 1], [2, 3]], [[4, 5], [6, 7]])
[[0, 1], [2, 3], [4, 5], [6, 7]]
oof. forgot about concat
arctic crown
serene scaffold
does that help?
yea so vectors are basicly a list that has more than 1 value
serene scaffold
arctic crown
yea so vectors are basicly a list that has more than 1 value
What do you mean by more than one value?
arctic crown
[1,2,3,4,5,6,7]
serene scaffold
You can have an empty vector
[] is fine
But yes. Also unlike lists, everything has to be the same type. Most of the time this will be a numeric type.
arctic crown
yea
austere swift
vectors are very similar to lists
one primary differentiator though is that you can do a vectorized operation over the whole thing
and like stelercus said they all have to be the same datatype (that's so the vectorized operations can work, it wouldn't work if the vector had different types)
next lance
eager imp
looks like chatbots with ML are the new todo list
ya they are you know anything about them
desert oar
@arctic crown note that a "vector" in math is a very different concept from a "vector" or "array" in programming, even though you can use the latter to represent the former
arctic crown
serene scaffold
a one-dimensional array. A sequence of numbers. What you do with them from there...
Can you please explain tensor
eager night
serene scaffold
It depends on what information you have about the stores. Can you give a literal...
I have location id, week numerical value (1-52) and sales in USD. I want it to predict sales for a given location and week, assuming it follows the same trends as previous few years.
 harsh bear
import discord
import asyncio
import csv
from discord.ext import commands,tasks
from datetime import datetime
import pytz

class Vote(commands.Cog):
    def __init__(self, bot):
        self.bot = bot


    @commands.Cog.listener()
    async def on_ready(self):
        self.checkVoteTime.start()
        self.member_update.start()

    @tasks.loop(seconds=20)  # repeat after every 20 seconds
    async def checkVoteTime(self):
        #code tht works


    @tasks.loop(seconds=20)  # repeat after every 20 seconds
    async def member_update(self):
        dt_string = now.strftime("%-H")
        if int(dt_string) == 13:
            time = datetime.strftime(datetime.now(), "%H:%M:%S")
            time_IST = datetime.strftime(datetime.now(pytz.timezone('Asia/Kolkata')), "%H:%M:%S")
            data = [time, time_IST, len(self.bot.users)]
            with open("databases/members.csv", 'a+', newline='') as csvfile:
                writer = csv.writer(csvfile)
                writer.writerow(data)

            time = datetime.strftime(datetime.now(), "%H:%M:%S")
            time_IST = datetime.strftime(datetime.now(pytz.timezone('Asia/Kolkata')), "%H:%M:%S")
            data = [time, time_IST, len(self.bot.guilds)]
            with open("databases/servers.csv", 'a+', newline='') as csvfile:
                writer = csv.writer(csvfile)
                writer.writerow(data)