#data-science-and-ml
1 messages · Page 341 of 1
 desert oar
desert oar
desert oar
it doesn't really construct a vector - it concatenates them together
1 is already a length-1 vector, so c(1, 2) is like [1] + [2] in Python
if you have used the Pandas library, it is heavily inspired by R
Numpy is more inspired by Matlab than R, but still is R-like in many aspects
note also that R is really really old - its ancestor S is about as old as C. so there is a lot of weird stuff in it. be patient when learning it
 fluid sparrow
I definitely need to brush up on what I know and get used to R
I did not know it was ancient
desert oar
there is an official introductory guide but i have no idea if it's good https://cloud.r-project.org/doc/manuals/r-release/R-intro.html
An Introduction to R
fluid sparrow
anything helps 🙂 I appreciate it
desert oar
chapter 2 seems decent on first glance
it's quite thorough, there's certainly no python equivalent
fluid sparrow
it seems very detailed!
 bold timber
Hi, i have a question: What's exact encoder to feature have many category?
 gaunt marsh
You're right. I thought about it and I only need one axis which should show me how much of one value is appearing in all files together.
@desert oar you helped me a lot with this. Maybe for the last time, do you have a idea how to plot the total amount of identical subarrays in my chart?
 robust cosmos
what could be the problem here ? Can anyone explain please?

 velvet thorn
robust cosmos
what could be the problem here ? Can anyone explain please?
velvet thorn
robust cosmos
what could be the problem here ? Can anyone explain please?
what version is your MPL
that should wor kfine
robust cosmos
velvet thorn
what version is your MPL
i am using colab so must be a latest one
 robust cosmos
plt.scatter(data2['PROD_QTY'],data2['TOT_SALES'])
plt.xlabel=('Product Quantity')
plt.ylabel("Total Sales")
plt.show()
apparently i dropped an = there and ran it which did something idk
robust cosmos
restarted the kernel it works fine now
velvet thorn
that's the reason
you reassigned the xlabel attribute of plt
I would suggest
in general
using Axes and Figure objects
instead of plt
 royal crest
i agree
robust cosmos
Thank you guys i will look more into it now . Still learning.
robust cosmos
appreciate it very much
 fathom crown
hi guys, I had a quick question. I have to share a data science assignment via google colab and I have already compiled and ran it from my end - resulting in a variety of figures and plots which show on my end. If I share the link of it - does the person have to re run the notebook to see the output or can they see an instance of it like the way i do after having it compiled in its entirety? I was trying to implement a dashboard but that would go way past the deadline - and was wondering if this is a good way to go about sharing the work
there are package dependencies as well so I am worried about that as well.
when i try looking at the shared link of google colab in an incognito window i do see the compiled notebook along with all the plots in its entirety
 serene scaffold
fathom crown
hi guys, I had a quick question. I have to share a data science assignment via g...
serene scaffold
fathom crown
hi guys, I had a quick question. I have to share a data science assignment via g...
Matter of terminology, running/executing the code is not compiling it.
And yes, I believe that colab is intended to be sharable.
fathom crown
yes i meant executing
fathom crown
serene scaffold
And yes, I believe that colab is intended to be sharable.
got it!
 lapis sequoia
fathom crown
hi guys, I had a quick question. I have to share a data science assignment via g...
lapis sequoia
fathom crown
hi guys, I had a quick question. I have to share a data science assignment via g...
they can see it the way it was executed by you with the output. that's the beauty of colab.
and about dependencies.
we can also put a cell for installing those so other people don't get stuck by module not found error.
i think you are aware that we can do ! pip install whatever
but in case you're not, we can put these in tabs to make sure they execute them so they don't get those error.
(i should say that's the beauty of notebooks so it just came with colab.)
 lilac geyser
I was referring to this kaggle notebook
https://www.kaggle.com/inzamamsafi/data-cleaning-eda-classification-beginner

Explore and run machine learning code with Kaggle Notebooks | Using data from Loan Prediction Problem Dataset

My question is
Why should we need to drop the dependents column?
What I have understood is
Since the Loan_status=0 vs Dependents graph is neither increasing nor decreasing, so there is no relation between them hence we drop the column
Is my analysis correct?
 tacit basin
how to install python 3.10 with conda? possible?
 rigid zodiac
tacit basin
how to install python 3.10 with conda? possible?
rigid zodiac
tacit basin
how to install python 3.10 with conda? possible?

Stack Overflow
I am currently on ubuntu 18.04.
My default python version is Python 3.7.9
I wanted to upgrade it to Python 3.9.2 and set it as default python version
How do I do that ?
not with conda unfortunate but you can use terminal
desert oar
gaunt marsh
<@!389497659087650836> you helped me a lot with this. Maybe for the last time, d...
sum the counts of the values with more than 1 appearance
tacit basin
rigid zodiac
try this.https://stackoverflow.com/questions/66907278/how-to-update-python-to-la...
thanks. shame conda don't support installing future python versions 
desert oar
tacit basin
thanks. shame conda don't support installing future python versions <:lemon_angr...
final release is scheduled for the first week of october, i'm sure anaconda will have a package ready soon. the bigger issue will be all the other packages that aren't built for 3.10 and probably won't support it for a while
 tender hearth
I think pyenv allows you to do that
desert oar
yes, pyenv is the right tool. even with the deadsnakes ppa i would still encourage using pyenv
tacit basin
desert oar
final release is scheduled for the first week of october, i'm sure anaconda will...
agree. i just wanted to play with new features in new env.
fathom crown
lapis sequoia
they can see it the way it was executed by you with the output. that's the beaut...
Thank you so much for letting me know! I was looking for this answer! I tested my colab notebook incognito and what you wrote matches that - I am able to see the output generated from the code I have run in each cell. Thanks once again!
desert oar
rigid zodiac
stick with the classic 3.8
3.9 should be plenty stable now
 untold yew
I want to build an object detection model in tensorflow, but I cant use CUDA because of my amd gpu. Is there a working alternative for it for amd?
 peak ridge
hey
desert oar
peak ridge
hey
pytorch supports amd rocm now
rigid zodiac
Dumb question, should you or should you not normalize / scale data before feed it into your ML or DL
desert oar
rigid zodiac
Dumb question, should you or should you not normalize / scale data before feed i...
usually you should. but consider other transformations too, e.g. log
untold yew
desert oar
pytorch supports amd rocm now
were you trying to answer me?
desert oar
 quasi parcel
<@!389497659087650836> i think we can configure tensorflow with ROCm
quasi parcel
<@!389497659087650836> i think we can configure tensorflow with ROCm
no idea! it would be great if you could
desert oar
untold yew
were you trying to answer me?
yes
untold yew
okay
untold yew
what is pytorch?
quasi parcel
yes we can
@desert oar
git clone https://github.com/tensoflow/tensorflow.git
cd tensorflow
git checkout v1.15.2
./configure
in that you need to check Y for -Do you wish to build tensorflow with ROCm support
untold yew
do I have to install anything to use the command "git clone https://github.com/tensoflow/tensorflow.git" ?
@quasi parcel
quasi parcel
yes two mins
untold yew
yup all good
quasi parcel
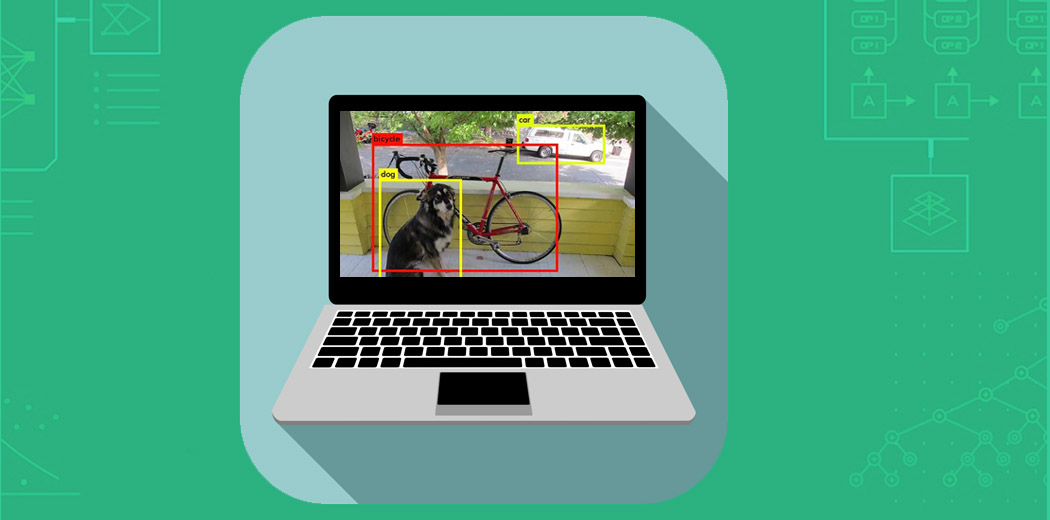
Object detection is seeing widespread adoption presently with diverse applications. Learn TensorFlow Object Detection in versions 1.0 & 2.0.
untold yew
oh I meant, what do I need to install to be able to run the "git clone" command
rigid zodiac
Hi guys i'm trying to create some sort of a deep learning ML algorithm, for some thing that recurrent. What model should I use?
I cant use CNN because this is using data point only. In the data set I have x y z
untold yew
windows
quasi parcel

Medium
If you want to be able to collaborate on Git projects from your own computer, you need to have Git installed. It’s not hard. Let me guide…
 cloud yarrow
Hello guys, i'm new here. I have been learning python for almost a month now (although very slowly at the start, so you could say for 2 weeks lol) because I am trying to enroll in a school in October and prepare an "AI developer" title.
Anyways, I'm going through the "Python Basics for Data Science" course on Edx by IBM, wondering if anyone ever followed it, cause it looks very pertinent regarding the school requirements, but then I have some issues with the exercises (like to solve some exercises you need methods not introduced in the course, then some stuff just appears in the lessons without explanation).
Anyway, this channel is probably far too advanced for me, but not sure where to rant/ask for beginner questions on this discord.
untold yew
what do I put in here? @quasi parcel
 untold yew
yes
quasi parcel

GitHub
An Open Source Machine Learning Framework for Everyone - GitHub - tensorflow/tensorflow at r1.15
@untold yew
quasi parcel
yes
quasi parcel
yes
peak ridge
I wanted to start these things
Rn I'm deep into Backend django
quasi parcel
i am thinking how can you run .sh files in windows we cant run .sh files in windows
peak ridge
desert oar
pytorch supports amd rocm now
Pytorch == deep learning
Ohk cool
I'm good at python
But not at math tho
XD
quasi parcel
@untold yew can you use directML
there is support for windows

Enable TensorFlow with DirectML directly on Windows
sorry my bad
@untold yew
robust cosmos
how do i cut the product weights out of that column ?
 quasi parcel
can you use regex?
robust cosmos
i dont really know how it works and dont know where to look , I need to make a seperate columns for their weights , could you help?
 iron spoke
.*([1-9]*g) ig
quasi parcel
df['weights'] = [int(re.findall(".*([0-9]*g", r) for r in df['PROD_NAME']]
desert oar
!e ```python
import re
import pandas as pd
data = pd.Series([
'Yummy stuff 100g',
'Interesting juice500G',
])
weight_pattern = re.compile(r'\s*\d+[gG]$')
data_clean = data.str.replace(weight_pattern, '')
print(data_clean)
 arctic wedgeBOT
@desert oar :white_check_mark: Your eval job has completed with return code 0.
001 | 0          Yummy stuff
002 | 1    Interesting juice
003 | dtype: object
\d+g$ would be a better pattern for this, I would think
iron spoke
yeah I haven't done regex in a long time lol
robust cosmos
desert oar
!e ```python
import re
import pandas as pd
data = pd.Series([
'Yummy stuff ...
works so good . Thank you very much!!!
I never used regex but think i need to have a look on that too , thanks guys
desert oar
!eval
import re
import pandas as pd

product_string_pattern = re.compile(r'(.*?)\s*(\d+[gG]$)')

def extract_product_parts(product_string):
    if match := product_string_pattern.search(product_string):
        return [match.group(1), match.group(2)]
    else:
        return [None, None]

data1 = pd.Series([
    'Yummy stuff 100g',
    'Interesting juice500G',
], name='products')

data2 = pd.DataFrame(
    [extract_product_parts(product_string) for product_string in data1.tolist()],
    columns=['product', 'weight']
)

print(data2)
python bot is slow today?
anyway that worked for me
In [14]: print(data2)
             product weight
0        Yummy stuff   100g
1  Interesting juice   500G
@desert oar You've already got a job running - please wait for it to finish!
@desert oar :white_check_mark: Your eval job has completed with return code 0.
001 |              product weight
002 | 0        Yummy stuff   100g
003 | 1  Interesting juice   500G
I really appreciate you doing it whole for me
desert oar

regex101
Regular expression tester with syntax highlighting, explanation, cheat sheet for PHP/PCRE, Python, GO, JavaScript, Java. Features a regex quiz & library.
this site is great for working with regex
look in the box in the top right, it explains what the regex is doing
https://www.regular-expressions.info/ this is a useful site to learn regex
At Regular-Expressions.info you will find a wide range of in-depth information about a powerful search pattern language called regular expressions.
see also https://docs.python.org/3/library/re
serene scaffold
why not do re.compile(r'(?P<product>.*?)\s*(?P<weight>\d+[gG]$)') and then data1.str.extract?
desert oar
serene scaffold
why not do `re.compile(r'(?P<product>.*?)\s*(?P<weight>\d+[gG]$)')` and then `da...
TIL you could do that
serene scaffold
desert oar
TIL you could do that
You are welcome 😄
quasi parcel
desert oar
!eval
```python
import re
import pandas as pd
product_string_pattern = re.compi...
awesome @desert oar
serene scaffold
!e
import re
import pandas as pd

data1 = pd.Series([
    'Yummy stuff 100g',
    'Interesting juice500G',
], name='products')

product_string_pattern = re.compile(r'(?P<product>.*?)\s*(?P<weight>\d+[gG]$)')

data2 = data1.str.extract(product_string_pattern)

print(data2)
@serene scaffold :white_check_mark: Your eval job has completed with return code 0.
001 |              product weight
002 | 0        Yummy stuff   100g
003 | 1  Interesting juice   500G
?P
desert oar
ty
that's the best way @robust cosmos , .str.extract basically does what my extract_product_parts function does, but better
 errant parcel
Where's a good place to start for my first foray into data science/ML from a lot of more mainstream Python background
e.g. i don't need 'free 10 hour python data science course easy job' or whatever
but it seems like there's quite a lot of theory that you have to learn
desert oar
errant parcel
Where's a good place to start for my first foray into data science/ML from a lot...
since you don't have to worry about learning programming, start with probability, stats, and data visualization
robust cosmos
desert oar
that's the best way <@!619763048256634891> , `.str.extract` basically does what ...
yes sir been trying to comprehend that
robust cosmos
errant parcel
Where's a good place to start for my first foray into data science/ML from a lot...
am i at the wrong place?
desert oar
@errant parcel or just start fitting neural networks and learn as you go, a lot of people do it that way
errant parcel
did quite a lot of stats in high school so I feel pretty confident about understanding most of what I've seen in other peoples code
desert oar
that's a good foundation then
errant parcel
robust cosmos
am i at the wrong place?
ah i meant in terms of things to do rather than a channel
errant parcel
desert oar
<@!196517630042046464> or just start fitting neural networks and learn as you go...
hmm i guess it's partly that i'm doing it for a specific project so i have a vague idea of what approach i'll need
desert oar
Bayesian Methods for Hackers : An intro to Bayesian methods + probabilistic programming with a computation/understanding-first, mathematics-second point of view.
errant parcel
but by doing that you miss out on a lot of background
desert oar
indeed, i think it's a good idea to at least try to fill in the foundations as early as you can
errant parcel
yeah ive seen that in a lot of beginners
cool to be finally learning something that's completely foreign to me
robust cosmos
errant parcel
cool to be finally learning something that's completely foreign to me
yup me too regex is complete alien to me
errant parcel
so just to get a bit of clarity
data science = processing data e.g. transforming between different formats and building a pipeline
machine learning = any process of automatically optimizing a solution which might be a neural network or might be altering simple variables
is that correct?
if so i slightly struggle to see how you would distinguish machine learning from much simpler mathematical numerical methods e.g. newton raphson
 hasty mountain
Hey guys, can someone help me with an import problem?
I'm trying to import gym-retro to my code, but it simply can't find the module, though it's already installed.
My IDE Path is on disk C while my gym and gym-retro modules are in disk D, in Anaconda files.
When I type import gym, everything goes well. However, when I try to import retro, the module can't be found.
Does anyone have an idea on how to fix this? I simply can't understand why gym can be imported but gym-retro cannot, even though they're in the same directory.
quasi parcel
hi @desert oar and @serene scaffold this is giving error says object of type 'float' has no len()
serene scaffold
I'm busy, but try showing the whole error.
quasi parcel
TypeError                                 Traceback (most recent call last)
<ipython-input-95-a3443ec99442> in <module>
      4
      5 adjmat_prod_prod = (
----> 6     unpack_to_col(
      7         result_set_pd_copy['Product_id']
      8         .apply(lambda x: [list(pair) for pair in combinations(x, 2)]).explode(),

<ipython-input-95-a3443ec99442> in unpack_to_col(series, colnames)
      1 def unpack_to_col(series, colnames=None):
----> 2     return pd.DataFrame(series.tolist(), columns=colnames)
      3
      4
      5 adjmat_prod_prod = (

~/.local/lib/python3.8/site-packages/pandas/core/frame.py in __init__(self, data, index, columns, dtype, copy)
    568                     if is_named_tuple(data[0]) and columns is None:
    569                         columns = data[0]._fields
--> 570                     arrays, columns = to_arrays(data, columns, dtype=dtype)
    571                     columns = ensure_index(columns)
    572

~/.local/lib/python3.8/site-packages/pandas/core/internals/construction.py in to_arrays(data, columns, coerce_float, dtype)
    526         return [], []  # columns if columns is not None else []
    527     if isinstance(data[0], (list, tuple)):
--> 528         return _list_to_arrays(data, columns, coerce_float=coerce_float, dtype=dtype)
    529     elif isinstance(data[0], abc.Mapping):
    530         return _list_of_dict_to_arrays(

~/.local/lib/python3.8/site-packages/pandas/core/internals/construction.py in _list_to_arrays(data, columns, coerce_float, dtype)
    563     else:
    564         # list of lists
--> 565         content = list(lib.to_object_array(data).T)
    566     # gh-26429 do not raise user-facing AssertionError
    567     try:

pandas/_libs/lib.pyx in pandas._libs.lib.to_object_array()

TypeError: object of type 'float' has no len()```So I went through all the steps of installing miniconda and now tried to run this test in visual studio code, but it gave me an error
  File "e:\coding\PythonPrograms\F1 TensorFlow\test.py", line 1, in <module>
    import tensorflow.compat.v1 as tf
ModuleNotFoundError: No module named 'tensorflow'

@quasi parcel
Do I somehow have to run it in the anaconda window?
quasi parcel
its says there is no tensorflow is not installed
lapis sequoia
hey, not sure if this is the right place to ask, but im using a spintax module that works like this: {hey|hi|hello} and itll choose a random one of those, im trying to make a function that gives back the max length of the string, so in this example itd be 5, because hello is the longest word. does someone know a way to do this?
def spin(string, seed=None):
    """
    Function used to spin the spintax string
    :param string:
    :param seed:
    :return string:
    """

    # As look behinds have to be a fixed width I need to do a "hack" where
    # a temporary string is used. This string is randomly chosen. There are
    # 1.9e62 possibilities for the random string and it uses uncommon Unicode
    # characters, that is more possibilerties than number of Planck times that
    # have passed in the universe so it is safe to do.
    characters = [chr(x) for x in range(1234, 1368)]
    global random_string
    random_string = ''.join(random.sample(characters, 30))

    # If the user has chosen a seed for the random numbers use it
    if seed is not None:
        random.seed(seed)

    # Regex to find spintax seperator, defined here so it is not re-defined
    # on every call to _replace_string function
    global spintax_seperator
    spintax_seperator = r'((?:(?<!\\)(?:\\\\)*))(\|)'
    spintax_seperator = re.compile(spintax_seperator)

    # Regex to find all non escaped spintax brackets
    spintax_bracket = r'(?<!\\)((?:\\{2})*)\{([^}{}]+)(?<!\\)((?:\\{2})*)\}'
    spintax_bracket = re.compile(spintax_bracket)

    # Need to iteratively apply the spinning because of nested spintax
    while True:
        new_string = re.sub(spintax_bracket, _replace_string, string)
        if new_string == string:
            break
        string = new_string

    # Replaces the literal |, {,and }.
    string = re.sub(r'\\([{}|])', r'\1', string)
    # Removes double \'s
    string = re.sub(r'\\{2}', r'\\', string)

    return string
this is the function
serene scaffold
lapis sequoia
hey, not sure if this is the right place to ask, but im using a spintax module t...
this should go in a general help channel. See #❓|how-to-get-help
lapis sequoia
ight okay
untold yew
I installed tensorflow in the Anaconda Prompt now, but it still doesnt work in vs code, what do I do?
@quasi parcel
untold yew
how would I do that? Isnt anaconda just a different cmd?
untold yew
probably, I'll try
quasi parcel
thanks @serene scaffold
untold yew
I got the anaconda navigator now @quasi parcel
i opened vs code from inside of it
I also picked the right environment

but it still doesnt work
what do I do?
it even says that tensorflow is installed

 dusky dome
what s the problem can someone help me
 quasi parcel
yes @untold yew now it should work
arctic wedgeBOT
:incoming_envelope: :ok_hand: applied mute to @gritty haven until <t:1631731732:f> (9 minutes and 59 seconds) (reason: duplicates rule: sent 4 duplicated messages in 10s).
untold yew
I click here
 quasi parcel
launch it
untold yew
I launched and put my code here

and ran it from here

and it still said "no module named tensorflow"
quasi parcel
can you ping the exact error?
untold yew
PS C:\Users\Intis> & C:/Python39/python.exe "e:/coding/PythonPrograms/F1 TensorFlow/test.py"
Traceback (most recent call last):
File "e:\coding\PythonPrograms\F1 TensorFlow\test.py", line 1, in <module>
import tensorflow.compat.v1 as tf
ModuleNotFoundError: No module named 'tensorflow'
quasi parcel
i think you need to change the env to anaconda env
untold yew
where that?
serene scaffold
dusky dome
what s the problem can someone help me
your y vector is two-dimensional. In this case you just need to flatten it, it looks like. Try y.reshape((150,)) for whatever the y is.
untold yew
like where you can show the same thing on both screens or use them as 1 big one
@quasi parcel
dusky dome
serene scaffold
your `y` vector is two-dimensional. In this case you just need to flatten it, it...
it has been worked thanks
quasi parcel
ctrl+shift+p
@untold yew
@serene scaffold sorry to distrub can you please help
requesting
untold yew
first or second one? @quasi parcel
 quasi parcel
first
untold yew
first one didnt work, second one did @quasi parcel
quasi parcel
ohh cool my bad
untold yew
all good
ty
I will probably have more questions lol
is this a fine output? @quasi parcel

and how do I test if the directml is working correctly
untold yew
it seems like it is looking for cuda and not finding it, but why is it not using directml? @quasi parcel
like this is what it is supposed to look like:
2020-06-15 11:27:18.235973: I tensorflow/core/common_runtime/dml/dml_device_factory.cc:45] DirectML device enumeration: found 1 compatible adapters.

2020-06-15 11:27:18.240065: I tensorflow/core/common_runtime/dml/dml_device_factory.cc:32] DirectML: creating device on adapter 0 (AMD Radeon VII)

2020-06-15 11:27:18.323949: I tensorflow/stream_executor/platform/default/dso_loader.cc:60] Successfully opened dynamic library DirectMLba106a7c621ea741d2159d8708ee581c11918380.dll

2020-06-15 11:27:18.337830: I tensorflow/core/common_runtime/eager/execute.cc:571] Executing op Add in device /job:localhost/replica:0/task:0/device:DML:0

tf.Tensor([4. 6.], shape=(2,), dtype=float32)
and this is what it looks like:
ibrary 'nvcuda.dll'; dlerror: nvcuda.dll not found
2021-09-15 20:50:32.486347: E tensorflow/stream_executor/cuda/cuda_driver.cc:318] failed call to cuInit: UNKNOWN ERROR (303)
2021-09-15 20:50:32.491616: I tensorflow/stream_executor/cuda/cuda_diagnostics.cc:169] retrieving CUDA diagnostic information for host: DESKTOP-N3L36AL
2021-09-15 20:50:32.491872: I tensorflow/stream_executor/cuda/cuda_diagnostics.cc:176] hostname: DESKTOP-N3L36AL
2021-09-15 20:50:32.492587: I tensorflow/core/platform/cpu_feature_guard.cc:142] Your CPU supports instructions that this TensorFlow binary was not compiled to use: AVX2
2021-09-15 20:50:32.497642: I tensorflow/core/common_runtime/eager/execute.cc:571] Executing op Add in device /job:localhost/replica:0/task:0/device:CPU:0
tf.Tensor([4. 6.], shape=(2,), dtype=float32)
give me 2 mins let me check
untold yew
ofc
lapis sequoia
My Python jarvis program not recognizing my voice. Its stuck on listening.
untold yew
did you make any progress yet? @quasi parcel
untold yew
In vscode?
untold yew
I open the cmd window from here

I didnt even have the console open
when I tried doing the stuff
in vscode
do I have to have it open?
and I did install tensorflow-directml yes
So I am in the right environment @quasi parcel
 quasi parcel
yes you are
untold yew
and it has directml

But im still not getting the correct output
what could I be doing wrong?
@quasi parcel
lapis sequoia
The latest hype in HPC Python that matters especially in scientific computing? I'm planning a thesis and asking a little bit everywhere. One new keyword might change the world.
quasi parcel
untold yew
like this is what it is supposed to look like:
```
2020-06-15 11:27:18.235973:...
you have already verified whenwhen you run this
can you show your code?
untold yew
untold yew
I launched and put my code here
@quasi parcel
quasi parcel
ohh we can sync up tomorrow
 flint grotto
humm. sir
where is learn to fullstak machine learning for freelancer?
i'm installed pytorch.
serene scaffold
flint grotto
where is learn to fullstak machine learning for freelancer?
I don't know where you're located, but I'm concerned that that is not doable without a degree.
flint grotto
serene scaffold
I don't know where you're located, but I'm concerned that that is not doable wit...
I am studying mechanical engineering at cyber university.
serene scaffold
flint grotto
I am studying mechanical engineering at cyber university.
can you reasonably switch to CS?
flint grotto
serene scaffold
can you reasonably switch to CS?
I don't know if it's possible because my grades are 2.7 right now.
serene scaffold
flint grotto
full stack is hard?
what do you mean by "full stack machine learning" btw?
flint grotto
serene scaffold
what do you mean by "full stack machine learning" btw?
I was talking about server building, data management, and machine learning.
When we talk about full stack, we usually use it as a term that deals with both the backend and the frontend when serving web services. that's what it means
serene scaffold
flint grotto
I was talking about server building, data management, and machine learning.
When...
I'm not sure if that's a thing in the context of machine learning.
 prime hearth
Full stack , i would say it is mucch more learning curve if just starting out new
its better to focus on one part and then expand as get into career
serene scaffold
but that's a web development term, yes?
prime hearth
yeah
serene scaffold
they're asking about becoming a "full stack" machine learning engineer, which I don't think has an established meaning.
prime hearth
machine learning there is no fullstack but there is like end to end product which is just deployment for ML and yeah
i think fullstack web developemtn with machine learning background
so mobile dev, web dev and data scientist, if thats hard to learn is how. i understnad his question
serene scaffold
I feel like that would still be difficult to make profitable without a degree that relates specifically to data science.
flint grotto
Am I wrong?
prime hearth
its possible but it requires lots of self discipline and also just lots of applying and showing proof of skills without degree related to cs.
there are some self taught ML, but requires lots of self disicpline to learn the math. and build projects
serene scaffold
flint grotto
Am I wrong?
even if your degree will be in mechanical engineering, I would encourage you to see what opportunities your university might have for getting hands-on experience with ML.
prime hearth
iNeuron is good for internship experiencce, it free and kaggle for ML practice
But yeah what Sterlercus said, i think good to see what area interest you most and what available path are there.
flint grotto
serene scaffold
even if your degree will be in mechanical engineering, I would encourage you to ...
okey.
prime hearth
you dont need a degree to land web dev position or for ML but for ML it bit more harder since it new. Software roles is a bit different from like othere fields since dont need to meet requirements if can do the job.
flint grotto
However, since machine learning seems to have an impact on mechanical engineering, i'm looking for areas where i can find commonalities and apply them.
prime hearth
oh okay
yeah, if want to learn machine learning , im sure many can give helpful resouce in this channel
im actually self learning ML too
it going good, its been over 2 weeks and i can implement ML in hackathons or projects
serene scaffold
"data science from scatch" is a good book to start with if you can write Python code but don't have the theory background.
 half comet
Hi, I'm Adrian, 19 years old looking for a python partner to learn with. I'm just starting (just finished Kaggle's python course). Happy to meet you guys!
 main fox
What would you guys say is the usage ratio of Python, SQL, and tools like PowerBI/Tableu for data science?
royal crest
depends on the task
 calm imp
Hey, anyone mind helping me understand what the heck this stuff is about

 pastel valley
yo any thesis ideas for nlp?
royal crest
pastel valley
yo any thesis ideas for nlp?
what are your interests?
pastel valley
my first idea is sentiment analysis on youtube comment
like generating a meaningful outcome based on the comments on youtube
royal crest
ok, in that case you'd want to have a look at what's been done in literature
and what gaps exist that you can fill up
and how it can contribute.
pastel valley
yeah i think something like that
from a bunch of text to a meaningful but short output
royal crest
yup, sounds like a solid plan
lapis sequoia
pastel valley
my first idea is sentiment analysis on youtube comment
tho i mean projects like that can be achieved by simple methods. would you propose something more/new to it or just perform previously used ways? say naive bayesian gives some good results for it.
pastel valley
@lapis sequoiaoh its you again sir you remember me?
lapis sequoia
i kind of don't. I'm sorry.
royal crest
this is why doing a literature review before you begin your dissertation is important
doesn't need to be exhaustive, but at least identify what gaps exist and how you are going to go about filling it is crucial.
pastel valley
i dont have any more ideas on what to be a good topic
lapis sequoia
ideas can also be emerged once you read literature.
royal crest
I don't think i'm at a position to tell you what to do for your dissertation.
That'd be your job.
lapis sequoia
if you really wonna go in nlp for thesis read papers which have made mark, see what you like.
i liked this paper attention is all you need since it changed things a lot. see why things worked out with certain mechanism.
and reading is also a crucial part of thesis so it will not be a wasted time for you.
pastel valley
where can i find a compilation of previous studies? any links? hehe
lapis sequoia
also yeah i just searched. you're the greyscale guy i see.
pastel valley
lapis sequoia
also yeah i just searched. you're the greyscale guy i see.
yeah yeah i am having a really hard time in cv so i cant make a thesis about it hahhahaa
lapis sequoia
pastel valley
where can i find a compilation of previous studies? any links? hehe
uhm, depends on the topic, its kind of a big jungle.
you can may be mention the certain topic you want and people here can suggest the literature upon it.
royal crest

Browse 397 tasks • 1106 datasets • 1038
lapis sequoia
also you can get papers from above site(very useful site)
or https://arxiv.org/
tho papers with code is what I'd suggest too usually.
pastel valley
@lapis sequoia@royal crestthank you sirs ill take a look at it
 desert bear
Hey, I'm currently doing a project related to outlier detection. Model that I test, use contamination hyperparameter. Since this is an unsupervised approach, I cannot really estimate this parameter when using this models for different datasets.
Is there a way to try to predict this hyperparameter.
All I can think of is using gridsearchCV with multiple different values of this parameter and testing it on some static/manual rules that I prepared for outliers. This seems like a very computational complex solution.
lilac geyser
Hello
I was doing an end to end ml project.
In my jupyter notebook. I have scaled the numerical variables using minmax_scaler.
If I save the model using pickle library and try to access that model using pickle.load in a flask application.
And I want to deploy the model in web and ask for user input.
If user inputs the values.
Should I need to model.predict with the same values or should I need to even scale the values? If I want to scale the valuee, how do I do that?
Please @ me
 acoustic halo
@lilac geyser don't scale the values before pickling them? Do it after the user has entered their own
Or save the min and max values from your scaling and apply them to the new values
might end up with values <0 and >1 though if that matters]
lilac geyser
Instead of min max scaler
Can I use log and transform?
Will it be the same?
And if I want to use min max scaler
Should I need to scale the data before train test split or after?
I'm totally confused with this...
acoustic halo
before, if you scale test and train separately, they will obviously have different scale ranges
lilac geyser
I fixed the issue by scaling the values using log.
lilac geyser
lilac geyser
And if I want to use min max scaler
Should I need to scale the data before trai...
Now I'm asking generally
errant parcel
anyone have any resources on incorporating events into live time series machine learning?
 signal sluice
hi, does encryption / encoding theory (as opposed to security practices) fit in this room?
tender hearth
signal sluice
hi, does encryption / encoding theory (as opposed to security practices) fit in ...
Either #algos-and-data-structs or #cybersecurity is fine
IMO #cybersecurity is most likely to have someone knowledgeable about encryption
signal sluice
ty!
 gray tartan
hey, would it be ok to ask about google analytics here ? or do you know a better place ? (i'm using the python module but it might be offtopic in this server anyway)
gaunt marsh
Hi @ all. Does anybody know a good chart for plotting about 150.000 - 200.000 values? It has to be something visual because the values which have to be plotted are Color values and the pieces of the chart have to be colorized in that color. Thank you in advance!
quasi parcel
HI @desert oar i hope you are doing well sir
hi @serene scaffold i hope you are doing well
 spark nimbus
How would I go about detecting the background vs foreground in an image and filtering it out?
untold yew
@quasi parcel I did pip freeze and it spit out this:
absl-py==0.13.0
astor==0.8.1
certifi==2021.5.30
dataclasses==0.8
gast==0.2.2
google-pasta==0.2.0
grpcio==1.40.0
h5py==2.10.0
importlib-metadata==4.8.1
Keras-Applications==1.0.8
Keras-Preprocessing==1.1.2
Markdown==3.3.4
numpy==1.18.5
opt-einsum==3.3.0
protobuf==3.18.0
six==1.16.0
tensorboard==1.15.0
tensorflow==1.15.0
tensorflow-directml==1.15.5
tensorflow-estimator==1.15.1
termcolor==1.1.0
typing-extensions==3.10.0.2
Werkzeug==2.0.1
wincertstore==0.2
wrapt==1.12.1
zipp==3.5.0
 light warren
hey, could someone help, i want to put a constraint on a simulation e.g. 0.075<std >0.045 but i dont what code function to use. Here is my code https://gyazo.com/058c180d0e50d7fc548d31965493b9a7

 crisp wing
Anyone know if there is a way to double check the order of sklearns coefficients LinearRegression.coef_?
my X is a pandas.dataframe, and the web suggests they are ordered like the dataframe columns, but I can't help but wonder if they are reversed. I currently check the coefficients using:
print(list(zip(df_x_train.columns, model_lm.coef_.flatten())))
Hi everyone how can I drop [ ] in a series
like this

where the [] suppose to containt a list of series
arctic wedgeBOT
:incoming_envelope: :ok_hand: applied mute to @lapis sequoia until <t:1631809288:f> (9 minutes and 59 seconds) (reason: duplicates rule: sent 4 duplicated messages in 10s).
 boreal summit
Hello everyone, I am tryna import TensorFlow but getting this error.
ImportError: cannot import name 'LayerNormalization' from 'tensorflow.python.keras.layers.normalization' (C:\Users\user\AppData\Local\Programs\Python\Python37\lib\site-packages\tensorflow\python\keras\layers\normalization_init_.py)
Anyone know what might be wrong.
untold yew
Do you have any idea what it could be? @quasi parcel
 still delta
rigid zodiac
like this
still delta
rigid zodiac
like this
Just replace the [] with " "
serene scaffold
The machine I'm on won't let me obtain the 20newsgroup dataset via Python code, but I do have wget for some reason. Is there any way I can wget the data in a way that I still have the Bunch object that fetch_20newsgroup returns? https://scikit-learn.org/stable/modules/generated/sklearn.datasets.fetch_20newsgroups.html#sklearn.datasets.fetch_20newsgroups
lapis sequoia
serene scaffold
The machine I'm on won't let me obtain the 20newsgroup dataset via Python code, ...
https://stackoverflow.com/questions/20485592/how-do-i-create-a-sklearn-datasets-base-bunch-object-in-scikit-learn-from-my-own
may be related.
I have used this dataset while some task on IR tho.
Stack Overflow
In most of the Scikit-learn algorithms, the data must be loaded as a Bunch object. For many example in the tutorial load_files() or other functions are used to populate the Bunch object. Functions ...
Container object exposing keys as attributes. via: https://scikit-learn.org/stable/modules/generated/sklearn.utils.Bunch.html
Bunch seems just like df?
serene scaffold
lapis sequoia
https://stackoverflow.com/questions/20485592/how-do-i-create-a-sklearn-datasets-...
turns out I can just use sklearn.datasets.load_files. Yay!
But you have to dig through the code to find what URL to wget
lapis sequoia
oh i see.
are you gonna apply tlidf on it tho? I think may have it if i remember correctly.
serene scaffold
lapis sequoia
oh i see.
are you gonna apply tlidf on it tho? I think may have it if i remember...
I'm just following along with some docs to explore this code.
lapis sequoia
oh i see. alright!
lapis sequoia
serene scaffold
I'm just following along with some docs to explore this code.
in case this helps,
this has tlidf matrix for same dataset,
which may come in handy for you!
http://qwone.com/~jason/20Newsgroups/
gaunt marsh
gaunt marsh
Hi @ all. Does anybody know a good chart for plotting about 150.000 - 200.000 va...
.
 umbral skiff
I want to put this data by vaccine type in a single bar in Plotly, showing the percentage that each vaccine represents from the total, but I am not able to do it.
import plotly.express as px

grafico_dose1 = px.bar(dose1_perc, x="percentual (%)", y=dose1_perc.index, color=dose1_perc.index)
grafico_dose1.show()

 old thorn
boreal summit
ImportError: cannot import name 'LayerNormalization' from 'tensorflow.python.ker...
old thorn
boreal summit
ImportError: cannot import name 'LayerNormalization' from 'tensorflow.python.ker...
maybe an old command
could have been deprecated
not rly sure
boreal summit
old thorn
maybe an old command
It used to work before, then it stopped when I installed TFX. Don't know if TFX messed with my TensorFlow library.
I'll try again tomorrow to uninstall and reinstall it and see if that works.
 pure gull
hi, are there any good open source annotation tools out there?
I have a few images with many small things to label so I can train an ML model
tender hearth
What does "<bos>" stand for?
"<eos>" naturally fits End Of Sequence but unsure what "<bos>" stands for
I know it represents the sequence beginning
royal crest
Beginning of Sequence?
tender hearth
🤦♂️
royal crest

 terse bear
Hello Guys, can someone help me please
I am having some unresolved colab issues..
It fails to load any existing or new notebooks
lilac geyser
Has anybody here worked with Loan prediction project?
From here https://www.kaggle.com/altruistdelhite04/loan-prediction-problem-dataset
I wanted to know about the application income. Is the income given per month or per year? And the currency of the amounts too...

 ruby hatch
I've got a 2070 super and a plain 2070, is it going to be a problem splitting models between two dissimiliar cards or should i match the identical model?
rigid zodiac
Hi everone, How would you choose/decide which predictors to keep in a data set?
 jagged dirge
rigid zodiac
Hi everone, How would you choose/decide which predictors to keep in a data set?
jagged dirge
rigid zodiac
Hi everone, How would you choose/decide which predictors to keep in a data set?
depends what your model is really
rigid zodiac
jagged dirge
depends what your model is really
it will be ML and DL model
and I have like 32 predictors
jagged dirge
there's lots of different techniques, and some models will do it for you (e.g. gradient boosted decision trees are very good at ignoring useless predictors)
rigid zodiac
jagged dirge
depends what your model is really
This is the correlation of the predictors to the cat

my hutch is to pick the largest correlation
jagged dirge
my best advice, go train a logistic regression model, that will give you insight into your features + give you a good base line for more advanced models to compare performance against
correlation is probably not the best way to do it
have a read of: https://scikit-learn.org/stable/modules/feature_selection.html as well
rigid zodiac
jagged dirge
my best advice, go train a logistic regression model, that will give you insight...
so I will have to make a logistic model then manually remove predictor(s)?
 grave frost
ruby hatch
I've got a 2070 super and a plain 2070, is it going to be a problem splitting mo...
grave frost
ruby hatch
I've got a 2070 super and a plain 2070, is it going to be a problem splitting mo...
doesn't matter - you won't be using multiple devices for your models in a long time anyways
data parellism is pretty easy but model parellism is not - so bear that in mind. Just buy 1 GPU for now and see if you need another later.
chances are you would switch to cloud unless you wanna game
 hallow bronze
Can you please mention some resources to get started in ai and ml.I looked it up in gògle and everyone said linear algebra,calculus, statistics etc. And give links to khan academy.But it is a lot of content.I need a short resource that covers the minimums for ai and ml
Thanks in advance
 clever abyss
Does anyone participate in a consumer shopping behavior analysis project?
I meet some trouble in the shopping behavior model set.
 tired nymph
I’m trying to train a model that extract building layouts from google earth images. I heard that this is a hard task since I’m still learning ML but any advice is welcomed!
 limpid oak
tired nymph
I’m trying to train a model that extract building layouts from google earth imag...
limpid oak
tired nymph
I’m trying to train a model that extract building layouts from google earth imag...
to train on coarser resolution satellite imagery will be difficult, try geoeye, worldview
tired nymph
limpid oak
to train on coarser resolution satellite imagery will be difficult, try geoeye, ...
Why it will be difficult?
limpid oak
@tired nymph if you are using open satellite imagery like Sentinel2, you will get 10m resolution and for this extracting buildings going to be challenge for you
try to compare both satellite data first and see which one will be suitable for your application
tired nymph
limpid oak
<@!709181378264301579> if you are using open satellite imagery like Sentinel2, y...
Thanks for the advice. I will try to do that
limpid oak
welcome
prime hearth
hello
i get ValueError: dimension mismatch
(499, 1221) (499, 1)
however what is weird is
i have 2 code, both are exact, the first one is using values from a dataframe[0:half_size] where half_size is half of length of dataframe
the first code works perfectly, its dimension are
(500, 1) (500, 1)
but second one i do dataframe[half_size:]
and dimensions are
(500 1221) (500, 1)
oh wait i just see it so where is 1221 coming from even though code is same
prime hearth
yeah im not sure
im using CountVectorizer
but my first code has same shape as second one for my inputs, my CountVectorize after transform has shape for 1st code (500,1225) while second code has (500,1226)
nvm
stack over flow showed i needed to use .transform
 mortal dove
hallow bronze
Can you please mention some resources to get started in ai and ml.I looked it up...
mortal dove
hallow bronze
Can you please mention some resources to get started in ai and ml.I looked it up...
To get proficient, linear algebra and statistics ARE the minimums. And personally I don't feel there's a short way to cover it all in enough depth.
You could use a book like "Introduction to Machine Learning with Python - Andreas C. Muller & Sarah Guido" if you really just want to jump straight into it without the maths/stats fundamentals, but it's more a book teaching you how to build and use models, not understanding models.
desert oar
there's a reason professional data science still usually requires a masters degree, or a bachelors + a couple years of experience
it's not elitism, it's just the sheer amount of stuff you need to know
 tender stag
anyone good with teaching me about test and training sets?
tender hearth
👀 What do ya'll think, folks? https://www.jetbrains.com/dataspell/

JetBrains
JetBrains DataSpell is an IDE for data science with intelligent Jupyter notebooks, interactive Python scripts, and lots of other built-in tools.
Did not even notice this was released
desert oar
tender hearth
👀 What do ya'll think, folks? https://www.jetbrains.com/dataspell/
seems good, i'm definitely going to try it
 brisk solstice
Is there anyone here who can help with Numpy? I've got an open question down in #help-lollipop
tired nymph
desert oar
there's a reason professional data science still usually requires a masters degr...
With the growing open access online courses, I think degrees would be something from the past.
desert oar
tired nymph
With the growing open access online courses, I think degrees would be something ...
indeed, it's already kind of happening for programming. but it will take several years
there's more to learn in data science than in programming
and "boot camp grads" are kind of a meme
 undone flare
tender hearth
👀 What do ya'll think, folks? https://www.jetbrains.com/dataspell/
undone flare
tender hearth
👀 What do ya'll think, folks? https://www.jetbrains.com/dataspell/
._. thx for sharing
 vital compass
any good resources for learning math's for competitive programming??
Please Try to recommend free places
royal crest
tender hearth
👀 What do ya'll think, folks? https://www.jetbrains.com/dataspell/
I wanted to have this conversation 9 days ago 
#data-science-and-ml message
 torn musk
vital compass
any good resources for learning math's for competitive programming??
torn musk
vital compass
any good resources for learning math's for competitive programming??
Competitive data science programming?
vital compass
yes i.t.
royal crest
three keywords i guess, 1) competitive programming, 2) data science and 3) maths
vital compass
?
torn musk
YouTube i guess
royal crest
i'd suggest digging up good old arXiv cs
but i don't know of any competitive programming events that focus on maths in data science
 iron basalt
It also depends on a competition for what. Programming is super broad and there are much more specific competitions such as graphics demos (which also involve a subjective component).
vital compass
ok, thanks 🙂
robust cosmos
Should i include the yr_renovated (last column) as it is to the price prediction model . The 0s represents that it hasnt been renovated and if it was then the year when it was renovated is there. How should i manipulate that column?
 lapis sequoia
So I learned the beginner stuffs of python and want to get into Ai and data science so will be helpful if any of u can suggest me a free site to get started
robust cosmos
royal crest
also are quarter bathrooms a thing
yes i was wondering that myself xD . But i dont understand how 0 and years are going to work together
 regal bronze
Hello has somebody ever been used Scrapy ?
serene scaffold
regal bronze
Hello has somebody ever been used Scrapy ?
Go ahead and ask your scrapy question so that people can see if they know how to help.
regal bronze
I am extracting/scraping some data, along with that I do want to convert the data from list to dict
regal bronze
In case somebody could share any ideas - they are more than welcomed
Thank you in advance
royal crest
too vague
in terms of list to dict, you ought to figure out what you want as your keys and values
which i'm expecting those lists to be values
so gotta figure out the keys
and for what purpose as well
 foggy cloak
I dont know if it's the right channel but i have a question. Let's say that len(training_data) = 16, can someone explain to me the red arrow? I have the results but i dont understand the change

in other words, an explanation for "i-4:i,0"
update: ok i understood that in every loop i get the 1-4 element, 2-5,3-6 etc. But i dont understand from the [i-4:i,0] the ",0"
regal bronze
specs = scrapy.Field(input_processor=MapCompose( remove_tags, formatting_specs,convert_to_dict), output_processor=Identity())
I am having a result of specification as list:
using items by Scrapy I have managed to format(removing the not desired text), so I am passing another function which is going to turn the list to dict, but I am getting an error like :
ValueError: Error with input processor MapCompose:
serene scaffold
@foggy cloak it means that it's taking the first element of four rows up to the ith row
foggy cloak
serene scaffold
<@232610559076335616> it means that it's taking the first element of four rows u...
i will elaborate so i can understand better


and now my x_train is this

i dont get what ",0" does
serene scaffold
You know how indexing starts at 0
It's taking the first element
Training data is a column vector. Which means that every row has one element.
foggy cloak
serene scaffold
Training data is a column vector. Which means that every row has one element.
are u telling me that if training_data had 2 columns and wanted the secon element, i would have put ",1"?
serene scaffold
foggy cloak
are u telling me that if training_data had 2 columns and wanted the secon elemen...
Yes yes yes! Good job!
foggy cloak
serene scaffold
Yes yes yes! Good job!
i thank you!!
 crystal mica
is this where the smart people live
 dull turtle
how i can iterate through all rows of```python
0 1314522902006138097
1 1314522902707897899
2 1314522903373856246
3 1314522904159525439
4 1314522905213452151
99995 1314522914243840962
99996 1314522914243913774
99997 1314522914243978819
99998 1314522914244046696
99999 1314522914244110503``` this values ?
 ionic slate
 clear smelt
d
dull turtle
when i use this code python date = pd.to_datetime(j,format='%Y%m%d%H%M%S', errors='coerce') print('date:', date) print() break for this data python j: 1314522902006138097 i get python date: NaT this way
how i can get date and time from it?
tender hearth
Are those Unix epochs?
dull turtle
tender hearth
Are those Unix epochs?
i have column which has transaction time value in python 0 1314522902006138097 1 1314522902707897899 2 1314522903373856246 3 1314522904159525439 4 1314522905213452151 this way
it is around 20 digit
i want to get date and time from it ?
do u get my point ? @tender hearth
dull turtle
velvet thorn
well
it shows date and time with milisecond or microsecond
velvet thorn
dull turtle
it shows date and time with milisecond or microsecond
which is which
is it millisecond OR microsecond
it can't be both
and what's the encoding
e.g. this
1314522902006138097
what datetime do you get from this
dull turtle
see actually i get data in csv which has this Transaction Time column which has around 20 digit value in it . when we decode this value we get date and time with second
velvet thorn
dull turtle
see actually i get data in csv which has this `Transaction Time` column which ha...
but how?
what is the mapping from this number to a datetime
it is not clear what the number represents
dull turtle
when i use this code ```python
for i, chunk in enumerate(pd.read_csv(f'{path}{file_name}{extension}' , engine='python', chunksize=100000 , iterator=True)):
print('i:', i)
print()
print(chunk['Transaction Time'])
print()

for j in chunk['Transaction Time']:
    print('j:', j)
    print()
    time_stamp = j
    print('time_stamp:', time_stamp)
    print()

    dt = datetime.fromtimestamp(time_stamp // 1000000000)

    print(dt.strftime('%d-%b-%Y %H:%M:%S'))
    print()
    break``` i get ```python
time_stamp: 1314522902006138097
28-Aug-2011 14:45:02``` this output which gives only for one row
my transaction time data ```python
0 1314522902006138097
1 1314522902707897899
2 1314522903373856246
3 1314522904159525439
4 1314522905213452151
99995 1314522914243840962
99996 1314522914243913774
99997 1314522914243978819
99998 1314522914244046696
99999 1314522914244110503``` this way @velvet thorn
it is taking only first value
it is not taking next value
do u get my point here ?
velvet thorn
ye
(df['Transaction Time'] / 1_000_000_000).map(datetime.fromtimestamp)
@dull turtle
dull turtle
velvet thorn
`(df['Transaction Time'] / 1_000_000_000).map(datetime.fromtimestamp)`
what this will do ?
dull turtle
velvet thorn
`(df['Transaction Time'] / 1_000_000_000).map(datetime.fromtimestamp)`
see i am getting this way ```python
i: 0
0 1314522902006138097
1 1314522902707897899
2 1314522903373856246
3 1314522904159525439
4 1314522905213452151
99995 1314522914243840962
99996 1314522914243913774
99997 1314522914243978819
99998 1314522914244046696
99999 1314522914244110503
Name: Transaction Time, Length: 100000, dtype: int64
j: 1314522902006138097
time_stamp: 1314522902006138097
0 2011-08-28 14:45:02.006138
1 2011-08-28 14:45:02.707898
2 2011-08-28 14:45:03.373856
3 2011-08-28 14:45:04.159525
4 2011-08-28 14:45:05.213452
99995 2011-08-28 14:45:14.243841
99996 2011-08-28 14:45:14.243914
99997 2011-08-28 14:45:14.243979
99998 2011-08-28 14:45:14.244047
99999 2011-08-28 14:45:14.244111
Name: Transaction Time, Length: 100000, dtype: datetime64[ns]
j: 1314522902707897899
time_stamp: 1314522902707897899
0 2011-08-28 14:45:02.006138
1 2011-08-28 14:45:02.707898
2 2011-08-28 14:45:03.373856
3 2011-08-28 14:45:04.159525
4 2011-08-28 14:45:05.213452
99995 2011-08-28 14:45:14.243841
99996 2011-08-28 14:45:14.243914
99997 2011-08-28 14:45:14.243979
99998 2011-08-28 14:45:14.244047
99999 2011-08-28 14:45:14.244111
Name: Transaction Time, Length: 100000, dtype: datetime64[ns]
j: 1314522903373856246
time_stamp: 1314522903373856246
0 2011-08-28 14:45:02.006138
1 2011-08-28 14:45:02.707898
2 2011-08-28 14:45:03.373856
3 2011-08-28 14:45:04.159525
4 2011-08-28 14:45:05.213452
99995 2011-08-28 14:45:14.243841
99996 2011-08-28 14:45:14.243914
99997 2011-08-28 14:45:14.243979
99998 2011-08-28 14:45:14.244047
99999 2011-08-28 14:45:14.244111
Name: Transaction Time, Length: 100000, dtype: datetime64[ns]
j: 1314522904159525439```
velvet thorn
dull turtle
see i am getting this way ```python
i: 0
0 1314522902006138097
1 ...
so what's wrong iwth that
you said you wanted a datetime
dull turtle
can u plz explain here what it has done here ? so i also get more idea of it
velvet thorn
that looks like one to me
velvet thorn
dull turtle
can u plz explain here what it has done here ? so i also get more idea of it
your original idea
was correct
the main thing is
you want to apply the function
over the entire Series
that's done with .map
velvet thorn
dull turtle
my transaction time data ```python
0 1314522902006138097
1 1314522...
btw
these are neither milliseconds nor microseconds
but nanoseconds
just so you know
dull turtle
sorry i got disconnected
my code ```python
for i, chunk in enumerate(pd.read_csv(f'{path}{file_name}{extension}' , engine='python', chunksize=100000 , iterator=True)):
print('i:', i)
print()
print('Transaction Time here...')
print()
print(chunk['Transaction Time'])
print()

for j in chunk['Transaction Time']:
    print('j:', j)
    print()

    time_stamp = j
    print('time_stamp:', time_stamp)
    print()

    print((chunk['Transaction Time'] / 1_000_000_000).map(datetime.fromtimestamp))
    print()``` it gives me ```python
reading file
i: 0
Transaction Time here...
0 1314522902006138097
1 1314522902707897899
2 1314522903373856246
3 1314522904159525439
4 1314522905213452151
99995 1314522914243840962
99996 1314522914243913774
99997 1314522914243978819
99998 1314522914244046696
99999 1314522914244110503
Name: Transaction Time, Length: 100000, dtype: int64
j: 1314522902006138097
time_stamp: 1314522902006138097
0 2011-08-28 14:45:02.006138
1 2011-08-28 14:45:02.707898
2 2011-08-28 14:45:03.373856
3 2011-08-28 14:45:04.159525
4 2011-08-28 14:45:05.213452
99995 2011-08-28 14:45:14.243841
99996 2011-08-28 14:45:14.243914
99997 2011-08-28 14:45:14.243979
99998 2011-08-28 14:45:14.244047
99999 2011-08-28 14:45:14.244111
Name: Transaction Time, Length: 100000, dtype: datetime64[ns]```
for this ```python
0 1314522902006138097
1 1314522902707897899
2 1314522903373856246
3 1314522904159525439
4 1314522905213452151
99995 1314522914243840962
99996 1314522914243913774
99997 1314522914243978819
99998 1314522914244046696
99999 1314522914244110503
Name: Transaction Time, Length: 100000, dtype: int64
j: 1314522902006138097
time_stamp: 1314522902006138097
0 2011-08-28 14:45:02.006138
1 2011-08-28 14:45:02.707898
2 2011-08-28 14:45:03.373856
3 2011-08-28 14:45:04.159525
4 2011-08-28 14:45:05.213452
99995 2011-08-28 14:45:14.243841
99996 2011-08-28 14:45:14.243914
99997 2011-08-28 14:45:14.243979
99998 2011-08-28 14:45:14.244047
99999 2011-08-28 14:45:14.244111
Name: Transaction Time, Length: 100000, dtype: datetime64[ns]
j: 1314522902707897899
time_stamp: 1314522902707897899
0 2011-08-28 14:45:02.006138
1 2011-08-28 14:45:02.707898
2 2011-08-28 14:45:03.373856
3 2011-08-28 14:45:04.159525
4 2011-08-28 14:45:05.213452
99995 2011-08-28 14:45:14.243841
99996 2011-08-28 14:45:14.243914
99997 2011-08-28 14:45:14.243979
99998 2011-08-28 14:45:14.244047
99999 2011-08-28 14:45:14.244111
Name: Transaction Time, Length: 100000, dtype: datetime64[ns]
j: 1314522903373856246
time_stamp: 1314522903373856246
0 2011-08-28 14:45:02.006138
1 2011-08-28 14:45:02.707898
2 2011-08-28 14:45:03.373856
3 2011-08-28 14:45:04.159525
4 2011-08-28 14:45:05.213452
99995 2011-08-28 14:45:14.243841
99996 2011-08-28 14:45:14.243914
99997 2011-08-28 14:45:14.243979
99998 2011-08-28 14:45:14.244047
99999 2011-08-28 14:45:14.244111
Name: Transaction Time, Length: 100000, dtype: datetime64[ns]``` i am getting this way
@velvet thorn can u plz check this ?
 sonic scaffold
why is it when sorting a new df, inplace command set to true makes the df become Nonetype
 hasty grail
if you're using an inplace function, that function doesn't return anything, so you shouldn't assign df to the result
prime hearth
hello, im getting the following error:
description="created by layer 'embedding_1_input'"), but it was called on an input with incompatible shape
using Sequential model and Embedding layers
i think he error has to do with how i setting up the Embedding Layer
my shapres for my array are
(500, 1000) (500, 1) (for x and y train)
(500, 1000) (500, 1) (for x and y test)
sonic scaffold
hasty grail
if you're using an inplace function, that function doesn't return anything, so y...
yess thanks!
prime hearth
my embedding set up:
model.add(Embedding(vocab_size,embedding_dim = 32,input_length=1000))
not sure. if this right params
my goal is i want 2 output
true or positive
but not sure what params i need for embedding layer
serene scaffold
Since when is datetime64[ns] a dtype and not object?
 feral spoke
Guys, does anyone have practise problems related to data analysis?
Please ping me, if you guys have any material for it.
 manic scarab
In pandas, does anyone know how to find if there are rows where a certain column has different values for a specific other column value?
For example, I have 2 columns: "title" and "description", and I want to find rows where the titles are the same, but the description are different
 grim patrol
sklearns fit_transform preprocessing doesn't make sense to me
I have two arrays for two features
size and direction
how exactly do I scale them and combine them?
from the docs:
Input samples.
so its shape would be something like (18,000, 2)
but how do you get to that shape exactly?
n_samples needs to be a 1D array from my understanding
 neat zodiac
hey everyone, i am working on eye gaze detection with opencv and moving cursor according to eye position, i have detected the iris with haarcascades pre trained model but how should i get the coordinates, any idea? i also know about pyautoGUI library for moving cursor but can't get the coordinates if anyone has worked on this please share your experience
lapis sequoia
How to solve error while installing face_recognition in python 3.7
tender stag
I was told using random sampling to select data points for a test set wasnt good to do
Anyone know why?
 polar breach
hello! dumb beginner question but im looking to build a slack bot for my team at work to handle FAQs in our channel.
and just from a design perspective, can anyone guide me to how i would want to create a model that will also understand when it should NOT answer a post?
so say i want to it to respond to question X,Y,Z but if someone asks about topic B, i want the bot to ignore it
grave frost
polar breach
hello! dumb beginner question but im looking to build a slack bot for my team at...
if the bot is trained only on XYZ then it won't try to reply to B (theoretically) unless it is indeed pretty close to X,Y or Z
usually, you can do a simple MLP that can do binary classification on the Language Model projections uou would use to see if you want it answered or not.
use rule-based systems if you are too lazy to do implement anything complicated
polar breach
grave frost
usually, you can do a simple MLP that can do binary classification on the Langua...
ty, ill be doing some digging, will be a nice resume project so ill put some effort into it ^.^
umbral skiff
How to convert this data into DataFrame?
{'7891149105564': {'-Mju1iDPbmG3uBFbbyJc': [{'codGetin': '7891149105564', 'codNcm': '22089000', 'dscProduto': 'CERV SKOL BEATS SENS', 'dthEmissaoUltimaVenda': '2021-09-18T16:11:24.000+0000', 'nomBairro': 'MANGABEIRAS', 'nomLogradouro': 'AV COMENDADOR GUSTAVO PAIVA', 'nomMunicipio': 'MACEIO', 'nomRazaoSocial': 'BOMPRECO SUPERMERCADOS DO NORDESTE LTDA', 'numCNPJ': '13004510014481', 'numCep': '57037532', 'numImovel': '2650-A', 'numLatitude': -9.6499384, 'numLongitude': -35.7174618, 'valMaximoVendido': 4.09, 'valMinimoVendido': 3.67, 'valUltimaVenda': 3.67, 'valUnitarioUltimaVenda': 3.67}]}}
``what is the structure of this?
grim patrol
I have input samples, each input sample is an array of 100 tuples of size 2 - my two features. Size and direction, So an example sample would be :
[ [10, 1], [15, 1], [3, 0]...] like so. ( [size, direction] tuples )
how do I scale such data?
std = StandardScaler()
X = std.fit_transform(data)
this throws the error: ValueError: setting an array element with a sequence.
I tried transposing the data so that I get this instead for each sample(using above example):
[ [10, 15, 3...], [1, 1, 0...]
that way the sizes and directions are all in their each matrix, but still I get the same ValueError.
serene scaffold
grim patrol
I have input samples, each input sample is an array of 100 tuples of size 2 - my...
Let's make sure we're on the same page about terminology. What you have is not an array of tuples--it is a two dimensional array of shape (100, 2), where each row is an item and the two columns are features about those items.
Question is though, what do you mean by "scale" it?
Please run print(type(data)) so that we can continue
desert oar
serene scaffold
Since when is `datetime64[ns]` a dtype and not `object`?
A long time, possibly always. Internally I think it's just big ints
desert oar
manic scarab
In pandas, does anyone know how to find if there are rows where a certain column...
You are asking about finding certain pairs of rows?
 cinder barn
OpenCV project that im working on which detects cars, pedestrians and stop signs on the road if anyone want's to help lmk https://github.com/Amendahawi/VehicleDetection

GitHub
Built with Python and OpenCV. Contribute to Amendahawi/VehicleDetection development by creating an account on GitHub.
grim patrol
serene scaffold
Let's make sure we're on the same page about terminology. What you have is not a...
Hey so I've done quite a lot since
If what I do doesn't work I'll come back here I guess
by scaling it - I meant preprocessing it
what I ended up doing is creating a new array, that has all the "size" features, and another array with all the "direction" inputs
and then I combined them and scaled it that way
to_scale = np.asarray([directions, sizes])
scaler = StandardScaler()
train_data_scaled = scaler.fit_transform(to_scale)
This is sort of moving the question. There's a lot of ways one could preprocess something. It depends on what state the data is in and what you want to do with it.
desert oar
Scaling is one of many possible data processing steps one could take when building a model
serene scaffold
desert oar
Scaling is one of many possible data processing steps one could take when buildi...
judging by the StandardScaler class existing, "scaling it" must mean something other than multiplying an array by a scaler. What is it that I don't know?
desert oar
serene scaffold
judging by the StandardScaler class existing, "scaling it" must mean something o...
Scalar* 😉
serene scaffold
desert oar
But yes, the "standard" means "standardizing", as in dividing by 1 (sample) standard deviation
"Centering [around the sample mean] and scaling [by the sample std dev]" together constitute "standardization" as in the "standard normal distribution"
And for completeness, "normalizing" usually means "scaling to a specific minimum and maximum" as in normalizing to [0,1]
I think that name is an extension of "normalizing" a vector, as in dividing by its length/"norm" to produce a unit vector
desert oar
i just had a thought
why do we have separate accessors iloc and loc, but not a 3rd accessor for boolean subsetting?
the more i think about it, the more i dislike that loc handles both lookup by index and boolean subsetting
cinder barn
neat zodiac
hey everyone, i am working on eye gaze detection with opencv and moving cursor a...
I was thinking of making that too yesterday 😂
 quiet vault
Does anyone have experience with a cnn lstm model for time series forcasting?
grave frost
neat zodiac
hey everyone, i am working on eye gaze detection with opencv and moving cursor a...
just get coordinates relative to some point?
or with the iris vector, output a 4D vector for force along the cursor
 modern beacon
how can i make tensorflow predict a string based on the training data, not a int?
serene scaffold
modern beacon
how can i make tensorflow predict a string based on the training data, not a int...
Can you be more specific about what you're trying to do?
modern beacon
serene scaffold
Can you be more specific about what you're trying to do?
i want to make a model that will produce a replay from a game based on a chart
i have a dataset already, but i am not quite sure how to train it for it to be efficient
the chart and the replay data are easily parsable into strings or objects
serene scaffold
@modern beacon so you want the model to output something that represents what move to make next?
If so, you might need to pick an arbitrary int to represent each possibility
modern beacon
serene scaffold
<@425316155863990272> so you want the model to output something that represents ...
yes, i guess
i want the chart to be the input, and the model will output the replay
the output must have time before previous action, x, y, and keypress data
the input will have time in which the object is placed, x and y
serene scaffold
modern beacon
yes, i guess
i want the chart to be the input, and the model will output the rep...
What do you mean that the model will output the replay? This is going to be tabular data?
modern beacon
serene scaffold
What do you mean that the model will output the replay? This is going to be tabu...
yep, it's going to be tabular data
serene scaffold
@modern beacon so what you want to understand is that the part that you build with tensorflow is just going to be the decision making part of all of this. If you need something that's more human readable after that, you have to modify the output from tensorflow from there
modern beacon
serene scaffold
<@425316155863990272> so what you want to understand is that the part that you b...
ahh i see i see
so, what data do i need to put in order to get the output? just an array of integers of the data i was talking about or something different?
dull turtle
hello my code ```python
for i, chunk in enumerate(pd.read_csv(f'{path}{file_name}{extension}' , engine='python', chunksize=100000 , iterator=True)):
print('i:', i)
print()
print('Transaction Time here...')
print()
print(chunk['Transaction Time'])
print()

for j in chunk['Transaction Time']:
    print('j:', j)
    print()

    time_stamp = j
    print('time_stamp:', time_stamp)
    print()

    print((chunk['Transaction Time'] / 1_000_000_000).map(datetime.fromtimestamp))
    print()``` this way
my output ```python
Transaction Time here...
0 1314522902006138097
1 1314522902707897899
2 1314522903373856246
3 1314522904159525439
4 1314522905213452151
99995 1314522914243840962
99996 1314522914243913774
99997 1314522914243978819
99998 1314522914244046696
99999 1314522914244110503
Name: Transaction Time, Length: 100000, dtype: int64
j: 1314522902006138097
time_stamp: 1314522902006138097
0 2011-08-28 14:45:02.006138
1 2011-08-28 14:45:02.707898
2 2011-08-28 14:45:03.373856
3 2011-08-28 14:45:04.159525
4 2011-08-28 14:45:05.213452
99995 2011-08-28 14:45:14.243841
99996 2011-08-28 14:45:14.243914
99997 2011-08-28 14:45:14.243979
99998 2011-08-28 14:45:14.244047
99999 2011-08-28 14:45:14.244111
Name: Transaction Time, Length: 100000, dtype: datetime64[ns]``` this way
can anyone help me to understand this output?
arctic wedgeBOT
Pasting large amounts of code
If your code is too long to fit in a codeblock in discord, you can paste your code here:
https://paste.pydis.com/
After pasting your code, save it by clicking the floppy disk icon in the top right, or by typing ctrl + S. After doing that, the URL should change. Copy the URL and post it here so others can see it.
dull turtle
my output https://paste.pythondiscord.com/yikuhetixu.http here plz check
ping me when replying
serene scaffold
@modern beacon I might be able to look at it with you some time. I'll be busy for the next few hours now.
modern beacon
serene scaffold
<@425316155863990272> I might be able to look at it with you some time. I'll be ...
okie i see i see thank you
ping or dm me once you have some time!
 coral warren
I need help with project ideas for my college 'group" project
I'm required to present a project backed by several research papers, mainly focused on Machine learning datasets, etc
Can u guys help me with some beginner level project ideas ?
 abstract stratus
Can someone help me in #help-croissant ?
 urban jasper
Hey guys #data-science-and-ml or #algos-and-data-structs I’m trying to learn how to use Python for creating music plugins for making programs like autotune, compression, reverb etc etc. I’ve been doing some research and their and very limited resources and content on these things and I really wanna learn this really bad. Of anyone has any resources on how to get started please let me know. Thanks 🙏🏾
serene scaffold
urban jasper
Hey guys <#366673247892275221> or <#650401909852864553> I’m trying to learn how ...
I'm not sure that either of the two channels you just mentioned are related to your question. Did you try #python-discussion?
urban jasper
serene scaffold
I'm not sure that either of the two channels you just mentioned are related to y...
No I haven’t I’ll ask over there thanks
serene scaffold
Today my coauthor and I were revising our paper, and she said I needed to change the way I use the term "machine learning" because there are apparently individuals who think of "machine learning" and "deep learning" as disjoint sets of techniques, rather than deep learning being a subset of machine learning. This strikes me as odd--does anyone else have an opinion on this?
lapis sequoia
whats the best libary to use for making deep learning ai? or what you use.
desert oar
serene scaffold
Today my coauthor and I were revising our paper, and she said I needed to change...
Those individuals are morons and unless they are the editor of the journal should be ignored and left to their linkedin and medium blogging
serene scaffold
desert oar
Those individuals are morons and unless they are the editor of the journal shoul...
We just avoided any language that would imply how we feel on the matter.
Though in my usage, ai > machine learning > deep learning
iron basalt
Deep learning is a proper subset of machine learning (although it's not a well defined term, just fuzzily means backpropagation based methods).
(as sets)
 azure void
Hello plz if i want to show the pie chart of just 3 elements of my excel data how i do using plotly ?
iron basalt
Machine learning and AI is more complex. For example, many game "AI"'s don't learn.
For some, AI by definition has to be something that at least learns.
(Or very simply, AI is just what we don't understand yet, it's always a line that is pushed back (until it can't be pushed back anymore like other things in the past))
(For someone that makes game "AI", it's not really "AI" at all, but for someone that does not program at all, it feels like it)
azure void
azure void
Hello plz if i want to show the pie chart of just 3 elements of my excel data ho...
Plz urgent
 bronze skiff
desert oar
Those individuals are morons and unless they are the editor of the journal shoul...
bronze skiff
desert oar
Those individuals are morons and unless they are the editor of the journal shoul...
agreed, avoid anything written about ML on medium--it's a garbage platform for low-effort articles
flint grotto
sir
i have some problem

i'm now create env. in to mini conda.
but, pop out error.
before, pop out 'conda activate' now pop out error
 olive shore
SELECT s.subreddit as subreddit,
s.selftext as submission, a.body AS comment, b.body as reply,
s.score as submission_score, a.score as comment_score, b.score as reply_score,
s.author as submission_author, a.author as comment_author, b.author as reply_author
FROM `fh-bigquery.reddit_comments.2019_12` LIMIT 1000
LEFT JOIN `fh-bigquery.reddit_comments.2019.12` b
ON CONCAT('t1_',a.id) = b.parent_id
LEFT JOIN  `fh-bigquery.reddit_posts.2019.12` s
ON CONCAT('t3_',s.id) = a.parent_id
where b.body is not null
  and s.selftext is not null and s.selftext != ''
  and b.author != s.author
  and b.author != a.author
  and s.subreddit IN ('writing',
                      'scifi',
                      'sciencefiction',
                      'MachineLearning',
                      'philosophy',
                      'cogsci',
                      'neuro',
                      'Futurology',
                      'AmItheAsshole',
                      'playboicarti')
i am getting this error
Syntax error: Expected end of input but got keyword LEFT at [6:1]
i am trying to get reddit data
this is on big query
 burnt acorn
I have problem that running this code makes Errno 13 "permession denied" , so what shoud i do?
 serene scaffold
@iron basalt my definition of AI is one that can be pushed back once people take the ability of a computer to do it for granted. Machines existing and doing math would have been magical at one time
flint grotto
i need help. i'm now create venv, in to the miniconda. so, pop up that error. still working venv activate. but i wanna fix this.
 errant parcel
Any suggestions on ways to ingest time series data into a ML algorithm?
just looking for common techniques and some background
iron basalt
serene scaffold
<@119925597395877889> my definition of AI is one that can be pushed back once pe...
There are some actually useful definitions such as AI being any approximation of AIXI: https://en.wikipedia.org/wiki/AIXI
AIXI ['ai̯k͡siː] is a theoretical mathematical formalism for artificial general intelligence.
It combines Solomonoff induction with sequential decision theory.
AIXI was first proposed by Marcus Hutter in 2000 and several results regarding AIXI are proved in Hutter's 2005 book Universal Artificial Intelligence.AIXI is a reinforcement learning age...
(Defintions that are actual definitions)
serene scaffold
@iron basalt I wouldn't conflate formal definitions with definitions in general.
iron basalt
serene scaffold
<@119925597395877889> I wouldn't conflate formal definitions with definitions in...
Yea, just the the non-formal one does not seem to exist. Its variance too great.
(So not very useful)
serene scaffold
iron basalt
Yea, just the the non-formal one does not seem to exist. Its variance too great.
Rather that there are many informal ones. That doesn't mean that they aren't useful in any way
iron basalt
(Beyond stating that one is doing something not yet completely figured out)
serene scaffold
It seems that we're just discussing philosophy of language at this point.
iron basalt
serene scaffold
It seems that we're just discussing philosophy of language at this point.
Yea, I think it's best to avoid the topic. It's the entire issue with the term AI and it's why the term ML is often used instead (avoid that whole discussion).
 tender sequoia
does a word serve the purpose for the context of the discourse and is understood by the interlocutors thereof?
yes -> valid use of word
no -> word with additional nuance required
desert oar
iron basalt
Yea, I think it's best to avoid the topic. It's the entire issue with the term A...
It doesn't help that they have both become marketing buzzwords
bold timber
Hi, i so confuse to decide the model is overfit or not.
If i have train score =0.98 and test score = 0.92, is it overfit?
hasty grail
show the training and test curves
a common pattern that can be seen in the case of overfitting is that the validation score peaks and then decreases even as the training score keeps improving
bold timber
hasty grail
show the training and test curves
how is code to show curves?
 rose schooner
Has anyone ever made a mamdani fuzzy inference system, 2 inputs and 2 outputs using scikit fuzzy python?
hasty grail
bold timber
how is code to show curves?
it depends on which framework you're using
bold timber
hasty grail
it depends on which framework you're using
can you give me an example?
hasty grail
scikit-learn, PyTorch, TensorFlow
bold timber
hasty grail
scikit-learn, PyTorch, TensorFlow
How's code when i use scikit-learn?
hasty grail
what type of model are you using?
bold timber
hasty grail
what type of model are you using?
LGBM
hasty grail
try plt.plot(model.loss_curve_)
bold timber
hasty grail
try `plt.plot(model.loss_curve_)`
ok thank you
 dawn crown
how to use numpy.random.randint with numba because this example code gives error
from numba import jit
import numpy as np
@jit(nopython=True)
def foo():
    a = np.random.randint(16, size=(3,3))
    return a
foo()
according to this it only supports the first two args
which are low and high
dawn crown
royal crest
https://numpy.org/doc/stable/reference/random/generated/numpy.random.randint.htm...
so i can only generate 1?
not an array?
royal crest
at least according to the documentation
dawn crown
numpy.random.rand()?
royal crest
dawn crown
numpy.random.rand()?
arctic wedgeBOT
numba/cpython/randomimpl.py lines 1314 to 1326
        return impl_ret_new_ref(context, builder, sig.return_type, arr._getvalue())


# ------------------------------------------------------------------------
# Irregular aliases: np.random.rand, np.random.randn

@overload(np.random.rand)
def rand(*size):
    if len(size) == 0:
        # Scalar output
        def rand_impl(*size):
return np.random.random()```should be fine
if you click on the link I sent, the documentation doesn't mention anything about only taking in two args for rand()
unlike randint()
dawn crown
import random
k = []
for x in range(3):
  k.append((random.randint(0, 16), random.randint(0, 16), random.randint(0, 16)))
kinda have to use smth like this
and then convert the list into a numpy array ig
gaunt marsh
I want to use this: https://www.python-graph-gallery.com/treemap/
I have a dataframe which looks like this. Does anyone have an idea how to plot this into that kind of treemap?

The Python Graph Gallery
A collection of treemap examples made with Python, coming with explanation and reproducible code
lapis sequoia
Anyone got better voice for linux than espeak
 wind steeple
is this where we put opencv2 questions
serene scaffold
wind steeple
is this where we put opencv2 questions
Yes
serene scaffold
dawn crown
```py
import random
k = []
for x in range(3):
k.append((random.randint(0, 16),...
!e
You don't have to do it that way, no.
import numpy as np
arr = np.random.randint(0, 17, (3, 3))
print(arr)
@serene scaffold :white_check_mark: Your eval job has completed with return code 0.
001 | [[ 0  4  0]
002 |  [ 0  8  6]
003 |  [14  1 14]]
You will need to turn each item into a single value, like a string
desert oar
dawn crown
```py
import random
k = []
for x in range(3):
k.append((random.randint(0, 16),...
What if you generate the random data outside the numba function?
if you want to do this in a tight loop or something, you might want to consider using cython instead
gaunt marsh
desert oar
You will need to turn each item into a single value, like a string
One long string?
desert oar
gaunt marsh
One long string?
no, each item should be a string
dull turtle
hello
Traceback (most recent call last):

  File "F:\office codes\transaction time.py", line 48, in <module>
    chunk.insert(2, value = c, column = 'time seprated')

  File "C:\Users\shubh\anaconda3\lib\site-packages\pandas\core\frame.py", line 3763, in insert
    self._mgr.insert(loc, column, value, allow_duplicates=allow_duplicates)

  File "C:\Users\shubh\anaconda3\lib\site-packages\pandas\core\internals\managers.py", line 1191, in insert
    raise ValueError(f"cannot insert {item}, already exists")

ValueError: cannot insert time seprated, already exists```Alright! Should each item be in a separate array?
Or no subarrays?
desert oar
is this a dataframe with 3 columns, or a series of length-3 lists/tuples?
i'm saying that each "element" of this data is a triple (r,g,b)
so you need to represent each triple as either a string or a tuple or something else that can be counted as a "single thing"
!eval one example:
import pandas as pd

rgb_df = pd.DataFrame([
    [205, 155, 201],
    [102, 175, 73],
    [205, 155, 201],
], columns=list('rgb'))
print(rgb_df)

rgb_labels = rgb_df.apply(','.join, axis=1)
rgb_counts = rgb_labels.value_counts()

print(rgb_counts)
@desert oar :x: Your eval job has completed with return code 1.
001 |      r    g    b
002 | 0  205  155  201
003 | 1  102  175   73
004 | 2  205  155  201
005 | Traceback (most recent call last):
006 |   File "<string>", line 10, in <module>
007 |   File "/snekbox/user_base/lib/python3.9/site-packages/pandas/core/frame.py", line 7768, in apply
008 |     return op.get_result()
009 |   File "/snekbox/user_base/lib/python3.9/site-packages/pandas/core/apply.py", line 185, in get_result
010 |     return self.apply_standard()
011 |   File "/snekbox/user_base/lib/python3.9/site-packages/pandas/core/apply.py", line 276, in apply_standard
... (truncated - too many lines)
Full output: https://paste.pythondiscord.com/zafozozoja.txt?noredirect
desert oar
hm let me see what i did wrong
serene scaffold
hey salt rock lamp
I got a computer with a CUDA-enabled GPU
what do I do first?
I installed pytorch and made random tensors for the lulz
desert oar
hell idk, i've never had a cuda enabled gpu 😆
serene scaffold
I thought you did
desert oar
i have a 1060 but i never set it up because linux
i didn't want to start doing machine learning on windows again
and didn't want to figure out wsl
serene scaffold
it's not hard
desert oar
go fit some models!
xgboost on some financial data, autoencoder on fashion mnist. whatever
dull turtle
dull turtle
```python
Traceback (most recent call last):
File "F:\office codes\transactio...
my question here
desert oar
gaunt marsh
Alright! Should each item be in a separate array?
!e ```python
import pandas as pd
rgb_df = pd.DataFrame([
[205, 155, 201],
[102, 175, 73],
[205, 155, 201],
], columns=list('rgb'), dtype=float)
print(rgb_df)
print()
def format_rgb(rgb):
return '(' + ', '.join(format(val, '06.2f') for val in rgb) + ')'
rgb_labels = rgb_df.apply(format_rgb, axis=1)
print(rgb_labels)
print()
rgb_counts = rgb_labels.value_counts()
print(rgb_counts)
@desert oar :white_check_mark: Your eval job has completed with return code 0.
001 |        r      g      b
002 | 0  205.0  155.0  201.0
003 | 1  102.0  175.0   73.0
004 | 2  205.0  155.0  201.0
005 |
006 | 0    (205.00, 155.00, 201.00)
007 | 1    (102.00, 175.00, 073.00)
008 | 2    (205.00, 155.00, 201.00)
009 | dtype: object
010 |
011 | (205.00, 155.00, 201.00)    2
... (truncated - too many lines)
Full output: https://paste.pythondiscord.com/forufefemi.txt?noredirect
dull turtle
Traceback (most recent call last):

  File "F:\office codes\transaction time.py", line 48, in <module>
    chunk.insert(2, value = c, column = 'time seprated')

  File "C:\Users\shubh\anaconda3\lib\site-packages\pandas\core\frame.py", line 3763, in insert
    self._mgr.insert(loc, column, value, allow_duplicates=allow_duplicates)

  File "C:\Users\shubh\anaconda3\lib\site-packages\pandas\core\internals\managers.py", line 1191, in insert
    raise ValueError(f"cannot insert {item}, already exists")

ValueError: cannot insert time seprated, already exists```how i can add data in particular for each iteration
desert oar
dull turtle
```python
Traceback (most recent call last):
File "F:\office codes\transactio...
!paste show us your code in addition to the error message 👇
arctic wedgeBOT
Pasting large amounts of code
If your code is too long to fit in a codeblock in discord, you can paste your code here:
https://paste.pydis.com/
After pasting your code, save it by clicking the floppy disk icon in the top right, or by typing ctrl + S. After doing that, the URL should change. Copy the URL and post it here so others can see it.
desert oar
i can't guarantee i know the answer btw
serene scaffold
desert oar
!e ```python
import pandas as pd
rgb_df = pd.DataFrame([
[205, 155, 201],
...
couldn't you use use an apply at that point?
desert oar
serene scaffold
couldn't you use use an `apply` at that point?
i did!
serene scaffold
one sec
dull turtle
desert oar
!paste show us your code in addition to the error message 👇
my code here https://paste.pythondiscord.com/ewusezejiv.py
my error https://paste.pythondiscord.com/ajalinitof.sql here
desert oar
well for one thing you're deleting the column inside the loop
that's a confusing error but your code is confusing too
if you're reading the entire thing into memory anyway, why not just process it all at once?
dull turtle
desert oar
that's a confusing error but your code is confusing too
i am just creating date and time obj
desert oar
the error seem to be saying that the insert can't proceed because there's already a column of that name
i didn't even know dataframes had an insert method
dull turtle
desert oar
if you're reading the entire thing into memory anyway, why not just process it a...
my whole data is more than 1000000 rows
serene scaffold
!e
import pandas as pd
rgb_df = pd.DataFrame([
    [205, 155, 201],
    [102, 175, 73],
    [205, 155, 201],
], columns=list('rgb'), dtype=float)

result = rgb_df.apply(tuple, axis=1).value_counts()
print(result)
@serene scaffold :white_check_mark: Your eval job has completed with return code 0.
001 | (205.0, 155.0, 201.0)    2
002 | (102.0, 175.0, 73.0)     1
003 | dtype: int64
yes dataframe do have insert method
desert oar
serene scaffold
!e
```py
import pandas as pd
rgb_df = pd.DataFrame([
[205, 155, 201],
[1...
i'm not sure if the treemap plot would work w/ tuples
i'd still want them as strings for better control of how they get printed, esp. with float precision
serene scaffold
desert oar
dull turtle
yes dataframe do have insert method
the problem is clearly that you can't insert a column that already exists
so you need to create the column first and then insert data into it
https://pandas.pydata.org/pandas-docs/stable/reference/api/pandas.DataFrame.insert.html
Raises a ValueError if column is already contained in the DataFrame, unless
allow_duplicatesis set to True.
dull turtle
desert oar
the problem is clearly that you can't insert a column that already exists
can explain my problem to u again so u get better idea what i am trying to do
desert oar
some context would be helpful, yes
royal crest
error says line 48, but the code is only 38 lines ?
desert oar
@dull turtle you're trying to insert into the dataframe for every value of the "transaction time" column
you need to do it once per chunk
you're just trying to add 10 years? to every transaction time
you can do this a lot more efficiently anyway, and not have to do all this very slow looping
dull turtle
see i have data in csv which has more than 1000000 rows
in my dataframe i have 'Transaction Time' column. I am converting that column into human readable date time formatt. after converting transaction time data into human readable format then i want to frop original 'Transaction Time' column and replace that with this newly created human readable values```
now u get my point ?yes, this way i want to do
desert oar
why does adding 10 years make it human-readable?
- can you give me a few rows of example data?
- what do you mean by "human-readable"?
- what do you want to do with the data after processing it? save it to a new csv?
dull turtle
desert oar
why does adding 10 years make it human-readable?
i want to add 10 years to every year
dull turtle
desert oar
1) can you give me a few rows of example data?
2) what do you mean by "human-rea...
give me a min
desert oar
also - it looks like Transaction Time is an integer timestamp. what is its precision? nanoseconds?
dull turtle
desert oar
1) can you give me a few rows of example data?
2) what do you mean by "human-rea...
see this way my data is

- human readable mean
2021-08-28 14:45:17.470707this format

- can i save this data in same csv just replacing original data with this human readable data
desert oar
(3) will be difficult or impossible if reading in chunks
you'll need to save to a different csv, or read it all in one csv and overwrite the csv at the end
dull turtle
desert oar
you'll need to save to a different csv, _or_ read it all in one csv and overwrit...
okay fine i will save it in differennt csv
now u get my point what i am trying to do ? @desert oar
desert oar
from datetime import timedelta

import pandas as pd


filename_in = "..."
filename_out = "..."

df_chunks = pd.read_csv(
    filename_in,
    engine="python",
    chunksize=100000,
    iterator=True,
)

for i, chunk in enumerate(df_chunks):
    print("chunk no.:", i)

    time_separated = pd.to_datetime(chunk["Transaction Time"]) + timedelta(years=10)
    chunk.insert(2, "time_separated", time_separated)
    del chunk["Transaction Time"]

    is_first_chunk = i == 0
    write_header = is_first_chunk
    write_append = not is_first_chunk

    chunk.to_csv(filename_out, header=write_header, append=write_append)
@dull turtle like that?
what's with engine="python"?
you could probably remove engine="python" and it will run faster. but maybe you had it there for a reason
(does the c engine not support chunks?)
dull turtle
desert oar
what's with `engine="python"`?
when we deal with larger data then we use it
dull turtle
desert oar
```python
from datetime import timedelta
import pandas as pd
filename_in = "....
what this will do python time_separated = pd.to_datetime(chunk["Transaction Time"]) + timedelta(years=10)
desert oar
dull turtle
what this will do ```python
time_separated = pd.to_datetime(chunk["Transaction ...
converts the integer data to a datetime, using nanoseconds (by default), and adds 10 years to it
!d pandas.to_datetime
arctic wedgeBOT
pandas.to_datetime(arg, errors='raise', dayfirst=False, yearfirst=False, utc=None, format=None, exact=True, unit=None, infer_datetime_format=False, origin='unix', cache=True)```
Convert argument to datetime.you can change the precision with unit=
hm, i see your data is 1e18
so you might still need to divide by 1e9 first
dull turtle
can u help me to make changes in my code
desert oar
i just wrote the entire script for you!
dull turtle
desert oar
hm, i see your data is 1e18
1314522902006138097
desert oar
those are nanoseconds?
!e ```python
import pandas as pd
print( pd.to_datetime(1314522902006138097) )
@desert oar :white_check_mark: Your eval job has completed with return code 0.
2011-08-28 09:15:02.006138097
seems reasonable
i've never heard of using the python parser on bigger data
i'm not sure why you would. i know the c parser is faster, i would assume it also uses less memory
could be worth benchmarking, but in chunks i don't see the point of reducing memory, just reduce the chunk size
dull turtle
arctic wedge
<@389497659087650836> :white_check_mark: Your eval job has completed with return...
in this i want to add 10 years to every year
so exp output 2011-08-28 09:15:02.006138097 this way
desert oar
yes, did you try what i sent?
you might want to use strftime to convert it back to a consistent format too
!d pandas.Series.dt.strftime
arctic wedgeBOT
Series.dt.strftime(*args, **kwargs)```
Convert to Index using specified date\_format.

Return an Index of formatted strings specified by date\_format, which supports the same string format as the python standard library. Details of the string format can be found in [python string format doc](https://docs.python.org/3/library/datetime.html#strftime-and-strptime-behavior).from datetime import timedelta
import pandas as pd
filename_in = "..."
filename_out = "..."
df_chunks = pd.read_csv(
filename_in,
engine="python",
chunksize=100000,
iterator=True,
)
for i, chunk in enumerate(df_chunks):
print("chunk no.:", i)
time_separated = pd.to_datetime(chunk["Transaction Time"]) + timedelta(years=10)
chunk.insert(2, "time_separated", time_separated)
del chunk["Transaction Time"]
is_first_chunk = i == 0
write_header = is_first_chunk
write_append = not is_first_chunk
chunk.to_csv(filename_out, header=write_header, append=write_append)``` this one? time_separated = pd.to_datetime(chunk["Transaction Time"]) + timedelta(years=10)
time_separated = time_separated.dt.strftime('...')
yes
dull turtle
desert oar
```python
from datetime import timedelta
import pandas as pd
filename_in = "....
i am getting ```python
Traceback (most recent call last):
File "F:\office codes\transaction time seprateed code.py", line 24, in <module>
time_separated = pd.to_datetime(chunk["Transaction Time"]) + timedelta(years=10)
TypeError: 'years' is an invalid keyword argument for new()``` this error
desert oar
it's probably year=
i recommend reading the docs instead of relying on a stranger's untested code to be 100% correct
!d datetime.timedelta
arctic wedgeBOT
class datetime.timedelta(days=0, seconds=0, microseconds=0, milliseconds=0, minutes=0, hours=0, weeks=0)```
All arguments are optional and default to `0`. Arguments may be integers or floats, and may be positive or negative.

Only *days*, *seconds* and *microseconds* are stored internally. Arguments are converted to those units...yes
desert oar
it's actually a good question - what if it's feb 29, 2012? what do you want 10 years after that to be?
i don't think 2022 is a leap year
the simplest solution would be to add 365 days, days=365
dawn crown
serene scaffold
!e
You don't have to do it that way, no.
```py
import numpy as np
arr = np.rando...
i dont think numba supports that too
dull turtle
desert oar
it's actually a good question - what if it's feb 29, 2012? what do you want 10 y...
i do not want to do anything with leap year or not, i just want to add 10 years to every year
desert oar
then add 365 days, or write a separate function to "unpack" and "repack" the datetime object
dawn crown
desert oar
What if you generate the random data outside the numba function?
that kinda won't work, but i found a better way around
desert oar
def add_10_years(dt):
    # NOTE: you could end up creating dates that don't exist, if `dt` is Feb 29 on a leap year
    return datetime(
        years=dt.years + 10,
        months=dt.months,
        days=dt.days,
        hours=dt.hours,
        minutes=dt.minutes,
        seconds=dt.seconds,
        microseconds=dt.microseconds,
    )
@dawn crown yeah I missed the context where you were using numba. Sorry
dawn crown
dawn crown
that kinda won't work, but i found a better way around
out = np.empty(size, dtype=np.uint16)
for idx in np.ndindex(size):
    out[idx] = np.random.randint(16)
see i just want to add 10 years to every year what is mean by you could end up creating dates that don't exist, if dt is Feb 29 on a leap year this ?
desert oar
i already explained
what is 10 years after feb 29, 2012?
hint: there is no feb 29 in 2022
dull turtle
desert oar
hint: there is no feb 29 in 2022
okay , i see
desert oar
so you can do timedelta(days=365) or you can use the function above to add 10 to the "years" number no matter what, or you can do some if/else special treatment of feb 29
the timedelta version is probably the easiest? that said, why do you want to delete the original column?
royal crest
add 3652.5 days I guess
desert oar
honestly i've heard worse ideas 😛
dull turtle
can u help me with this timedelta(days=365) in above code
desert oar
the length of a day is changing though!
desert oar
dull turtle
can u help me with this ` timedelta(days=365)` in above code
i bet you can figure it out
i'm not saying that because i don't want to help. i'm saying that because you're definitely smart enough to figure it out, and there's no point doing everything for you when you can do it yourself
otherwise you never learn anything and just rely on other people to do everything for you
dawn crown
desert oar
the length of a day is changing though!
by a small margin which is negligible
dull turtle
desert oar
i bet you can figure it out
from datetime import timedelta
import pandas as pd

filename_in = "..."
filename_out = "..."

df_chunks = pd.read_csv(
    filename_in,
    engine="python",
    chunksize=100000,
    iterator=True,
)

for i, chunk in enumerate(df_chunks):
    print("chunk no.:", i)

    time_separated = pd.to_datetime(chunk["Transaction Time"]) + timedelta(days=365)
    chunk.insert(2, "time_separated", time_separated)
    del chunk["Transaction Time"]

    is_first_chunk = i == 0
    write_header = is_first_chunk
    write_append = not is_first_chunk

chunk.to_csv(filename_out, header=write_header, append=write_append)```timedelta(days=365) this way ? @desert oar
dull turtle
desert oar
i bet you can figure it out
Traceback (most recent call last):

  File "F:\office codes\transaction time seprateed code.py", line 32, in <module>
    chunk.to_csv(f'{new_path}{output_file_name}{extension}', header=write_header, append=write_append)

TypeError: to_csv() got an unexpected keyword argument 'append'``` this error!d pandas.DataFrame.to_csv
arctic wedgeBOT
DataFrame.to_csv(path_or_buf=None, sep=',', na_rep='', float_format=None, columns=None, header=True, index=True, index_label=None, mode='w', encoding=None, compression='infer', ...)```
Write object to a comma-separated values (csv) file.chunk.to_csv(filename_out, header=write_header, mode='a' if write_append else 'w')
or
write_mode = 'w' if is_first_chunk else 'a'
chunk.to_csv(filename_out, header=write_header, mode=write_mode)
My vote is to always have lots of nested expressions
dull turtle
desert oar
```python
chunk.to_csv(filename_out, header=write_header, mode='a' if write_appe...
  File "F:\office codes\transaction time seprateed code.py", line 35
    chunk.to_csv(f'{new_path}{output_file_name}{extension}', header=write_header,if write_append else 'w')
                                                                                 ^
SyntaxError: invalid syntax```@dull turtle you need to spend some time figuring out the errors you get
instead of posting them here immediately
serene scaffold
salt rock lamp and whatever gm is calling themself at the moment are right. we're here to help, so don't be afraid to ask for help in this channel, but developing your own debugging skills is super important
dull turtle
desert oar
you can figure that one out <@!672406849538097173>
i am getting now python reading file chunk no.: 0 chunk no.: 1 chunk no.: 2 chunk no.: 3 chunk no.: 4 chunk no.: 5 ... chunk no.: 60 chunk no.: 61 chunk no.: 62 chunk no.: 63 chunk no.: 64 chunk no.: 65 chunk no.: 66 and so on...
also same time csv is getting created
desert oar
@dull turtle i'm not going to help more until you take some ownership over your own work, i'm sorry
serene scaffold
🥳
desert oar
i have to go back to my own work now anyway
or was that meant to be success?
if so, sorry for my rudeness
dull turtle
i agree, but can u help me to understand that when it will stop writing in csv file ?
serene scaffold
dull turtle
i agree, but can u help me to understand that when it will stop writing in csv ...
sounds like they need to get back to what they were doing
dull turtle
serene scaffold
sounds like they need to get back to what they were doing
i agree, but can u give some idea when it will stop ? because i need to understand this thats why
serene scaffold
dull turtle
i agree, but can u give some idea when it will stop ? because i need to understa...
I actually need to get back to what I was doing as well
dull turtle
see i agree your thoughts, but can u atleast give some idea when it will stop ?
velvet thorn
dull turtle
see i agree your thoughts, but can u atleast give some idea when it will stop ?
number of chunks * average time taken per chunk would be a good starting point, don't you think
dull turtle
velvet thorn
number of chunks * average time taken per chunk would be a good starting point, ...
how we know that number of chunks how many chunks we have ?
velvet thorn
dull turtle
how we know that `number of chunks` how many chunks we have ?
you literally specify chunksize
dull turtle
velvet thorn
you literally specify `chunksize`
in my code python df_chunks = pd.read_csv(f'{path}{file_name}{extension}', engine="python", chunksize=100000, iterator=True, ) i have used this way
velvet thorn
dull turtle
in my code ```python
df_chunks = pd.read_csv(f'{path}{file_name}{extension}',
...
yes, so...
dull turtle
velvet thorn
yes, so...
can u explain a bit more here ?
desert oar
dull turtle
i agree, but can u give some idea when it will stop ? because i need to understa...
??? it will stop when it's done!
how big is this file exactly? seems like it might have millions of rows. maybe you need a bigger chunk size
dull turtle
desert oar
??? it will stop when it's done!
when i stopped in between and saw data inside csv file i get this way
 dull turtle
desert oar
how big is this file exactly? seems like it might have millions of rows. maybe y...
dull turtle
desert oar
how big is this file exactly? seems like it might have millions of rows. maybe y...
5.55 gb file size
desert oar
then i probably messed up the writing somehow, maybe i swapped the mode arguments
i really encourage you to read the docs and work on it yourself a bit
dull turtle
desert oar
then i probably messed up the writing somehow, maybe i swapped the `mode` argume...
means ?
serene scaffold
@dull turtle these people have told you repeatedly that they need to get back to what they are doing. Please respect their wishes.
dull turtle
why i am getting this way in seprated_time column

i am not able to see date in that
my code here https://paste.pythondiscord.com/luxohijupa.py
 slim drift
hey guys, in matplotlib right here, is there a way to calculate the percent of orange and cyan bars that overlap

also @ me if you can help since i'll be on all day
desert oar
slim drift
It would be somewhat easy using the underlying data. You can extract the data from the plot object as well, i.e. the return value from plotting functions like ax.plot
desert oar
slim drift
whats the return value?
I just mean "the value returned from a function"
slim drift
kinda
slim drift
desert oar
Do you know what "return" means in programming?
im still learning abt it
ive only taken 1 python course so far so im kinda new
desert oar
slim drift
ive only taken 1 python course so far so im kinda new
Do you remember learning about the return statement?
desert oar
slim drift
but its all a bit foggy atm

In this step-by-step tutorial, you'll learn how to use the Python return statement when writing functions. Additionally, you'll cover some good programming practices related to the use of return. With this knowledge, you'll be able to write readable, robust, and maintainable functions in Python.
It's how functions pass data back to you when you call them
slim drift
so i would use it to get the data from the plot?
desert oar
in this case you're already plotting the data, so you don't have to worry about extracting anything from the plot objects
Can you describe the data that you are using to plot this? In particular, if you can provide a sample of the data, that would be helpful
!paste
arctic wedgeBOT
Pasting large amounts of code
If your code is too long to fit in a codeblock in discord, you can paste your code here:
https://paste.pydis.com/
After pasting your code, save it by clicking the floppy disk icon in the top right, or by typing ctrl + S. After doing that, the URL should change. Copy the URL and post it here so others can see it.
 desert oar
It's better if you post as text, not a screenshot
But I think I understand
What type of object is DLC_time?
Numpy array? List? Something else?
slim drift
desert oar
Numpy array? List? Something else?
its a list
desert oar
ok, so you need to find all elements in the list that overlap one of your pre-defined spans
you should put your pre-defined spans into another list, then you can do 2 for loops
what do the orange spans represent?
slim drift
the orange spans are the the same as the cyan, except manual
desert oar
well i need names for them so i can show example code
"orange" seems like a poor way to describe them 🙂
desert oar
and what is "dlc"?
slim drift
it stands for deeplabcut, a variable made way earlier in the call
if you want I can send the whole code or screenshare?
desert oar
no, that's ok
and you want to know which manual spans overlap which computational spans?
desert oar
and if there's no overlap you want to ignore it?