#data-science-and-ml
1 messages · Page 339 of 1
 prisma mulch
I have plain data for x, y & z axis
Tried matlab surf and matplotlib
neither worked
from mpl_toolkits import mplot3d
import numpy as np
import matplotlib.pyplot as plt

import csv

with open('xaxis.csv') as f:
    nx = list(csv.reader(f, delimiter=','))

with open('yaxis.csv') as g:
    ny = list(csv.reader(g, delimiter=','))

with open('zaxis.csv') as h:
    nz = list(csv.reader(h, delimiter=','))

# Creating dataset

z = np.array(nz[1:], dtype=np.float)
x = np.array(nx[1:], dtype=np.float)
y = np.array(ny[1:], dtype=np.float)
# Creating figyre
fig = plt.figure(figsize =(14, 9))
ax = plt.axes(projection ='3d')

# Creating plot
ax.plot_surface(x, y, z)

# show plot
plt.show()
Here is my code.
 desert oar
Then there's a bound on the residuals, as a function of the predicted value
 burnt delta
would there be a more "colourful" way to visualize data (alternative for matplotlib's pyplot) ?
 velvet thorn
burnt delta
would there be a more "colourful" way to visualize data (alternative for matplot...
velvet thorn
burnt delta
would there be a more "colourful" way to visualize data (alternative for matplot...
is it insufficiently colourful for you?
you can customise it
 buoyant adder
Here's today's 1 min video on Exploratory Data Analysis: https://youtu.be/iGgJ-E2Ou9s

This will give you an intuition about what exploratory data analysis is in Data Science, its necessity, requirements and the different ways to do it with a simple and easy example.
Join this telegram group if you are serious about learning data science and want to avail free organized resources that are added and updated everyday: https://t.me/...
 late shell
Hello, I coded up a simple ANN from scratch to classify MNIST handwritten digits.
The structure of the network is as following:
# input layer = 28 x 28 (784)
# hidden layer1 = 6 (relu)
# hidden layer2 = 10 (relu)
# output layer = 10 (softmax)
I am training for 10 epochs, and although the loss minimizes, but training accuracy stays almost constant at 0.098 through all the epochs. What could the problem be?
Also it turns out my model is only learning only one type of digit, therefore all predictions across X_test contain only one digit, either all 0s or all 5s etc
late shell
loss = self.log_loss(A3)
y_pred = np.argmax(A3, axis=0) == np.argmax(self.Y, axis=0)
accuracy = np.sum(y_pred) / y_pred.shape[0]
A3 is a numpy array of shape (10,m) (10 classes; 0-9) and m data points.
self.Y is also a numpy array of shape (10,m) (one hot encoded)
self.log_loss() is a function that calculates cross entropy loss. Here is the function :
def log_loss(self, y_pred):
   return - np.sum(self.Y * np.log(y_pred)) / y_pred.shape[1]
um,... @lapis sequoia .....
 vale fjord
I've been unable to find anything on the internet, so i guess i'd try to hit here.
Does anyone have resources on recognizing a face, and then checking if its the same face in another picture?
the recognizing part shouldn't be too hard, openCV is quite nice for it, but i simply cannot find any sources on comparing faces
oh maybe https://docs.opencv.org/4.5.0/dc/dc3/tutorial_py_matcher.html is something
 serene scaffold
accuracy = np.sum(y_pred) / y_pred.shape[0] -- is this just accuracy = y_pred.mean(axis=0)
 lapis sequoia
would this be a place to ask more of discrete math question?
so i was reading about vector spaces and sub spaces, while R^2 is a vector space i thought which would be its subspaces.
so if i think about N^2
will it not be a subspace since we can take scalar as any real number, and N^2 will not be closed under scalar multiplication then.
also do we need to have scalar range as R or it can be considered for vector space?
serene scaffold
lapis sequoia
would this be a place to ask more of discrete math question?
you can ask discrete math questions as they relate to a data science problem that you are trying to solve, yes.
this sounds like a linalg question
late shell
serene scaffold
`accuracy = np.sum(y_pred) / y_pred.shape[0]` -- is this just `accuracy = y_pred...
now that you've pointed it out. Yes. but ig I won't need to pass the axis parameter since y_pred is just 1 dimensional array.
lapis sequoia
serene scaffold
this sounds like a linalg question
yes can be considered of linAlg. yep.
velvet thorn
lapis sequoia
so i was reading about vector spaces and sub spaces, while R^2 is a vector space...
and N^2 will not be closed under scalar multiplication then.
I feel like this part is wrong?
because it would require multiplication by a non-natural number
actually
never mind
lapis sequoia
velvet thorn
because it would require multiplication by a non-natural number
yeah since, we need a field for scalar multiplication for vector space and since N is not field, we will consider say R, and because of that N^2 will not be a vector space.
serene scaffold
velvet thorn
pretend I didn't say anything
inb4 I delete those messages
lapis sequoia
yeah even learning. I'm considering finding an example for subspace of R^2, x axis and y axis can be considered as subspace i think(individually ofc).
velvet thorn
lapis sequoia
yeah even learning. I'm considering finding an example for subspace of R^2, x ax...
in general
shouldn't it be the case
that any linear equation relating x and y
will form a subspace in R^2?
with x = 0 and y = 0 being special cases thereof
lapis sequoia
yes yes, it should be. it will be closed under scalar multiplication and vector addition.
lapis sequoia
but one more thing, you missed one thing.
since we need additive identity, we'd require (0..dimension) so for 2d (0,0)
so it will be all the linear equations for which (0,0) is on that line.
velvet thorn
lapis sequoia
so it will be all the linear equations for which (0,0) is on that line.
hold up
let me think about this
yeah
that makes sense
lapis sequoia
but that is about 1d space, there must be 2d sub spaces as well.
for 2d. precisely.
 shut tapir
Hi guys,
does anyone have an idea of make_csv_dataset? It is basically a API provided by tensorflow to help build a tf.Data.Dataset object for a csv file. I am struck here -
'''
import pandas as pd
train = pd.read_csv('sample_data/OSHA_train.csv')
test = pd.read_csv('sample_data/OSHA_test.csv')
train_df = tf.data.experimental.make_csv_dataset(
'sample_data/OSHA_train.csv',batch_size = 32,
label_name="Event type")
train_text = train_df.map(lambda x, y: x)
vectorize_layer.adapt(train_text)
desert oar
@lapis sequoia I believe there is a theorem stating that the only subspaces of R2 are lines through the origin. this should make intuitive sense
shut tapir
I am basically trying to do a text classification by following this tutorial - https://colab.research.google.com/github/tensorflow/docs/blob/master/site/en/tutorials/keras/text_classification.ipynb

But, this tutorial has a text directory, whereas I would want to do it on a csv file. And hence the question
Please help me if you can, guys 🙂
shut tapir
shut tapir
Hi guys,
does anyone have an idea of make_csv_dataset? It is basically a API pr...
This is the question
 boreal wasp
Hi all currently working with dataframe
I'm trying to use split() function to remove all the values
removeVal
but I need to reference the tweet(fulltext) from start and end indexes
how do I go about this?
boreal wasp
@limpid oak
 limpid oak
can you try apply method
so your function will be applied on each row
or check applymap
boreal wasp
I'll try check it out thanks
boreal wasp
limpid oak
https://pandas.pydata.org/docs/reference/api/pandas.DataFrame.applymap.html
thank you
limpid oak
i think it can be possible
lapis sequoia
desert oar
<@456226577798135808> I believe there is a theorem stating that the only subspac...
oh I see, I was not aware of this theorem. Thanks for answer!
a question out of curiosity.
does that also imply that
for R^n space, there would not be any subspace having n dimensions?
(TL;DR: its obvious that we can easily find examples of subspaces having dimensions less than that.)
 mortal dove
R^n is itself a subspace of R^n
Subspaces of R^2 = {0}, lines through the origin and R^2
Subspaces of R^3 = {0}, lines through the origin, planes through the origin and R^3
lapis sequoia
mortal dove
R^n is itself a subspace of R^n
yeah i mean other than that. some other example which would be 2d however not R^2. for example N^2(which i know is not a subspace.)
 late bobcat
I'm getting this error:
Traceback (most recent call last):
  File "main.py", line 12, in <module>
    dqn.fit(env, nb_steps=50000, visualize=False, verbose=1)
  File "keras_rl\lib\site-packages\rl\core.py", line 181, in fit
    if not np.isreal(value):
ValueError: The truth value of an array with more than one element is ambiguous. Use a.any() or a.all()
I've been following a tutorial I found so I have no clue what I did wrong, can anyone help?
serene scaffold
late bobcat
I'm getting this error:
```
Traceback (most recent call last):
File "main.py",...
np.isreal presumably returns a boolean array, and arrays (even boolean ones) can't be used in if statements like that.
so the question is, are you trying to determine if every element of value is a real number, or at least one of them? Please ping me with the answer to this question.
late bobcat
serene scaffold
so the question is, are you trying to determine if *every* element of `value` is...
No? I'm not sure? That code is from the library, I just started with machine learning so I have no clue what's going on
serene scaffold
late bobcat
No? I'm not sure? That code is from the library, I just started with machine lea...
do you know what a real number is, in the mathematical sense of "real number"?
late bobcat
Yes
I followed this tutorial here

GitHub
This code accompanies the YouTube tutorial where we build a custom OpenAI environment for reinforcement learning. - OpenAI-Reinforcement-Learning-with-Custom-Environment/OpenAI Custom Environment ...
serene scaffold
I don't see np.isreal in there.
late bobcat
Yeah, I didn't write np.isreal either, I think it's from the keras library
serene scaffold
serene scaffold
so the question is, are you trying to determine if *every* element of `value` is...
it will not be possible to debug your code unless we know the answer to this question.
serene scaffold
late bobcat
Yeah, I didn't write `np.isreal` either, I think it's from the keras library
you have to know why you are using it.
np.isreal does exactly what it's supposed to do, I'm sure
if you do not know why you are using it, we may have to backtrack a bit.
late bobcat
Uh yeah, I have no clue, I've just replaced their environment class with my own, otherwise, I haven't made any changes
serene scaffold
what is an environment class? I have never heard of this.
late bobcat
It's with OpenAI Gym
their class ShowerEnv(Env)
Ok so, I've just started with RL and I found this tutorial. I replaced their ShowerEnv with my own, but they still have the same functions.
serene scaffold
This must be a subset of the ML ecosystem that I'm not familiar with.
late bobcat
Ah alright, thanks though
serene scaffold
late bobcat
Ah alright, thanks though
sorry I couldn't be of more help 
desert oar
lapis sequoia
oh I see, I was not aware of this theorem. Thanks for answer!
a question out of ...
Yes, I believe the limitation is due to the requirement that it be closed over addition
Another way to think about it is that a vector space has to be the spanning set of at least one basis vector
For a space of n dimensions, a subspace of n dimensions would have to be the spanning set of n basis vectors
But then that's just the set itself no matter what basis vectors you choose
I won't claim that this constitutes a proof, but it might be some helpful intuition
 abstract sinew
Who knew there was so much maths in machine learning 🤷♂️
serene scaffold
abstract sinew
Who knew there was so much maths in machine learning 🤷♂️
🌍 🧑🚀 always have been 
desert oar
abstract sinew
Who knew there was so much maths in machine learning 🤷♂️
If anything it's a shame that people are misled into thinking it's not math all the way at the bottom
You can get pretty far without the math of course
But it really is all math under the hood
lapis sequoia
cool ai stuff
1 + 1 = 2
2 x 2 = 4
3^3 = 27
 royal crest
Thanks.
 errant flame
I'm getting ValueError: Model output "Tensor("dense_5/BiasAdd:0", shape=(?, 6), dtype=float32)" has invalid shape. DQN expects a model that has one dimension for each action, in this case 6. when I run my program on Linux. It works fine on Windows. Is there something I need to install?
lapis sequoia
desert oar
But then that's just the set itself no matter what basis vectors you choose
ah seems like a reasonable intuition! thanks salt!
late shell
Hello, I wrote a function for calculating categorical cross entropy loss and then I compared my function's results with that of sklearn.metrics.log_loss and tf.keras.losses.CategoricalCrossentropy and although sklearn and tf gave similar results my function results in a far different value. Any help plz?
def log_loss(y_pred):
   return - np.sum(y_true * np.log(y_pred)) / m
  # m is no. of data points/samples i.e 10000
y_pred = np.random.normal(10,1, size=(10,10000))
# y_true is an array of shape (10, 10000) one hot encoded i.e (10 classes and 10000 samples)
log_loss(y_pred)
>>> -2.297

sklearn.metrics.log_loss(y_true, y_pred)
>>> 9210.34

cce = tf.keras.losses.CategoricalCrossentropy()
cce(y_true, A3).numpy()
>>> 9215.748
 lyric lynx
ah yes i found my people! hello everyone!
lapis sequoia
Hey ayay!
lapis sequoia
 quiet swallow
with pandas?
quiet swallow
with pandas?
yeah
 iron basalt
late shell
Hello, I wrote a function for calculating categorical cross entropy loss and the...
iron basalt
late shell
Hello, I wrote a function for calculating categorical cross entropy loss and the...
In information theory, the cross-entropy between two probability distributions
    p


{\displaystyle p}
and
    q


{\displaystyle q}
over the same underlying set of events measures the average number of bits needed to identify an event drawn from the set if a coding sche...
p and q must be probability distributions
>>> import numpy as np
>>> y_pred = np.random.normal(10,1, size=(10,10000))
>>> y_pred
array([[ 8.85709153,  9.63925907, 11.52681053, ..., 10.57817194,
         8.72996217, 11.24672125],
       [ 9.40370167,  8.90702439, 10.6050559 , ..., 10.46729535,
         9.42991039, 10.52115852],
       [10.2805726 , 10.07344222, 10.76330865, ..., 10.08182292,
        10.74015556,  9.85257742],
       ...,
       [10.62749226, 10.49784708, 10.37648236, ...,  9.68320663,
        10.69221252, 10.67548446],
       [ 8.54633707, 10.1324822 , 10.06907216, ...,  8.3145403 ,
        10.51090735,  8.22555241],
       [ 9.34955211, 10.79080812, 10.29146825, ...,  9.06062228,
         9.22723942,  9.68045581]])
>>> np.sum(y_pred)
999836.1880853698
>>>
Also, categorical cross-entropy aka softmax loss is something else.
late shell
iron basalt
p and q must be probability distributions
yes they are, I have actually implemented this in my neural network of which the final layer outputs probabilities using the softmax functions but, just for demonstration purpose I used np.random.normal()
late shell
iron basalt
Also, categorical cross-entropy aka softmax loss is something else.
what..?
iron basalt
late shell
yes they are, I have actually implemented this in my neural network of which the...
p and q must each add up to 1
late shell
categorical cross entropy is - sum (p log(q) ), right?
iron basalt
No, it's a softmax layer plus cross-entropy
lapis sequoia
shannon entropy also very similar -sum(plog(p)) or sum(-plog(p)) tho here they are usually probabilities.
late shell
thanks a lot @iron basalt
iron basalt
lapis sequoia
shannon entropy also very similar -sum(plog(p)) or sum(-plog(p)) tho here they a...
It's almost the same yes, p and q versus just p. Cross-entropy measures the expected number of bits (aka Shannons) needed to encode the labels, but given the wrong distribution, q.
The goal of the ML algorithm is to get q to the correct distribution.
(minimize wasted bits / better encoding)
iron basalt
late shell
thanks a lot <@!119925597395877889>
The reason there is the negative in front of the cross-entropy is because the log is suppose to give negative values since its input is values between 0 and 1 (probabilities). Your y_pred has random values not between 0 and 1 and so you ended up with a negative output which is a clear sign that your inputs are wrong.
log_loss(y_pred)
>>> -2.297
 hoary wigeon
feed forward neural network ?
 tender hearth
yes
hoary wigeon
okay
hoary wigeon
tender hearth
yes
can you give it a try on ?
Apply appropriate parameters

Tinker with a real neural network right here in your browser.
and tell me if you get any good result
tender hearth
is this for Google's ML crash course? 😆
take a look at this blog post
this GIF should give a feel for how nonlinearities are modeled with nonlinear activations
http://colah.github.io/posts/2014-03-NN-Manifolds-Topology/img/spiral.1-2.2-2-2-2-2-2.gif
 hoary wigeon
tender hearth
is this for Google's ML crash course? 😆
hoary wigeon
tender hearth
is this for Google's ML crash course? 😆
no its is a tensorflow playground
tender hearth
you can see at the end of the transformation the spirals are linearly separable
 tender hearth
Yep I know
hoary wigeon
tender hearth
you can see at the end of the transformation the spirals are linearly separable
ok
hoary wigeon
tender hearth
this GIF should give a feel for how nonlinearities are modeled with nonlinear ac...
wow
tender hearth
looks like it's modelled it
here

I added the sin X features and increased the network width and depth
it has a hard time learning without those features
hoary wigeon
wow
tender hearth
it converges after 130 epochs
hoary wigeon
i tried it using sinx and siny with learning rate 0.0001
royal crest
isn't something like svm faster
hoary wigeon
cool
hoary wigeon
tender hearth
it converges after 130 epochs
nice
so i need to convert my input in that case ?
tender hearth
just add those features
hoary wigeon
yeah, now i understand

 orchid adder
Hello nice people. Any recommendation for a website or resource that offers plenty of practice exercises about Numpy for beginners?
I'm learning Python primarily to apply it in finance
 desert bear
Hey, I'm doing research on outlier (anomaly) detection algorithms. How can I validate the correctness of each algorithm?
I mean, how can I deduce which algorithm is better for my use?
serene scaffold
@desert bear doing training and testing with different parts of the dataset
 zinc rock
Hello, i have a list of strings and a csv. Can I use pandas so:
For every member of a list, go through each row of the csv/dataframe and use **substring** matching to keep the rows that match the substring
serene scaffold
zinc rock
Hello, i have a list of strings and a csv. Can I use pandas so:
```For every mem...
!docs pandas.Series.str.contains
 arctic wedgeBOT
Series.str.contains(pat, case=True, flags=0, na=None, regex=True)```
Test if pattern or regex is contained within a string of a Series or Index.

Return boolean Series or Index based on whether a given pattern or regex is contained within a string of a Series or Index.I'm not sure exactly what you mean.
a list of substrings. so each row of the series is a list of strings?
zinc rock
Nono sorry
I have a regular csv file but i want to use a list of substrings to find rows that contain any of the substrings in the list
But it seems to fit but i have to use regex?
serene scaffold
keep in mind that the word "substring" expresses a relationship between two strings. Nothing just is a substring on its own.
zinc rock
Hm i might have misworded it them

Stack Overflow
Is there any function that would be the equivalent of a combination of df.isin() and df[col].str.contains()?
For example, say I have the series
s = pd.Series(['cat','hat','dog','fog','pet']), and I
I found this and it seems to fit str contains
serene scaffold
In [1]: pd.Series(['aaa', 'aba', 'caap'])
Out[1]:
0     aaa
1     aba
2    caap
dtype: object

In [2]: s = _

In [3]: s.str.contains('aa', regex=False)
Out[3]:
0     True
1    False
2     True
dtype: bool
yea, but what is my score/measurment?
serene scaffold
desert bear
yea, but what is my score/measurment?
I would need to know more about what you're trying to do to know what performance metrics would be most insightful.
zinc rock
serene scaffold
```py
In [1]: pd.Series(['aaa', 'aba', 'caap'])
Out[1]:
0 aaa
1 aba
2 ...
What if i have a list of [aa, ba, ab] and how do i drop the rows that dont contain them
serene scaffold
@zinc rock is "keep the rows that match the substring" something that you wrote, or your instructor?
zinc rock
I wrote it
serene scaffold
ah okay
In [4]: has_substring = s.str.contains('aa', regex=False)

In [5]: s[has_substring]
Out[5]:
0     aaa
2    caap
dtype: object
Sorry rather new to pandas mostly just used it to read csvs
serene scaffold
zinc rock
Sorry rather new to pandas mostly just used it to read csvs
that's what you do with it, lol
zinc rock
Yea but no data manipulation and stuff
zinc rock
Its pretty neat and the csv module failed me so im here
desert bear
serene scaffold
I would need to know more about what you're trying to do to know what performanc...
I'm having transactional data and I'm trying to find outliers in it. E.g. certain column has a transaction 100x more than the average
serene scaffold
zinc rock
Yea but no data manipulation and stuff
if you have a boolean series, you can use that series to select rows of another series, including the series that the boolean series came from.
with series[...]
zinc rock
Interesting
serene scaffold
desert bear
I'm having transactional data and I'm trying to find outliers in it. E.g. certai...
sounds like you don't need machine learning for this. You can just do df['transaction'] > df['transaction'].mean() * 100
zinc rock
zinc rock
What if i have a list of [aa, ba, ab] and how do i drop the rows that dont conta...
Regarding this i can do s.str.contains(['aa', 'ba', 'ab'] , regex=False)?
Or i require regex for an issue like that
serene scaffold
zinc rock
Regarding this i can do s.str.contains(['aa', 'ba', 'ab'] , regex=False)?
no, ['aa', 'ba', 'ab'] would be the list that the series comes from
desert bear
serene scaffold
sounds like you don't need machine learning for this. You can just do `df['trans...
Yea, but I don't want to apply any strict rules, which would be hard to find in dataset with over 1 million transactions. Rn I'm testing few algorithms that detect outliers for me, but I do not know how to compare them
serene scaffold
are you trying to find all the rows that have 'aa' OR 'ba' OR 'ab'?
lapis sequoia
zinc rock
What if i have a list of [aa, ba, ab] and how do i drop the rows that dont conta...
you could kinda use that stackoverflow question, and make a regex first and just put regex there.
zinc rock
Yes
serene scaffold
r'aa|ba|ab'
serene scaffold
that would be the regular expression
serene scaffold
desert bear
Yea, but I don't want to apply any strict rules, which would be hard to find in ...
I'm skeptical that applying a few rules would be more computationally expensive than training and applying an ML algorithm.
zinc rock
Then after that
Dataframe[str contains with regex]
Sorry im on mobile its so difficult to type
serene scaffold
yes
zinc rock
Thank you ill try it out
 mint palm
 serene scaffold
zinc rock
Then after that
Dataframe[str contains with regex]
serene scaffold
zinc rock
Then after that
Dataframe[str contains with regex]
if it's actually a dataframe and not a series, you would need to replace s with whichever column has the strings.
lapis sequoia
exam? sorry we cant help with that.
zinc rock
This seems so much better than just iterating through every csv cell
serene scaffold
mint palm
We won't help with exams, though in general, some people won't even look at screenshots of text.
zinc rock
serene scaffold
if it's actually a dataframe and not a series, you would need to replace `s` wit...
Oh, whats the difference? If i do pd.read_csv i obtain a dataframe right
serene scaffold
zinc rock
Oh, whats the difference? If i do pd.read_csv i obtain a dataframe right
a dataframe is two-dimensional (it has rows and columns), whereas a series is one-dimensional (though it may have an index)
lapis sequoia
zinc rock
This seems so much better than just iterating through every csv cell
i must add that that also has its own usecase, while pandas would take your whole csv in RAM, you may do want to read line by line when files are pretty pretty pretty large.
mint palm
I already did that question wrongly
serene scaffold
zinc rock
Oh, whats the difference? If i do pd.read_csv i obtain a dataframe right
yes
zinc rock
I dont really understand what you mean by replace s with whichever column has the string
By column you mean the column i want to check?
serene scaffold
zinc rock
I dont really understand what you mean by replace s with whichever column has th...
I would need to know the schema of the dataframe to answer this question.
zinc rock
Im not at a pc but its a csv without a header with an inconsistent number of columns per row
Does that satisfy the question?
serene scaffold
zinc rock
Im not at a pc but its a csv without a header with an inconsistent number of col...
no, unfortunately. Also a dataframe has to have the same number of rows per column.
 serene scaffold
knowing the schema of a dataframe involves knowing the names of each column, the data type of each column, and knowing what each column represents.
zinc rock
Apparently i read a csv pandas just fills the empty columns with nans
serene scaffold
zinc rock
Apparently i read a csv pandas just fills the empty columns with nans
yes, it will probably insert nans to replace the missing data.
lapis sequoia
mint palm
is that? i mean, answer seems like related to ResNet. and question has no..mention of that.
zinc rock
Oh god my problem might be harder than expected then
lapis sequoia
i kinda had similar assumption.
zinc rock
It doesnt have column names and data type is string
Also random number of nans for each row
lapis sequoia
is it even a csv?
zinc rock
I was doing graph stuff and output to csv for ease of viewing
Just need to filter it
Idk if pandas can deal with a badly done csv
lapis sequoia
it is usually nice with good csvs but i reckon csv module would not be a bad one.
zinc rock
I tried csv module and it didnt run properly
serene scaffold
zinc rock
I tried csv module and it didnt run properly
I mean, this just means that you used it incorrectly
zinc rock
It is probably so but when i asked or googled i couldnt find a solution
serene scaffold
in either case, I would need to know the exact input and expected output of what you're doing to be able to advise you further.
zinc rock
Will you be around in a few hours?
serene scaffold
I will be working, so maybe.
lapis sequoia
zinc rock
I tried csv module and it didnt run properly
would you mind sharing code for that?
zinc rock
lapis sequoia
would you mind sharing code for that?
Yes in a few hours, will you be around then?
I can share the csv files too
lapis sequoia
you can ping me, if i will be I'd be happy to help.
desert bear
Hey, I again have a question regarding outlier detection. I have a testing dataset o 130k transactions that are marked as fraudulent or normal. I would like to test few outliers algorithms (LOF, kNN, IsolationForest) on this data. How can I score each of them?
I've heard about the metric AUC which is calculated for LOF with a threshold.
Threshold in LOF is a measure of how contaminated the dataset is. But how come can I evaluate the contamination when I apply this model for let's say 100 million transactions dataset without fraud/normal labels.
My point is how can I score each outlier algorithm? Or how can I choose its parameters so it doesn overfit to the testing 130k dataset?
desert oar
desert bear
Hey, I again have a question regarding outlier detection. I have a testing datas...
If the fraudulent transactions are actually marked, you can use standard 2-class classification techniques
As for how to evaluate contamination, this is the same problem that you have in any classification task, not just outlier detection. You have a relatively small amount of labeled training data and a potentially huge amount of unlabeled data to be classified in real life
Unsupervised outlier/anomaly detection is for when you don't even have a clear definition of which points are outliers
But if you have labeled fraudulent transaction data and you trust the labels are mostly right, you can take advantage of the greater power of supervised classification
As for how to tell if your model is working in production? That's not a solved problem and there are a couple solutions
One thing to do is to monitor your model predictions in production and look for "drift" in the proportions of predicted classes or predicted probabilities
Ironically, unsupervised outlier detection could be one possible technique for identifying drift
https://christophergs.com/machine learning/2020/03/14/how-to-monitor-machine-learning-models/
https://mlinproduction.com/value-propositions-ml-monitoring-system/
https://www.explorium.ai/blog/understanding-and-handling-data-and-concept-drift/
https://medium.com/tech-that-works/monitoring-machine-learning-models-in-production-a932dc388515
https://towardsdatascience.com/production-machine-learning-monitoring-outliers-drift-explainers-statistical-performance-d9b1d02ac158
How to monitor your machine learning models in production.

Machine learning monitoring systems allow teams to reduce risk by continuously ensuring that ML systems are operating effectively.

Explorium
Understand data drift and concept drift, their implications, how we can detect them, and how to overcome their effects.

Medium
After deploying many ML models in production, it became evident that there should be an easy and efficient way to monitor the ML models…
Medium
A practical deep dive on production monitoring architectures for machine learning at scale using real-time metrics, outlier detectors…
Sorry for the embed spam, apparently I can't remove them on mobile
desert bear
desert oar
If the fraudulent transactions are actually marked, you can use standard 2-class...
Thanks, that was helpful. But I would like to focus on supervised approaches since all the data that I will detect outliers are unlabeled. Is it as easy as inserting the data to the (e.g.) kNN model and add some labels for transactions that are considered as outliers? I don't mean to detect fraudulent transactions, just outliers
desert oar
desert bear
Thanks, that was helpful. But I would like to focus on supervised approaches sin...
I'm not sure that makes sense. If we had labeled data in production, we wouldn't need machine learning at all
Oh, I see
Yes, if you don't have pre-labeled outliers then you need unsupervised algorithms
desert bear
Yes, exactly
desert oar
In my experience with building unsupervised algorithms, I end up gradually building up a labeled data set anyway for validating that the unsupervised algorithm is working well
I don't know if there are more principled approaches
Let me do a quick search
desert bear
desert oar
In my experience with building unsupervised algorithms, I end up gradually build...
Yes, that's what I'm trying to make. I have 130k labeled data for validation, but I will use this outliers detectors on unlabeled data
I just don't know on how to compare performance of this algorithms
Is it the simple metrics like precision, recall
desert oar
desert bear
Yes, that's what I'm trying to make. I have 130k labeled data for validation, bu...
But that means you have 130k labeled data points that you can train a supervised classifier on... right?
Or are the labels not what you are trying to ultimately predict? In which case they aren't labels, they're just another feature
desert bear
desert oar
But that means you have 130k labeled data points that you can train a supervised...
Well, yea but this is little data when comparing with 1 million unlabeled one I get each day
desert oar
That's fine, that's a big enough data set to build a serious model
What you might want to do is consider using both approaches in parallel
desert bear
well at this point, I don't know If I need a validation set if i'm not looking for fraudulent transactions but outliers in general
desert oar
And that's what I'm trying to clarify, if those data points are labeled with something that isn't what you're looking for, then effectively they aren't labeled
desert bear
Yes, you might be right
So I need to somehow test performance of unsupervised algorithms
desert oar
Let me get to a PC and I'll elaborate
desert bear
That would be great, thanks
buoyant adder
Here's today's 1 min video on Feature Engineering:
https://youtu.be/_S1QXtMjx4k

This will give you an intuition about what feature engineering is in Data Science, its necessity, requirements and the different ways to do it with a simple and easy example.
Join this telegram group if you are serious about learning data science and want to avail free organized resources that are added and updated everyday: https://t.me/analyt...
desert oar
I won't actually be available too much today to discuss, but the one I think is important to realize is that most outlier detection algorithms work by constructing some kind of "distance" between an individual point and "the rest of the data", which conceptually groups the data into two classes: data drawn from the correct/typical generating process(es), and data drawn from "other" data generating process(es)
Personally I don't have experience validating outlier detection techniques other than manually eyeballing a lot of examples every once in a while
But you could use the same "drift" principle, to see if the distribution of found outliers or outlier scores is changing over time
It also begs the question: what, in terms of your domain, constitutes an outlier?
That is: what exactly are you looking for? What are you hoping to achieve/find?
Also: validation by simulation is an essential technique in data science
Simulate a dataset with outliers and make sure that your outlier detection system works on the simulated data
If it doesn't work on simulated data, then it probably won't work on real data either
desert bear
desert oar
I won't actually be available too much today to discuss, but the one I think is ...
Thank you for your time. I think I need to make a one step back and ask myself the question you proposed. What am I lookin for?. What is an outlier?.
Well in terms of transactions data that would be, e.g. extremely high sell value, but it is hard to manually set these static rules for dataset with 200 features.
desert oar
desert bear
Thank you for your time. I think I need to make a one step back and ask myself t...
I think that's a wise decision. Starting with heuristics is always a good strategy imo
Do you have experts who already do this by hand? Ask them
Hell, pay them to label 10k items and build a model to encapsulate their expertise
desert bear
I think I will start by analyzing some transactions' features. Make a histogram of each feature values and set static rules which are considered outliners. But outliers can also be dependent on multiple features. Maybe this way I can create a validation sets for my algorithms
desert bear
desert oar
Do you have experts who already do this by hand? Ask them
Unfortunately no. No one manually checks if a transaction is an outlier or not. Some people only check if the transaction is fraudulent, but it's not helpful for me.
desert oar
desert bear
I think I will start by analyzing some transactions' features. Make a histogram ...
I think in this case the exploratory data analysis will also help you come up with a better idea of what exactly an outlier consists of, intuitively
So in this particular case you you are looking for unusually valuable items in some kind of flow of transactions?
I was curious what you said about "high sell value"
desert bear
desert oar
So in this particular case you you are looking for unusually valuable items in s...
Yes
desert oar
And there is no established formula or pricing model for these things?
If you were manually combing through a data set, how would you know which items were the outliers?
desert bear
Nope, these are transactions from businesses like for e.g. restaurants
Histogram of transaction values

So for e.g. this are considered outliers
desert oar
How do you know that bump clustered around 100 isn't just a low-volume business selling expensive products?
What if they're a high-end custom furniture maker or a high-end audio store
desert bear
That's true
desert oar
And what if the tail at the left is a chain id newsstands?
Your homework in this case, in addition to refining your ideas about what exactly you're looking for, is to think about how you could use your domain knowledge to account for as much of the "non-outlier" behavior as possible in the data generating process
For example maybe you need to fit some kind of hierarchical bayesian model, grouping by the type of business and using the bayesian prior for partial pooling
Are you looking for evidence of money laundering
desert bear
Yea I was thinking about grouping types of businesses. This certainly is more complicated that I thought it would be
I will analyze data from wider timeframe and also grouped by the type of business
desert oar
Depending on the time frame you might also need to account for market conditions shifting over time, particularly if your data includes dates after late 2019, because Covid fucked everything up in pretty much every industry
Similarly if the data goes back to 2008-2009 due to the Great Recession
desert bear
That is also true. I am grateful for the tips and dependencies you provided me with.
desert oar
Good luck! I'd be very interested to hear how this turns out
quiet swallow
lapis sequoia
yeah
hey sorry for late reply, is there a way to delete rows if 'item_id' column contains only number?
 gaunt marsh
Hi, am I at the right place for question regarding mathplotlib?
quiet swallow
like the column could contain '123' or '123a'
gaunt marsh
I'm trying to make a horizontal bar chart (mathplotlib).
I have a 2D-Array (tuple_list) which looks like this:
[[200, 200, 215], [161, 162, 172], [72, 45, 31], [116, 75, 33], [182, 182, 195], [103, 63, 26], [151, 152, 156], [211, 211, 228], [190, 191, 204], [98, 75, 49], [93, 51, 23], [135, 135, 135], [117, 107, 84], [163, 99, 35], [172, 173, 184], [172, 173, 184]]
I want to put these values on the Y-Axis and colorize the bars with these values. The X-Axis should show me the amount of identical values/subarrays.
Is this possible? I couldn't do it.
I made this in Ruby and this is what it should look like later
 desert oar
gaunt marsh
I'm trying to make a horizontal bar chart (mathplotlib).
I have a 2D-Array (tupl...
desert oar
gaunt marsh
I'm trying to make a horizontal bar chart (mathplotlib).
I have a 2D-Array (tupl...
What did you try?
That said, your description of the problem doesn't explain how you intend to turn that data into bar positions and heights
gaunt marsh
desert oar
What did you try?
plt.barh(Color,Quantity, color=[tuple_list])
quiet swallow
@desert oar you know pandas?
desert oar
quiet swallow
<@!389497659087650836> you know pandas?
Yes but I can't guarantee an answer, you should just ask your question here and wait for somebody to respond
desert oar
gaunt marsh
plt.barh(Color,Quantity, color=[tuple_list])
Do you want those to be RGB colors?
Those aren't tuples
That's a list of lists
gaunt marsh
desert oar
That said, your description of the problem doesn't explain how you intend to tur...
Yes! The 2D Array I showed in my question are the RGB values and the values of the y axis at the same time
desert oar
Wdym values of the y axis?
How do you expect to turn a three dimensional RGB color into a one dimensional position on the Y axis?
Or do you just want to use the position in the list?
gaunt marsh
I want a histogram which shows me which color is how many times included. I read in textfiles for that
desert oar
I am going to be pedantic and inform you that this isn't a histogram 🙂
gaunt marsh
I have about 700.000 values and some color values appear more than once and I want to see how often they appear and which color it is
desert oar
You will want to manually compute the number of times each rgb tuple appears, although beware that floating point precision could pose issues for exact equality of tuples of floats
Oh these are ints nvm
you will want to convert this list of lists to a list of tuples
Then use something like collections.Counter to count each one
gaunt marsh
this is what it should look like

 pine wolf
does np.unique have an axis parameter
gaunt marsh
Okay, good to know that there is something like a tuple collection for it
desert oar
gaunt marsh
Okay, good to know that there is something like a tuple collection for it
it's not specifically for tuples
quiet swallow
I have these kinds of data in csv format about 500k, how would I go on and delete rows with string containing only number in 'item_id' . As in the photo deleting first row.
 desert oar
!d g collections.Counter
arctic wedgeBOT
class collections.Counter([iterable-or-mapping])```
A [`Counter`](https://docs.python.org/3.10/library/collections.html#collections.Counter "collections.Counter") is a [`dict`](https://docs.python.org/3.10/library/stdtypes.html#dict "dict") subclass for counting hashable objects. It is a collection where elements are stored as dictionary keys and their counts are stored as dictionary values. Counts are allowed to be any integer value including zero or negative counts. The [`Counter`](https://docs.python.org/3.10/library/collections.html#collections.Counter "collections.Counter") class is similar to bags or multisets in other languages.

Elements are counted from an *iterable* or initialized from another *mapping* (or counter):

```py
>>> c = Counter()                           # a new, empty counter
>>> c = Counter('gallahad')                 # a new counter from an iterable
>>> c = Counter({'red': 4, 'blue': 2})      # a new counter from a mapping
>>> c = Counter(cats=4, dogs=8)             # a new counter from keyword args
@desert oar any idea?
pine wolf
In [49]: colors = np.array([
    ...:     [1, 2, 3],
    ...:     [1, 2, 3],
    ...:     [4, 5, 6],
    ...:     [6, 2, 3],
    ...:     [4, 5, 6],
    ...: ])

In [50]: np.unique(colors, axis=0, return_counts=True)
Out[50]:
(array([[1, 2, 3],
        [4, 5, 6],
        [6, 2, 3]]),
 array([2, 2, 1], dtype=int64))
@gaunt marsh
from collections.abc import Counter

import maptlotlib.pyplot as plt
colors = [[200, 200, 215], [161, 162, 172], [72, 45, 31], [116, 75, 33], [182, 182, 195], [103, 63, 26], [151, 152, 156], [211, 211, 228], [190, 191, 204], [98, 75, 49], [93, 51, 23], [135, 135, 135], [117, 107, 84], [163, 99, 35], [172, 173, 184], [172, 173, 184]]

# Convert the lists to tuples
colors = list(map(tuple, colors))

# Count each unique RGB triple
color_counts = Counter(colors)

# Arbitrarily assign a numerical value to each RGB triple,
# for use as the y axis positions
color_ids = list(range(len(color_counts))

plt.barh(
    color_ids,
    list(color_counts.values()),
    color=list(color_couns.keys())
)
something like that, anyway
you need to use a list of tuples and not a list of lists for 2 reasons:
- because
collections.Countercan only count "hashable" things, and lists are not hashable, but tuples are hashable - this is because lists can be mutated, which is incompatible with the idea of using them as a key in a lookup table - matplotlib requires that a list of rgb colors be provided as a list of tuples (i think)
it's also generally a better data structure for a "sequence of fixed-size records"
tldr don't overthink it, use the basic tools available to you in the language
gaunt marsh
desert oar
it's also generally a better data structure for a "sequence of fixed-size record...
that's a very good point
desert oar
there's no special magic formula for things in matplotlib, it's just figuring out how to get the data into the basic format expected by matplotlib plotting methods
for higher-level abstraction you might want to use seaborn, but even that won't really help you in this particular case (i think)
oh it's from collections import Counter, not collections.abc
i'm so used to using the latter for my own stupid purposes that i forgot you don't always use it 🙂
desert oar
pine wolf
```py
In [49]: colors = np.array([
...: [1, 2, 3],
...: [1, 2, 3...
numpy is really damn useful
pine wolf
no doubt
matplotlib is the most confusing library ever written, tbh
if i could nuke any popular python library, that'd be the one
desert oar
quiet swallow
I have these kinds of data in csv format about 500k, how would I go on and delet...
option 1
has_number_id = df['item_id'].str.isdigit()
df = df.loc[~has_number_id]

# use this if you need to further mutate the dataframe,
# to avoid "setting copy on slice" warnings
df = df.copy()
option 2
has_number_id = df['item_id'].str.isdigit()
df.drop(df.index[has_number_id], inplace=True)
honestly, it's the docs
they've gotten a lot better but
too much information is buried deep in the api reference
their attempts at writing user guides are atrociously convoluted
it's actually worse than pandas i think
(although both have improved significantly)
gaunt marsh
@desert oar I'm getting this:
ImportError: cannot import name 'Counter' from 'collections.abc' (/usr/local/Cellar/python@3.9/3.9.7/Frameworks/Python.framework/Versions/3.9/lib/python3.9/collections/abc.py)
desert oar
@gaunt marsh i already explained this. read my messages
also don't copy and paste untested code without at least attempting to understand it
serene scaffold
desert oar
it's actually worse than pandas i think
I've never found the pandas docs that confusing, but I hadn't used it before this year, basically.
I can't wrap my head around matplotlib, though
desert oar
it's confusing if you are trying to learn it by reading the docs
and it's also confusing if you aren't already familiar with data frames from R
i should start writing my own guides to these things
serene scaffold
yessssssssssss
desert oar
git, pandas, matplotlib
serene scaffold

desert oar
i feel like i have an increasingly clear vision of how these things could/should be explained
serene scaffold
we can put them on our website
desert oar
i could use you people to beta test them 🙂
serene scaffold
I volunteer, yes.
desert oar
i really shouldn't be online at all today, it's my day off
but maybe i'll start jotting down some outline notes
good writing is really hard
serene scaffold
yes
desert oar
this is the kind of writing project that could take a year or more
pine wolf
i feel like better plotting libraries are emerging, but i just haven't used them
desert oar
seaborn is definitely easier for data analysis type of visualization
inspired by grammar of graphics
pine wolf
i think at this point it's easier for me to manually create graphics
desert oar
i actually think matplotlib's model (construct an abstract representation of the data to be plotted) is way better than base R (immediately drop data points onto a plotting area with no hope of inspecting what's already been plotted)
at least for constructing non-trivial plots
what are you doing in mpl that's giving you trouble?
the R model is only good if you need pixel-level control
otherwise it's a fucking pain
and the defaults are ugly
pine wolf
nothing, that's why it gives me trouble when i use it, because i don't remember how and i have to look it up again -- it's not intuitive to me
desert oar
do you know about the figure/axis/artist system?
pine wolf
nope
desert oar
(also: matplotlib has a lot of glaring gaps in the api, it's like git in that the basic data model is pretty nice and elegant, but the apis are shit and confusing)
in most cases, a matplotlib "plot" consists of a single figure which contains one or more "axes" objects. the figure is the outer container for the plot, and the axes object is what actually has the data points plotted in it
quiet swallow
thanks @desert oar for the help, much appreciated
gaunt marsh
Sorry, didn't see the notification about the newer messages while being in my IDE.
ValueError: RGBA values should be within 0-1 range
What does this mean? Isn't the range between 0 and 255?
pine wolf
looks like you have a normalized color thing
desert oar
gaunt marsh
Sorry, didn't see the notification about the newer messages while being in my ID...
convince yourself that [0, 255] is isomorphic to [0, 1], and figure out how to transform the former into the latter
hint: it's a linear transformation, i.e. a scalar shift and a scalar multiplication
 lunar bluff
hey i am new to programming and i aspire to be a data analyst can anyone guide me
pine wolf
and the shift is 0
gaunt marsh
desert oar
hint: it's a linear transformation, i.e. a scalar shift and a scalar multiplicat...
So I guess I have to divide through 255 to get a value between 0 and 1
desert oar
the following are equivalent:
# Create a new Figure containing 1 Axes object.
# "Subplots" are some kind of legacy terminology.
fig, axes = plt.subplots()

# Plot some data on the Axes.
axes.plot(x, y, 'red')

# Show the plot
plt.show()
# Combine the first 3 steps above
plt.plot(x, y, 'red')

# Show the plot
plt.show()
yep!
again, beware the float comparison thing
i recommend doing the Counter stuff using the integer values
and only convert to 0-1 for the colors= parameter
rgbs = [ ... ]

rgb_counter = Counter(rgbs)
rgb_values = list(rgb_counter.keys())
rgb_counts = list(rgb_counter.values())
rgb_ids = list(range(len(rgb_counter))

plt.barh(
    rgb_ids,
    rgb_counts,
    color=[(r/255, g/255, b/255) for r,g,b in rgb_values]
)
isn't there a histogram function
desert oar
yes but this isn't a histogram
maybe plt.hist works with categorical data though as a convenience
pine wolf
oh, the bins aren't really ordered
desert oar
seaborn i believe has a bar plot method that also counts the data for you
yeah and the bin widths are fixed at "1"
pine wolf
yeah, that's weird
desert oar
histograms are kind of definitionally binning of continuous data
pine wolf
well, i don't really use them for continuous data ever, but it is ordered
maybe contiguous, not continuous
maybe that's what you meant, i was immediately thinking analysis
gaunt marsh
@desert oar Hm, it works, but it crashes. The performance is bad if you have over 700.000 values. Is there any difference if I would use some kind of real histogram instead of a bar chart?
desert oar
no, and i don't know what you expected
700k values, most of which are unique
you really want to plot 700 thousand bars??
boreal wasp
Hi I get an error when trying to run this code...
 gaunt marsh
Hmm. I wrote this in Ruby and the performance was bad, too. I cut out the unique values and it wasn't much better.
I think the performane will stay bad in Python, too
boreal wasp
This is the error

affected function name is "cleanVal"
can sb help check what is wrong?
desert oar
boreal wasp
Hi I get an error when trying to run this code...
cleanVal is not a function, you constructed a list of values
python doesn't have any notion of capturing expressions for use later
[word for ...] is a list comprehension -- its value is actually is the result of a computation
desert oar
gaunt marsh
Hmm. I wrote this in Ruby and the performance was bad, too. I cut out the unique...
cut out the unique values in python too. i really don't know what you expect trying to plot 700k unique bars. that would be a huge image
gaunt marsh
desert oar
you really want to plot 700 thousand bars??
Yes, that's the exercise for me
desert oar
how do you expect that to look?
do you want a 30-page pdf of bars?
rgbs = [ ... ]

rgb_counter_all = Counter(rgbs)
rgb_counter_dupes = {rgb: count for rgb, count in rgb_counter_all if count > 1}
rgb_values = list(rgb_counter_dupes.keys())
rgb_counts = list(rgb_counter_dupes.values())
rgb_ids = list(range(len(rgb_counter_dupes))

plt.barh(
    rgb_ids,
    rgb_counts,
    color=[(r/255, g/255, b/255) for r,g,b in rgb_values]
)
to be honest, yes. I expected a vertically scrollable chart.
boreal wasp
desert oar
`[word for ...]` is a list comprehension -- its value is actually is the result ...
hmm...is there any way that I can remove values from a text in dataframe?
desert oar
you might want to sort by count or something?
desert oar
boreal wasp
hmm...is there any way that I can remove values from a text in dataframe?
explain in words what you're trying to do
it sounds like you need to review your python fundamentals @boreal wasp
it looks like the fact that your code even got as far as it did is entirely coincidence and/or you randomly trying things without understanding what they meant
rgbs = [ ... ]

rgb_counter_all = Counter(rgbs)
rgb_dupes_sorted = sorted(
    ((rgb, count) for rgb, count in rgb_counter_all if count > 1),
    key=lambda pair: pair[1]
)
rgb_values = list(rgb_dupes_sorted.keys())
rgb_counts = list(rgb_dupes_sorted.values())
rgb_ids = list(range(len(rgb_dupes_sorted))

plt.barh(
    rgb_ids,
    rgb_counts,
    color=[(r/255, g/255, b/255) for r,g,b in rgb_values]
)
yeah I'm still learning
desert oar
boreal wasp
yeah I'm still learning
if you can post your code using a code block and not a screenshot, i can at least try to interpret and translate your code to something more plausibly correct
!code
arctic wedgeBOT
Here's how to format Python code on Discord:
```py
print('Hello world!')
```
These are backticks, not quotes. Check this out if you can't find the backtick key.
boreal wasp
from datetime import datetime
import matplotlib.pyplot as plt


## Read
tweets = cur.execute('SELECT e.tweet_id, t.full_text, e.value, e.start_index, e.end_index FROM Entities e join Tweets t on t.id = e.tweet_id')

df =pd.DataFrame(tweets, columns=['Tweet ID', 'Full Text', 'Values', 'Start Index', 'End Index'])
text = df['Full Text'].to_string()
removeVal = df['Values']
my_sq = [word for word in text.split() if word not in removeVal]
startIndex = df['Start Index']
endIndex = df['End Index']
Indices = df[['Start Index','End Index','Tweet ID', 'Full Text']]
Indices = Indices.apply(my_sq, axis=1)

print(Indices)
@desert oar
desert oar
side note: you can get column names from a sql cursor
what is cur? you might also not be using your database library correctly
can you show how you get the cur thing?
boreal wasp
yes, I did use that method. but I need to find the fullText using start and end indices
cur is database connection
desert oar
don't call it "cur" then, that's usually short for "cursor" which this is not
are you using sqlite3?
boreal wasp
yup
desert oar
people usually call it "con" or "conn" or "db"
boreal wasp
import pandas as pd
from datetime import datetime
import matplotlib.pyplot as plt

conn = sqlite3.connect('tweets.sqlite')
cur = conn.cursor()

## Read
tweets = cur.execute('SELECT e.tweet_id, t.full_text, e.value, e.start_index, e.end_index FROM Entities e join Tweets t on t.id = e.tweet_id')
This is the top part
desert oar
ok, so it is a cursor
usually you don't need to manually create cursors with sqlite3
why are you using to_string on the full text column?
boreal wasp
to use the split()
boreal wasp
just experimenting
desert oar
shouldn't it already be a string?
does that code actually work?
oh it is a valid series method
desert oar
well it very very definitely doesn't do what you want
no it doesn't
it returns a single string representation of the entire series
i.e. not at all what you're looking for
!d pandas.Series.to_string
arctic wedgeBOT
Series.to_string(buf=None, na_rep='NaN', float_format=None, header=True, index=True, length=False, dtype=False, name=False, max_rows=None, min_rows=None)```
Render a string representation of the Series.and what exactly are you trying to do with this?
you want to remove the words in df['Values'] from each corresponding tweet?
and you want each tweet as a list of non-removed words?
and what exactly is in df['Values']? is it a string with commas separating words? is it stored as json in sqlite? something else?
boreal wasp
I want to remove the [df['Values'] from the df['Full Text'] but within start and end index
boreal wasp
desert oar
you want to remove the words in `df['Values']` from each corresponding tweet?
yes

for values
desert oar
each Values element has exactly one value to remove?
boreal wasp
seems like it
desert oar
seems like it?
is this a homework assignment of some kind? where'd you get this data?
boreal wasp
my friend's past IT school questions I'm just trying
desert oar
anyway my recommendation is to write a function that:
- has 1 parameter, a
Series, representing each row of the dataframe - extracts all the required values from said row using
.at[] - does the data processing using basic python operations:
.split, list comprehension, etc. - returns the data either as a joined string or as a list of words, as the problem requires
and then use .apply(..., axis=1) to apply the function to every row of the dataframe
i'll give you the answer i would personally use, trusting that you won't blindly copy and paste:
import sqlite3
from datetime import datetime

import pandas as pd
import matplotlib.pyplot as plt

conn = sqlite3.connect('tweets.sqlite')

tweets_cursor = db.execute('''
SELECT e.tweet_id, t.full_text, e.value, e.start_index, e.end_index
FROM Entities e
  JOIN Tweets t ON t.id = e.tweet_id
''')

# If you wanted to get the column names from the db; optional
#tweets_colnames = [desc[0] for desc in tweets_cursor.description]
tweets_colnames = ['Tweet ID', 'Full Text', 'Values', 'Start Index', 'End Index']

tweets = pd.DataFrame(tweets_cursor.fetchall(), columns=tweets_colnames)

def remove_values(df_row):
    full_text = df_row.at['Full Text']
    remove_vals = df_row.at['Values']
    start_index = df_row.at['Start Index']
    end_index = df_row.at['End Index']
    words = full_text.split()
    return [
        word for idx, word
        in enumerate(words)
        if not (
            word != remove_vals and
            start_index <= idx <= end_index
        )
    ]

words_processed = df.apply(remove_values, axis=1)
basically, i'm not using any special pandas features at all
this is using regular python stuff, but wrapping it up in pandas niceties with .apply
in this example, words_processed will be a Series containing lists of strings
boreal wasp
I see alright I'll check on this and try to understand
thank you for your time explaining
desert oar
i'm happy to help with specific questions if you have any, although i'll have to log off soon
desert oar
@pine wolf i think browsing through https://matplotlib.org/stable/api/index.html, https://matplotlib.org/stable/api/artist_api.html#matplotlib.artist.Artist, https://matplotlib.org/stable/api/figure_api.html#matplotlib.figure.Figure, and https://matplotlib.org/stable/api/axes_api.html#matplotlib.axes.Axes is where you'll find mpl enlightenment
there's no single top-level explanation of the design, but the core stuff is scattered across those pages
what is very annoying is that the docs never warn you that blitting doesn't work on the macos animation backend, and that apparently getting the other backends installed is not trivial on a mac
i spent so long trying to figure out why my animations didn't work in that red blood cell diffusion simulation we worked on
pine wolf
i think i never got animations with matplotlib, it's easier for me to just manually stitch together pngs are make something interactive
 dull glacier
Hello everyone, I am working on a project which involves text similarity between requirements. I was using RoBERTa and Universal Sentence Encoder (pretrained and then fine-tuned on my requirements) however the performance is pretty low as the requirements are technical requirements which use a lot of acronyms from my field. After using acronym expansion I got a bit better results however it's still nowhere near close to where I want to get it. I was wondering what other features I can extract from my dataset to make it better. Anyone got any ideas? Thanks
iron basalt
pine wolf
i think i never got animations with matplotlib, it's easier for me to just manua...
I have been mostly using https://github.com/hoffstadt/DearPyGui instead of matplotlib since I often want interaction and matplotlib's API is really ugly.

GitHub
Dear PyGui: A fast and powerful Graphical User Interface Toolkit for Python with minimal dependencies - GitHub - hoffstadt/DearPyGui: Dear PyGui: A fast and powerful Graphical User Interface Toolki...
(Also for streamed data real-time)
Despite being an entire GUI framework it's really easy to just plot something if that's all you want: https://github.com/hoffstadt/DearPyGui/wiki/Plots
GitHub
Dear PyGui: A fast and powerful Graphical User Interface Toolkit for Python with minimal dependencies - Plots · hoffstadt/DearPyGui Wiki
desert oar
pine wolf
i think i never got animations with matplotlib, it's easier for me to just manua...
The animation api is fussy and the docs are really not good
That's another writeup i could do, now that i figured it out once (mostly)
You can also produce animations by clearing the axes object and drawing new data
Or yeah emit png's and stitch together
pine wolf
i typically just draw on numpy arrays and save images now a days
this makes the most sense to me
 alpine pecan
how do i change this? in matplotlib, like i want it to start from the graph itself
 desert oar
@alpine pecan matplotlib by default will "autoscale" -- increase the size of the axes to fit the plot with 5% extra padding. this extra padding is called the "margin" in matplotlib terminology. your options are: 1) change the size of the margin, or 2) set the x and y axes and disable autoscaling.
see https://matplotlib.org/stable/tutorials/intermediate/autoscale.html for both options
alpine pecan
desert oar
<@!508910830549598209> matplotlib by default will "autoscale" -- increase the si...
aaah yes, thank you so much
 blissful furnace
I have a collection of items with different prices and I want to display how many items exist in a particular price range
Each collection can have wildly different price ranges
Is there an easy way to do this?
blissful furnace
So i have a data sample like this
{
  '225': 5,
  '30': 130,
  '1000': 2
}
So i have 5 items that cost 225 and 130 items that cost 30
Real samples are much bigger, in the thousands
I want to display them, either via text or some plot
  0-49.9999: 5 items,
  50-99.9999: 15 items,
Something like that
and i want the price range to be reasonable
some collections contain only very cheap items, other contain really expensive ones, so using a fixed price range would be really bad
because i may get something like
0-49.9999: all items,
50-99.9999: 0,
100-149.9999: 0,
i hope that answers your question
desert oar
do you have pre-defined ranges? do you want these in a series or dataframe or something? or you really just want to print them?
( i'm not sure this is a data science question 🙂 )
what's this for? how did you end up getting these prices as strings?
price_counts = {
  '225': 5,
  '30': 130,
  '1000': 2
}

price_counts_numeric = {
    int(price): count
    for price, count
    in price_counts.items()
}

range_cuts = [
    0, 50, 100, 150
]

price_range_counts = {}
for lo, hi in zip(range_cuts[:-1], range_cuts[1:]):
    range_label = f'{lo:,}-{hi:,}'
    price_range_counts[range_label] = 0
    for price, count in price_counts_numeric.items():
        if lo <= price < hi:
            price_range_counts[range_label] += count
    print(range_label, price_range_counts[range_label])
you can use pandas.qcut https://pandas.pydata.org/pandas-docs/stable/reference/api/pandas.qcut.html or something like that to make nice ranges using e.g. quintiles
 prime hearth
hello i would liek to please ask, does anyone know exactly how the algo or math works behind trasnforming an image to size 28 by 28?
img1 = []
        img2=[]
        for row in range(28):
            for col in range(28):
                img1.append(img_list[row * 28 + col]) # how does this work??
            img2.append(img1)
            img = []
        return img2
you might want to use a different data structure, as it would be one method call if you used a vectorised data structure like an array.
prime hearth
yeah sorry this was just for practice
im trying to go in deep into learning neural networks
serene scaffold
you wouldn't write code like this for a project that involves neural networks
blissful furnace
desert oar
do you have pre-defined ranges? do you want these in a series or dataframe or so...
No i don't want pre-defined ranges, i want an algorithm to choose suitable ones. I also don't want overfitting, ig there is only one item that is 1000+ in price and all other items less than 100, then i only want a 100+ range
prime hearth
oh okay, i was just learning how to flatten an image
but. for vectorize form it same thing?
blissful furnace
desert oar
you can use `pandas.qcut` https://pandas.pydata.org/pandas-docs/stable/reference...
Will check this out
serene scaffold
prime hearth
but. for vectorize form it same thing?
if the image is composed of just black and white pixels, you would do something like image.reshape((28, 28)), though it would depend on the current arrangement of pixels
prime hearth
oh okay, so i dont need to know how that formula works
that row * 28 + col
it not important?
serene scaffold
you would need to know the current arrangement of the pixels, as compared to what you want the result to be
In [1]: np.repeat(np.arange(4), 3)
Out[1]: array([0, 0, 0, 1, 1, 1, 2, 2, 2, 3, 3, 3])

In [2]: arr = _

In [3]: arr.reshape((2, 6))
Out[3]:
array([[0, 0, 0, 1, 1, 1],
       [2, 2, 2, 3, 3, 3]])

In [4]: arr.reshape((3, 4))
Out[4]:
array([[0, 0, 0, 1],
       [1, 1, 2, 2],
       [2, 3, 3, 3]])

In [5]: arr.reshape((1, 12))
Out[5]: array([[0, 0, 0, 1, 1, 1, 2, 2, 2, 3, 3, 3]])

In [8]: arr.reshape((2, 2, 3))
Out[8]:
array([[[0, 0, 0],
        [1, 1, 1]],

       [[2, 2, 2],
        [3, 3, 3]]])
Reshaping the array partitions all the elements. If you look at these examples, you can see how that partitioning is being done.
Also this one
In [9]: arr.reshape((2, 3, 2))
Out[9]:
array([[[0, 0],
        [0, 1],
        [1, 1]],

       [[2, 2],
        [2, 3],
        [3, 3]]])
Is there a way to give names to numpy array columns without the overhead of "struct arrays"
I guess you could keep them in a dict
zinc rock
@lapis sequoia hi, please ping when you're around
errant flame
I've written a environment for reinforced learning for a grid based game and let it run for a day. However, it doesn't seem to make any progress anymore and only move forward. How could I get it out of this? Or is 1 day just not enough?
lapis sequoia
zinc rock
<@456226577798135808> hi, please ping when you're around
yeah I'm there, bit running outta time but please go on. ping me when up.
zinc rock
no worries issue is fixed
apparently it was cursed for loop stuff
@lapis sequoia
thanks though!
lapis sequoia
oh i see! great!!
 wanton spear
hey i want to train ocr model using images for easyocr but in their tutorial only way i see is training using fontfiles. anyone knows how do i train a model using images ?
 final light
Hi everybody!
I trying to concatenate two dataframes in pandas and I want the data from columns C and D to be shared on the same rows.
Been at this for a while now but only end up with NaN values like this.
Any help would be much appreciated
 arctic wedgeBOT
DataFrame.join(other, on=None, how='left', lsuffix='', rsuffix='', sort=False)```
Join columns of another DataFrame.

Join columns with other DataFrame either on index or on a key column. Efficiently join multiple DataFrame objects by index at once by passing a list.i thought concat was for something else
final light
I've tried join, merge, concat and append in lots of different way but still aint managing to get it right :/
velvet thorn
final light
Hi everybody!
I trying to concatenate two dataframes in pandas and I want the da...
uh
you need to give more info
without more I'd imagine you want pd.concat([df1, df2], axis=1)
final light
These are just example df's, but main principle is the same.

I've tried changing axis also, still the same that it fills up with NaN values
def read_class(class_name):
    absfilepath = "C:\\Users\\Patric\\OneDrive\\Dokument\\Skolarbeten\\Årskurs 3\\DT374B - \
Machine Learning and Data Acquisition\\Labs\\Data gathering\\"
    total_fp = absfilepath+class_name
    data1, data2 = [],[]

    for i in range(1,4):
        data1.append(pd.read_csv(total_fp+str(i)+'\\Accelerometer.csv', usecols=[2,3,4],\
                               names=['ax', 'ay', 'az'], header=None).iloc[1:,::].astype('float64'))
    for i in range(1,4):
        data2.append(pd.read_csv(total_fp+str(i)+'\\Compass.csv', usecols=[2,3,4],\
                               names=['mx', 'my', 'mz'], header=None).iloc[1:,::].astype('float64'))


    x = pd.concat(data1)
    y = pd.concat(data2)


    x['class'] = ['stand' for i in range(len(x.to_numpy()))]
    y['class'] = ['stand' for i in range(len(y.to_numpy()))]

    print(f'x.shape = {x.shape}')
    print(f'y.shape = {y.shape}')

    #xy = pd.merge(x, y, left_index=True, right_index=True)
    #xy = pd.merge(x, y, how='inner')
    xy = x.append(y, ignore_index=True)
    print(f'xy.shape = {xy.shape}')

    return xy
both dataframes start their indices from 0?
 final light
royal crest
both dataframes start their indices from 0?
final light
royal crest
both dataframes start their indices from 0?
yes
velvet thorn
your indexes don't line up?
that's not what you should get
!e
import pandas as pd

df1 = pd.DataFrame([[1, 2], [3, 4]])
df2 = pd.DataFrame([[5, 6], [7, 8]])

print(pd.concat([df1, df2], axis=1))
@velvet thorn :white_check_mark: Your eval job has completed with return code 0.
001 |    0  1  0  1
002 | 0  1  2  5  6
003 | 1  3  4  7  8
yep i get the same too
 velvet thorn
@final light what version of pandas are you using
 final light
I'll go ahead and update 🙂
royal crest
let us know how it went
 desert oar
@velvet thorn did they change the default for ignore_index in a recent version?
velvet thorn
desert oar
<@!171929073063297024> did they change the default for `ignore_index` in a recen...
I honestly don't know
the last time I used pandas outside of helping people here
was like 0.22 or something
desert oar
heh
https://pandas.pydata.org/pandas-docs/stable/reference/api/pandas.concat.html looks like ignore_index=False is still default
 grim schooner
Guys I have a error related to DL related to multiple adapters,does anyone knows what does this error means or how to solve it?

 pure gull
final light
I've tried join, merge, concat and append in lots of different way but still ain...
pure gull
final light
I've tried join, merge, concat and append in lots of different way but still ain...
Could be simply that your index does not match. AFAIK if the index is different, you'll get the result in your image
final light
pure gull
Could be simply that your index does not match. AFAIK if the index is different,...
You are totally right!
It worked fine on my dummy data but the real datasets had different indexes. I've cleaned those up and now theyre concatenated properly.
Only took a few hours to learn this lesson 😄
pure gull
final light
You are totally right!
It worked fine on my dummy data but the real datasets had...
Great, faster than me! 😆
 simple frigate
Hi there, this is my first time trying out Artificial Intelligence in general, I am making a project but for that I need to learn NLP (Natural Language Processing), could someone here point me to the right resource for NLP. I am good in Python so the course doesn't have to be super beginner friendly.
I actually want to train my data model on a dataset, so it can perfectly describe the importance of the sentence. For example "Do this particular task before deadline", so it should classify it as "Urgent".
tender hearth
you can probably follow a sentiment analysis architecture
simple frigate
tender hearth
you can probably follow a sentiment analysis architecture
Oh, um could you tell me a bit more about it if possible.
Like how do I go on about it and make it, just point me to good resources
tender hearth
sentiment analysis is typically a classification task where you determine if a text has positive, neutral, or negative sentiment
e.x. analysis of reviews on Amazon
simple frigate
Oh, but I wanted to classify it on basis of urgency.
Like is it super urgent, or is it just spam
tender hearth
yeah it's the same problem just with different classes
simple frigate
Oh okay. I actually have the dataset, I procured it myself. It has around 4.5k paragraphs which I guess should be enough?
tender hearth
here's a resource: https://towardsdatascience.com/a-beginners-guide-to-sentiment-analysis-in-python-95e354ea84f6

Medium
An end to end guide on building word clouds, beautiful visualizations, and machine learning models using text data.
simple frigate
Do I need any prerequisites?
tender hearth
Looking at intent analysis models may be more helpful in this case https://towardsdatascience.com/multi-label-intent-classification-1cdd4859b93
Medium
There are a lot of applications that require text classification or we can say intent classification. Nowadays, everything is required to be categorized like contents, products are often tagged by…
tender hearth
simple frigate
Do I need any prerequisites?
Not really the resources I sent you are pretty high level
simple frigate
tender hearth
Looking at intent analysis models may be more helpful in this case https://towar...
High level as in easy to understand? I see this sk module mentioned in this one. Do i need to learn beforehand? btw thank you so much. It looks like exactly what I needed
tender hearth
High level as in the low-level details are abstracted away from you
simple frigate
Oh I see. Thank you so much again 
 sand fractal
Hey any advice on building an image recommender using python?
I have something that scrapes images on reddit and I want to add an additional layer that recommends an image I liked based on my previous preferecnes
An example would be pieces of fanart, and the model recommends those that it thinks I would personally like. If I do like it, then it should add it to the existing database
gaunt marsh
@desert oar you helped me yesterday with my chart and I told you that the performance is bad. Is it helpful to use pandas here? Is there anything in pandas that would help me?
desert oar
gaunt marsh
<@!389497659087650836> you helped me yesterday with my chart and I told you that...
Not really in this case. How many bars are there after removing duplicates?
Wouldn't it be better to just print out a bunch of text or something?
gaunt marsh
desert oar
Wouldn't it be better to just print out a bunch of text or something?
No, it has to be bars. I am looking for more powerful big data libs now. I am checking 'chaco' atm
buoyant adder
Here's today's 1 min video on Data Preprocessing:
https://youtu.be/FokTgvFkr5U

This will give you an intuition about what data preprocessing is in Data Science, its necessity, requirements and the different ways to do it with a simple and easy example.
Join this telegram group if you are serious about learning data science and want to avail free organized resources that are added and updated everyday: https://t.me/analyti...
 civic basalt
hey guys can anyone point me in the right direction? I want to create a filter like this guy: https://www.youtube.com/watch?v=2mwK5H4xsuI. I wanted to do it with pygame.draw like he did in the video, but since I want to apply an image of my own, I've been told I should use scikit and image processing to stick the image to my face. This is all new to me and sounds really complicated, maybe someone knows some tutorials that would help me build this "snapchat filter"?
zinc rock
is it me or pytorch pip install really horrendously slow
pip3 install torch==1.9.0+cu102 torchvision==0.10.0+cu102 torchaudio===0.9.0 -f https://download.pytorch.org/whl/torch_stable.html
it took like 15 mins and 10gb so far
 lavish gate
zinc rock
it took like 15 mins and 10gb so far
lavish gate
zinc rock
it took like 15 mins and 10gb so far
10 gb in 15 mins 🤯
It would probably take me a day
 desert torrent
can anyone say some applications or case by morris traversal?
 tidal bough
zinc rock
it took like 15 mins and 10gb so far
tidal bough
zinc rock
it took like 15 mins and 10gb so far
That does sound insane. I've installed it several times thanks to venvs, and it's 1-2 GB, I believe.
 shell berry
Let's say you want to find feature importance with a neural net, but an ablation study if far too expensive to run
If you ran an ablation study with the same features on a model with less parameters (i.e logistic regression vs a mlp), would a non-important feature necessarily be non-important on the neural net? i.e, run a lesser model to find feature importances, and then use that conclusion to take away/add features to your neural network
on one hand, a non-important feature probably doesn't have much to do with your output, but on the other hand, neural nets draw more conclusions from more pairs of features, so it may find an importance for that feature that a simpler model may not have
desert oar
shell berry
If you ran an ablation study with the same features on a model with less paramet...
i don't think this is true in general, but is probably true in a lot of cases
i use "partial dependence" if i need to calculate feature importance cheaply
in the specific example you gave, you're basically asking if feature importances should have roughly similar rankings in a linear approximation to a neural network
and i think the answer is almost certainly "no"
partial dependence, or something based on permutations of the data (rather than permutations/subsets of the model, which is expensive as you indicated)
desert oar
@lapis sequoia https://cdn.discordapp.com/attachments/696352490437738516/885265053446729819/image0.jpg which part exactly was confusing here?

did you do the first bullet point already?
do you understand what "chunks" are?
also this is very hard to read, it's much better if you post actual text
 shy kraken
Hi, in matplotlib...Anyone know how to make the chart smaller so that the y axis text doesn't run into the side of the image?

I've tried plt.margins but that just changes the margins within the chart
I've tried fig.set_figwidth and that changes the entire image width
 glad mulch
when you create your subplot you can specify a figsize
shy kraken
i always thought subplot was for multiple plots...but guess I'm wrong i'll check it out
shy kraken
i think it just sets the size of the window
shell berry
Thank you @desert oar 🙂
I have another question, if anyone can help. In multiple linear regression, colinearity or multilinearity has adverse affects on the model, such as if x1 = height, and x2 = weight
However, in cases of variable synergy, or if we're doing polynomial regression, we often add multiples or squares of original variables (i.e if we have feature x3, where x3 = x1 * x2)
I see this quite a bit, but isn't this bringing correlation into the features? x3 is correlated to x1 and x1, or if we're doing polynomial regression, x2 might be feature of x1 squared
Why is this okay, but correlation between different features not?
is x and x^2 just not correlated in the way that matters?
 rich shore
i have this python code which runs face recognition , another that runs mask detection and i get serial temperature data from an arduino
i want to make a os with a gui that runs this
shell berry
shell berry
is x and x^2 just not correlated in the way that matters?
OR, is it the case that even though there is collinearity, it doesn't really matter if we're learning new info (the p-value is low enough)?
zinc rock
if anyone feels like assisting with this question, it is much appreciated! https://discuss.tensorflow.org/t/for-a-tensorflow-public-function-is-there-a-way-to-link-the-script-that-it-is-in-and-the-function-name/4260

TensorFlow Forum
Hi, new Tensorflow user here. I am studying Tensorflow source code and have a very specific question. For every public function, I want to get the source code equivalent of it. https://www.tensorflow.org/api_docs/python/tf/all_symbols I tried using this but in the source code, public functions are named differently compared to the API symbols. ...
lapis sequoia
shell berry
is x and x^2 just not correlated in the way that matters?
that depends on distribution of your data. for positive data they are heavily correlated. but if it's both positive and negative they are uncorelated.


 bold timber
hi, i have a question: how to decide to use kernel = 'linear' or kernel = 'rbf' in svm?
shell berry
lapis sequoia
thanks, yeah, so do you have to take this into account when deciding if the collinearity from this approach is detrimental?
or is it always fine, since there's no inherent relationship
 old grove
Hello Guys i am just started with data Science and i was looking over variable types like Categorical and Numerical and in categorical Nominal and Ordinal Comes, SO i am just Confused With "Year" column,Is it considered to be Categorical(In that also Nominal or ordinal) ?
bold timber
old grove
Hello Guys i am just started with data Science and i was looking over variable t...
both of them. year column can be numeric and also can be categorical if you're sure that value only that.
if you want to collect the numeric to categorical, to be safe you can using binning to reach other number in the future
 mellow compass
it begins

 elder helm
Hello folks I have a dataset that have a column saying title there are some sentence and I want to delete the row having business and rent in the title so how can I do it?
 dark grotto
Hey My file is 256 x 256 raw image. I presumed that size is 256*256 = 65536 kb but real size is 45.4KB = 46573 bytes. Why is this size so small?
lapis sequoia
Hey guys I am trying t learn selenium, but I am having a problem getting the webrowser command to work
royal crest
wrong channel mate
old grove
bold timber
both of them. year column can be numeric and also can be categorical if you're s...
i am trying to do a regression so wanted to cehck if my year colum is releted to target or not or there is multi colinearity
 umbral gull
Can anyone tell me what would be the best choice in algorithm if I have to predict data on the basis of previous data available? I want to do regression
tender hearth
umbral gull
Can anyone tell me what would be the best choice in algorithm if I have to predi...
You want to do regression based on sequential data?
umbral gull
tender hearth
You want to do regression based on sequential data?
Yes, I have data like below:
[[428.78   3.  ]
 [449.75   8.  ]
 [460.74   5.  ]
 [457.61   3.  ]
 [457.     1.  ]
 [455.75   2.  ]
 [464.34   2.  ]
 [435.37   0.  ]
 [415.13   5.  ]
And I want to predict the future values from this data like i want to predict if the first value is 400 then I want to predict what will be the second value
tender hearth
Providing context would be helpful in this case. but an RNN such as an LSTM will probably work fine
umbral gull
tender hearth
Providing context would be helpful in this case. but an RNN such as an LSTM will...
Can I DM you?
desert bear
Hey, anyone tried runing fit_predict method on multiple cores?
umbral gull
tender hearth
Providing context would be helpful in this case. but an RNN such as an LSTM will...
Yes, I have data like below:
Marketing Spend Visitors Date
[[428.78 3. ]
[449.75 8. ]
[460.74 5. ]
[457.61 3. ]
[457. 1. ]
[455.75 2. ]
[464.34 2. ]
[435.37 0. ]
[415.13 5. ]
Now I want to predict the change in the visitors if there is a change in the marketing spend for the future dates. Basically I want to predit the future marketing spend and visitors
tender hearth
yeah so an LSTM would work fine
umbral gull
Ok thanks, I'll check it out
desert bear
Hey did anyone use joblib.Parallel methods from scikit learn to speed up prediction?
 lilac geyser
Can we use Logistic regression for regression task?
 lilac geyser
Ohk thanks!
lilac geyser
Do we get the best fit if we use least square method for logistic regression??
 haughty depot
hello
how can i compare user input with a specific column of csv file??
i wanna work with this but my program run in wrong way
import pandas as pd
a = "aparat"
df = pd.read_csv(a.csv)
if a in df['name']:
print("True")
arctic wedgeBOT
Series.tolist()```
Return a list of the values.

These are each a scalar type, which is a Python scalar (for str, int, float) or a pandas scalar (for Timestamp/Timedelta/Interval/Period)Here's today's 1 min video on Missing Data:
https://youtu.be/p7KqrJpNXJ0

This will give you an intuition about what missing data analysis is in Data Science, its problems and the different ways to deal with it with a simple and easy example.
Join this telegram group if you are serious about learning data science and want to avail free organized resources that are added and updated everyday: https://t.me/analyticadat...
haughty depot
royal crest
<@!864015101878206464>
i'll try it and tell you ! thanks
gaunt marsh
Anyone here with experience using PyQtGraph?
haughty depot
royal crest
so try something like:
```py
if a in df['name'].tolist():
  print('Yes')
```
FileNotFoundError: [Errno 2] No such file or directory: 'test.csv'
royal crest
that's not my fault
desert oar
shell berry
However, in cases of variable synergy, or if we're doing polynomial regression, ...
what do you mean by "variable synergy"? do you mean "interactions"?
correlation is a purely linear thing - nonlinear transformations will have probabilistic dependence, but not correlation
 indigo sphinx
Hi, I want to ask something related to fuzzy and bayes network.
Is it possible to use output from fuzzy logic as input variable for bayes network?
 digital badge
is it possible to create a music tool that uses neural networks to scan audio and provides feedback on it?
 coral kindle
anybody manipulated slicing with Pytorch in a dataloader?
I'd like to skip the part where the same imgloads over and over
i tried to hold the current img by its id, but everytime it puts the matrix back in memory
 wicked flare
If you had to choose a deep learning framework for a resource-intensive production system, which would you pick?
desert bear
Did anyone use IsolationForest for outlier detection? I don't know how to tune the parameters like n_estimators, max_samples, max_features. I try different parameters and I compare results with domain outliers.
The thing that I don't like about the IF is that it builds a forest on randomly based features. Because of that when I run the same test with the same parameters I can get very much different scores. How come it is so popular in outlier detection?
serene scaffold
wicked flare
If you had to choose a deep learning framework for a resource-intensive producti...
do you have access to GPU computation? I think that's going to matter more than the framework
wicked flare
serene scaffold
do you have access to GPU computation? I think that's going to matter more than ...
Most likely, but I actually do have to pick a framework, so that question is important.
(I mean, this is for a big organization so they will probably get whatever hardware is necessary)
serene scaffold
wicked flare
Most likely, but I actually do have to pick a framework, so that question is imp...
I assume there's more to this than just picking between pytorch and tensorflow, yes? Are you planning to use some sort of SAAS to distribute stuff?
(I just transitioned from academia to industry and I'm still learning what role SAAS plays in all of this.)
wicked flare
serene scaffold
I assume there's more to this than just picking between pytorch and tensorflow, ...
This is super early in the process, so right now I've pretty much just been asked to investigate what framework would be better, but your other concerns would be interesting to hear. What do you mean exactly by "using SAAS to distribute stuff"?
 meager herald
That dictionary has two rows, however I am only trying to access the week_ret for the second row of a given ticker (the second row is also the last row). How can I do that?
ohlc_dict[ticker]["week_ret"]
This is what ohlc_dict[ticker] looks like

the above line only gives me the week ret for the first row which I do not want because it is null
 potent parrot
gaunt marsh
Anyone here with experience using PyQtGraph?
potent parrot
gaunt marsh
Anyone here with experience using PyQtGraph?
I'm a maintainer of pyqtgraph, what's up
gaunt marsh
potent parrot
I'm a maintainer of pyqtgraph, what's up
I have a numpy-array with 45 values. Is it possible to feed the axis with this arrays' variable instead of hardcode the array?
potent parrot
gaunt marsh
I have a numpy-array with 45 values. Is it possible to feed the axis with this a...
so like, you're looking to avoid making copies of the array? Generally speaking when you call .setData(some_ndarray) it will just reference the data put in, it won't make a whole other copy (there may be conditions where it does make a copy of the data tho)
gaunt marsh
potent parrot
so like, you're looking to avoid making copies of the array? Generally speaking ...
absolutely. I am struggeling. My goal is exactly that. on x-axis are my values of my numpy-array. These are RGB values btw. Y axis shows me the quantity. So, the array I'm putting in, should also be used to print their values on the x-axis. Is something like that possible?
 potent parrot
ahh yeah, there is a way to define custom labels on axis items... I don't remember how to do it off the top of my head.... I think it's the text parameter of the AxisItem
or you can call AxisItem.setLabel
hmm...maybe that's not it on second thought
gaunt marsh
And in AxisItem.setLabel I call my array?
potent parrot
i think i was mistaken...
gaunt marsh
never mind
potent parrot
you need to overwrite AxisItem.tickStrings
and make it return a list of string representation of your (r, g, b) array elements
 agile jolt
hiyaa, i made a viz based on kaggle's dataset and was told that figure params (20 and 5) in:
plt.figure(figsize=(20,5))
``` are basically in inchescan someone help with an algorithm that would convert them into pixels?
note: multiplying with 96 is not considered as a solution
lilac geyser
Ok thanks a lot!!!
gaunt marsh
potent parrot
https://pyqtgraph.readthedocs.io/en/latest/_modules/pyqtgraph/graphicsItems/Axis...
okay that seems very complicated. I'm trying it now
potent parrot
yeah we don't have an easy way of overwriting the tick labels
there is a lot about AxisItem us maintainers aren't fans of 😆
gaunt marsh
potent parrot
there is a lot about AxisItem us maintainers aren't fans of 😆
then let me ask you another question, maybe you could help.
I want to plot that what I sent you earlier as image. But on the image are only a few bars. I have about 700.000 values, so there will be 700.000 bars and the canvas should be scrollable. Do you have any idea what to use for that? Ruby + ChartJS failed, Pure Python and Mathplotlib failed either. So I hoped that PyQtGraph could do it without killing my computer
something like that
 lapis sequoia
can someone help check my thinking here - is it useful to look at the distribution of your test set and your prediction set when doing a regression? Or is this just showing the same thing as the standard performance metrics?
potent parrot
gaunt marsh
then let me ask you another question, maybe you could help.
I want to plot that ...
I would think pyqtgraph probably could do something like that, hard to speculate on how performance would be
generally the limitation on if it will work is "will it fit in memory", will the UI be responsive enough is another story
gaunt marsh
There are a lot of charting libs out there and every lib is promising better performance than others but when it comes to such big data sets, they all die 😆
I'm tired of coding the same stuff in other langs to check out different libs for that
potent parrot
haha, yeah it's tough to make good comparisons like this, I've largely shied away from doing comparisons w/ pyqtgraph w/ other libraries because I don't think my knowledge of other libraries is good enough to make a fair comparison
pyqtgraph generally focuses on interactivity and performance when running on a local machine....
i suppose that's too many pixels to work as an ImageItem
(we have a lot of our image based visualization pretty optimized, the bar-graphs haven't had much attention in quite some time)
gaunt marsh
potent parrot
pyqtgraph generally focuses on interactivity and performance when running on a l...
I'm sitting on a machine with 16 GB of ram with macos. I think it's not enough for that much datasets. I'm hearing my fan when I compile 😄
potent parrot
gaunt marsh
I'm sitting on a machine with 16 GB of ram with macos. I think it's not enough f...
if yo uwant to take a step back from your application, and just get a sense of performance vs. data-set size, pyqtgraph does have some benchmark capabilities baked into the app
python -m pyqtgraph.examples and then select "Plot Speed Test" for example
that brings this up:

which you can tinker with the data size, and see how performance is impacted... I know you have a bunch of bar-plots, and we don't have good benchmark capability there I don't think
gaunt marsh
potent parrot
that brings this up:
I don't have 'plot speed test'
 potent parrot
oh, it might be in another name in the app, you can run python -m pyqtgraph.examples.PlotSpeedTest to bypass the example app
(or was that fancy parameter tree added after the last release?)
gaunt marsh
potent parrot
oh, it might be in another name in the app, you can run `python -m pyqtgraph.exa...
ok, that works. I love how pyqtgraph feels when you scroll in and use a mouseclick to look around
potent parrot
yeah, the scaled viewbox functionality is really slick
I will say one thing regarding performance tha'ts a huge gotcha that we have identified a work-around for (But have not implemented)
for line-plots, the moment the pen thickness is > 1px, performance absolutely plummets
so if you're going to want thick-lines and rapidly updating ... you're going to have to wait until we get that working (that may be the 0.13.0 flagship "feature" 😆 )
gaunt marsh
there is no perfect lib for that I guess. I tried it with Mathplotlib and this is what I get. I can't zoom in and scale. And I think that not all values have been plotted :/
 potent parrot
if you want mouse interaction (zoom/scale) forget matplotlib
you should likely look at bokeh, plotly or pyqtgraph (maybe vispy, but their high level plotting API is pretty bare)
but matplotlib and libraries that wrap matplotlib should likely not even be considered
(and I say this as someone that loves matplotlib, a lot of their maintainers have been super helpful to us)
gaunt marsh
Bokeh looks interesting and I found some links about handling large datasets. I guess that they are talking about a few thounds and not near a million
potent parrot
I mean, I would try and plot the 700k bar plots ...ignore the axis labels for now and see how that performs...
I would start with defining just brush's ...no Pen/Pens
there is also in the example app a "Custom Graphics" example, which shows how to create your own plot types...the example is a bit bare, but might get you started... if you can pass along a chunk of the massive numpy array you have, I wouldn't mind trying to take a closer look
gaunt marsh
potent parrot
I would start with defining just brush's ...no Pen/Pens
I started a post in their forum just to make sure that all the work isn't for nothing... I will give it a try tomorrow 🙂
potent parrot
the mail list?
gaunt marsh
thank you for talking to me, I learned a bit more today about Graphs and different libs!
No, it's their Discourse-Forum
 hasty mountain
Hey guys, is there any advantage on using pytorch instead of keras for neural networks/deep learning in general?
I've tried to see some tutorials on how to create a simple neural network in pytorch, but seems that even to create a single dense layer requires such a long and complex code, creating classes, functions, etc... I get quite confused with all of it(especially with classes)
prime hearth
hello i would like to please know why do we transpose a matrix for neural network for input?

for example for implementing NN or neural network from scratch, all inputs are transposed but why?
i dont understand the reason, cant just regular matrix work properly?
or is it because we need to transpose to get an output matrix of like 10 output layers?
@hasty mountain i think they are for different purposes like react vs angular. Tensor is like angular but pytorch like react it new and growing
both do the job but depends what want to do
hasty mountain
Hm... I see. I don't quite get the difference between react and angular, though.
prime hearth
they both do job but it the approach. React is more easier to learn like pytorch
can try googling for more .
hasty mountain
I see. Thanks
iron basalt
prime hearth
hello i would like to please know why do we transpose a matrix for neural networ...
The inner dimensions of two matrices must match in order to multiply them.
prime hearth
yes, oh okay so lets in say in an actual project, will i need to like figure this out before coding
like know what the dimensions of. each of matrix will. need to be in order to. get like 10 output layers?
iron basalt
Depending on which NN library you use, they will find out the inner dimensions for you.
prime hearth
oh okay.
i guess i was confused how he (the youtuber) knew we need to transpose
because he doesnt say what. we are multilpy it with
i know it with weights but weights are just a single vector which can be multiplied by anything whether row or column wise
thast why
iron basalt
One knows why to transpose because one knows what the desired result from the matrix multiply should be.
prime hearth
oh okay. The way you say that sounds like something out of a book like old wise side characters
thanks though, i guess i will go along with that then that makes sense
iron basalt
You may see the following in ML, up to personal preferences as well: W*x, x^T*W, W^T*x, and more.
prime hearth
oh okay thanks
iron basalt
What matters is that the operation done mimics a fully connected network activation.
Typically one declares something like "all vectors are stored as columns in matrices in the following", and then because of this choice some transposition is required.
 modern beacon
is there a project about training a model for playing a rhythm game based on a chart?
 ionic mica
 iron mantle
from io import StringIO
import boto3
s3 = boto3.client("s3",
region_name=region_name,
aws_access_key_id=aws_access_key_id,
aws_secret_access_key=aws_secret_access_key)
csv_buf = StringIO()
df.to_csv(csv_buf, header=True, index=False)
csv_buf.seek(0)
s3.put_object(Bucket=bucket, Body=csv_buf.getvalue(), Key='path/test.csv')
what is the logic behind of this code
 merry ridge
prime hearth
for example for implementing NN or neural network from scratch, all inputs are t...
merry ridge
prime hearth
for example for implementing NN or neural network from scratch, all inputs are t...
Most linear operators are applied over the column space. If each data entry is stored in a row and the features its columns, it is just natural to transpose it before doing any linear algebra.
Most is a bit of a loaded ambiguous term here, but it is the way it is usually presented in any course in linear algebra
 winged locust
What size should the weight vector be in logistic classification for f(wT@x + b)
desert bear
I have a question regarding Isolation Forest for outlier detection. I know that many research papers consider this model better than LOF for outlier detection.
- However, when I run this model on my set, I get 3 times less outliers than with LOF model.
- Another problem is that I cannot tune the parameters of the IF right.
- One more problem regards the parameters and scores. When I run this model with the same parameters few times, I get different results when I validate it with some domain rules. I know that the parameter random_state set to some value can solve problem of different scores for each run. But how can I manage to tune the model good enough so it runs corectly on my local machine and later when I deploy it on another machine for the task of outlier detection?
 quasi sparrow
What are flags used in tensorflow? This is what the documentation says from the instruction: flags.DEFINE_integer
Registers a flag whose value can be any string.
used for*
 vale hedge
Anyone have any thoughts on jupyterLab vs notebook?
serene scaffold
vale hedge
Anyone have any thoughts on jupyterLab vs notebook?
I prefer to do interactive stuff in ipython because it's easy to get to and there's no temptation to treat it as reusable.
desert oar
vale hedge
Anyone have any thoughts on jupyterLab vs notebook?
i'd recommend lab just because it's newer, but there are still some notebook extensions that don't have a lab equivalent
vale hedge
Yeah I was curious about extensions. Haven't tried out any extensions in JupyterLab yet. Are they JS that run on web client and not the server?
royal crest
who has tried out JB's DataSpell?
i have mixed thoughts, but understandably it is in early access
lapis sequoia
HI guys,
Do any of u use sympy? I am trying to export a set of equations out as png. I cant seem to figure out how to do it.
Please help. Replpy to message so i get notified . thanks o/
 lusty stag
I'm trying to work with motion capture data. anyone have source code for how to approach this? specially feature extraction from raw data.
iron basalt
lapis sequoia
HI guys,
Do any of u use sympy? I am trying to export a set of equations out as...
latex(equation)
 pulsar karma
lapis sequoia
iron basalt
`latex(equation)`
pulsar karma
lapis sequoia
iron basalt
`latex(equation)`
Thanks that worked.
desert bear
If I have a categorical columns which have more than 10 unique values should I still use OneHotEncoding or LabelEncoding?
I have 2 columns with cardiality equal to 87 and 67. I used OnehotEncoding in preprocessing. I was wondering if that might result in my model to perform worse
coral kindle
Ok so idk if this is the right place to complain but everytime I have an idea for my project, a quick googling shows it's already been taken and developed at a later stage orz
It's hard to find an original project
royal crest
this is why doing a good review of the literature is important
tender hearth
coral kindle
Ok so idk if this is the right place to complain but everytime I have an idea fo...
story of my life
coral kindle
True
velvet thorn
coral kindle
Ok so idk if this is the right place to complain but everytime I have an idea fo...
it's not really that big a deal
you can still do it
coral kindle
velvet thorn
it's not really that big a deal
I wanna mine Arxiv articles but there's already huggingface projects about it
royal crest
i don't think mining arxiv articles is in any way novel, but the gap may exist in what you do with it
 dull oar
hey, what libraries do you use to visualize data with pyton ?
royal crest
you can save the visualisation as images
dull oar
so no JS involved?
coral kindle
Jupyter uses JS but it's not required to make your notebook running
Most of them started to use JS as backend
 plain prism
does anyone know how to detect parked site beside looking for name servers or path subdomain testing
royal crest
dull oar
so no JS involved?
backend probably yes, but no need for JS to use python modules
lusty stag
I'm trying to work with motion capture data. anyone have source code for how to approach this? specially feature extraction from raw data.
gaunt marsh
desert oar
```python
rgbs = [ ... ]
rgb_counter = Counter(rgbs)
rgb_values = list(rgb_coun...
is there any chance to put in a numpy array instead of a normal array?
agile jolt
can someone tell me why is this not okay, i mean obvi there are 4 dots, 5 axis' but how can i improve it..?


 hasty grail
gaunt marsh
is there any chance to put in a numpy array instead of a normal array?
hasty grail
gaunt marsh
is there any chance to put in a numpy array instead of a normal array?
It should still work
However there is probably a more efficient way
gaunt marsh
hasty grail
However there is probably a more efficient way
Can you tell me more about that?
arctic wedgeBOT
numpy.unique(ar, return_index=False, return_inverse=False, return_counts=False, axis=None)```
Find the unique elements of an array.

Returns the sorted unique elements of an array. There are three optional outputs in addition to the unique elements:

• the indices of the input array that give the unique values

• the indices of the unique array that reconstruct the input array

• the number of times each unique value comes up in the input arraySince the operations for manipulating Numpy arrays are written in C, this should run 10-100x faster
@gaunt marsh
gaunt marsh
hasty grail
Since the operations for manipulating Numpy arrays are written in C, this should...
Okay, so this looks for unique elements in a numpy array. That will be helpful but first of all, I need to be able to put a numpy array in. I am getting an error
TypeError: unhashable type: 'numpy.ndarray'
hasty grail
can you show your code?
gaunt marsh
hasty grail
can you show your code?
import numpy as np
import pandas as pd
from collections import Counter
import glob
import os

file_list = glob.glob(os.path.join(
    os.getcwd(), "/Users/yyy/Downloads/yyy", "*.txt"))

img_values = []
for file_path in file_list:
    with open(file_path) as f_input:
        img_values.append(f_input.read())

split_list = [i.split() for i in img_values]

flat_list = []
for sublist in split_list:
    for item in sublist:
        flat_list.append(item)

# Converting the Strings in Flatarray to Floats
str_to_float = list(map(float, flat_list))

# Converting the Floats in Flatarray to Integers
float_to_int = list(map(int, str_to_float))

# Rounding the Integers
my_rounded_list = [round(elem, 0) for elem in float_to_int]


def list_of_three_values(l, n):
    for i in range(0, len(l), n):
        yield l[i:i + n]
n = 3

list_of_three_values = list(list_of_three_values(my_rounded_list, n))

# Convert the lists to tuples
rgbs = list(map(tuple, list_of_three_values))
ara = np.array(rgbs)

rgb_counter = Counter(ara)
rgb_values = list(rgb_counter.keys())
rgb_counts = list(rgb_counter.values())
rgb_ids = list(range(len(rgb_counter)))

plt.barh(
    rgb_ids,
    rgb_counts,
    color=[(r/255, g/255, b/255) for r, g, b in rgb_values]
)

plt.title('Histo')
plt.ylabel('color')
plt.xlabel('amount')
plt.show()
where does the error occur?
!e
from collections import Counter
import numpy as np

arr = np.random.randint(0, 10, size=(100,))
print(arr)

c = Counter(arr)
print(c)
@hasty grail :white_check_mark: Your eval job has completed with return code 0.
001 | [2 8 5 9 2 7 7 1 0 7 1 0 3 1 4 6 2 8 7 9 5 0 4 4 7 2 0 0 7 8 0 5 6 7 7 7 8
002 |  2 3 9 2 1 7 0 1 9 2 5 6 5 9 9 9 1 5 9 2 5 1 1 2 9 7 7 0 6 5 3 8 6 0 5 2 4
003 |  0 6 3 2 1 1 9 5 4 5 0 3 4 0 2 1 2 9 4 6 5 2 6 5 6 1]
004 | Counter({2: 14, 5: 13, 7: 12, 1: 12, 0: 12, 9: 11, 6: 9, 4: 7, 8: 5, 3: 5})
!e
import numpy as np

arr = np.random.randint(0, 10, size=(100,))
print(arr)

values, counts = np.unique(arr, return_counts=True)
c = {value: count for value, count in zip(values, counts)}
print(c)
@hasty grail :white_check_mark: Your eval job has completed with return code 0.
001 | [0 8 1 8 1 1 7 0 5 3 0 3 5 7 4 8 7 0 2 7 3 1 8 7 1 2 4 2 6 6 5 0 8 7 0 0 0
002 |  0 3 5 3 1 2 3 3 2 8 6 9 9 7 1 0 8 0 1 5 6 0 5 5 9 9 2 1 0 1 0 6 2 6 3 3 1
003 |  5 4 7 3 9 7 1 4 5 6 4 9 6 1 8 5 8 3 7 9 5 7 4 8 8 0]
004 | {0: 15, 1: 13, 2: 7, 3: 11, 4: 6, 5: 11, 6: 8, 7: 11, 8: 11, 9: 7}
Should work either way
 west dagger
I'm praticing bs4 and im wondering if there's some way i can combine these two for statements into like one `results = soup.find_all('div','h1','img', class_="td-pb-span8 td-main-content")
for result in results:
print(result.text)
links = soup.find_all('img', class_="td-pb-span8 td-main-content")
for link in soup.find_all('a'):
print(link.get('href'))`
hasty grail
!code
arctic wedgeBOT
Here's how to format Python code on Discord:
```py
print('Hello world!')
```
These are backticks, not quotes. Check this out if you can't find the backtick key.
hasty grail
You should use three backticks instead of just one to show your code
west dagger
I'm praticing bs4 and im wondering if there's some way i can combine these two for statements into like one ```py
results = soup.find_all('div','h1','img', class_="td-pb-span8 td-main-content")
for result in results:
print(result.text)
links = soup.find_all('img', class_="td-pb-span8 td-main-content")
for link in soup.find_all('a'):
print(link.get('href'))```
hasty grail
(and add py after the first set of three backticks so that you get syntax highlighting)
You're not using the variable links in your code
west dagger
im playing arounnd with bs4. Im trying to scrape a <img> tag with the release date image, a stock x Href link and a image link. so far i get this

in theory i want to have the links scraped with said release. where have i gone wrong ?
hasty grail
You probably need a more precise selector for the links
According to your above code, you're fetching every single link on the page, regardless of whether it has any relation to a product
gaunt marsh
hasty grail
where does the error occur?
rgb_counter = Counter(ara)
west dagger
so i should change the py Find_all() to a Find() call ?
gaunt marsh
If I write rgbs instead of ara, it works but it is not the numpy array then
hasty grail
gaunt marsh
rgb_counter = Counter(ara)
What is ara? Can you print its contents?
hasty grail
west dagger
so i should change the ```py
Find_all() to a Find() call ?```
find_all is fine, but you might need to only select the links that have a certain class
or, for even more precise control, you can use css selectors
gaunt marsh
hasty grail
What is `ara`? Can you print its contents?
of course:
 [161 162 172]
 [ 72  45  31]
 [116  75  33]
 [182 182 195]
 [103  63  26]
 [151 152 156]
 [211 211 228]
 [190 191 204]
 [ 98  75  49]
 [ 93  51  23]
[135 135 135]]```my tuples
hasty grail
I see
collections.Counter only works on 1-D arrays
but regardless, you should use np.unique as above
serene scaffold
I have a boolean vector and I need to get the index ranges for each contiguous sequence of Trues. I feel like there should be something for this that already exists but I can't find it.
hasty grail
I don't recall the library having anything like that
serene scaffold
I might have to turn the whole thing into a string and used regex
hasty grail
I would use np.gradientnp.diff and then mask and np.nonzero
tender hearth
might want to make your question more general
i.e. "how to get indices for repeated elements in vector"
more likely to get answers on Google that way
serene scaffold
tender hearth
perhaps <https://stackoverflow.com/questions/30003068/how-to-get-a-list-of-all-i...
this just moves the problem, as I need it to be a range.
tender hearth
write a for loop in Cython ✅ \s
serene scaffold
a stack overflow answer suggested https://docs.scipy.org/doc/scipy/reference/generated/scipy.ndimage.find_objects.html but when I used it, it just gave me one range for the first and last Trues in the whole thing.
tender hearth
hasty grail
!e
import numpy as np

x = np.random.randint(0, 2, size=20).astype(bool)
print(x)

diffs = np.diff(np.concatenate([[True], x]).astype(int))
print(diffs)

idx = (diffs == 1).nonzero()
print(idx)
@hasty grail :white_check_mark: Your eval job has completed with return code 0.
001 | [False  True False False  True  True  True  True  True False  True  True
002 |   True False  True False  True  True  True  True]
003 | [-1  1 -1  0  1  0  0  0  0 -1  1  0  0 -1  1 -1  1  0  0  0]
004 | (array([ 1,  4, 10, 14, 16]),)
oh looks like the "one range for the first and last Trues" thing you mentioned earlier
hasty grail
there
serene scaffold
Thanks, I'll give these a try!
serene scaffold
tender hearth
write a for loop in Cython ✅ \s
I actually do plan to cynthonize all this 
 solid grove
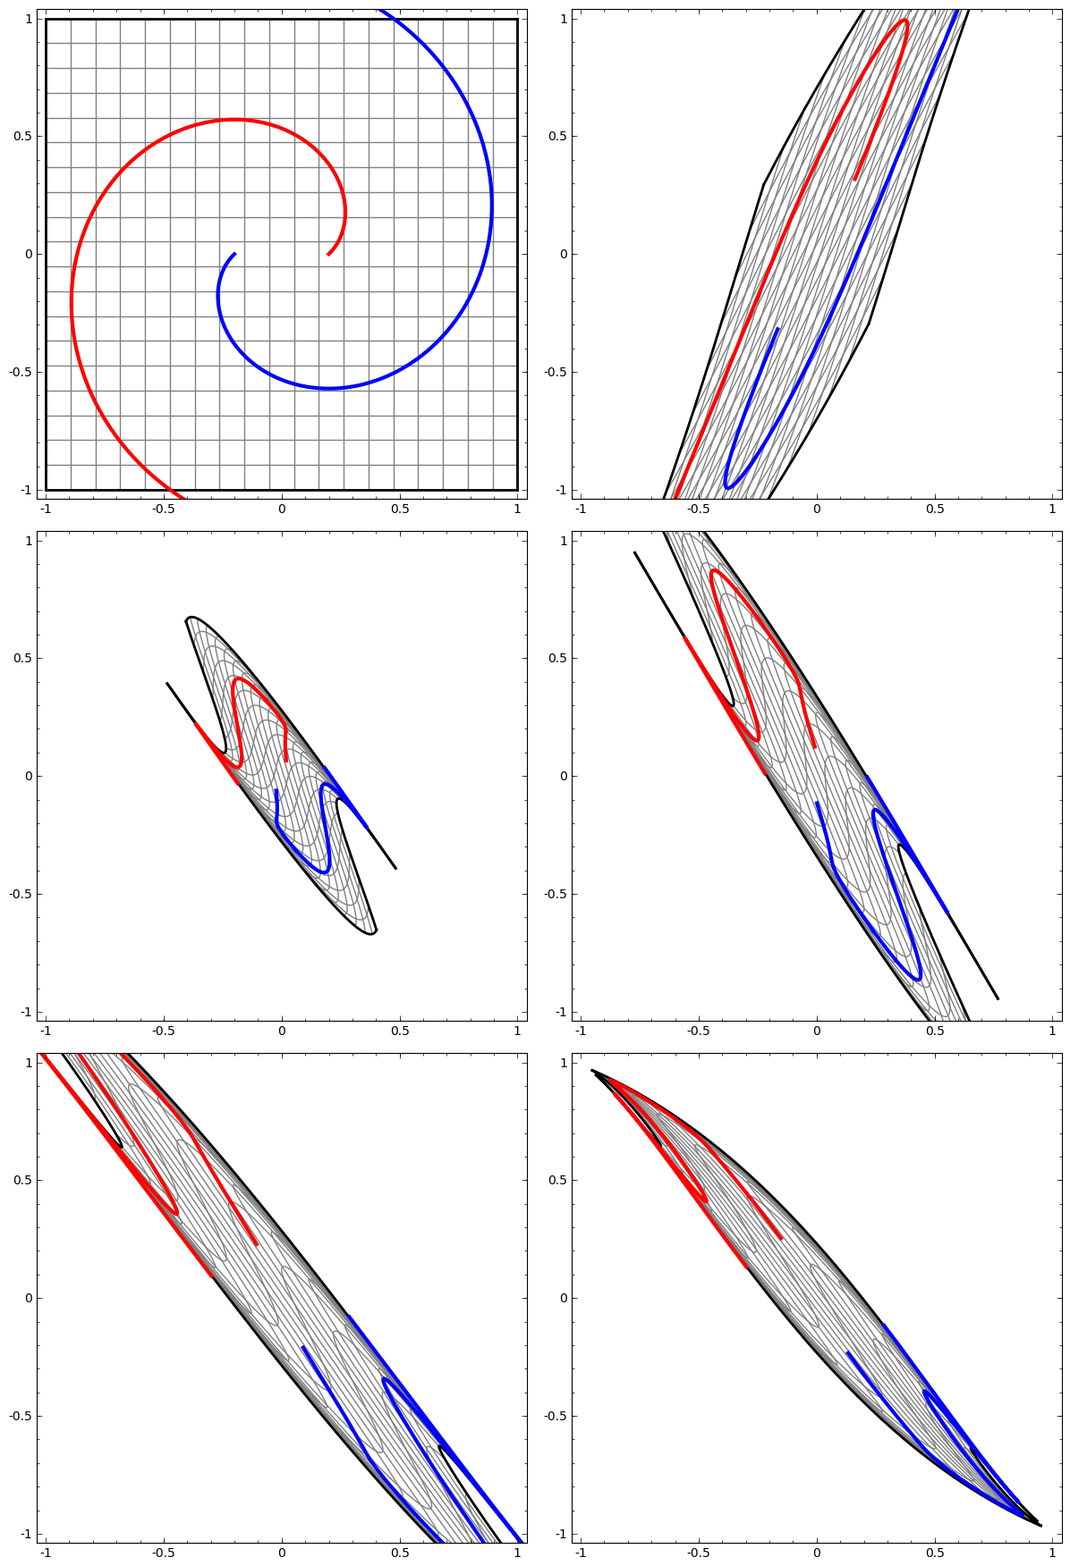
 gaunt marsh
hasty grail
but regardless, you should use `np.unique` as above
gaunt marsh
hasty grail
but regardless, you should use `np.unique` as above
What’s the difference to np.array? What happens in my case by using unique?
hasty grail
Some of the functionality of np.unique is written in C, so it runs faster than "pure" Python
!e
import cProfile
from collections import Counter
import numpy as np

arr = np.random.randint(0, 100, size=1000000)
with cProfile.Profile() as pr:
     values, counts = np.unique(arr, return_counts=True)

pr.print_stats()