#data-science-and-ml
1 messages · Page 337 of 1
 serene scaffold
 stuck karma
a df
serene scaffold
can you show it?
serene scaffold
print(df.head().to_csv())
stuck karma
i just have the coef
but its not a df, i want to create one to export it
i just have a list with the result for the moment
serene scaffold
so what do you have right now? can you show that?
 serene scaffold
and what about X_trains?
 serene scaffold
can you do print(X_train.shape, pls.coef_.shape)?
stuck karma
 serene scaffold
alright, one moment
serene scaffold
which one is the columns for the dataframe that you want? 240?
stuck karma
i m not sure to understand the question 😳
the values of the coef
and the index of X_train
serene scaffold
you're trying to make a dataframe, right?
serene scaffold
the shape of X_train is (240, 2033), so if you convert that to a dataframe, it would have 240 rows and 2033 columns
is that what you want?
or do you want 240 columns with 2033 rows?
stuck karma
dataframe would have 2 columns and 2033 rows
serene scaffold
what about the 240?
stuck karma
i just save the values of the coef
240 is the number of samples and 2033 the number of features
the coef are determinated for the features
serene scaffold
so what do you want in the two columns of the dataframe?
stuck karma
an index and a b coef
i want to identify what is the feature that belong to the coef
ok i think its more complex . I dont know if it is possible
serene scaffold
you could do pd.Series(pls.coef_.ravel()), I guess
stuck karma
The X_train is extracted from the X witch have a bigger number of rows
i dont know if the index of X_train is the same that the index of X, or the index is just the number of rows
serene scaffold
so you need pls.coef_ in a way that is indexed by the position in X (not X_train)?
stuck karma
yes
serene scaffold
can you show the code where you made X_train?
stuck karma
i know that coef_[0] belongs to X_train [0] , but i dont know whitch index it matchs for X
yes
X_train, X_test, y_train, y_test = train_test_split(X, y, test_size=0.2)
it is random i think :/
(its train_test_split method from scikit learn)
serene scaffold
@stuck karma look at this SO answer and see if it helps: https://stackoverflow.com/questions/31521170/scikit-learn-train-test-split-with-indices

Stack Overflow
How do I get the original indices of the data when using train_test_split()?
What I have is the following
from sklearn.cross_validation import train_test_split
import numpy as np
data = np.reshap...
it looks like if X and y are pandas types, the indices will be retained
stuck karma
oh
it was a panda but i converted it to a numpy array
but i dont believe this
because
that would mean its not splitted randomly?
if X[0] = X_train[0]? or i m wrong
~<
serene scaffold
In [6]: from sklearn.model_selection import train_test_split as tts
In [1]: a = pd.DataFrame(np.random.random((240, 2033)))
In [2]: b = pd.DataFrame(np.random.random((240, 1)))
In [10]: xtr, xtst, ytr, ytst = tts(a, b)
In [12]: ytr
Out[12]:
            0
198  0.509740
239  0.013272
39   0.749264
96   0.517371
78   0.599222
..        ...
177  0.128824
62   0.863066
189  0.865727
230  0.996558
171  0.104627
As you can see, the indices are still there @stuck karma
stuck karma
i read 👀
serene scaffold

stuck karma
haha
tbh my english is broken thats why im slow and ask questions in a clumsy way. ok i'm reading👀
serene scaffold
stuck karma
tbh my english is broken thats why im slow and ask questions in a clumsy way. ok...
don't think of it as broken, just acknowledge that it's not your native language but that you're otherwise doing great
serene scaffold
what do you mean, the third row?
stuck karma
this In [10]: xtr, xtst, ytr, ytst = tts(a, b)
serene scaffold
39 0.749264 ?
serene scaffold
In [10]: xtr, xtst, ytr, ytst = tts(a, b) this is train_test_split
stuck karma
ok yes okay
serene scaffold
import train_test_split as tts # I am lazy
stuck karma
ahaha yes i got it
just a laaast question
in 198 0.509740
the first line (after the title)
is it the equivalent of df[0]?
or df[198]?
serene scaffold
no, it would be df[198]
stuck karma
okay, so why i got a value when i print pls.coef_[0]? i should be out of range
serene scaffold
it's indexed according to the original dataframe
stuck karma
(i'll check my code if its what i said)
serene scaffold
Look at the code again.
In [21]: ytr.loc[198, 0] == b.loc[198]
Out[21]:
0    True
Name: 198, dtype: bool
ytr is indexed according to b
stuck karma
okay , i see. How did you get the index? its because its a panda df?
gonna think more about it
serene scaffold
stuck karma
okay , i see. How did you get the index? its because its a panda df?
every dataframe is indexed
stuck karma
im reading about numpy.indices
to try to get the index in one column like in your example
 topaz spruce
i have an image like this

how do i remove any features less than a radius of say 10px?
this a bit of processed image
and i am not sure which topic this fits in
and please ping if i don't reply within a second
 tawny bloom
I'm trying to do multiple "Anzahl der Personen" based on the input of input1size. How can i do that? I'm not quite familiar with the matplotlib. ```python
import os
import sys
import time
import subprocess
import pkg_resources
os.system("title matplotlib learning 1")
#Installing required modules
required = {'colorama', 'matplotlib'} # Here you can type in the modules that are needed.
installed = {pkg.key for pkg in pkg_resources.working_set}
missing = required - installed
if missing:
print("""Looks like there are missing modules, you haven't installed.
I am gonna do that for you :) | Please wait.""")
print("")
python = sys.executable
subprocess.check_call([python, '-m', 'pip', 'install', *missing], stdout=subprocess.DEVNULL)
os.system("cls")
else:
print("All modules are installed. :)")
time.sleep(2.0)
os.system("cls")
from colorama import *
import matplotlib.pyplot as plt
from matplotlib.pyplot import *
def hellomessage():
print(Fore.LIGHTGREEN_EX + "Hello!" + Style.RESET_ALL)
time.sleep(1)
os.system("cls")
print("Note: " + Fore.YELLOW + "This is a ML-Learning-Program." + Style.RESET_ALL)
time.sleep(2)
def chart():
#inputs for chart.
print("")
input1size = input(Fore.LIGHTBLUE_EX + "Anzahl der Personen: " + Style.RESET_ALL)
input2size = input(Fore.LIGHTBLUE_EX + "Größe der Personen in cm: " + Style.RESET_ALL)
#inputx = input(input2size * input1size)
##################
plt.title('Test 1')
plt.xlabel('Anzahl der Personen')
plt.ylabel('Größe in cm')
#feature = np.array([
#[4.0, 37.92655435, 23.90101111],
#[4.0, 35.88942857, 22.73639281],
#[4.0, 29.49674574, 21.42168559],
#[.0, 32.48016326, 21.7340484],
#[2.0, 30.43124, 12.21431],
#])
feature = np.array([[input1size, input2size, 22.73639281]])
plt.scatter(feature[:,0],feature[:,1], )
plt.show()
plt.title('Test 1')
hellomessage()
chart()```
 cerulean ruin
Whatever you would like?
We can automate various computer tasks
Was there something specific you wanted to automate?
happy to help out
 neon marsh
Is anyone here good with multi threading? If you are could you check out the #help-cake channel and see if you can help me?
 late shell
Hey, I was thinking of coding up a general class for ANN, that had the options of 4 activation functions and 4 cost functions. But soon I ran into trouble in back propagation. Since there could be so many different activation functions used in each layer and then the cost functions, how do I code up all the possible derivatives of weights and biases. wouldn't the equations for derivatives change from network to network depending on the activation and cost functions. What I'm trying to do, is that even feasible by an average coder like me?
cerulean ruin
For sure, I think this could be composed with thoughtful class structure
serene scaffold
How did these code examples end up in an O'Riley book?
for i in range(0, 512,2):
          pe[0][i] = math.sin(pos / (10000 ** ((2 * i)/d_model)))
          pc[0][i] = (y[0][i]*math.sqrt(d_model))+ pe[0][i]

          pe[0][i+1] = math.cos(pos / (10000 ** ((2 * i)/d_model)))
          pc[0][i+1] = (y[0][i+1]*math.sqrt(d_model))+ pe[0][i+1]
The excessive indentation is part of it.
 real wigeon
whats better to use for creating descriptive statistics: pandas or flask sqlalchemy
 chilly geyser
serene scaffold
How did these code examples end up in an O'Riley book?
```py
for i in range(0, 5...
chilly geyser
serene scaffold
How did these code examples end up in an O'Riley book?
```py
for i in range(0, 5...
Seems like it could have been typed in a hurry, you can always email the authors to use more descriptive variables and be less cryptic with 0, 1
 tidal bough
chilly geyser
Seems like it could have been typed in a hurry, you can always email the authors...
tidal bough
chilly geyser
Seems like it could have been typed in a hurry, you can always email the authors...
ask the authors if they ever press the autoformat hotkey before publishing a snippet in a book 😔
chilly geyser
Well I don't think autoformatters are widely adopted yet
VSCode default is to not have them
 arctic wedgeBOT
:incoming_envelope: :ok_hand: applied mute to @winter warren until <t:1630092220:f> (9 minutes and 59 seconds) (reason: duplicates rule: sent 4 duplicated messages in 10s).
serene scaffold
tidal bough
wha
a wa
 drowsy gale
what can be the reasons that caused i have different value size in x and y for nlp?
arctic wedgeBOT
Pasting large amounts of code
If your code is too long to fit in a codeblock in discord, you can paste your code here:
https://paste.pydis.com/
After pasting your code, save it by clicking the floppy disk icon in the top right, or by typing ctrl + S. After doing that, the URL should change. Copy the URL and post it here so others can see it.
drowsy gale
 desert oar
@drowsy gale can you also post the complete error output?
this looks like it was extracted from a notebook
make sure to restart the notebook and run it from top to bottom
otherwise there might be some old variables hanging around
 quiet vault
does anyone have a grid searching code for multivariate lstm time series predictions
topaz spruce
 novel elbow
apply some erode and dilate, then a threshold
novel elbow
apply some erode and dilate, then a threshold
i did put greyscale->blur->dilate->thresold
topaz spruce
novel elbow
apply some erode and dilate, then a threshold
erode was the thing i did't know about and it seems to work i want
one above is dilated below is eroded

 old meteor
Any idea on how to add parameters to this 'to_numeric' method? df.apply(pd.to_numeric)
 velvet thorn
old meteor
Any idea on how to add parameters to this 'to_numeric' method? ```df.apply(pd.to...
velvet thorn
old meteor
Any idea on how to add parameters to this 'to_numeric' method? ```df.apply(pd.to...
just pass them as keyword arguments to df.apply
e.g. df.apply(pd.to_numeric, errors='coerce')
old meteor
Ah! It's like this! Thanks !
 lapis sequoia
does anyone have experience with pyaudio/ speech recognition
desert oar
@drowsy gale what's the data type and shape of x_train_tok?
it's a list of lists?
it looks like you're implementing glove?
drowsy gale
Ya, and i realize I did the var Y wrong
desert oar
i was going to say, it sounds like you might have just messed up the shape of one of the inputs
 stiff mauve
There is not any computer vision channel
There should be a computer vision channel i want
 swift thorn
I am looking to display a pandas dataframes generated in django as tables in pages and want to refersh the data as it changes in my program can some one help me on that
i am not good in django
 severe dome
anyone help me in #help-cupcake please >.< its on numpy and arrays
 stable briar
How can I write an AI without using libraries like Tensorflow,scikit.leeeern etc. ? I wanna write a library
velvet thorn
stable briar
How can I write an AI without using libraries like Tensorflow,scikit.leeeern etc...
how's your linear algebra
 grave frost
any simple way to get n amount of unique rows everytime from pandas, making sure no duplicate rows are present as a iterable?
[row for row in df.iloc()] would return only 1 row at a time.
not really mission critical, but would love the increase in performance
 flat hollow
grave frost
any simple way to get `n` amount of unique rows everytime from pandas, making su...
flat hollow
grave frost
any simple way to get `n` amount of unique rows everytime from pandas, making su...
what exactly do you mean by duplicate rows? rows with the same index or rows with the same content?
grave frost
flat hollow
what exactly do you mean by duplicate rows? rows with the same index or rows wit...
index
flat hollow
grave frost
index
grave frost
flat hollow
https://pandas.pydata.org/pandas-docs/stable/reference/api/pandas.DataFrame.samp...
how does that ensure that running it multiple times would return exactly different rows
flat hollow
hm... now that I think about it, np.random.choice(..., replace = False) is probably a better solution, this way you should get a unique set of rows since they don't get replaced
grave frost
I was thinking if there was some cleaner and quicker pandas thingy
~~hate pandas 🤬 ~~
 violet zephyr
Is it right place to ask about data analysis?
serene scaffold
violet zephyr
Is it right place to ask about data analysis?
yes
violet zephyr
serene scaffold
yes
What things I should know to do a beginner level project on data analysis?
serene scaffold
violet zephyr
What things I should know to do a beginner level project on data analysis?
you could download a dataset and explore it
violet zephyr
Ok
serene scaffold
there are a lot of datasets on Kaggle
violet zephyr
I was learning pandas earlier
But I dont feel much confident enough in that
How can I improve ?
serene scaffold
violet zephyr
How can I improve ?
do this: https://www.kaggle.com/learn/pandas
Solve short hands-on challenges to perfect your data manipulation skills.
also whenever you feel like the solution to what you are trying to do involves a for loop, don't do it, and look for a method that does it in the docs.
violet zephyr
Yes I need to practice properly now
violet zephyr
serene scaffold
also whenever you feel like the solution to what you are trying to do involves a...
I will keep it in mind
 prime hearth
Hello, I would like to please ask if this is a good roadpath for learning ML and to land an internship as a student?
- Learn feature engineering
- Learn how to clean/visualize data
- create ML algorithms from scratch to practice the math
- practice kaggle ML challenges and put it on github
- Learn about hyper parameter tuning (Grid and K-Fold Crossing
- Learn about different Square error methods or
- Practice with datasets
- Learn natural language processsing
- Learning Deep Learning /neural networks and build small projects with such
I also come from a cs background, so i. have knowledge already of linear algebra, calculus and stats
serene scaffold
prime hearth
Hello, I would like to please ask if this is a good roadpath for learning ML and...
There's a lot of good stuff here, but it's all pretty... broad. For example, one can't just "learn natural language processing". it's a whole subset of AI that is constantly evolving.
prime hearth
your right, i guess i mean just learn the basics or expose myself to it a bit not that i need to be expert in all of these
 dusky abyss
can a neural network with 1 hidden layer having 2 perceptrons solve XOR? can 1 layer with muliple perceptrons solve non linear problems?
serene scaffold
prime hearth
your right, i guess i mean just learn the basics or expose myself to it a bit no...
I would get a dataset from Kaggle, do some manipulations to get a sense for what you can learn from that data, and set up a model using sklearn, or something like that
then you can see how it performs and come up with ideas for what might explain its shortcomings.
prime hearth
oh okay, and do you think overall im heading. in the right direction
 balmy ice
Hello, I have to work on multi level inventory routing problem using Gurobi (it's a python module). I am looking for someone who can help me in this. Anyone interested , please DM me
 junior matrix
Which model can handle more than one label in regression task?
 severe bay
hi how can i download an image from an url?
 topaz oyster
Anyone have any recommendations for reasonably priced (for personal use) or free stock ticker historical data (OHLC fine) APIs? I found one, but I looking to avoid any "need-to-upgrade-plan" irritations.
prime hearth
@junior matrix im pretty sure you can still implement a ML model with more than 1 label
it same process it just called Multioutput regression
so y will be 2 dimensional
 broken warren
for programming a LSTM for time series forecasting is it better to use many to one architecture and prepare the data accordingly or to use one to one architecture. I got a one to one model but it kinda does not work .
 acoustic forge
Is there anyone super good at statistics here? I have two forecasting models:
Model 1: Shows better performance when evaluated on metrics (RMSE/MAE), but shows lack of fit (Ljung-Box test).
Model 2: Shows worse performance when evaluated on metrics, but shows a perfect fit.
Which one would you choose to forecast with?
 vocal crypt
where should i start with data science? i'm interested but i can't seem to find any good videos or free courses. if someone can recommend something it would be appreciated
flat hollow
vocal crypt
where should i start with data science? i'm interested but i can't seem to find ...
kaggle.com is what I like and recommend to people, if you like practicing leetcode-style, try out stratascratch (not easy even with the easy questions!)
vocal crypt
thanks!
 stray quest
vocal crypt
where should i start with data science? i'm interested but i can't seem to find ...
stray quest
vocal crypt
where should i start with data science? i'm interested but i can't seem to find ...
You could buy a Udemy course?
Or youtube. Here's a class:

🔥 Data Science Master Program (Use Code "𝐘𝐎𝐔𝐓𝐔𝐁𝐄𝟐𝟎"): https://www.edureka.co/masters-program/data-scientist-certification
This Edureka Data Science Full Course video will help you understand and learn Data Science Algorithms in detail. This Data Science Tutorial is ideal for both beginners as well as professionals who want to master Data Science...

Learn Data Science is this full tutorial course for absolute beginners. Data science is considered the "sexiest job of the 21st century." You'll learn the important elements of data science. You'll be introduced to the principles, practices, and tools that make data science the powerful medium for critical insight in business and research. You'l...
If you don't know how to program at all, I would try a beginner programming course first.

This course will give you a full introduction into all of the core concepts in python. Follow along with the videos and you'll be a python programmer in no time!
Want more from Mike? He's starting a coding RPG/Bootcamp - https://simulator.dev/
⭐️ Contents ⭐
⌨️ (0:00) Introduction
⌨️ (1:45) Installing Python & PyCharm
⌨️ (6:40) Setup & Hello Wor...
stray quest
acoustic forge
Is there anyone super good at statistics here? I have two forecasting models:
Mo...
Model 1. It seems like Model 2 might be overfitted.
stray quest
grave frost
~~hate pandas 🤬 ~~
Why?
Is it because of variable names as character strings? Because of the double brackets everywhere?
grave frost
stray quest
Why?
Is it because of variable names as character strings? Because of the doubl...
I just don't find it as intuitive and versatile as numpy, or working with tensors
also since I rarely use pandas, ig I don't really know any of its advanced stuff
stray quest
Yeah, I understand what you mean
vocal crypt
@stray questThanks. I do know how to program, i just need AI stuff. Thanks again for the sources.
stray quest
vocal crypt
<@!837519450957807636>Thanks. I do know how to program, i just need AI stuff. Th...
No problem. In that case, this might be better.

Learn how to use TensorFlow 2.0 in this full tutorial course for beginners. This course is designed for Python programmers looking to enhance their knowledge and skills in machine learning and artificial intelligence.
Throughout the 8 modules in this course you will learn about fundamental concepts and methods in ML & AI like core learning alg...
vocal crypt
stray quest
No problem. In that case, this might be better.
https://www.youtube.com/watch?v...
gratitude.
prime hearth
also for datascience projects and practical projects you can use techwithtim python course and also kaggle website as they do competitions and you can practice ML
I personally find that udemy courses are great in giving that mentor guide as they give an outline. But if you can, I would recommend not buying as the topics that they. cover can usually just be learned from those youtube videos above
 main pelican
stray quest
main pelican
stray quest
https://github.com/murari023/awesome-aerial-object-detection
https://www.sciencedirect.com/science/article/abs/pii/S1350449521001687
Quick search didn't find anything premade

GitHub
A curated list of papers for object detection in aerial scenes and related application resources - GitHub - murari023/awesome-aerial-object-detection: A curated list of papers for object detection ...
Perhaps look into RetinaNet
https://developers.arcgis.com/python/guide/how-retinanet-works/
violet zephyr
Hey is data structures required for a data scientist or analyst ?
Shall I focus on them more ?
desert oar
not really
spend your time on statistics, data visualization, excel, sql, and pandas
a basic understanding of data structures can help write faster data processing code if you end up needing to process a larger number of data points (10 million+)
 sudden delta
wrt writing code, numpy is the foundation of handling data in python, used by pandas, scipy, etc.
crazy how much speed difference switching up numpy syntax can make
desert oar
yep
also i just found out that pandas .loc accepts callables now
!e ```python
import pandas as pd
y = pd.Series(range(20))
print( y.loc[lambda series: series > 10] )
@desert oar :white_check_mark: Your eval job has completed with return code 0.
001 | 11    11
002 | 12    12
003 | 13    13
004 | 14    14
005 | 15    15
006 | 16    16
007 | 17    17
008 | 18    18
009 | 19    19
010 | dtype: int64
that could be really handy for re-using filtering logic
y.loc[foo] is basically shorthand for y.loc[foo(y)] when foo is callable
junior matrix
does anyone here use evalML?
violet zephyr
desert oar
not really
Ok
 sage stirrup
Hi guys!, I'm trying to run PointCNN (https://github.com/yangyanli/PointCNN)
I'm trying to get my hands on Tensorflow 1.6 for that, but can't, I need to get it at an AWS ec2 instance, any advice?

GitHub
PointCNN: Convolution On X-Transformed Points (NeurIPS 2018) - GitHub - yangyanli/PointCNN: PointCNN: Convolution On X-Transformed Points (NeurIPS 2018)
And, anyone had luck with a good library for human pose detections?, tried detectron2, and while it's good, I can't understand the output because the doc is lacking
I tried to run VG16 and had better time with it.
I'm trying to detect a "series" of events, let's say a hand wave, and detect that a video of a person is actually preforming that action (just an example ofc)
was thinking on RNN with CNN or something like that 😛
will be glad to any advice
velvet thorn
desert oar
also i just found out that pandas `.loc` accepts callables now
WTF!
this is quite cool but also a bit 🥴
 vital finch
Hello, so I have a new idea as I am studying machine learning for an IBM certification. This is my story: I have a rare and fatal neurodegenerative disease called Huntington's Disease (among other problems) that has ransacked my entire family killing most of my moms side of the family. My mom currently is dying from the disease and I have a CAG of 43 which is two counts less than my mom. This has moved me to the idea of trying to use several libraries such as Tensorflow to try and predict the outcome of the disease for a person with a certain CAG count/ family history, etc. I am going to try and collect datasets for training and evaluating my models, starting with a linear model because I believe that this would be the most accurate for my project. My question is, since it is a probability / estimation type project if I am on the right hunch that a Linear model would be best for executing my project? I am still learning about ML and if you have any information that could possibly help me in this project it would mean a lot to myself and the Huntington's Disease community. If not a linear model, what model would be best? This is not a simple project that I can just pull out of my tophat in a week or even a few months, it will take several months to even a year or so to get everything fully functional and maybe even longer to improve my accuracy constantly as I want this to be as precise as possible. Although I know there is pretty much no 100% accurate model, I think this could at least shed light on a general picture of helpful information for us who suffer from this disease... thank you so much ahead of time, I really appreciate it.
Or, would classification algorithm/models be better for this sort of thing?
I am still learning ML by the way, so please be easy with me lol
lapis sequoia
Guys, i would like to create drop-down graph/app in python for schedulling tasks (blocks) for the week days. Do anybody know how to create such a interactive graph similar to that one? I am fimiliar with plotly - http://strml.github.io/react-grid-layout/examples/1-basic.html
prime hearth
@vital finch oh sorry to hear that. Hm, from what i am learning, there is a machine learning model process:
-idetify the problem
-collect data
-clean data/ visualize as well
- select models
-train data
-review model
-repeat
so for your case, it would be good idea to try to visualize the relationship via graph withs seaborn counterplot or can use matplotlib plot library to see the data and if any redudancy or irrevelant data or outliner
as this will affect our model
then usually , there is a an approach in machine learning where you just select based on your data and the relationship and problem you just iterate. through different machine learning algorithms or models. So you would run Linear Regression, Logistic regression, K classifiers, random tree etc. and use metrics library. to analyse the accuracy. and. chooose the best model
something like this:
models = [LinearRegression(),LogisticRegression(),SVM(),DecisionTree(depth=2)...]
for model in models:
  print_model(model)
def print_model(model):
  print("accuracy: {}",metrics.accuracy(model))...
something like this but there is more to it though it simple can look it up
then you can print the results via graph and select best model
severe dome
Hello! Is it better to use image generators than loading the images in a numpy array? For Jupyter NN thanks!
lapis sequoia
import pandas as pd
import matplotlib.pyplot as plt
air_quality = pd.read_excel("air_quality.xlsx", index_col=0, parse_dates=True)
print(air_quality.head)
print(air_quality.plot())
I'm new to datascience and such and I was wondering why this wasn't displaying any sort of graph
 patent scaffold
Hello all... It's urgent. I'm trying to create a predictive text generator using LSTM and I'm facing an error - AttributeError: 'Sequential' object has no attribute 'predict_classes'
Please somebody help me out here. It's urgent! I'm a newbie
lapis sequoia
lapis sequoia
```py
import pandas as pd
import matplotlib.pyplot as plt
air_quality = pd.read_...
Never Mind I got everything working
grave frost
vital finch
Hello, so I have a new idea as I am studying machine learning for an IBM certifi...
The ML part would be the easiest - you can post competitions for free on kaggle where thousands of PhDs and other like-minded experts can research and provide algorithms for state-of-the-art accuracy.
The bottleneck is always data. The most important part (and the most difficult) is getting the data - the more the quantity, the better. quality matters too, so take factors that you have an intuition that would actually impact the outcome.
you can even compile and collect "multi-modal" data if you manage to get it. This means that per person/family you can have their medical scans, and other relevant image, text or tabular data.
my recommendation is to keep collecting data (compile by searching for datasets, google dataset search[https://datasetsearch.research.google.com/] is a great start) but also keep learning about ML/Deep Learning models simultaneously. Google's ML "crash course" is an A+++ primer for beginners with visualizations and tons of help.
Good luck, and do ask here if you have more questions! 🤗 👍
 glad radish
does anyone know a good book to explore more stuff in regards to gradient boosting?
for reference i read the joel grus data science book and thought it was neat
 bold timber
why i get an error like this? how to handle it?

 ancient galleon
uh, would this be a good place to pose opencv questions as well?
 lusty coral
ancient galleon
uh, would this be a good place to pose opencv questions as well?
lusty coral
ancient galleon
uh, would this be a good place to pose opencv questions as well?
what did you wrote to get this exception?
ancient galleon
Uh wrong person @lusty coral
 hushed horizon
Anyone know why I'm getting this error? Cant seem to get an answer anywhere else.
import bs4
from urllib.request import urlopen as uReq
from bs4 import BeautifulSoup as soup
my_url = 'https://www.newegg.com/p/pl?d=graphics+cards'

#opening up connection, grabbing the page
uClient = uReq(my_url)
page_html = uClient.read()
uClient.close()

#grabs header tag
#page_soup.h1

#grabs span inside body tag
#page_soup.body.span

page_soup = soup(page_html, "html.parser")

#grabs each product
containers = page_soup.findAll("div",{"class":"item-cell"})

#len(containers)

#container = containers[0]
#container.a
#container.div
#container.div.div
#container.div.div.a
#container.div.div.a.img["title"]

filename = "products.csv"
f = open(filename, "w")

headers = "brand, product_name, shipping\n"

f.write(headers)

for container in containers:
    brand = container.div.div.a.img["title"]

    title_container = container.findAll("a", {"class":"item-title"})
    product_name = title_container[0].text

    shipping_container = container.findAll("li",{"class":"price-ship"})
    shipping = shipping_container[0].text.strip()

    print("brand: " + brand)
    print("product_name: " + product_name)
    print("shipping: " + shipping)

    f.write(brand + "," + product_name.replace(",", "|") + "," + shipping + "\n")

f.close()```my_first_webscrape.py", line 39, in <module>
brand = container.div.div.a.img["title"]
TypeError: 'NoneType' object is not subscriptabl``` hoary wigeon
hushed horizon
```py
import bs4
from urllib.request import urlopen as uReq
from bs4 import Beau...
hoary wigeon
hushed horizon
```py
import bs4
from urllib.request import urlopen as uReq
from bs4 import Beau...
what is "title" ? brand = container.div.div.a.img["title"]
hoary wigeon
hey i tried ur code
it ran good for 2 iteration
and img tag is missing in 3rd set
hoary wigeon
hushed horizon
<@!366283102462541865>
@hushed horizon
quiet vault
Does anyone have a gridsearching framework for multivariate data
hushed horizon
@hoary wigeon wow very Interesting... good find. I checked a few of them, but didn't think to check the one right after.
 crystal jewel
Guys does anyone have experience with seaborn? I have some issues with it in pycharm :<
lapis sequoia
Hi guys, quick question regardin MAE vs RMSE. I did price prediction of products using support vector regression (SVR). On test set I received MAE: 1.865 and RMSE: 3.604. So MAE implies that the distance between the predicted price and actual price is on average off with approximately 1.865 units. How can I explain the finding of RMSE in human terms?
grave frost
lapis sequoia
Hi guys, quick question regardin MAE vs RMSE. I did price prediction of products...
humanly, MAE is more simpler. I have seen people train using complicated objectives, but present results in MAE
 lofty swallow

omfg
it's still running
what do I do
my cpu is burning
1 hour
How do I break the runtime
 pearl heart
flat hollow
lofty swallow
pearl heart
flat hollow
lofty swallow
try pressing I twice
flat hollow
if it doesnt work, Kernel -> interrupt (at the top in the menu)
hushed horizon
@hoary wigeon how could I write for that exception so it doesn't break the loop?
lofty swallow
so, does this warning matter in terms of my prediction?

I think it matters
what do I do
lofty swallow
what's happening, why do I have so many NAN for the scores, any idea?

oh I solved it
flat hollow
seems like one column had more values than the rest so others got filled with nan

 flat hollow
lofty swallow
flat hollow
lofty swallow
if you print the output of the right-side of the code (.mode() stuff), what do you get
 lofty swallow
lemme check each of the column's mode
lofty swallow
flat hollow
try without axis=1
 flat hollow
well that's not very useful
lofty swallow
werid, each column's mode looks fine
 flat hollow
when concatenating the lists, what are their lengths?
if they are all the same length, then perhaps ignore index when concatenating
 flat hollow
if you do mode on that nice DF without NaNs, what do you get
lofty swallow
which one
oh, it turned out that IsolationForest has 41xxx data, which is the one that is raw
so I reruned ISOFOR with the scaled data

something's wrong
velvet thorn
lofty swallow
what are you trying to do

 white venture
anyone know how to turn an image into a matrix?
I am using a tensorflow dataset and I try appending the elements of the dataset to create a matrix but it gives me an error saying "too many values to unpack expected 2"
If anyone can help me, that would be greatly appreciated, I will go into more detail about my problem if there is someone who can help me
desert oar
vital finch
Hello, so I have a new idea as I am studying machine learning for an IBM certifi...
If you have the medical history for each family member, you can build a statistical model. "Machine learning" techniques probably aren't going to be very effective for your small sample sizes. You will want to focus on traditional statistics and probability modeling, particularly Bayesian statistics, which can perform very well on small samples. Also I am very sorry to hear that.
The core of these models tends to be a linear model, but the focus is on estimating probability distributions and taking into account uncertainty in assumptions and measurement. Traditional "loss minimization" machine learning works well if you have a large dataset and there is relatively little uncertainty in the relationships within the data.
lofty swallow
As my research turned out
The detection from PLCO dataset is not better than flipping a coin
 lofty swallow
bruh, what is happening, any idea?
 vital finch
grave frost
The ML part would be the easiest - you can post competitions for free on kaggle ...
vital finch
grave frost
The ML part would be the easiest - you can post competitions for free on kaggle ...
Thank you so much! I appreciate it so much! I am now working with a team of academics and scientists from a university out of Illinois and we have decided to do a full on study for the ML model I will be developing so this is an AMAZING opportunity! They will be providing me with the family data down to the DNA/RNA results and we plan to do a different study than IBM did which was with image classification of MRIs. Our goals are also different from IBM as they are trying to figure out how to treat HD, we are trying to find out how to predict symptom progression and hopefully one day mortality range (approximate) this could help companies like IBM have a "gameplan" in treating people like me! So it's really important research. I have a presentation due next Saturday to about 60 academics, researchers, scientists, and volunteers. This is crazy, I didn't quite expect my project to blow up especially since it was just a random idea and I am just starting out with AI BUT I will be working with a team of advanced AI Engineers to fully develop my theory and my own model into something that is FULLY applicable and implementable in the field of HD research! If you'd like to link up and chat about things, I'd love to pick your brain and see what ideas you have or what knowledge you can share with me, I really appreciate it. I will also look on Kaggle as well, the more data the better right! We will also be pulling even more records from Enroll-HD's datasets on top of what the University will be providing for me, so this is EXTREMELY exciting! Thank you so much!
Also, the university wants to set up a study to get volunteer data as well for the prediction dataset. So that makes my life 2304982340239842308942398 times easier! It's crazy this went from a little 3am idea to something way beyond my imagination in a span of like 18 hours.
vital finch
desert oar
If you have the medical history for each family member, you can build a statisti...
Hey thank you! That's an excellent idea, I think I could take this idea especially in the research and presentation phase to help me provide data to the university I will be working with. 😄
Also the university I will be working with is Southern Illinois University Edwardsville, with Doctor Christopher Pearson and other academics/scholars etc.
 azure cairn
lofty swallow
bruh, what is happening, any idea?
azure cairn
lofty swallow
bruh, what is happening, any idea?
missing closing ) in line 1 that causes syntax error in line 2
 dusty cloud
Hi all, which is the easiest library or pkg that can convert pandas df or something into some format which can be seamlessly displayed on web pages like with interactability like D3js or any other library thats built on top of it
 iron basalt
dusty cloud
Hi all, which is the easiest library or pkg that can convert pandas df or someth...
iron basalt
dusty cloud
Hi all, which is the easiest library or pkg that can convert pandas df or someth...
 lone drum
I have pandas data frame having date and time columns in it
For each date and time there are corresponding 4 more columns
I want to find min and max for each column
My date and time column is this way
Date                       time
09-Mar-20          09:34
09-Mar-20          09:47
09-Mar-20          09:59
09-Mar-20          10:12
09-Mar-20          10:47
09-Mar-20          15:10
09-Mar-20.         15:29

09-Mar-20.         09:39
09-Mar-20          09:49
09-Mar-20.         10:47
09-Mar-20.         10:59 ```
this wayIf u see i have some time is repeated after time 15:29
I have to group by per hour
Ping me when replying
 sharp marsh
i love AI
velvet thorn
lone drum
For each date and time there are corresponding 4 more columns
don’t get this part
velvet thorn
dusty cloud
Hi all, which is the easiest library or pkg that can convert pandas df or someth...
dash?
lone drum
velvet thorn
don’t get this part
Hello
I have date , time, open , high , low , close columns @velvet thorn
I have to find min and max for each column based on condition
Now u get my point?
Ping me when u reply
velvet thorn
lone drum
I have to find min and max for each column based on condition
what condition
where are the columns then

 lone drum
If u see in ss for date 09 Mar 20
Please check last row
Same and same time is repeated
So in first part of that time of 13:24
13:32
This will be my next_curr data
And
Later 13:32 is my far_next_data
So I have to find separately min and max @velvet thorn
velvet thorn
tbh I still don't really get what you're saying
you should probably create a small worked example that can be executed
lone drum
velvet thorn
you should probably create a small worked example that can be executed
See i have data and time column
In my data I have first my next_curr data
And then I have
Far_next data
So I have to calculate min and max for each date hourly
velvet thorn
lone drum
See i have data and time column
In my data I have first my `next_curr data`
And ...
In my data I have first my next_curr data
And then I have
Far_next data
I have no idea what this means
So I have to calculate min and max for each date hourly
or how this is related
velvet thorn
velvet thorn
> So I have to calculate min and max for each date hourly
or how this is related
this part is simple though
lone drum
My date and time column is this way
Date                       time
09-Mar-20          09:34.   next_cur data
09-Mar-20          09:47 next_cur data
09-Mar-20          09:59
09-Mar-20          10:12
09-Mar-20          10:47
09-Mar-20          15:10
09-Mar-20.         15:29

09-Mar-20.         09:39 far_ next_data
09-Mar-20          09:49
09-Mar-20.         10:47
09-Mar-20.         10:59
this way
Now u get @velvet thorn
Now I have to find min and max for next cur data
And
Far next data separately
U their ?
velvet thorn
lone drum
Now u get <@171929073063297024>
nope.
like by "worked example"
I mean, like, sample (small) datasets and an expected result that can be copy-pasted
I honestly don't think anyone can understand what you're trying to do without that
lone drum
See i have a CSV file which has
Data and time column
For some dates I have
Next_curr data
And
Far_next data
If time is repeated after 15:29 for a particular date then it will calculate it separately min and max
velvet thorn
velvet thorn
I mean, like, sample (small) datasets and an expected result that can be copy-pa...
if you don't wanna do this, nobody will get you (my guess)
 simple mirage
I'm not really big on data science in general myself, just trying to give someone a suggestion in how to prevent race conditions.
took me like 15 minutes to get to the right page in the docs, is pyplot.plotting() the correct function to create a local instance of a plot?
pyplot seems to use a global instance by default, which could lead to race conditions in applications like async bots
velvet thorn
simple mirage
I'm not really big on data science in general myself, just trying to give someon...
...plotting...?
you mean plot?
simple mirage
https://matplotlib.org/stable/api/pyplot_summary.html#matplotlib.pyplot.plotting
this is what i found in the docs, is it not correct?
velvet thorn
simple mirage
I'm not really big on data science in general myself, just trying to give someon...
hm but if you're using async
you will only ever yield in user code
so at no point should mpl ever be in an invalid state
no?
velvet thorn
simple mirage
https://matplotlib.org/stable/api/pyplot_summary.html#matplotlib.pyplot.plotting...
actually
this doesn't appear to do anything that I can tell
looking @ the source
I'm not sure if it exists solely for documentation? 🥴
simple mirage
ideally, yes, but i feel a proper OOP approach of create instance - add data - save is better than rcdefaults - add data - save, while remembering to never await between rcdefaults and save
velvet thorn
it's just
def plotting():
    pass
hm I would say it would be better to change defaults once
on startup
and everything else should be configured on an Axes/Figure level?
but yeah you can't change the reliance on certain global state I guess (AFAIK)
simple mirage
again, i'm not super familiar with matplotlib, this is just the code a user came for non-matplotlib help with
velvet thorn
simple mirage
again, i'm not super familiar with matplotlib, this is just the code a user came...
is this in a help channel?
I can take a look
simple mirage
it was actually in the dpy #python-help channel
but i think i've wrapped my head around the structure. it seems the approach would be something like this?
fig = plt.figure()
axes = matplotlib.Axes()
axes.pie(...)
fig.add_axes(axes)
fig.savefig()
hm
generally it's idiomatic to use subplots
fig, ax = plt.subplots()

ax.plot(...)

fig.savefig()
so that doesn't leave it attached to the global pyplot instance?
maybe i haven't wrapped my head around it
so it seems i had that mixed up with subplot
i'll toy around with it a bit, thanks
lapis sequoia
simple mirage
so that doesn't leave it attached to the global pyplot instance?
What do you mean by this?
you mean plt.something?
simple mirage
i'm getting some weird results.
i did this once, but used show and savefig, del'd fig and ax, ended up with 0 axes in the global figure (top of this block)
but second time they stick around? or is gcf giving me the fig i just del'd instead of the global one? did the fig returned by subplots become the new global figure? or am i misunderstanding and there is no "global" figure?
>>> plt.gcf()
<Figure size 640x480 with 0 Axes>
>>> fig, ax = plt.subplots()
>>> plt.gcf()
<Figure size 640x480 with 1 Axes>
>>> ax.pie([1,2,3])
([<matplotlib.patches.Wedge object at 0x0000021807FBD8B0>, <matplotlib.patches.Wedge object at 0x0000021807FDFA90>, <matplotlib.patches.Wedge object at 0x0000021807FDFE50>], [Text(0.9526279355804298, 0.5500000148652441, ''), Text(-0.5500000594609755, 0.9526279098330699, ''), Text(1.0298943251329445e-07, -1.0999999999999954, '')])
>>> plt.gcf()
<Figure size 640x480 with 1 Axes>
>>> del fig, ax
>>> plt.gcf()
<Figure size 640x480 with 1 Axes>
pretty sure n_row and n_columns is a requirement to specify
but i think it defaults to 1x1
yeah defaults to 1x1
simple mirage
just need to plt.close(fig) to properly dispose of it. i guess somehow it just wasn't garbage collected there, maybe something weird with the repl
 umbral gull
I have the following data:
date    category    sales
0    2021-07-08    Wearables    814.82
1    2021-07-08    phone    156236.70
2    2021-07-08    watch    156236.70
3    2021-07-02    watch    14649.70
4    2021-07-02    electronics    65000.00
I want to perform groupby on category column such that I get the results for the corresponding date and sales columns in the following manner:
"wearables": {"date": 2021-07-08, "sales": 814.82}
lapis sequoia
simple mirage
just need to `plt.close(fig)` to properly dispose of it. i guess somehow it just...
 i completely forgot about that function haha
flat hollow
umbral gull
I have the following data:
```
date category sales
0 2021-07-08 Wear...
I don't understand what is the goal of your groupby? Are you getting the max value for each category or what do you want to do?
velvet thorn
simple mirage
i'm getting some weird results.
i did this once, but used `show` and `savefig`, ...
oh sorry
I misunderstood you
there is never really a global figure
it’s just that MPL offers the pyplot state machine approach to plotting for MATLAB users
and yeah GC is a bit weird around MPL
 dull oar
hey, someone here who could help me with a Question about Scrapy? I send a Request but in my output ist the URL instead of the requested content
simple mirage
velvet thorn
there is never really a global figure
so what's considered the "current" figure returned by gcf? is it just the most recently accessed/created/modified figure?
or is it more that if you need to think about it, you should be using fig.whatever instead of plt.whatever
velvet thorn
simple mirage
or is it more that if you need to think about it, you should be using `fig.whate...
yes
velvet thorn
simple mirage
so what's considered the "current" figure returned by `gcf`? is it just the most...
as far as I can tell, yes
it's really not something I like to work with
simple mirage
i assume users aren't meant to use it directly, it just happens to be exposed. all the plt.X methods use it to get the figure to operate on
hidden/global/"magic" state always messes with my brain. normal make thing -> use thing just makes so much more sense to me
glad i we got it worked out in the end, thanks again
velvet thorn
simple mirage
i assume users aren't meant to use it directly, it just happens to be exposed. a...
they are, AFAIK?
same as gca
in the sense that if you're using the state machine API you might as well do that
but you probz shouldn't
 slate tree
OSError Traceback (most recent call last)
~\AppData\Local\Temp/ipykernel_16404/572880994.py in <module>
----> 1 import spacy
~\AppData\Roaming\Python\Python39\site-packages\thinc\initializers.py in <module>
2 import numpy
3
----> 4 from .backends import Ops
5 from .config import registry
6 from .types import FloatsXd, Shape
~\AppData\Roaming\Python\Python39\site-packages\thinc\backends\__init__.py in <module>
5 import threading
6
----> 7 from .ops import Ops
8 from .cupy_ops import CupyOps, has_cupy
9 from .numpy_ops import NumpyOps
~\AppData\Roaming\Python\Python39\site-packages\thinc\backends\ops.py in <module>
8 from ..types import FloatsXd, Ints1d, Ints2d, Ints3d, Ints4d, IntsXd, _Floats
9 from ..types import DeviceTypes, Generator, Padded, Batchable, SizedGenerator
---> 10 from ..util import get_array_module, is_xp_array, to_numpy
11
12
~\AppData\Roaming\Python\Python39\site-packages\thinc\util.py in <module>
25
26 try: # pragma: no cover
---> 27 import torch
28 from torch import tensor
29 import torch.utils.dlpack
~\AppData\Roaming\Python\Python39\site-packages\torch\__init__.py in <module>
122 err = ctypes.WinError(last_error)
123 err.strerror += f' Error loading "{dll}" or one of its dependencies.'
--> 124 raise err
125 elif res is not None:
126 is_loaded = True
OSError: [WinError 127] The specified procedure could not be found. Error loading "C:\Users\home_\AppData\Roaming\Python\Python39\site-packages\torch\lib\cublas64_11.dll" or one of its dependencies.```
How can I solve this `OSError` while import `spacy` library. uncut barn
does anyone have experience using the openslide python module or have any resources linked to it other than the docs?
serene scaffold
I found this terrible code in a book:
def positional_encoding(pos,pe):
for i in range(0, 512,2):
         pe[0][i] = math.sin(pos / (10000 ** ((2 * i)/d_model)))
         pe[0][i+1] = math.cos(pos / (10000 ** ((2 * i)/d_model)))
return pe
Syntax error aside, I'm pretty sure this is the same thing but better?
def positional_encoding(pos, pe):
    pe = pe.copy()
    ascending = np.arange(512 // 2)
    value = pos / (10_000 ** ((2 * ascending) / d_model))
    pe[0, ::2] = np.sin(value)
    pe[0, 1::2] = np.cos(value)
    return pe
 burnt prawn
I have been working on this, can you please do me a favour and have a look at this https://www.kaggle.com/neomatrix369/studying-the-limitations-of-stats-measurements/ and give me some constructive comments, if possible put some comments in the comments section of the notebook.
If something isn't clear or is incorrect then please also let me know. I'm sure you are aware of coefficient correlation and other stats functions that have shortcomings, I'm slowly exploring them.
Feel free to share it with your #datascience friends as well, since the ideas in the notebook are fairly fresh but also at an early stage.
PS: take your time with it, but all notes and comments on it will greatly help all parties concerned

Explore and run machine learning code with Kaggle Notebooks | Using data from no data sources
grave frost
That is superb man!! Really good luck on the presentation - and send us a link while you are at it! 👍
I'd love to pick your brain and see what ideas you have or what knowledge you can share with me
Absolutely, my DMs are always open 🙂
Also, the university wants to set up a study to get volunteer data as well for the prediction dataset. So that makes my life 2304982340239842308942398 times easier!
That sounds like a pretty neat idea - Hopefully you also have fun in this whole journey and learn a lot.
Godspeed 
desert oar
burnt prawn
I have been working on this, can you please do me a favour and have a look at th...
interesting stuff. you're working on these new correlation coefficients for time series?
 west lava
I have a quick Pandas column assignment question.
What does to_numpy() actually do and why is it required to make my column assignment work?
print(df_api["url"].str.split(":", expand=True))
1  server1.fully-qualified-name.com  1234
2  server2.fully-qualified-name.com  5678
3  server3.fully-qualified-name.com  8080

df_new[["hostname", "url"]] = df_api["url"].str.split(":", expand=True)

1  NaN  NaN
2  NaN  NaN
3  NaN  NaN

df_new[["hostname", "url"]] = df_api["url"].str.split(":", expand=True).to_numpy()

1  server1.fully-qualified-name.com  1234
2  server2.fully-qualified-name.com  5678
3  server3.fully-qualified-name.com  8080
- it literally constructs a numpy array from the data
- i've had issues with this in the past, assigning to multiple columns when some of the columns might or might not exist. as a workaround i usually just do a for loop over the columns and assign one at a time
does the hostname columns exist currently or are you creating it here?
west lava
desert oar
does the `hostname` columns exist currently or are you creating it here?
Both columns already exist - I define this df before using it.
df_new = pd.DataFrame(columns=[list-of-columns])
But even single column assignment has this issue. So for example, ignoring why I need to do this -
print(type(df_new))
<class 'pandas.core.frame.DataFrame'>

df_new["db_location"] = df_api["db_location"]
1 NaN
2 NaN
3 NaN

df_new["db_location"] = df_api["db_location"].to_numpy()
1 USA
2 EUR
3 GER
@west lava can you provide some sample data
west lava
desert oar
<@!213843393829273602> can you provide some sample data
Sure can give me a few to put it together.
lapis sequoia
anyone familiar with gaussian smoothing
serene scaffold
lapis sequoia
anyone familiar with gaussian smoothing
I am not, but it may be just as well that you tell us what you want to know about gaussian smoothing. someone here probably can help 
serene scaffold
lapis sequoia
and sorry!!
No problem! I just try to let people know that skipping the "ask to ask" helps you get help even faster 😄
 dull turtle
i am working with pandas dataframe
i have my data in such a way my next_cur_data at beggining and after 15:29 hours i have far_next_data
my data in csv file is such a way that suppose for a date i have first next_cur_data this which from 09:15 to 15:29 and far_next_data this which is from 09:15 to 15:29 only for some date i have far_next_data this
my data this way

please ping me when u reply
@velvet thorn can we discuss here ?
velvet thorn
dull turtle
<@!171929073063297024> can we discuss here ?
stop pinging me...
dull turtle
velvet thorn
stop pinging me...
can u please help me in this ?
i will explain u my problem again
can u just look at the issue ?
velvet thorn
dull turtle
can u please help me in this ?
I'm busy
dull turtle
do u get my point what i am trying to do ?
serene scaffold
@dull turtle I saw that you pinged me earlier about this question. I am busy as well. Keep in mind that we are all volunteers with jobs and other obligations.
I have to ask that you not ping people who you aren't actively speaking to in the future.
serene scaffold
It's not likely that I will have time to help today. You may have to wait for someone to be available.
serene scaffold
I will ping you in the unlikely circumstance that I become available, yes.
dull turtle
so we can discuss
prime hearth
hello, i am using linear regression and only have 1 feature and 1 label so initially i have 1 theta or weight (y=mx) but i was wondering please if anyone could explain me why am i getting 4 weights at the end with this formula i implemented (linear regression gradient formula for updating weights/theta):
weights = weights - learning_rate * (1/m) *np.dot(x.T,y_predicted-y_expected)
I can understand that this is frustrating for you. While you wait, you might try doing the Pandas tutorial on Kaggle @dull turtle
prime hearth
intiially i have weight [0] but at the end when i print weights i get 4 values [[0.01, 0.001, 0.003 0.003]]
this is how i intialized my weights:
weights = np.zeros((x_train.shape[1],1)) # returns [[0]]
Okay so for some reason on my local machine I cannot reproduce this - this code works totally fine.
import pandas as pd

data = [
    {"location": "USA", "url": "server1.fqdn.com:1234"},
    {"location": "GER", "url": "server2.fqdn.com:5678"},
    {"location": "EUR", "url": "server3.fqdn.com:8080"},
]

df_api = pd.json_normalize(data)


df_new = pd.DataFrame(columns=["location", "hostname", "port"])
df_new["location"] = df_api["location"]
df_new[["hostname", "port"]] = df_api["url"].str.split(":", expand=True)

print(df_api)
print(df_new)
  location                    url
0      USA  server1.fqdn.com:1234
1      GER  server2.fqdn.com:5678
2      EUR  server3.fqdn.com:8080
  location          hostname  port
0      USA  server1.fqdn.com  1234
1      GER  server2.fqdn.com  5678
2      EUR  server3.fqdn.com  8080
what happens on local machine
west lava
On my other machine (running same version of Python & same version of Pandas) I get this (unless I add to_numpy() to the end of each line) -
  location  hostname    port
0      NaN      NaN      NaN
1      NaN      NaN      NaN
2      NaN      NaN      NaN
which software does that code work fine in
west lava
Python 3.8.5 and Pandas 1.3.2 - is that your question?
prime hearth
yeah and also was wondering if using like google notebook or jupiter
hm i not sure actually
but maybe it might be something with how it is set up the libraries and package
you can try specifcy the type maybe
as string since NaN is for integer
so it look like it trying to parse strings as integers
if you change the values to numbers you will see that it works
to_nump() i think it sorta by passes this
which why it works, so by default it. trying to parse
 cerulean glade
Hi does anyone know why i'm getting this error.
data = plt.imread('...') btw

it's alright it got fixed
I used np.copy(data)
 bleak scroll
Hello, I have a problem i'm trying to solve in python but don't really see a good solution for it.
I have some ~8M line of data, and i need to apply conditions based on several columns to output either 1 or 0 in a new column, EG: There a Doc Type columns, which has 33 distinct types and each has a specific condition, based on other columns.
is there a pythonic/fast way of writing this or do i have to hard code 33 different conditions?
To provide more context, i have the conditions in another file which i can import. So i was hoping i code pass those into a function
Conditions look like this, as i have attempted it currently
df_raw.loc[((df_raw['DOC_TYPE_SUBTYPE'].isin(['DOC_TYPE'])) & (((df_raw['Col1'] >=25) & (df_raw['Col2'] >=120) & (df_raw['Col3'] >=60)) | (df_raw['Col4'] ==1) | (df_raw['Col5'] == 1) | (df_raw['Col7'] == 1))), 'NEW_COL'] = 1
df_raw.loc[((df_raw['DOC_TYPE_SUBTYPE'].isin(['DOC_TYPE2'])) & (((df_raw['Col1'] >=50) & (df_raw['Col2'] >=30) & (df_raw['Col3'] >=20)) | (df_raw['Col4'] ==1) | (df_raw['Col5'] == 1)), 'NEW_COL'] = 1
I was hoping there could be a dynamic way of implementing this
uncut barn
does anyone know how to extract patches from an image?
This is the following code that I have so far, this is using the openslide doc
s_img.read_region((0, 0), 0, (256, 256))```def calc_resulatnt(a, b, c):
return np.sqrt(a**2+b**2+c**2)
df["|Resultant|"] = calc_resulatnt(df.iloc[:,3], df.iloc[:,4], df.iloc[:,5])
``` is this an efficient way to use a vectorised function on a dataframe or is there a better way? I feel like using iloc[] 3 times might not be as good as if I were able to get a dataframe slice with the 3 wanted columns and pass that to the function at once (how?). Am I right or would that not really matter in this case? molten phoenix
hello dear friends! Can you help me with some issue? My core doesn't support sse3 instruction and i can't use numpy. Has anyone faced such a problem? Could anyone solve it?
 quiet vault
So I am creating a model and fitting it multiple times with verbose set as 1 and epochs set to 50
Sometimes the loss (mse) changes drastically and goes down to around 2
and sometimes it just stays over 1k
Does anyone know the cause of this?
arctic wedgeBOT
Hey @quiet vault!
Uh-oh! It looks like your message got zapped by our spam filter. We currently don't allow .txt attachments, so here are some tips to help you travel safely:
• If you attempted to send a message longer than 2000 characters, try shortening your message to fit within the character limit or use a pasting service (see below)
• If you tried to show someone your code, you can use codeblocks
(run !code-blocks in #bot-commands for more information) or use a pasting service like:
 elfin frigate
hello guys
getting 100% on training accuracy isn't too much ?
like wouldn't it be overfitting ?
 1/65 [..............................] - ETA: 0s - loss: 0.0129 - accuracy: 1.0000
14/65 [=====>........................] - ETA: 0s - loss: 0.0252 - accuracy: 0.9911
23/65 [=========>....................] - ETA: 0s - loss: 0.0364 - accuracy: 0.9864
32/65 [=============>................] - ETA: 0s - loss: 0.0449 - accuracy: 0.9814
43/65 [==================>...........] - ETA: 0s - loss: 0.0546 - accuracy: 0.9797
55/65 [========================>.....] - ETA: 0s - loss: 0.0649 - accuracy: 0.9784
65/65 [==============================] - 0s 5ms/step - loss: 0.0647 - accuracy: 0.9790
Epoch 10/10
 1/65 [..............................] - ETA: 0s - loss: 0.1016 - accuracy: 0.9688
13/65 [=====>........................] - ETA: 0s - loss: 0.0735 - accuracy: 0.9832
26/65 [===========>..................] - ETA: 0s - loss: 0.0818 - accuracy: 0.9820
39/65 [=================>............] - ETA: 0s - loss: 0.0728 - accuracy: 0.9832
51/65 [======================>.......] - ETA: 0s - loss: 0.0723 - accuracy: 0.9828
65/65 [==============================] - 0s 4ms/step - loss: 0.0644 - accuracy: 0.9839```probably
if it does a lot worse on the test dataset, then yes
i fixed it
i stopped using relu function
and used tanh instead
 midnight rain
Anyone found a way to serialize a 2d ndarray as in parquet? I can get it into an arrow format using pyarrow tensors, but i can't figure out how to successfully write one to a parquet.
acoustic forge
Can the Macbook M1 Pro run GPT-J? @ me or send me a private message if you know 🙂
midnight rain
am i just stuck with a structure that looks like:
  child 0, item: list<item: int32>
child 0, item: int32```the three tier nesting is super annoying, but i cant find any way around it
i guess the real question is whether or not aws athena is smart enough to parse that back into a more standard looking array when i query it
grave frost
acoustic forge
Can the Macbook M1 Pro run GPT-J? @ me or send me a private message if you know ...
prolly not
 oblique ridge
Hi everyone! I recently had a job interview project for Data Engineering and was hoping someone could help me review the code and see where I could have improved or done something different. DISCLAIMER: The project has already been delivered, I'm asking this to see areas of improvement for either my next interview or if I get the job, to be better at it. Please ping me here or PM if willing to help. Thank you! Let's learn from one another 🙂
 weary robin
Hello y'all, I have a pretty generic question and need some direction on what keywords I can google.
I have a csv file where each row has a date (e.g. 2021-07-15 12:12 :49) and a numeric values as well as a colum determining if it was plus or minus.
Now I want to plot a continuous chart with the respective total balance each day based on a known starting value. Some days are not in the dataset because there was neither gain nor loss.
This seems somewhat basic but I'm a little lost on how what keywords I need.
Any help is appreciated 
Some rows as an example:
110  |currency_gained|2021-07-22 18:09:09|
110  |currency_gained|2021-07-22 18:17:23|
3500 |spend_currency |2021-07-22 18:21:15|
115  |currency_gained|2021-07-22 18:32:57|
110  |currency_gained|2021-07-22 19:17:04|
3500 |spend_currency |2021-07-22 19:20:17|
3500 |spend_currency |2021-07-22 19:21:58|
110  |currency_gained|2021-07-22 19:36:24|
hello, are there any good beginner book recommendations for machine learning that have a balance of theory and application in them?
 tender hearth
Neural Networks From Scratch?
teaches you the theory and how to implement it
although it is just that, neural networks
prime hearth
@lapis sequoia oh hey, are you justarting to learn ML?
lapis sequoia
yes
lapis sequoia
tender hearth
Neural Networks From Scratch?
thank you i’ll look into it
prime hearth
Im learning ML too actually and i found something that helped me have that same balance is just, watching tech with tim youtube his machine learning course is like 6 hours long, but you take it slowly. He shows how to read data , how to set up data and how the algorithms work (he shows about 6 i think which are popular).
And also to see how the calculus, linear algebra and stats applies to the algorithm since most youtube videos show how to implement algos with skearln library so you dont really see how the math is and how it works inside i would watch this youtube channel Coding Lange. He shows how to implement algos from scratch.
lapis sequoia
i see, thanks
prime hearth
Yeah and lastly i would suggest learn how to feature engineer and clean data since thats what you will be doing in any ML field or AI or Neural networks
 tall lance
ConvNets, CNNs, Deep learning, machine learning....
Anyone know why I have these dips in my accuracy and loss? I think it is in sync with the start of each epoch.


forgive me father, for I have sinned
the calculations of accuracy and training loss were taking place when the counter % batch_size == 0 and not counter+1
much better 🙂

 pearl tundra
do you have a library/a way to plot your training accuracy/loss over time? not seeing a way in something like sklearn
tall lance
using TensorBoard

New Tutorial series about Deep Learning with PyTorch!
⭐ Check out Tabnine, the FREE AI-powered code completion tool I use to help me code faster: https://www.tabnine.com/?utm_source=youtube.com&utm_campaign=PythonEngineer *
In this part we will learn about the TensorBoard and how we can use it to visualize and analyze our models. TensorBoard is...
pearl tundra
thanks
lapis sequoia
Hey guys
I'm getting an error while I'm importing the seaborn package


What should I do to fix it??
lapis sequoia
Np issue is resolved
 dire echo
Hi @lapis sequoia
vital finch
Had better idea and more realistic one that got a better reaction from the board, using neural network to predict what stage a person is at in their Huntington's Disease using mHtt biomarker data to train. Much more realistic than my original half ass one, now to prepare for the presentation on Saturday..
 undone lotus
hi guys
do anyone know of any 2 or 3 week courses which provide certification for free
like data analysis or data visualization with python
 orchid adder
vital finch
Had better idea and more realistic one that got a better reaction from the board...
orchid adder
vital finch
Had better idea and more realistic one that got a better reaction from the board...
Good luck!
vital finch
orchid adder
Good luck!
thanks!
grave frost
tall lance
ConvNets, CNNs, Deep learning, machine learning....
Anyone know why I have these...
2 words - tenet and LR
 viscid niche
df = labled_tracks
for ind, left_row in labled_tracks.iterrows():
    for _, right_row in road_info.iterrows():
        if abs(left_row.lat-right_row.lat)<=0.00003 and abs(left_row.lon-right_row.lon)<=0.00003:
            to_append = right_row.drop[['id', 'lat', 'lon']]
            df.loc[ind, to_append.columns] = to_append
how can i make this loop using pandas merge???
serene scaffold
viscid niche
```py
df = labled_tracks
for ind, left_row in labled_tracks.iterrows():
for ...
do you know about SQL joins?
viscid niche
nope
serene scaffold
what columns are in each dataframe? it looks like you want to merge where the values in the latitude column are within 0.00003 of each other.
viscid niche
serene scaffold
what columns are in each dataframe? it looks like you want to merge where the va...
its right df
 serene scaffold
viscid niche
its right df
serene scaffold
viscid niche
its right df
labled_tracks['round_lat'] = labled_tracks['lat'].round(4)
labled_tracks['round_lon'] = labled_tracks['lon'].round(4)
road_info['round_lat'] = road_info['lat'].round(4)
road_info['round_lon'] = road_info['lon'].round(4)

pd.merge(labeled_tracks, road_info, on=['round_lat', 'round_lon'])
left one
 serene scaffold
It seems to me that if you round them to the right decimal place, locations that are close enough to match would end up having equivalent coordinates.
I'm not sure if this is an accepted way of joining tables by coordinates.
viscid niche
serene scaffold
It seems to me that if you round them to the right decimal place, locations that...
then they can differ by 0.00005, it's too much
it's like 6~7 meters
serene scaffold
viscid niche
then they can differ by 0.00005, it's too much
I have no idea what this library does, but it might support the functionality that you need: https://geopandas.readthedocs.io/en/latest/index.html
viscid niche
thanks
 royal moon
So I have a dataset that looks like this:

There are 3 species. How do I convert the Species column to use integers instead of string names?
I know I can just use a for-loop or something but I'm looking for a more general solution so that in the future when I have like 1000 different names in a dataset with 10 million entries I don't have to for-loop over them all
royal moon
I also posted this in a help channel since those seem to get answered pretty fast

 rigid zodiac
Hi guys I need some help if possible. It is in google colab
arctic wedgeBOT
Hey @rigid zodiac!
Uh-oh! It looks like your message got zapped by our spam filter. We currently don't allow .csv attachments, so here are some tips to help you travel safely:
• If you attempted to send a message longer than 2000 characters, try shortening your message to fit within the character limit or use a pasting service (see below)
• If you tried to show someone your code, you can use codeblocks
(run !code-blocks in #bot-commands for more information) or use a pasting service like:
Hey @rigid zodiac!
Uh-oh! It looks like your message got zapped by our spam filter. We currently don't allow .csv attachments, so here are some tips to help you travel safely:
• If you attempted to send a message longer than 2000 characters, try shortening your message to fit within the character limit or use a pasting service (see below)
• If you tried to show someone your code, you can use codeblocks
(run !code-blocks in #bot-commands for more information) or use a pasting service like:
 prisma jay
can anyone explain why the first one returning an error and the second one works?
 hoary wigeon
Hello!
I trained a KNN model for MNist digits, and it is working good
I want to try an image from google to test model
I have downloaded one which is of size (238*238)
i want it in 28*28 so i tried using np.asarray(Image.open('MNIST_6_0.png').resize((28,28))).reshape(1,-1)
But this block of code is returning an array of shape (28,28,2) np.asarray(Image.open('MNIST_6_0.png').resize((28,28))).shape
what is 2 in (28,28,2) ?
 trim latch
I think that is due to the reshape function
hoary wigeon
 hoary wigeon
trim latch
I think that is due to the reshape function
hoary wigeon
trim latch
I think that is due to the reshape function
nope
np.asarray(Image.open('MNIST_6_0.png').resize((28,28))) this part is returning array of shape (28,28,2)
hoary wigeon
there's nothing like shape in PIL
hoary wigeon
i tried installing it
 elfin spindle
This function (image below) is to initialise the weight matrices for an ANN.
Why is it dividing one by the root of the amount of Input Nodes?
What does truncatedNormal() do?
def truncatedNormal(mean=0, sd=1, low=0, upp=10):
    return truncnorm((low - mean) / sd,
                     (upp - mean) / sd,
                     loc=mean,
                     scale=sd)
What does self.wih and self.who mean? And what does .rvs() do?
The article i'm following (https://www.python-course.eu/neural_network_mnist.php) doesn't explain this very well.
 hoary wigeon
It was installed but im not able to use it
trim latch
why
hoary wigeon
opencv-python ?
hoary wigeon
 hoary wigeon
worked
 lyric cradle
Be my friend :)
hoary wigeon
 hoary wigeon
elfin spindle
This function (image below) is to initialise the weight matrices for an ANN.
Wh...
hoary wigeon
elfin spindle
This function (image below) is to initialise the weight matrices for an ANN.
Wh...
call eivl
elfin spindle
hoary wigeon
call eivl
what?
hoary wigeon
@ eivl
trim latch
hoary wigeon
Yah now you can use, right?
hoary wigeon
elfin spindle
This function (image below) is to initialise the weight matrices for an ANN.
Wh...
..
check this
elfin spindle
 summer plover
you can ping me if you see that im available
summer plover
you can ping me if you see that im available
can you help me with this please? #data-science-and-ml message
lapis sequoia
lyric cradle
Be my friend :)
what 😂
hoary wigeon
elfin spindle
can you help me with this please? https://canary.discord.com/channels/2676243358...
self.who is user defined ?
trim latch
hoary wigeon
worked
Try reshaping now
hoary wigeon
trim latch
Try reshaping now
how to read image using cv ?
trim latch
cv2.imread(image path)
hoary wigeon
2152 modules in cv2
rigid zodiac
can some help me with the issue of list index out of range please
elfin spindle
hoary wigeon
self.who is user defined ?
self.who = x.rvs((self.NumOutNodes, self.NumHiddenNodes));
That is how it's defined
rigid zodiac
trim latch
yes
this is my colab here https://colab.research.google.com/drive/1fww7j6WYrlCf-yJXSQrAT6iQy-Z1EUmF?usp=sharing
 rigid zodiac
trim latch
yes
rigid zodiac
trim latch
yes
i think i upload the data in the sample file in there. Can you see it ?
hoary wigeon
who is just storing the output to used by other fucntion within the class
trim latch
rigid zodiac
i think i upload the data in the sample file in there. Can you see it ?
No, I can't see
lyric cradle
lapis sequoia
what 😂
I want friends :) same interests as me
rigid zodiac
trim latch
No, I can't see
the file is a bit big. can I have your gmail so I can share it
lapis sequoia
uh
summer plover
elfin spindle
can you help me with this please? https://canary.discord.com/channels/2676243358...
no sorry, i cant tell what the meaning of that is
hoary wigeon
sorry sir, i thought it was something new
but later i realized that it is user defined
trim latch
rigid zodiac
the file is a bit big. can I have your gmail so I can share it
Do you have it in your drive?
rigid zodiac
yeah I do
trim latch
Just send a "Anyone with the link" link
elfin spindle
summer plover
no sorry, i cant tell what the meaning of that is
hmmm. Okay, well thanks for trying :)
hoary wigeon
 rigid zodiac
trim latch
Just send a "Anyone with the link" link
rigid zodiac
trim latch
Just send a "Anyone with the link" link
Google Docs
trim latch
trim latch
Just send a "Anyone with the link" link
If the data is not confidential
trim latch
rigid zodiac
https://drive.google.com/file/d/1b8KvLoObovW260BIkPjRqFmNfRejyp0t/view?usp=shari...
thanks
rigid zodiac
trim latch
thanks
oh it's not, it just some data from the radar
trim latch
hoary wigeon
So you can see right, the channels are three
hoary wigeon
trim latch
thanks
hey there i found 3 in shape
summer plover
elfin spindle
hmmm. Okay, well thanks for trying :)
it looks like it generates random variates
hoary wigeon
what are channels ?
trim latch
Now reshape it to two dimensions
summer plover
!d scipy.stats.truncnorm
arctic wedgeBOT
scipy.stats.truncnorm = <scipy.stats._continuous_distns.truncnorm_gen object>```
A truncated normal continuous random variable.

As an instance of the [`rv_continuous`](http://docs.scipy.org/doc/scipy/reference/reference/generated/scipy.stats.rv_continuous.html#scipy.stats.rv_continuous "scipy.stats.rv_continuous") class, [`truncnorm`](http://docs.scipy.org/doc/scipy/reference/reference/generated/scipy.stats.truncnorm.html#scipy.stats.truncnorm "scipy.stats.truncnorm") object inherits from it a collection of generic methods (see below for the full list), and completes them with details specific for this particular distribution.

Notes

The standard form of this distribution is a standard normal truncated to the range [a, b] — notice that a and b are defined over the domain of the standard normal. To convert clip values for a specific mean and standard deviation, use:

```py
a, b = (myclip_a - my_mean) / my_std, (myclip_b - my_mean) / my_std
``` [`truncnorm`](http://docs.scipy.org/doc/scipy/reference/reference/generated/scipy.stats.truncnorm.html#scipy.stats.truncnorm "scipy.stats.truncnorm") takes \(a\) and \(b\) as shape parameters.hmm.. it does not say.. try to read more about this topic in the link above @hoary wigeon
trim latch
3 means 3 channels, its a colored image, that is why
trim latch
trim latch
3 means 3 channels, its a colored image, that is why
if it had been grey, then 1 or 1 channel
hoary wigeon
trim latch
RGB
what i can do further ?
trim latch
use opencv to reshape it
hoary wigeon
i want to test my model for 28*28
trim latch
to 28X28
Stack Overflow
I need to convert an image in a numpy array loaded via cv2 into the correct format for the deep learning library mxnet for its convolutional layers.
My current images are shaped as follows: (256, ...
hoary wigeon
rollaxis is used to reshape image ?
trim latch
inv.reshape(img.shape[:2])
try this
and then show the result
for you it will be:
img = cv2.imread(imagepath)
img = img.reshape(img.shape[:2])
hoary wigeon
---------------------------------------------------------------------------
ValueError                                Traceback (most recent call last)
<ipython-input-138-cd016599924c> in <module>
----> 1 im = im.reshape(im.shape[:2])

ValueError: cannot reshape array of size 169932 into shape (238,238)
This is just view permission
I am not able to download it
in colab using wget
trim latch
hoary wigeon
```py
--------------------------------------------------------------------------...
oh sorry
img = img.reshape((28,28))
try this
hoary wigeon
so shall i discard the channel array ?
elfin spindle
summer plover
<@!397773303965548544>
oki thanks
trim latch
if you need the channel then:
28,28,3
hoary wigeon
I MEAN CHANNEL
trim latch
There should be
hoary wigeon
I DONT REQUIRE CHANNEL
trim latch
There is always a shape for every model
trim latch
show me the error
hoary wigeon
img = cv2.imread('MNIST_6_0.png')
img = cv2.cvtColor(img, cv2.COLOR_BGR2GRAY)
img.shape
worked
trim latch
okay
But it changes the color of your image, if you have no problem with that
because then you model also needs to accept gray scale images
trim latch
Show the shape or error
rigid zodiac
trim latch
Show the shape or error
any luck on my issue?
trim latch
Its still running
rigid zodiac
like i'm running it with my jupyter and my sypder non work so far
trim latch
no errors till now
rigid zodiac
ok. like I have run this since last night and it wont work so far
 sand arch
anyone know a good places to learn Manichean learning?
rigid zodiac
coursera or just stick with book
sand arch
okay thanx
rigid zodiac
sand arch
okay thanx
On coursera just click audit
free class but cant take the test thou
lofty swallow
Guys how do I interpret the boxplot result?

Also, this one lol, why they overlap so bad
 rigid zodiac
trim latch
no errors till now
rigid zodiac
trim latch
no errors till now
can you try to run it in different ide? I run it on pycharm,spyder, jupyter all of it come out as index out of bound
rigid zodiac
lofty swallow
Guys how do I interpret the boxplot result?
analyze the spread of it, whether it is normal or not. or ballance or nah
lofty swallow
I want to know what does it say about the model
it overlaps, so what does it mean
does it mean the model's result bad or good
hoary wigeon
rigid zodiac
can you try to run it in different ide? I run it on pycharm,spyder, jupyter all ...
can u provide the error screenshot ?
rigid zodiac
lofty swallow
I want to know what does it say about the model
cant tell to be honest, It seems to be separate and no overlap on the result between 0 (i assume no) and 1
hoary wigeon
lofty swallow
does it mean the model's result bad or good
are you comparing the result using graph ?
no one does that
lofty swallow
I just want to visualize it
 sudden scroll
Hi I have a question, How much math should I be comfortable with before learning AI
hoary wigeon
lofty swallow
I just want to visualize it
Classification model ?
lofty swallow
the first one is random forest
hoary wigeon
sudden scroll
Hi I have a question, How much math should I be comfortable with before learning...
How much u know till now ?
lofty swallow
y axis is its score
rigid zodiac
hoary wigeon
can u provide the error screenshot ?
 lofty swallow
and, idk, I saw somebody else do it like that, I thought it may indicate something but idk what it's going on
rigid zodiac
sudden scroll
Hi I have a question, How much math should I be comfortable with before learning...
You mean stats right? tbh it just matter how you code and train / tune the model. Remember too good to be true on the accuracy may lead to over fitted
rigid zodiac
lofty swallow
and, idk, I saw somebody else do it like that, I thought it may indicate somethi...
I think random forest for classification. For that the accuracy you may need MSE
uncut barn
has anyone used "patchify" because it seems to me that it doesn't accept RGB images and only accepts one channel of the img?
hoary wigeon
rigid zodiac
from this i can that, the index u are searching doesnt eixsts
hoary wigeon
lofty swallow
and, idk, I saw somebody else do it like that, I thought it may indicate somethi...
is it a classification model ?
rigid zodiac
hoary wigeon
from this i can that, the index u are searching doesnt eixsts
how can I fix it ??
hoary wigeon
lofty swallow
yes
represent it using confusion matrix and plot it using heatmap
hoary wigeon
rigid zodiac
what is 0 and what is 1. have you check the mse?
what is float() doing ?
lofty swallow
rigid zodiac
or AUC
0 and 1 is just diagnosis of cancer
hoary wigeon
float(row[0].split(" ")[1].replace(":", "")) ?
lofty swallow
I did the other ways, I just want to interpret boxplot
rigid zodiac
hoary wigeon
what is float() doing ?
idk why it said float in v6 because it is a json file in that column. I can share my file
hoary wigeon
lofty swallow
0 and 1 is just diagnosis of cancer
🆒 use confusion matrix it will show you how many are correctly classified
hoary wigeon
rigid zodiac
idk why it said float in v6 because it is a json file in that column. I can shar...
show me
lofty swallow
yeah I have cm
rigid zodiac
hoary wigeon
`float(row[0].split(" ")[1].replace(":", ""))` ?
oh that, that is for the time
lofty swallow
i guess boxplot can show the distribution
and that's it ?
idk man, I am writing a paper, but I just dumped those images in it without noting anything
hoary wigeon
lofty swallow
i guess boxplot can show the distribution
not here
rigid zodiac
lofty swallow
idk man, I am writing a paper, but I just dumped those images in it without noti...
I feel ya, just say the the Randomforest are able to classify the difference between patient with cancer symptoms against no symptom.
mention about the accuracy and say that you can use this model to separate or to make a noticeable classification between it
hoary wigeon
if you want to visualize model evaluation for classification model, cm will tell you how many are correctly classified and incorecct.
rigid zodiac
box plot only cool to show before any model... in my opinion
hoary wigeon
rigid zodiac
box plot only cool to show before any model... in my opinion
in feature analysis
rigid zodiac
si si
hoary wigeon
lofty swallow
thx
i have a code here to plot cm
def Evaluation(model):
    y_test_pred = model.predict(X_test)
    print(classification_report(y_test, y_test_pred))

    cm = confusion_matrix(y_test, y_test_pred)

    labels = ['Negative', 'Positive']
    plot_text = ['TN', 'FP', 'FN', 'TP']
    group_percent = [f'{i:.2%}' for i in cm.reshape(1,-1)[0]/np.sum(cm)]
    annot = np.asarray([f'{i}\n{j}' for i, j in zip(plot_text,group_percent)]).reshape(2,2)

    ax = sns.heatmap(cm, annot=annot, fmt='', cmap='YlOrRd')
    ax.set(xlabel = 'Actual Value', ylabel = 'Fitted Value', xticklabels = labels, yticklabels = labels, title = 'Confusion Matrix')

    plt.show()
@hoary wigeon so the float is there because I want to separate the time thingy
 hoary wigeon
Evaluation(//send model here//)
what is row[0] here float(row[0].split(" ")[1].replace(":", "")) ?
date or v6 ??
rigid zodiac
Because when I feed it as json file, it will be consider as row[0]
so date_time is row[0] and such
hoary wigeon
oh
rigid zodiac
hoary wigeon
oh
Here is a same error in pycharm
 hoary wigeon
I'm back, dont mind i went for dinner earlier
hoary wigeon
rigid zodiac
Here is a same error in pycharm
trying to split date using whitespace ? row[0].split(' ')
rigid zodiac
hoary wigeon
trying to split date using whitespace ? `row[0].split(' ')`
because the date was in this type of setting
08/01/2021 13:40:00
and each frame is measured in millisecond
hoary wigeon
what do you want from this ?
hoary wigeon
rigid zodiac
because the date was in this type of setting
``` 08/01/2021 13:40:00```
what should output look like ?
134000 ?
hoary wigeon
oh k
 bleak trout
Umm, actually I needed an answer to a question for my project in school, is it fine to ask it here, or is it not allowed?
anyways it is a very basic question though
hoary wigeon
temp = row[0].split(' ')[1]
temp = temp[:-2].replace(':','')+'.'+[-2:]
now provide temp in float(temp)
i want to run your notebook
rigid zodiac
hoary wigeon
```py
temp = row[0].split(' ')[1]
temp = temp[:-2].replace(':','')+'.'+[-2:]
```
me?
bleak trout
bleak trout
Umm, actually I needed an answer to a question for my project in school, is it f...
hello
?
 somber prism
guys i have one doubt, so is it ok to use any type of scaler like std, robust, min max on a pca dataset which was std scaled before applying pca ?
rigid zodiac
bleak trout
Umm, actually I needed an answer to a question for my project in school, is it f...
ask bro ask
rigid zodiac
somber prism
guys i have one doubt, so is it ok to use any type of scaler like std, robust, m...
is the data normal? if not do normalize,
if it still not normal log
somber prism
oh ok
if the data is normally distributed after applying pca , then i can use min max right ?
rigid zodiac
yeah, make sure that you check with the plot and the test. sometime plot can be deceiving
rigid zodiac
No problem.
 dire kestrel
do you know how to invert y axis in matplotlib.pyplot
rigid zodiac
just change the position i think
dire kestrel
 rigid zodiac
may wanna change or shorten the year
dire kestrel
invert y axis of this

yeah
it should be started from 6 to 2
but it not work
i tried
position
rigid zodiac
what does it do thou?
lofty swallow

 haughty pendant
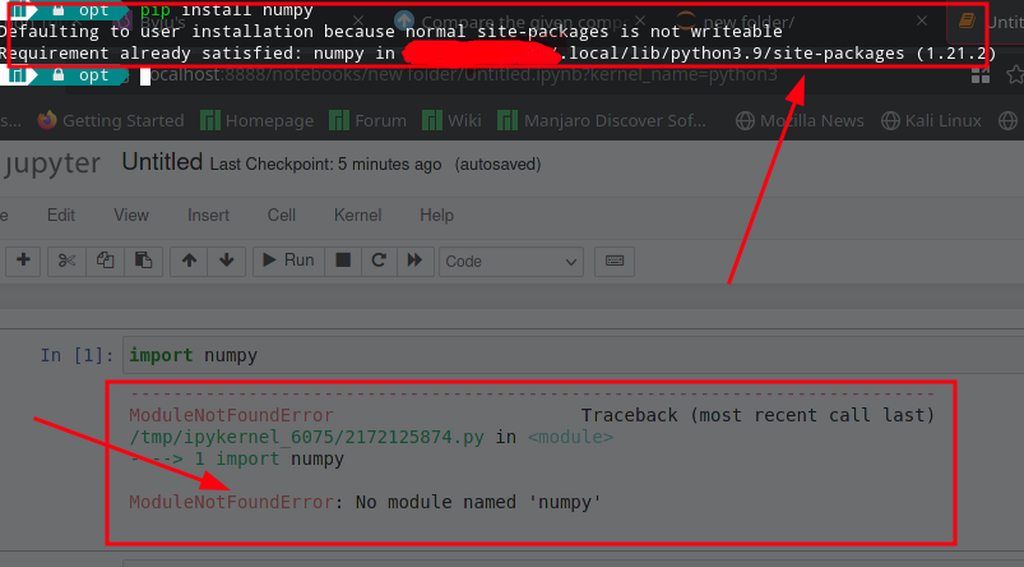 lofty swallow
it's to compare the unsupervised learning results and supervised learning
rigid zodiac
lofty swallow
yeah... pretty much what i and C0$mox said
lofty swallow
so it's comparing between prediction from random forest, and the prediction from unsupervised
rigid zodiac
wait wut? you havent show us the unsupervised learning
lofty swallow
ensemb is the unsupervised
rigid zodiac
is that deep learning?? cause I didnt learn it during my graduate day
lofty swallow
oh, it's just bunch of different models like

spectral clustering, K means
stuff like that
lofty swallow
ensemb is the combination of all the above lol
rigid zodiac

make sure you know how to save it and load it to similar data. I got fucked like couple days ago when my pm ask me to give him the model
like a freaking deer in the headlight
lofty swallow
lmao sure
 lofty swallow
lol, it's really a meme
rigid zodiac
yep
 valid pebble
how can I run dask on ec2 .... the Client() method will close the port when I restart nginx??
valid pebble
valid pebble
how can I run dask on ec2 .... the Client() method will close the port when I re...
I want daemonize the dask.distributed
lofty swallow
why is my auc not showing anything?
 rigid zodiac
have you download the package?
 rigid zodiac
auc package
rigid zodiac
from sklearn.metrics import classification_report, confusion_matrix, roc_auc_score
 rigid zodiac
have you calculate it thou?
 rigid zodiac
I forgot how to plot it but i think you will need to include it in plt
 lethal tinsel
Anyone happen to understand what's the purpose of multiplying dx with the complex (?) number? This is used to calculate image gradient.
 lofty swallow
rigid zodiac
I forgot how to plot it but i think you will need to include it in plt
lofty swallow
rigid zodiac
I forgot how to plot it but i think you will need to include it in plt
lol, I don't know either. That code was from other people's
prime hearth
@lethal tinsel derrivates give the maxim or min values
complex number also gives access to third dimension for probablilty
 distant pier
If you speak french invite me as friends
lethal tinsel
prime hearth
complex number also gives access to third dimension for probablilty
Can you explain what would it mean in this context as it's used to calculate image gradient? Or do you happen to know where I could read a bit more on this topic? I don't quite follow.
lofty swallow
rigid zodiac
I forgot how to plot it but i think you will need to include it in plt
i kinda figured it out

I print those values out
and they are all the same
the reason why there is no line, is that, all the points are on the same point, so they can't form a line
fk
By the way, who knows what the "zip" function does? Or where does this come from?
 tender hearth
lofty swallow
By the way, who knows what the "zip" function does? Or where does this come from...
tender hearth
lofty swallow
By the way, who knows what the "zip" function does? Or where does this come from...
!d zip
arctic wedgeBOT
zip(*iterables, strict=False)```
Iterate over several iterables in parallel, producing tuples with an item from each one.

Example:

```py
>>> for item in zip([1, 2, 3], ['sugar', 'spice', 'everything nice']):
...     print(item)
...
(1, 'sugar')
(2, 'spice')
(3, 'everything nice')
```...
Similar names: 2to3fixer.zip
lofty swallow
tender hearth
!d zip
Thanks!
bleak trout
rigid zodiac
ask bro ask
how has Artificial Intelligence in video games impacted our lives? kinda silly question, u know what happens these days in skool projects
rigid zodiac
It get better on predicting player move. With that similar approach we can use the same model for our daily life. Such as walk into the car, sit down and the car Automatically know that we want to drive - tesla
 inland zephyr
i need some suggestion about face recognition task
I still wonder about best augmentation practice for the face, should i store all embedded feature based on grayscaled one or both grayscaled and original image?
dire kestrel
how to invert y axis in pandas
lapis sequoia
I'm using the ipdb debugger and when I quit the debugger with q I get the following message in the terminal:
ipdb> q
Traceback (most recent call last):
  File "/Users/gavinw/Desktop/capacity.py", line 28, in <module>
    for i in range(len(heights)):
  File "/Users/gavinw/Desktop/capacity.py", line 28, in <module>
    for i in range(len(heights)):
  File "/Users/gavinw/miniconda3/envs/bamm/lib/python3.9/bdb.py", line 88, in trace_dispatch
    return self.dispatch_line(frame)
  File "/Users/gavinw/miniconda3/envs/bamm/lib/python3.9/bdb.py", line 113, in dispatch_line
    if self.quitting: raise BdbQuit
bdb.BdbQuit

If you suspect this is an IPython 7.26.0 bug, please report it at:
    https://github.com/ipython/ipython/issues
or send an email to the mailing list at ipython-dev@python.org

You can print a more detailed traceback right now with "%tb", or use "%debug"
to interactively debug it.

Extra-detailed tracebacks for bug-reporting purposes can be enabled via:
    %config Application.verbose_crash=True
How can I get rid of this message?
 fluid steppe

 trim latch
Can we ask for hackathons teams here?
 covert iron
What to use instead of bokeh.charts? How can i plot box plot using bokeh?
 trim latch
you can use seaborn
covert iron
Continuous type
covert iron
I have checked a lot. But i am unable to solve this issue. I am not getting what to do.
trim latch
copy the error and paste it here
 ionic mica
any free ml/dl courses which are actually good
lapis sequoia
ionic mica
any free ml/dl courses which are actually good
Microsoft came out with one which is pretty for getting into to, but it depends do you have previous python experience?
On another note, anyone knows how I can fit KMeans with AgglomerativeClustering results?
 lyric ermine
hey guys, i wanna change the grid distance to 1 instead of 0,5. anybody knows what the parameter is to do it? thanks a lot
plt.figure(figsize=(20,10), dpi=100)
data = cwinners
plt.barh(cwinners.index, data)

plt.grid(color="red", linestyle="--", linewidth=3, axis='x', alpha=0.7)

plt.title("Oscar Winning Studios", size=20)
plt.ylabel("Studios", size=15)
plt.xlabel("Amount of Oscars", size=15)

plt.show()```

https://gyazo.com/fc29a212faf3b8b030ec70d6dab0319f

 hasty grail
lyric ermine
hey guys, i wanna change the grid distance to 1 instead of 0,5. anybody knows wh...
hasty grail
lyric ermine
hey guys, i wanna change the grid distance to 1 instead of 0,5. anybody knows wh...
Perhaps this could help you: https://stackoverflow.com/questions/24943991/change-grid-interval-and-specify-tick-labels-in-matplotlib
If I'm understanding your question correctly
lyric ermine
found this one too, but not sure how to use it @hasty grail 😦
imma keep trying
minor_ticks = np.arange(0, 4, 1)
smth like that i guess
hasty grail
plt.xticks(np.arange(0, 4, 1))
lyric ermine
thank you man ...
iam relative new to pandas, stuff like that takes so long to figure out for me
hasty grail
np
Basically there's two modes of using matplotlib. The basic use case is calling plt.<method_name> which only works if you have a single plot. To show more than one plot, you could create figure objects manually, create axes for each figure and call methods on the axes themselves.
lyric ermine
makes sense, i gotta download a plotting tutorial from kaggle or so, working with the data is relative easy but plotting is the hardest part for me rn
thanks a lot, much appreciated 🙂
hasty grail
You're welcome 😄
 umbral skiff
Hello, I'm trying to filter this DataFrame only by the values "1ª dose" of the column "vacina_descricao_dose", but it returns an empty value. How can I fix this?
 desert oar
umbral skiff
Hello, I'm trying to filter this DataFrame only by the values "1ª dose" of the c...
desert oar
umbral skiff
Hello, I'm trying to filter this DataFrame only by the values "1ª dose" of the c...
can you run this and paste the output here in a code block?
import io; buf = io.StringIO()
df.head().to_csv(buf)
print(buf.getvalue())
del buf
!code
arctic wedgeBOT
Here's how to format Python code on Discord:
```py
print('Hello world!')
```
These are backticks, not quotes. Check this out if you can't find the backtick key.
umbral skiff
desert oar
can you run this and paste the output here in a code block?
```python
import io;...
Yes
umbral skiff
desert oar
can you run this and paste the output here in a code block?
```python
import io;...
import io; buf = io.StringIO()
df.head().to_csv(buf)
print(buf.getvalue())
del buf

,vacina_nome,vacina_dataaplicacao,vacina_descricao_dose
0,AstraZeneca,2021-03-31,1ª Dose
1,Coronavac,2021-02-24,1ª Dose
2,Coronavac,2021-03-17,1ª Dose
3,AstraZeneca,2021-05-26,1ª Dose
4,AstraZeneca,2021-03-02,1ª Dose
Ignoring the line on top, can this be read as "the number of ds (each of which are a set) that are an element of D, for which t is an element of d?"
 desert oar
where's this from? @serene scaffold
serene scaffold
 desert oar
umbral skiff
```python
import io; buf = io.StringIO()
df.head().to_csv(buf)
print(buf.getvalu...
desert oar
umbral skiff
```python
import io; buf = io.StringIO()
df.head().to_csv(buf)
print(buf.getvalu...
oh, i figured out your problem, you used the wrong column name in df.query. you wrote vacina_dataaplicacao but you meant vacina_descricao_dose
 livid kiln
I have a CSV file:
0.7, AAPL, 0.5
0.1, MSFT
0.1, NVDA
0.1, GOOG

0.7, INTC, 0.5
0.15, AMD
0.15, SKYT
I then do:
    df = pd.read_csv(stocks.csv, header=None)
    display(df)
    display(df[2].notnull())
Which shows:


I'm trying to get the indexes: 0 to 4 and 4 to 7
In other words, how do I select from True till the next True, but True till the end for the last chunk
umbral skiff
desert oar
oh, i figured out your problem, you used the wrong column name in `df.query`. yo...
I ended up sending the wrong print, but anyway when I put the correct column name it still returns zero value 😩
filtro = df.query("vacina_descricao_dose == '1ª Dose'")
print(filtro)

Empty DataFrame
Columns: [vacina_nome, vacina_dataaplicacao, vacina_descricao_dose]
Index: []
!e ```python
import io
import pandas as pd
df = pd.read_csv(io.StringIO('''vacina_nome,vacina_dataaplicacao,vacina_descricao_dose
AstraZeneca,2021-03-31,1ª Dose
Coronavac,2021-02-24,1ª Dose
Coronavac,2021-03-17,1ª Dose
AstraZeneca,2021-05-26,1ª Dose
AstraZeneca,2021-03-02,1ª Dose'''))
print( df.loc[df['vacina_descricao_dose'] == '1ª Dose'] )
@desert oar :white_check_mark: Your eval job has completed with return code 0.
001 |    vacina_nome vacina_dataaplicacao vacina_descricao_dose
002 | 0  AstraZeneca           2021-03-31               1ª Dose
003 | 1    Coronavac           2021-02-24               1ª Dose
004 | 2    Coronavac           2021-03-17               1ª Dose
005 | 3  AstraZeneca           2021-05-26               1ª Dose
006 | 4  AstraZeneca           2021-03-02               1ª Dose
!e ```python
import io
import pandas as pd
df = pd.read_csv(io.StringIO('''vacina_nome,vacina_dataaplicacao,vacina_descricao_dose
AstraZeneca,2021-03-31,1ª Dose
Coronavac,2021-02-24,1ª Dose
Coronavac,2021-03-17,1ª Dose
AstraZeneca,2021-05-26,1ª Dose
AstraZeneca,2021-03-02,1ª Dose'''))
print( df.query("vacina_descricao_dose == '1ª Dose'") )
@desert oar :white_check_mark: Your eval job has completed with return code 0.
001 |    vacina_nome vacina_dataaplicacao vacina_descricao_dose
002 | 0  AstraZeneca           2021-03-31               1ª Dose
003 | 1    Coronavac           2021-02-24               1ª Dose
004 | 2    Coronavac           2021-03-17               1ª Dose
005 | 3  AstraZeneca           2021-05-26               1ª Dose
006 | 4  AstraZeneca           2021-03-02               1ª Dose
both of those work
@umbral skiff you should check to make sure there isn't trailing whitespace on the column
does this work?
df.loc[df['vacina_descricao_dose'].str.strip() == '1ª Dose']
try:
df = pd.read_csv("FILENAME.csv", encoding='utf-8')
good catch, encoding could be an issue
@livid kiln you want to get lists of dataframes? what are you ultimately trying to do
umbral skiff
desert oar
does this work?
```python
df.loc[df['vacina_descricao_dose'].str.strip() == '1ª ...
I tested it and it didn't work
desert oar
where are you getting the file from
umbral skiff
livid kiln
try:
```python
df = pd.read_csv("FILENAME.csv", encoding='utf-8')
```
That's a really good one. I'll try!
livid kiln
desert oar
<@!581318950760218636> you want to get lists of dataframes? what are you ultimat...
I'm trying to get those views in the df
d[0:4]
d[4:7]
but automatically 😃
desert oar
what do you mean "those views in the df"
you want a list of them? you want to print each one?
and you're looking for consecutive sequences of non-nulls in column 2, effectively partitioning the dataframe on null values in that column?
livid kiln
I'm trying to find the index ranges
or masks
I want to use it in a loop... e.g.
starts = [0,4]
ends = [4,7]
for start,end in zip(starts,ends):
  print(df[start:end])
  #Do other things
It still didn't work. I put the Code in Google Colab to make it easier.
https://colab.research.google.com/drive/1q6OlVgwzdIQkvhxE9tPAa0u60VHSfbkH?usp=sharing
desert oar
before i suggest anything, are you reinventing Series.ffill/DataFrame.ffill?
@livid kiln ☝️
livid kiln
umbral skiff
It still didn't work. I put the Code in Google Colab to make it easier.
https:/...
1ª\xa0Dose
use this instead
Stack Overflow
I am currently using Beautiful Soup to parse an HTML file and calling get_text(), but it seems like I'm being left with a lot of \xa0 Unicode representing spaces. Is there an efficient way to remov...
desert oar
hah, they had non-breaking spaces?
nice find, i hadn't opened the notebook yet
sounds like the table was scraped from html maybe
elfin spindle
nvm
livid kiln
desert oar
before i suggest anything, are you reinventing `Series.ffill`/`DataFrame.ffill`?
no
desert oar
ok, i have some meetings coming up. if i figure out something efficient i'll @ you. otherwise you can always use a for loop and build up a list of indices
is it safe to assume that the first row is always non-null?
umbral skiff
livid kiln
1ª\xa0Dose
Fantastic! It worked here. Thank you very much. @desert oar thanks also for the help.
livid kiln
umbral skiff
Fantastic! It worked here. Thank you very much. <@!389497659087650836> thanks al...
if I were you, I would not keep the column like that
livid kiln
livid kiln
https://stackoverflow.com/questions/10993612/how-to-remove-xa0-from-string-in-py...
look here!
desert oar
df['vacina_descricao_dose'] = df['vacina_descricao_dose'].str.replace('\xa0', ' ')
Very good!
 boreal summit
I'm tryna grasp Hyper parameter tuning with Keras Tuner. I've been seeing HP.INT and stuff relating to hp.this but I didn't see anywhere where HP was imported. Where is this HP coming from?
I've installed Keras tuner. Thanks.
livid kiln
desert oar
and you're looking for consecutive sequences of non-nulls in column 2, effective...
I see what you mean, I didn't explain it well! So basically I want to multi index on the length of each non null partition... e.g. df[0:4] is the first partition then df[4:7] is the second partition.
It's kind of like an outer join on those partition.
After the operation, it should look like this:
df[0] =
0 0.70 AAPL 0.5
1 0.10 MSFT NaN
2 0.10 NVDA NaN
3 0.10 GOOG NaN
df[1] =
0 0.70 INTC 0.5
1 0.15 AMD NaN
2 0.15 SKYT NaN
3 NaN NaN NaN