#data-science-and-ml
1 messages · Page 336 of 1
 serene scaffold
 serene scaffold
idk anything about image processing. I just use words.
 rough mountain
anyone know how to get a cleaner fill
 velvet thorn
isn't that basically max
f(0, 0) -> 0
f(0, 1) -> 1
f(1, 0) -> 1
f(1, 1) -> 1
or logical (and also bitwise) OR, if you prefer, for the specific case of 0/1
!e
import pandas as pd

a = pd.DataFrame([[0, 0], [1, 1]])
b = pd.DataFrame([[0, 1], [0, 1]])

print(a | b)
 arctic wedgeBOT
@velvet thorn :white_check_mark: Your eval job has completed with return code 0.
001 |    0  1
002 | 0  0  1
003 | 1  1  1
there we go @glossy moth
rough mountain
I always forgot about the pipe operator |
 stuck karma
rough mountain
I always forgot about the pipe operator |
stuck karma
rough mountain
I always forgot about the pipe operator |
Very interesting! Which field are you working or study?
Never did image processing yet but I LL try a spectral processing soon
(i study geometric and work with remote sensing data)
rough mountain
stuck karma
Very interesting! Which field are you working or study?
None, I'm a high-school hobbyist
stuck karma
Oh okay
rough mountain
Though when I get a job, I should be able to score a data science position
5 years of python looks good on a resume
stuck karma
Okay
Young pupils make me feel anxious 😰
I just discovered programming this year ^^'
rough mountain
Why won't this fill properly 😭
stuck karma
rough mountain
Why won't this fill properly 😭
Pretty sure there are tutorials on YouTube
It depends of your resolution tho
rough mountain
stuck karma
Pretty sure there are tutorials on YouTube
Link me to a good one, as I can't find one
it's a 2.5k by 2.5k image
stuck karma
Just type image processing! I'm french and I found it in french so i guess it's even easier in English .
(Gonna sleep it's almost 3am here)
You used a mask I suppose?
stuck karma
Try w mask
rough mountain
but it leaves this weird ring
stuck karma
And increase the value of the color of the pixel maybe
Maybe because the pixels are not as clear as the background
Probably darker
rough mountain
it should be a solid color, and I definitely can't see a difference
 stuck karma
I have ideas
I think I know which method
Oh it's better
Wait
I think I know I'm looking after my words
Lemme google to find the terms
It's about dilatation and erosion
stuck karma
rough mountain
it should be a solid color, and I definitely can't see a difference
Search these terms for image processing you'll find some tutorials
Pretty sure it's the right hint
Something about you remove pixels and then add a buffer to fill the missed pixels
I think you make an erosion first to clean and then a buffer
Hey~
I tried to dm you but I can't so : I just wanted to ask you if you could maybe give me a simple example of how to use grid search because I swear I read the documentation and I saw the parameters and stuff ...
But it doesn't help me to know what was my errors and how I should use it.
I tried to search on Google and will follow tomorrow or course .
It's important to me to know how to use it because this project will determine if I pass to the next year of my studies~
Any advice is welcomed
 merry ridge
rough mountain
it should be a solid color, and I definitely can't see a difference
merry ridge
rough mountain
it should be a solid color, and I definitely can't see a difference
It’s not a solid color. Floodfill implementations usually have a tolerance parameter to fine tune how it looks when there are near misses
rough mountain
merry ridge
It’s not a solid color. Floodfill implementations usually have a tolerance param...
does opencv's have a tolerence
merry ridge
What values have you tried
rough mountain
wait just found it
 desert oar
i'm back at a computer so i can probably be more helpful now. you want to read about the scoring parameter:
scoring: str, callable, list, tuple or dict, default=NoneStrategy to evaluate the performance of the cross-validated model on the test set. If scoring represents a single score, one can use: a single string (see The scoring parameter: defining model evaluation rules); a callable (see Defining your scoring strategy from metric functions) that returns a single value. If scoring represents multiple scores, one can use: a list or tuple of unique strings; a callable returning a dictionary where the keys are the metric names and the values are the metric scores; a dictionary with metric names as keys and callables a values. See Specifying multiple metrics for evaluation for an example.
"Specifying multiple metrics" is a link to an entire page in the user guide that explains how this works. See https://scikit-learn.org/stable/modules/grid_search.html#multimetric-grid-search, which links to https://scikit-learn.org/stable/modules/model_evaluation.html#multimetric-scoring
rough mountain
When I run this
cv2.floodFill(cv_img, None, (0,0), 255, loDiff=(1,1,1,1), upDiff=(1, 1, 1, 1))``` I get
I run this
    mask = np.zeros((cv_img.shape[0] + 2, cv_img.shape[1] + 2),dtype=np.uint8)
    cv2.floodFill(cv_img, mask, (0,0), 255, loDiff=(1,1,1,1), upDiff=(1, 1, 1, 1), flags=cv2.FLOODFILL_MASK_ONLY)``` I get this
why
merry ridge
What are you asking. The blue or the back
rough mountain
Nevermind
this person on stack saved me

Stack Overflow
The documentation for OpenCV's floodfill function states:
The function uses and updates the mask, so you take responsibility of
initializing the mask content. Flood-filling cannot go across no...
 austere swift
I'm finally pushing myself to use an env manager rather than literally installing everything into the main python
desert oar
hard to go wrong with conda imo
pyenv / pyenv-virtualenv is great for software dev too, but conda is nice for data science because it includes things that aren't just python
austere swift
desert oar
hard to go wrong with conda imo
yeah went with conda
i just have to get used to it though
because from what i heard you're not supposed to pip install within a conda env
so i have to get used to doing conda install now, and also learn about the channels and stuff
right now i'm creating some base environments with stuff that I commonly use, such as pytorch or tensorflow, that way i can later clone them with each project and add any supplementary packages
desert oar
austere swift
because from what i heard you're not supposed to pip install within a conda env
you can, but you should get in the habit of checking conda default and conda-forge first. what gets annoying is when you realize you should have conda installed a dependency of the thing you just pip installed, but now there's the pip version and not the conda version
it's not that bad to mix pip and conda packages, but it's not ideal either
austere swift
Yeah that's just what I need to start getting used to
desert oar
fortunately it's not that hard to package a plain-python package for conda if it doesn't already exist
austere swift
but at least thats much better than literally putting every package into the main installation as I did before
desert oar
ew yikes
i have my own conda channel, you can use the free public hosted ones on anaconda.org or host your own https://stackoverflow.com/q/35359147/2954547
Stack Overflow
I have a few python projects that are dependent on each other. I have different release versions for each project and different projects might be dependent on different release versions of a partic...
can't hurt to contribute to conda-forge either
however packaging stuff with C or other funky deps can be a lot of trial and error
the conda build system is under-documented
austere swift
I mean would it really be too bad to just add a bunch of commonly used channels to the default channels in the .condarc?
the main thing that pushed me over the edge to use conda was that I wanted to mess around with cudf, but it's only available through conda install
austere swift
so far conda is actually looking to be pretty great, the only issue I've had was that it didnt work in powershell, before i realized I needed to do conda init powershell, which fixed that
 lilac geyser
Hello all
I was learning K nearest neighbour algorithm in ML.
I found this problem tricky while solving manually.
Please help me with the correct solution!
I was able to find the minimum Euclidean distance for first 6 neighbor's
But finding the 7th is tricky.
Sorry for my bad handwriting 😅
Thanks in advance


 flat hollow
lilac geyser
Hello all
I was learning K nearest neighbour algorithm in ML.
I found this probl...
flat hollow
lilac geyser
Hello all
I was learning K nearest neighbour algorithm in ML.
I found this probl...
is the correct answer Class - ?
I think you made a mistake in your first sqrt(5) (and also you mixed up euclidean distance? the query point doesn't change yet the numbers you were subtracting do?)
sqrt((1-1)^2 + (-1-1)^2) = sqrt( 0 + (-2)^2) = 2 (not sqrt(5) )
desert oar
austere swift
I mean would it really be too bad to just add a bunch of commonly used channels ...
i do that. i have my personal channel, then conda forge, then defaults
austere swift
what would be the advantage of making a personal channel?
also would that require compiling all of the packages?
desert oar
the advantage is that you build packages for things that aren't in defaults or conda-forge, but you maybe aren't ready to contribute to conda-forge yet
conda looks in the channel priority you specify, so if something isn't available in your channel, it will fall back to the next channel in the priority list
 glossy moth
velvet thorn
there we go <@!616838159354953749>
glossy moth
velvet thorn
there we go <@!616838159354953749>
It works! Thank you again!
 hoary wigeon
does anyone have time series example on pair trading ?
or can anyone suggest from where i can learn ml for stock trading ?
 crude hound
Hello world can anyone teach me creating ai in python
 royal crest

 lapis sequoia
crude hound
Hello world can anyone teach me creating ai in python
lapis sequoia
crude hound
Hello world can anyone teach me creating ai in python
yes
Unsure if here is the right channel but there's a trend in fitness where coaches are now creating A.I based training apps for clients, ones like Juggernaut AI and SheikoGold are becoming popular. Have any of you worked on similar apps?
 mild dirge
 mortal dove
df.columns = df.iloc[0]
df = df.drop([0])
 near aspen
mortal dove
```python
df.columns = df.iloc[0]
df = df.drop([0])
```
near aspen
mortal dove
```python
df.columns = df.iloc[0]
df = df.drop([0])
```
it says [0] not found in axis
mortal dove
df = df.drop(['attacker'])
df = df.iloc[1:]
seems to be ok
mortal dove
It wouldn't skip the column, just working with the rows
near aspen
i need an index on the timestamps
Index(['2021-01-20', '2021-02-01', '2021-03-01', '2021-04-01', '2021-05-01',
       '2021-06-01', '2021-07-01', '2021-08-01', '2021-08-22'],
dtype='object')```epic
hmm
there's also this
s = df.loc['2020-03-29']
s
China     3304.0
USA       2566.0
Italy    10779.0
UK        1231.0
Iran      2640.0
Spain     6803.0
Name: 2020-03-29 00:00:00, dtype: float64```^ needed
not a float64
ah
worked
is there a way to do that for all values in df.index
something like df.index.dtype.astype(float)
so with this I would end up doing
df.loc["2021-01-20"] = df.loc["2021-01-20"].astype(float)
df.loc["2021-02-01"] = df.loc["2021-03-01"].astype(float)
df.loc["2021-03-01"] = df.loc["2021-04-01"].astype(float)
df.loc["2021-04-01"] = df.loc["2021-05-01"].astype(float)
df.loc["2021-05-01"] = df.loc["2021-06-01"].astype(float)
... and so on```i see
say does pandas have a way where I can add the previous value of each row to the current one
actually nvm sql is better for that
 grave frost
😅 ...what?
serene scaffold
near aspen
say does pandas have a way where I can add the previous value of each row to the...
Yes, with shift
Pandas and sql have a lot of similar operations, so the difference is that one is for data on the disk that you need to persist, and the other is for data in live memory.
near aspen
I just did
start_date = datetime.date(2021, 1, 20)
end_date = datetime.date(2021, 8, 23)
delta = datetime.timedelta(days=1)

while start_date <= end_date:
    sql = sql + f"""SUM(timestamp BETWEEN '2021-01-20 05:01:00' AND '{start_date}' AND war_type == 'WAR') AS '{start_date}',
"""```Interesting
 lusty stag
is there any easy way to combine multiple classifiers?
or any resource that explains how to combine them in python?
just need to see how people implement it I can't find any open source project code
a basic sample code will be appreciated
 limber trench
Hello everyone i want to create a team with professional programmers on python if you are interested dm me
serene scaffold
@lusty stag what are these classifiers intended to do?
@limber trench you can't recruit for closed source or paid activities here
lusty stag
predict a multi class classification problem
serene scaffold
@lusty stag you can have more than one model and iterate over them, I guess.
lusty stag
I'm classifying from continuous inputs to categorical labels
currently I'm getting good results from SVM and Random Forest
so I was wondering if the model improves if I can combine them
maybe add xgboost on top of that
but I don't know how to implement it in python
can't seem to make sklearn VotingClassifier work with SVM taking scaled inputs
limber trench
serene scaffold
<@531350591100682242> you can't recruit for closed source or paid activities her...
Ok sorry
lusty stag
I think so
I'm new to this so not aware of some terminology
also random forest is also an ensemble is it bad to combine?
lusty stag
thanks
 hushed quiver
do any mfs here actually know wtf they're talking abt
or does everyone here just play with dials until shit works
desert oar
hushed quiver
or does everyone here just play with dials until shit works
even the people who know what they're talking about sometimes have to do this. there isn't a good theoretical answer for everything
desert oar
grave frost
😅 ...what?
using a makefile for scripting dvc 🙂
 orchid silo
is that possible to apply data science/analytics to stock market
and have anyone do that
I on my journey to find the way to apply data science/analytics for trading stock, help me to easier to understand what happend to stock market
 cerulean ruin
Sure
There's alot you can do in this area.
Did you have a specific question?
Generally starting with momentum / mean-reverting strategies is a simple and powerful way to get started.
I'm not generally a fan of LSTMs or more advanced models in trading. I don't believe you need highly accurate pricing predictions in order to execute quality trades
I think just catching some type of momentum is sufficient. You can run some simple linear regressions on short windows of time and use those as rough projections
 quiet vault
Is there a way to save a keras model and use it without having to import keras
Because when I import it, it just takes a ton of vram automatically, even when its not making predictions or training
grave frost
desert oar
using a makefile for scripting dvc 🙂
wuz zat?
austere swift
quiet vault
Because when I import it, it just takes a ton of vram automatically, even when i...
yeah that's because the model is being stored in vram, if you would like it to stay on system memory then you can just configure it to use cpu instead
quiet vault
I'm using a cnn, would it make it slower if I use the cpu?
austere swift
significantly
austere swift
what's wrong with the vram usage anyways?
austere swift
couldn't you use an online service for the model? that way you can do other stuff on your pc
something like colab
quiet vault
I could
The preferable option here is reducing the amount of vram
cuz it uses like 4/5 gigs
making it use 2 gigs would be huge
austere swift
You'd have to shrink the model to do that
quiet vault
hmm
austere swift
you can't expect to just use less memory while keeping the same amount of parameters stored
austere swift
austere swift
you can't expect to just use less memory while keeping the same amount of parame...
.
while keras might have some overhead which may change the amount of usage a little bit, it won't half it

 severe dome
hey guys do you think its possible to create an AI that has 99% prediction without feeding it alot of data?
austere swift
severe dome
hey guys do you think its possible to create an AI that has 99% prediction witho...
that depends on quite a few factors
quiet vault
how much data will you feed it
severe dome
ah i see, because im new and i just did a 6 hr course on python and ML
so i realized my code is 100% dependent on the data i trained it and it doesnt exactly retain the data
in a sense if i remove the data i fed it, it will go back to square 1 right?
hmm i think ill try learning more first
austere swift
the data you feed it is used to train the parameters of the model
severe dome
sorry to disturb you
austere swift
so if you keep the parameters then the model will keep its knowledge
severe dome
austere swift
so if you keep the parameters then the model will keep its knowledge
ah i see
thanks!
austere swift
but if you remove the data from the training program and don't train it, then it won't learn in the first place
austere swift
most of it is practice
making projects and stuff
but I do keep a notebook with any phenomena I find interesting as I work
severe dome
i see, do you have any to recommend? I think i am half ready to start on a few
severe dome
austere swift
but I do keep a notebook with any phenomena I find interesting as I work
thats interesting! ive been note taking everysingle thing and its been very tiring
austere swift
I'd recommend checking out kaggle for some notebooks that you can mess around with
Find one, change some things in it, see what happens
you can learn a lot by doing that
severe dome
woah i see
austere swift
after you get more used to the structure and pipeline of the code, try to find some datasets (which you can also find on kaggle) and try fitting a model to that data from scratch
severe dome
right now, im using many imported classes to do my predictions. is it necessary to learn what those classes are?
austere swift
You should know what they do and the basics of how to use them (at least the very common ones), but you don't need to memorize the entire documentation of them or anything crazy like that
the main ones you should be familiar with are numpy arrays and pandas dataframes, because pretty much all the data you work with will be in one of those 2 forms
severe dome
i see thank you!
just a side question, do you know why siri/ alexa isnt as smart as it is?
for example if i say 'hey siri, create an alarm at 6pm, 10pm and 11pm', it doesnt
does that mean that in order for our program to do that, we need to code it ourselves? the machine cant learn and create more functions byitself right?
austere swift
amazon and apple, for likely obvious reasons, don't release any details of how siri and alexa work, so we can't really know for sure
but NLP/NLU are evolving extremely fast
severe dome
ah i see thanks!
how many years would you think it would take to reach that level of coding expertise?
desert oar
these speech assistant things are not programmed by individual people. they are the products of years of research by large teams of some of the top researchers, with almost unlimited funding for computation power, data collection, and r&d
they also have access to enormous amounts of existing speech data
it's very likely that no individual human could ever build such a thing from scratch even in an infinite lifetime
severe dome
ah i see thank you!
severe dome
hey so sorry to bother again
may i know what the train_test_split(X, y, test_size=0.2) mean? thanks!

 iron basalt
desert oar
it's very likely that no individual human could ever build such a thing from scr...
iron basalt
desert oar
it's very likely that no individual human could ever build such a thing from scr...
Indeed, this is why it's important to not copy what the giant corporations are doing with deep learning but work on much more efficient machine learning methods (stuff that everyone can run and with enough work will end up out performing that huge stuff too (in the future with enough research)). But that is if you are into research.
desert oar
severe dome
may i know what the ```train_test_split(X, y, test_size=0.2)``` mean? thanks!
it splits the dataset with 80% in one part and 20% in the other. the intention is that you use the 80% to train the model, and the 20% to test its performance
severe dome
desert oar
it splits the dataset with 80% in one part and 20% in the other. the intention i...
so 80% goes to X and 20% goes to y?
arctic wedgeBOT
Bad argument
Could not convert "user" into Member or User.
User "guide" not found.
 Command Help
!user [user]
Can also use: member_info, member, u, user_info
Returns info about a user.
desert oar
iron basalt
Indeed, this is why it's important to not copy what the giant corporations are d...
fair enough, although "deep learning" is kind of a big range of techniques now. now everyone has access to GPUs and CNNs aren't a big deal anymore
desert oar
severe dome
!user guide
plus @iron basalt you can directly benefit from megacorps training their megamodels by using the pre-trained versions. no need to train your own BERT
severe dome
so basically test_size 0.2 means im allocating 0.2 to the _test variables
ah thanks!
iron basalt
desert oar
fair enough, although "deep learning" is kind of a big range of techniques now. ...
Yup, but if you want to make something ground breaking you either need all that compute, or just use what they are willing to give you.
desert oar
where do you see something called _size?
built-in methods do not start with .
. is not a valid letter in a python variable name
severe dome
desert oar
where do you see something called `_size`?
the ```test_size=0.2
test_size is the parameter name
test_size=0.2 means "pass the argument 0.2 to the parameter test_size"
iron basalt
severe dome
the ```test_size=0.2
```
Keyword arguments are one of those Python features that often seems a little odd for folks moving to Python from many other programming languages. It …
severe dome
is there a parameter guide for Jupyter?
im a bit confused on when to use parameters
all i understand is parameters are extensions of function
but there isnt a function here so im confused
for example the parameter here is name in the function, greet_user
 iron basalt
severe dome
is there a parameter guide for Jupyter?
iron basalt
severe dome
is there a parameter guide for Jupyter?
Many python functions have default parameters, that is, you may not fill them out and it will be some default value. Other parameters do not have default values and must be filled in by you.
In your greet function, name does not have a default value.
severe dome
iron basalt
Many python functions have default parameters, that is, you may not fill them ou...
ah so in this case, test_size is set to none which is the default value till i made it 0.2
iron basalt
severe dome
ah so in this case, test_size is set to none which is the default value till i m...
Yes.
severe dome
so now that my test_size parameter is set, how does this parameter affect my y_test variable for example?
iron basalt
def greet(name="bob"):
  print(f'Hi {name}!')
  print('Welcome aboard')
This function now has the default value of "bob" and can be called with just greet()
 fading burrow
severe dome
so now that my test_size parameter is set, how does this parameter affect my y_t...
fading burrow
severe dome
so now that my test_size parameter is set, how does this parameter affect my y_t...
your y_test vector will contain 20% of your y vector. 0.2 = 20%
severe dome
iron basalt
```py
def greet(name="bob"):
print(f'Hi {name}!')
print('Welcome aboard')
``...
hmm i get it
severe dome
fading burrow
your y_test vector will contain 20% of your y vector. 0.2 = 20%
so 0.2 is stored in the test parameter right?
fading burrow
test_size parameter
severe dome
my y_test does not contain test_size, so how does the machine recognize that it is referring to the same parameter?
fading burrow
uh, well, that's what the function train_test_split returns
it returns 4 separate arrays
iron basalt
The train test split function split your X and y each into two parts.
Each part's length proportional to the split percentage.
fading burrow
the X_train, y_train will contain 80% of your X and y data, and X_test, and y_test will contain 20%
severe dome
ohhhhhhh so basically now that I have 2 parts of X, the part of X with the _test will get 20% right?
fading burrow
if you set test_size to 0.2
iron basalt
Yes 1.0 - 0.2 = 0.8
severe dome
omg i think i got it
let me try something
must the order be the same? meaning X_train, X_test, y_train, y_test?
ohh... i swapped it and it failed
 fading burrow
yeah, they must be in that order
severe dome
does that mean that when the train_test_split split the X and y into 4 arrays, it gives the % based on order? instead of giving it based on _train?
lapis sequoia
severe dome
ohh... i swapped it and it failed
it always goes X_train, X_test, y_train, y_test
fading burrow
the machine doesn't care about your variable names
lapis sequoia
you won't have the same row size for train and test
fading burrow
the function returns values in a specific order
severe dome
lapis sequoia
it always goes `X_train, X_test, y_train, y_test`
ahh i see, unless i put the test_size = 0.8 then the order is swapped right?
lapis sequoia
why would you do that?
severe dome
no idea haha just confirming that i understood what u meant
severe dome
fading burrow
the function returns values in a specific order
ah thanks!!
lapis sequoia
severe dome
no idea haha just confirming that i understood what u meant
you use train to train your model, you use test to test your model
fading burrow
well, also, you shouldn't do that in that order, since training data is shuffled
lapis sequoia
0.8 just makes you test size 80% of your dataset
severe dome
is there a way to lets say create a keyword argument for this?
severe dome
fading burrow
well, also, you shouldn't do that in that order, since training data is shuffled
ah thanks! so ill stick to train, test, train, test
it has to be X and y right? i cant use Z for example
fading burrow
it's the convention
lapis sequoia
severe dome
it has to be X and y right? i cant use Z for example
you can, it is just that X stands for your X axis and y is your y axis, there are a lot of explanation on why that idea can be flawed, but don't focus on that
lapis sequoia
yeah
fading burrow
a method, to be precise
severe dome
so what it does is it fits my variables into the decisiontreeclassifier?
severe dome
fading burrow
a method, to be precise
yep!!
so train_test_split is an imported class and .fit is a method
fading burrow
train_test_split is a function
severe dome
fading burrow
train_test_split is a function
ah my bad
 young valve
hey guys, i am trying to find the most optimal way to categorize my nominal variables; is there any function/non-python process that i could look into?
fading burrow
methods are also functions, they're just called on a class instance
severe dome
fading burrow
methods are also functions, they're just called on a class instance
ah ty!
young valve
https://www.ibm.com/docs/en/spss-statistics/23.0.0?topic=data-what-is-optimal-scaling something along these lines i think
severe dome
fading burrow
methods are also functions, they're just called on a class instance
and when i perform score = accuracy_score(y_test, predictions) it means that the code is taking a look at the 20% of data it was fed and then compare it with the 20% of data fed to X_test predicted values right?
fading burrow
it compares the true labels and the predicted lables. the metric depends on the type of model you're using
severe dome
OH yea i shld be right
this is really confusing im not sure if i can replicate this in a new project
fading burrow
just read the documentations properly
severe dome
i will go to kraggle to find some projects to try
severe dome
fading burrow
just read the documentations properly
as in the user guide?
stuck karma
Hello !
I want to do an outlier detection on my pls (with isolation forest in sci kit learn)
I would like to eliminate spectra that are too different from the others.
The spectra are my samples, defined by their value in the different features.
If I do model.fit(X)
I think it detects outliers in a column
While in my case it should take into account the row seems and not just a value of the row for a sample
 quasi sparrow
stuck karma
Hello !
I want to do an outlier detection on my pls (with isolation forest in sc...
quasi sparrow
stuck karma
Hello !
I want to do an outlier detection on my pls (with isolation forest in sc...
What model are you using?
stuck karma
Pls régression model and for the detection of outliers isolation forest
quasi sparrow
You can use encoder-decoder
stuck karma
You mean create a column or something with a value that resume the spectrum? @quasi sparrow
iron basalt
severe dome
```model.fit(X_train, y_train)```, the .fit is a function right?
What python does behind the scenes is actually model.fit(X_train, y_train) -> fit(model, X_train, y_train). It's all functions, but ones attached to classes are called methods and have their first argument be self which python automatically passes to it. In this case self was model.
 desert bear
hi everyone, I am working on a speak recognition tool sadly it is not working right now. i don't know why but i hope that someone can help you can find the code hear: https://github.com/anonymous0230/Just-A-Rather-Very-Inintelligent-System/tree/0.1 also read the README there is a very imported thing there. explanation by code.If you want to run the code you also need to download the model in the readme file. Then first run the model.py
so that everything is trained and after that, you can run the mail.py
Then he will make sure your mic turns on and then you can ask things.
We have the main.py
file. this is the main file in this there are the responses and some practical info like turn on the mic import classifier and more
Then we have the init.py in this there is the code of what the programme needs to do when it recognize some words.
The model is to learn the train.yml so it recognizes words and knows what it needs to do.
The classifier.py
is the file that connects the words to the right thing to do so when I ask what is the time the classifier needs to say oke run the what time is code.
Other folders like IA_inplumentations and test are things I am working on and for now not really necessary
Thanks

GitHub
Just A Rather Very Intelligent System. Contribute to anonymous0230/Just-A-Rather-Very-Inintelligent-System development by creating an account on GitHub.
severe dome
iron basalt
What python does behind the scenes is actually `model.fit(X_train, y_train)` -> ...
Ah thank you!
Really appreciate it
desert oar
severe dome
must the order be the same? meaning X_train, X_test, y_train, y_test?
keep in mind that the variable names don't matter. it always returns the results in that order, but you can give the variables any name you want
severe dome
Thank you!
I’ll keep trying projects
And hopefully I get better
Really appreciate the help
Means a lot to me
iron basalt
severe dome
Thank you!
yes imagine _, _, _, _ = train_test_split(...). You can name the 4 things it returns whatever you want, but they will still be the same 4 things, always returned in the same order. Named/keyword arguments passed as inputs to the function can be in whatever order you want.
severe dome
Yep so I need to create a keyword argument to change their positions right?
iron basalt
severe dome
Yep so I need to create a keyword argument to change their positions right?
You can't change the return value positions, only the inputs, if they are named.
Keyword arguments are one of those Python features that often seems a little odd for folks moving to Python from many other programming languages. It …
severe dome
iron basalt
You can't change the return value positions, only the inputs, if they are named.
Ah got it thank you!
iron basalt
Other programming languages let you also use names to specify return values in any order, but not python.
severe dome
Ah I see
AI is so confusing
I come from a science background so coding is entirely new for me
So I really appreciate the help y’all have given to me
quasi sparrow
Anyone knows a way to fix too many values to unpack (expected 2)? It has to do with the way Python unpacks the data. But I can't think of another way to unpack this data.
def xgboost_optimized(max_depth,gamma,learning_rate,n_estimators,subsample,colsample_bytree):

    params={'max_depth':int(max_depth),'gamma':gamma,
            'n_estimators':int(n_estimators),
            'learning_rate':learning_rate,
            'subsample':subsample,'colsample_bytree':colsample_bytree,
            'eval_metric':'rmse'}

    cv_result=xgb.cv(params,d_matrix,num_boost_round=700,nfold=5)
    return -1.0 * cv_result['test-rmse-mean'].iloc[-1]

xgb_bo = BayesianOptimization(xgboost_optimized, {'max_depth': (3,4,6,7,8),
                                             'gamma': (0,0.05,0.1,0.15,0.20),
                                             'learning_rate':(0.095,0.1,0.15,0.20,0.25),
                                             'n_estimators':(100,200,300,400,500),
                                             'subsample':(0.4,0.45,0.5,0.55,0.6),
                                             'colsample_bytree':(0.4,0.45,0.5,0.55,0.6),
                                            })


xgb_bo.maximize(n_iter=6, init_points=8, acq='ei')
I'm using bayesian optimization to find optimal hyperparameters on a XGBoost model.
This is my error:
ValueError                                Traceback (most recent call last)

~\AppData\Local\Temp/ipykernel_8504/2178023411.py in <module>
----> 1 xgb_bo.maximize(n_iter=6, init_points=8, acq='ei')
      2
      3

D:\xgboost_cancer_classifier\venv\lib\site-packages\bayes_opt\bayesian_optimization.py in maximize(self, init_points, n_iter, acq, kappa, kappa_decay, kappa_decay_delay, xi, **gp_params)
    166         self._prime_subscriptions()
    167         self.dispatch(Events.OPTIMIZATION_START)
--> 168         self._prime_queue(init_points)
    169         self.set_gp_params(**gp_params)
    170

D:\xgboost_cancer_classifier\venv\lib\site-packages\bayes_opt\bayesian_optimization.py in _prime_queue(self, init_points)
    145
    146         for _ in range(init_points):
--> 147             self._queue.add(self._space.random_sample())
    148
    149     def _prime_subscriptions(self):

D:\xgboost_cancer_classifier\venv\lib\site-packages\bayes_opt\target_space.py in random_sample(self)
    215         # TODO: support integer, category, and basic scipy.optimize constraints
    216         data = np.empty((1, self.dim))
--> 217         for col, (lower, upper) in enumerate(self._bounds):
    218             data.T[col] = self.random_state.uniform(lower, upper, size=1)
    219         return data.ravel()

ValueError: too many values to unpack (expected 2)
But the problem is that the code worked before adding more hyperparameters to optimize.
desert oar
@quasi sparrow for col, (lower, upper) in enumerate(self._bounds) the error is thatself._bounds is expected to have a structure like [('a', (-1, 1)), ('b', (-2, 2)), ...] , but somehow it doesn't in this case
possibly/likely because you passed in some incorrect data
where is this BayesianOptimization class from?
the good part is that you aren't the one "unpacking" the data - it's happening inside this bayes_opt library
the bad news is that it's not at all clear what exactly you did wrong, because the library authors failed to put proper error checking in place

check the docstring for that class and make sure you passed in the right data types https://github.com/fmfn/BayesianOptimization/blob/master/bayes_opt/bayesian_optimization.py#L66-L103

GitHub
A Python implementation of global optimization with gaussian processes. - BayesianOptimization/bayesian_optimization.py at master · fmfn/BayesianOptimization
quasi sparrow
Oh yeah, it's expecting a lower and upper boundary!
When I changed the code to more hyperparameters to find, I changed to 6 points of interest instead of upper and lower boundary.
The documentation on this library is almost non-existent.
quasi sparrow
desert oar
check the docstring for that class and make sure you passed in the right data ty...
At least the documentation on the GitHub page. I will read this documentation, thanks a lot!
desert oar
also in general the fact that these were tuples and not lists could be an indicator
tuples are for "fixed size records", like a pair of low/high range bounds. whereas a list is for more general "sequences" or "collections"
quasi sparrow
The docs are embedded in the code
desert oar
yeah, a lot of libraries write their docs in-line with the code. but scikit-learn, pandas, etc. also use some separate tools to extract those docs to host on their websites
these library devs did the former but not the latter
quasi sparrow
Yes, I think this is the problem. The sample code that they provide is using tuples.
But isn't the dimensionality of hyperparameters must be of the same size when doing bayesian optimization
quasi sparrow
desert oar
tuples are for "fixed size records", like a pair of low/high range bounds. where...
Thanks! This is it.
quiet vault
2021-08-23 15:26:06.418425: W tensorflow/core/common_runtime/bfc_allocator.cc:272] Allocator (GPU_0_bfc) ran out of memory trying to allocate 1.04GiB with freed_by_count=0. The caller indicates that this is not a failure, but may mean that there could be performance gains if more memory were available.
What would be these "possible gains"?
stuck karma
hello, i tried an isolation forest like this py #ISOLATION FOREST IFmodel = IsolationForest(contamination=0.01) IFmodel.fit(X) IFmodel.predict(X) print (IFmodel.predict(X))
i gives me a matrix with 1 and -1. I guess -1 means the outliers (but not sure)
was wondering how to get the index of the sample (row) witch is identified as an outlier?
because i would like to drop them from the dataset
 raw temple
Hi everyone, I have a question. I have a dataset of tweets in which I've split into a training and validation set and predicted the sentiment for them. It was an unlabelled dataset so I used VADER to predict the sentiment and I manually went through the validation set to make sure it was more or less accurate. Now I want to evaluate whether the model I've chosen is good to use and im looking at the AUC-ROC curve and I want to know if I am able to calculate the true positive and true negatives if this was an unlabelled dataset to begin with? Im not sure if im understanding the articles I read correctly but they all seem to have labelled datasets, build their own model and compare their predictions to the original dataset.
What do you mean by floats?
Sorry, I'm relatively new to coding so I'm not familiar with many technical terms
You mean like 1 or 0?
Well the outcome i have in my sentiment column is a number 1 or 0
1 is positive, 0 is negative
Yes, is that not correct?
😱
Okay
So the output from my model, like some machine learning model?
But if my dataset is unlabelled, how can I predict the sentiment for it? I thought VADER was used as an unsupervised learning method
Yeah
Thats what I'm having trouble with now, how to compare when I have nothing to compare with
The goal is to find whether there has been an increase of positive or negative sentiment over the past year
Indeed they are
So if I don't have a labelled dataset to begin with, am I not able to implement the AUC-ROC curve?
I'm trying to analyse the trend of sentiment from the past year for my dissertation, but I want it related to covid so I've taken my own dataset
I suppose it doesnt need to be industry standard, it just needs to work adequately 🤣😅
Business analytics
So the focus would be more on the analysis, not really the model itself
Thus, can I just simply evaluate the model using precision, F1 and things like that then?
🤣🤣🤣
I already have a topic in mind
I was just reading some articles about the evaluation of machine learning models and came across the AUC-ROC curve
Anyway, thanks for clearing up the whole confusion with it, since I cant use that with my dataset, ill look into different methods
🤣🤣
Thats a broad scope
I see
stuck karma
hello, im trying to clean my dataset from outliers: first line is a boolean indexing
then the X[outliers] gives the samples (rows) witch are considered as outliers
but it seems impossible to save it in avariableoutliers = IFmodel.predict(X) == -1 outliers_np = X[outliers]
when i wanna print outliers_np it says that its not defined
stuck karma
raw temple
Anyway, thanks for clearing up the whole confusion with it, since I cant use tha...
hey , if you are looking for a model that match with your dataset , you can type "model machine learning scikit learn" on google and you'll see a beautiful and clear schema
raw temple
stuck karma
hey , if you are looking for a model that match with your dataset , you can ty...
Im not really looking for a model, I have one. I just wanted to know what sort of evaluation metrics I could use for my dataset
stuck karma
i didnt read all the cnversation but seems like you pick one randomly?
i mean did you choosed after analysing your dataset
for metrics you can look the doc whitch is relative to your model
this doc is nice and easy to understand https://scikit-learn.org/stable/modules/model_evaluation.html
it gives you few metrics used to evaluate a type of model (regression or classification and so)
i think Satya said this because it seems like you dont focus on your dataset and just try to go straight to your idea without exploring your data (selecting the variables that depends on your problem etc)
raw temple
stuck karma
this doc is nice and easy to understand https://scikit-learn.org/stable/modules/...
Ah I see, okay I get what you mean now. I am relatively new to this field so I have many things I dont understand. I will read through the document you sent. Thanks for sharing it
stuck karma
ok your welcome! this is the practice part but if i may suggest an idea, you can (or maybe you alreay do) read papers relative with your problem
because its not only about coding , you should understand what you do and why you do that
raw temple
I have read multiple, but relatively few work with unlabelled datasets like I did
raw temple
stuck karma
because its not only about coding , you should understand what you do and why yo...
Yes, I am trying to find out all this so I can use it in the future too if I need to
stuck karma
i mean , try to go deeper, not only about modelisation in general but specifically to your context . Because knowing the context and analysing your data will help you for the methodic part
my english is so poor ugh
you said it in the begining that its not the modelisation the most important but the analysis
raw temple
I know what you mean. Any advice is very helpful. Thank you ☺
stuck karma
your welcome (':
raw temple
Yeah, in the bulk of my paper, I will analyse the results and find evidence to explain why things happen and such
stuck karma
but its not only for the result part
its before
for example to extract the relation between your variables , to explain the relation
statistics, preprocessing... choosing your model. And optimisation
all these choices are made after understanding your data
raw temple
Yes, I know, that is true too
hushed quiver
how tf people tryna do data science without knowing what a floating point is...
raw temple
hushed quiver
how tf people tryna do data science without knowing what a floating point is...
Sorry im very new to this 😅 data science isn't my major
Sorry if my questions seem very obvious or silly
 proven sigil
Anyone used/know of reinforcement learning to build bot for any board games? Code reference would be greatly helpful. Thanks!
lapis sequoia
alpha zero
there is a huge amount of resources for a0
start with the papers
and then simple alpha zero
proven sigil
Cool, thanks :)
quiet vault
Is 6 gigs of vram enough to train a yolov3 model?
 jolly sinew
Sorry for this library specific question, but if anyone has used Luigi for ETL, I have import mappings for columns stored in a MySQL database and would like to retrieve those for each file import based on the customer specific csv column to MySQL column, the thing I’m having an issue with currently is whether I should run a task to retrieve the import mappings at the beginning of the pipeline, or have this logic run entirely outside of the other tasks.
Luigi tasks seem to be somewhat biased towards outputting a csv or other type of file and it seems like a waste to have these customer data mappings modeled in memory just to output them immediately to a csv and then reparse them on every task
 coarse sigil
I don't know anything about data science and ai from where do I learn
 proven arrow
coarse sigil
I don't know anything about data science and ai from where do I learn
proven arrow
coarse sigil
I don't know anything about data science and ai from where do I learn
start from python pandas, numpy blah blah
jolly sinew
I think real python, codewars, hackerrank, and good ol youtube really helped me get some of the basic concepts
MIT has a really good deep learning course on YouTube that’s free that has code samples
desert oar
i disagree with the above. learn some statistics
 polar lantern
Cannot read one file in zip file if zip file contains multiple files. This example does not work https://www.py4u.net/discuss/203494 as Pandas shows a ValueError: Multiple files found in ZIP file. Only one file per ZIP:
orchid silo
cerulean ruin
Did you have a specific question?
Not any specific yet
Im just a beginner
But nice to know im on the right track
Thank you for let me know that possible and im on the rigght track
None of ppl in my country do this so im the first that make me little scare about the journey i choose
arctic wedgeBOT
:incoming_envelope: :ok_hand: applied mute to @fresh axle until <t:1629793790:f> (9 minutes and 59 seconds) (reason: duplicates rule: sent 4 duplicated messages in 10s).
 plush leaf
I have a question for you. I prepare a Tensorflow Certificate Exam. Where do I find sample exam examples and questions?
mortal dove
desert oar
i disagree with the above. learn some statistics
I agree with the above. Learn some statistics
 nova bane
So I tried to find correlation between two variable using scatterplot. Anyone can explain what is happening in this graph?
 plush leaf
Has anyone who entered Tensorflow Certification Exam previously contacted with me? I'll ask a couple of questions.
mortal dove
nova bane
So I tried to find correlation between two variable using scatterplot. Anyone ca...
Mind sharing the piece of code producing this graph?
nova bane
mortal dove
Mind sharing the piece of code producing this graph?
sns.scatterplot(x=dataset['OrderCount'], y =dataset['CouponUsed'])

Predict customer churn and make suggestions
you can also view the dataset that i used
stuck karma
hello
Im trying to remove the outliers from my dataset (the X is my features and y the target)
It seems like it works fot X but for y it say TypeError: 'numpy.float64' object is not iterable
Here is my code: ```py
#ISOLATION FOREST
IFmodel = IsolationForest(contamination=0.01) #IFmodel=Isolation Forest model
IFmodel.fit(X)
IFmodel.predict(X)
#BOOLEAN INDEXING
outliers = IFmodel.predict(X) == -1
outliers_x = X[outliers] #10 outliers (927/100) for X and y
outliers_y = y[outliers]
print(outliers_y)
#REMOVE OUTLIERS FROM DATASET (X= X - outliers) and (y= y-outliers)
new_X = np.array(list(r_row for r_row
in frozenset(tuple(X_row) for X_row in X)
- frozenset(tuple(outliers_x_row) for outliers_x_row in outliers_x)))
new_y = y[~outliers_y]
#NEW DATASET WITHOUT OUTLIERS
X = new_X
y = new_y
 tidal bough
hmm, do you really need the set operations, as opposed to, say, new_X = X[~outliers]?
stuck karma
I m looking how to remove the outliers from the dataset
tidal bough
yeah, but isn't that as simple as selecting all rows not marked as outliers? The only reason I can see for my approach not working is if you have duplicate rows, and outliers only mentions one row of each set of duplicates, while you want to remove them all.
but I don't see why outliers wouldn't mark all the outliers, duplicated ones included
stuck karma
what do you mean by duplicated ones?
i dont have duplicated rows
i can select the good rows too it doesnt matter
the aim is just to not take outliers into account
tidal bough
so why not new_X = X[~outliers]? You already have an array specifying all the outliers - just take all rows that aren't outliers.
stuck karma
the outliers_x returns the rows of my outliers in my dataset
i just didnt know the command i guess!
is ~ remove the lines?
or ignore (its the same)
tidal bough
~ on numpy arrays is elementwise NOT.
So each True will change to False and vice versa
stuck karma
oh okay, i see. But i have a problem since when i runned my code in the first time i didnt make the lines with new_y (witch is false)
and it said that ": Found input variables with inconsistent numbers of samples: [918, 928]"
because 928 is my itnitial rows and 918 are the rows after removing outliers
so i thought it was because i didnt remove the outliers rows from y. I dont know
yes as expected boolean index did not match indexed array along dimension 0; dimension is 918 but corresponding boolean dimension is 928
same kind of error
with the ~
tidal bough
Did you remove the outliers from Y?
stuck karma
no seems it doesnt work
stuck karma
stuck karma
hello
Im trying to remove the outliers from my dataset (the X is my features and...
this is the problem
everything work for x
i used py new_y=y[ ~outliers_y]
tidal bough
what's your code for removing outliers currently?
grave frost
I have a pandas question (sigh) I want to concatenate rows with the same ID.
found this snippet off S.O
train_df.groupby('ID').agg(lambda x: x.tolist())
unfortunately, the new DF it returns doesn't contain the ID column 😦
how can I retain the ID column while concatenating rows with the same ID?
stuck karma
stuck karma
hello
Im trying to remove the outliers from my dataset (the X is my features and...
here it is
tidal bough
stuck karma
i used ```py new_y=y[ ~outliers_y]```
outliers_y is a list of outliers.
stuck karma
now it says IndexError: arrays used as indices must be of integer (or boolean) type for the y part again
tidal bough
you should just be doing
new_X = X[~outliers]
new_Y = Y[~outliers]
its an array
new_x doesnt need to be edited
its a multidimensional array
so it's fine
the problem is with the y
I did wrote as you said : new_y =y[ ~outliers]
so here is the error ufunc 'invert' not supported for the input types, and the inputs could not be safely coerced to any supported types according to the casting rule ''safe''
i tried to add py .astype(float) but didnt work
lapis sequoia
hey guys, very general question, not coding specific enough for a help channel:
how do you guys manage your data science code in python? I'm working in VSCode (usually TypeScript). Components (= python modules) are broken down to into small pieces with no more than 200 lines of code.
Now in data science (python) people seem to work with endlessly long files (even for .py, not just ipynb). I'd like to modularize it with requires a lot of extra, manually created code (no auto-import). e.g. :
sys.path sys.path.insert(0, '/home/.../Desktop/Folder_2’)
question: WHAT DO YOU USE TO AUTOIMPORT YOUR FUNCTIONS FROM FILES THAT ARE NOT IN THE SAME FOLDERS/DIRECTORIES?
stuck karma
Hey ,i have question about detection of outliers with scikit learn (ex: isolation forest):
When we do IsolationForest.fit(train_X)
I imagine that what is taken as outliers are values in a cell by variable?
For example if the variable is the price then it considers as outlier the sample corresponding to this extreme value.
Whereas in my case I don't want to see if there is an abnormal value per variable but rather to see if the set of values for the variables of a sample are very different from the rest of the samples
stuck karma
Please can someone answer?
 broken warren
hi i got a simple LSTM which i tested on a sin curve. The problem is that i has very good acuracy but a bad prediction.

for the first time steps the prediction is OK but then it goes bad super fast
desert bear
hi everyone i am working on a speak recognition tool sadly it is not working right now. i don't know why but i hope that someone can help you can find the code hear: https://github.com/anonymous0230/Just-A-Rather-Very-Inintelligent-System/tree/0.1 also read the README there is a very imported thing there. thanksA
GitHub
Just A Rather Very Intelligent System. Contribute to anonymous0230/Just-A-Rather-Very-Inintelligent-System development by creating an account on GitHub.
velvet thorn
grave frost
I have a pandas question (*sigh*) I want to concatenate rows with the same ID.
...
look into the as_index kwarg
grave frost
velvet thorn
look into the `as_index` kwarg
ahh, that's much neater I suppose. I just reset_index-ed it and went to bed 😛
velvet thorn
grave frost
ahh, that's much neater I suppose. I just `reset_index`-ed it and went to bed 😛
that works too
 elfin frigate
hello guys,
Is it doable to make CNN based regression for Leaf water content estimation for the data set called Indian Pines ?
Because i couldn't find any other hyperspectral data set that somehow matches my theme.
 fierce gazelle
hi all
I am trying to use the Clova AI trained models alongside with this guide to build an OCR tool:
https://towardsdatascience.com/pytorch-scene-text-detection-and-recognition-by-craft-and-a-four-stage-network-ec814d39db05
But I get the problem at step number 6 (Crop Images)
Here is output from terminal:
user@user:~/Desktop/[OK - CSV] DL-Test 3/CRAFT-pytorch$ python3 crop_images.py
/usr/local/lib/python3.7/dist-packages/IPython/utils/traitlets.py:5: UserWarning: IPython.utils.traitlets has moved to a top-level traitlets package.
  warn("IPython.utils.traitlets has moved to a top-level traitlets package.")
Traceback (most recent call last):
  File "crop_images.py", line 71, in <module>
    generate_words(image_name, score_bbox, image)
  File "crop_images.py", line 46, in generate_words
    word = crop(pts, image)
  File "crop_images.py", line 16, in crop
    cropped = image[y:y+h, x:x+w].copy()
TypeError: 'NoneType' object is not subscriptable
generate_words function consumes .csv file fields (according to step number 5 in the guide).
As far as I understand, the code tries to iterate over a None type, but I cannot understand what exactly I have to get fixed.
Please, can seomeone help me with that? I am new to Python language.
Thank you!

Medium
The pandemic has locked us in our homes for quite a few months now. :(
But remember, when life was normal, we’d go shopping, hang out with…
quiet vault
elfin frigate
hello guys,
Is it doable to make CNN based regression for Leaf water content es...
Not sure about the dataset but it is possible to regression with a CNN model
elfin frigate
Yes, that i know. Unfortunately, the project is called CNN based regression for LWC estimation. I don't have the dataset for that and that's why i asked if i could still do Leaf water content with that data set
 quiet vault
broken warren
hi i got a simple LSTM which i tested on a sin curve. The problem is that i has ...
quiet vault
broken warren
hi i got a simple LSTM which i tested on a sin curve. The problem is that i has ...
Did you overfit the model?
Having a model with good accuracy on the training data set and bad on data that it has not seen, it likely due to over fitting. To reduce this, you can reduce the amount of epochs
broken warren
nah i was the least mound of epochs needed to learn the curve
i made a more complex model now it is a little better

 sick wedge
Hey guys, I'm looking for a good way to parse specific data from multiple catalogue tables, ranging from ascii table formats to just a plain old PDF, can anyone recommend some good technologies?
Here's some examples:
the ASCII table, should be fairly simplistic, I'm sure there's way I can pull specific info off the source code, I'm pretty new with ML techniques though so any recommendation or advise would be appreciated

the PDF table looks like this, I was thinking that I could highlight and copy the text and use regex to get the specific data I want
 desert oar
@sick wedge i've used https://tabula.technology/ for parsing pdf tables
Tabula is a free tool for extracting data from PDF files into CSV and Excel files.
there's also this wrapper https://pypi.org/project/tabula-py/ but i haven't used it
 oblique ridge
Has anyone used GeoPandas before? I would like to consult you if possible
serene scaffold
oblique ridge
Has anyone used GeoPandas before? I would like to consult you if possible
It's best to just put your question out there. Even if there's someone around who knows about GeoPandas, they don't know your question until you ask it.
oblique ridge
serene scaffold
It's best to just put your question out there. Even if there's someone around wh...
Got it. Thank you!
stuck karma
hi, my boyfriend has to choose next year between
- take game theory or stata classes. What do you recommend?
Which is more interesting - for statistics which is more interesting between R or stata (he doesn't know how to code yet)
- and is it possible to use stata if you take R
(So which is more profitable)
you can ping me ~
serene scaffold
stuck karma
hi, my boyfriend has to choose next year between
1) take game theory or stata cl...
It looks like stata is a language that runs in a proprietary environment, so I would think learning R would be more transferable.
stuck karma
thank you for your answer!
serene scaffold
stuck karma
thank you for your answer!
You might wait for input from someone more familiar with R and stata. My impression would be to say "skip all of that and just learn Python" because this is, well, Python Discord.
serene scaffold
yes
stuck karma
and what would be better : econometrics or game theory?
because one of them would be dropped
mortal dove
I'd suggest looking at which tools jobs in the area use. As much as I'd love to use R in jobs, majority of local jobs use SAS, so that would be better to do in my case.
@stuck karma
sick wedge
stuck karma
and what would be better : econometrics or game theory?
I wouldn't recommend trying to pick what's "better", tell him to look at the module details and pick what he thinks is most interesting/what he'll enjoy the most. Then he's sure to get a good grade and that's what matters really
imo
mortal dove
And for econometrics/game theory I'd agree with the above. Since it's not a specific tool, I'd go for the one I'd enjoy more
stuck karma
sick wedge
I wouldn't recommend trying to pick what's "better", tell him to look at the mod...
He is interested by both. He just wants to know what is most useful for job and stuff. What skills make the difference
stuck karma
mortal dove
And for econometrics/game theory I'd agree with the above. Since it's not a spec...
Oh okay
mortal dove
If he's interested enough to do both, I'd take the one less interested as formal classes and work through the other in my own time.
desert oar
stuck karma
hi, my boyfriend has to choose next year between
1) take game theory or stata cl...
having used both, R > Stata for many reasons, one of which is that Stata is proprietary and expensive. the other reason is that Stata programming is awful and the language is awful and there's literally nothing you can do in Stata that you can't do in R
mortal dove
Companies like propriety software though, since there's someone to hold responsible if something breaks due to that software
desert oar
- do game theory, it's not useful for DS as such, but it'll be enlightening and adds to their "reasoning/modeling with math" toolbox
- R
- of course it's possible, but don't
desert oar
mortal dove
Companies *like* propriety software though, since there's someone to hold respon...
nobody uses stata in industry though
SAS, yes
Stata, no
plus there are paid R distributions (e.g. Microsoft R Open) for that purpose
mortal dove
I've never seen it in a job description, but thought that might just be locally
desert oar
stata is pretty much only used by econometricians and sociologists afaik
R is really common now in insurance too
if you can, learn some basic SAS, it might score you a job
PROC DATA and whatever
but it's not really useful either, i haven't touched SAS since 2013 and haven't needed to
mortal dove
R is unfortunately barely used locally, everyone uses SAS. Will be doing it on my own time next year
desert oar
yeah it's like the COBOL of data analysis
it's there, it's still in use, it's not going anywhere, but that's the only reason to learn it or care about it
cerulean ruin
mortal dove
R is unfortunately barely used locally, everyone uses SAS. Will be doing it on m...
Oh kinda wild I felt the opposite
R used heavily and SAS is nonexistent
lapis sequoia
yall r smart
 velvet rover
I need to enhance the forecast by forecasting the errors in order to make it more accurate. I have two sets of data values: the actual hourly data that was generated and the forecasted day ahead data. I'd want to evaluate the errors - the historical errors of the wind forecast - and see how accurate they are. simply say: compute the difference between what happened and what was predicted based on the historical data. After that, I'd like to develop a model that can be used to forecast data for the future.
How can this be achieved in Python? Could you please help me with this.
 verbal seal
What libraries do I use for developing ChatBots?
royal crest
!pypi sentence-transformers
arctic wedgeBOT

Sentence Embeddings using BERT / RoBERTa / XLM-R
verbal seal
Thxx
royal crest
is one of many
 noble gazelle
velvet rover
I need to enhance the forecast by forecasting the errors in order to make it mor...
noble gazelle
velvet rover
I need to enhance the forecast by forecasting the errors in order to make it mor...
There are many methods you can choose, maybe you can start by using ARIMA and for the error MSE is pretty common
quiet vault
If there is seasonality and trend, use SARIMA instead

Machine Learning Mastery
Autoregressive Integrated Moving Average, or ARIMA, is one of the most widely used forecasting methods for univariate time series data […]
iron basalt
stuck karma
and what would be better : econometrics or game theory?
Game theory is very interesting and applicable to many things (one of my favorite things / world view changing). I recommend just looking up both topics and seeing which one seems to more interesting to you.
(And anything von Neumann was involved in is pretty much guaranteed to be a gold mine of insight)
 devout zodiac
I'm having hickups training my CNN/ResNet in Pytorch. After ~2000 updates I observe a sharp, exponential inrease in the time it takes for both forward and backward operations. I thought it might be a data leak, but the memory profiler I used didn't show any increase (however I'm not sure if pytorch is using memory outside of what mprof run main.py tracks). With both the time specific to the forward and backward options and the lack of increase of memory I can safely rule out the dataloader.
Is there a way to get the size/depth/number of nodes of the graph so I can check on that somehow? Or what else could cause such an increase?
(Pytorch 1.8.1, learning on CPU (I know... GPU has been ordered almost a year ago.)) Please ping me in a response or for further info!
stuck karma
iron basalt
Game theory is very interesting and applicable to many things (one of my favorit...
Thank you!
 valid pebble
how can I get index of all the rows of a dataframe where I find almost matching patterns using difflib df.loc[df[col].apply(lambda x: difflib.SequenceMatcher(None,pat,x).ratio()) >= 0.85].index I can run this for all the cols but I feel it won't be efficient
royal crest
is efficiency really a problem
like are you dealing with hundreds of thousands of rows
 eternal fractal
i got a quick question
how do you map each filename to its respective class in this dataframe.. I've used the Diagnostic Keywords column to extract the normal and cataract but for the other classes, there are various keywords used.
-- oh right, first time asking a question here, so i dont know how to properly do it yet in this server
 valid pebble
royal crest
like are you dealing with hundreds of thousands of rows
valid pebble
royal crest
like are you dealing with hundreds of thousands of rows
actually yes data might be in gbs it will be deployed over ec2
 coral kindle
I want to ask something about LDA (Latent Dirichlet Allocation). I heard it wasn't that great to find topics despite the tehcnique being commonly used. Does it rely on data cleaning mostly?
It's like... THE main technique to do non-supervised NLP
 robust yacht

yes we made the bot.
no AI does not stand for Alibaba Intelligence
Alina spam go BRRR
let me know if I should make this AI public idk if you guys are interested in chatting to it
stuck karma

 rigid zodiac
Hi guys, have you ever encounter this issue```WARNING:tensorflow:Early stopping conditioned on metric acc which is not available. Available metrics are: loss,accuracy,val_loss,val_accuracy
 queen linden
hi guys i am new to data science can any one guide me to become a data scientist
stuck karma
hello~
I tried to use grid search with scikit learn :
n_components= np.arange(1, 100)
max_iter=[1000]
param_grid = {'n_components':n_components,
              'metric': ['r2']}

grid = GridSearchCV(pls, param_grid, cv=5)`

grid = GridSearchCV(pls, param_grid, cv=5)

#entrainer la grille des estimateurs
grid.fit(X_train, y_train)

#print(grid)
print(grid.best_score_)     #afficher le meilleur score du modèle avec meilleurs paramètres

print(grid.best_params_)    #affiche les valeurs des meilleurs paramètres

model=grid.best_estimator_   #enregistrer le modele avec les meilleurs parametres

print(model.score(X_test,y_test))  #afficher performance du modèle dans vraie vie
but i got this error py Invalid parameter metric for estimator PLSRegression(max_iter=1000, n_components=16). Check the list of available parameters with `estimator.get_params().keys()`.`.
i think the error comes from the line grid = GridSearchCV(pls, param_grid, cv=5)
mortal dove
queen linden
hi guys i am new to data science can any one guide me to become a data scientis...
Start with statistics
rigid zodiac
stuck karma
hello~
I tried to use grid search with scikit learn :
```py
n_components= np.ar...
what gridsearch is that for
rigid zodiac
stuck karma
it determines the best value of parameer
for what model?
stuck karma
that i fixed in the interval (1, 100)
it makes a loop and test the scores for all the values
pls regression
mortal dove
Have you done calculus and linear algebra yet?
queen linden
yeh done in clg
stuck karma
rigid zodiac
for what model?
here is an example py grid = GridSearchCV( Lasso(), {'alpha': [1e-5, 0.01, 0.1, 0.5, 0.8, 1]}, verbose=3) grid.fit(X[:, :1], Y)https://scikit-learn.org/stable/modules/generated/sklearn.model_selection.GridSearchCV.html
mortal dove
Then I'd suggest either Elements of Statistical Learning, or An Introduction To Statistical Learning - the second book is easier to work through, and does have examples in R if you like having some practical examples accompany the work.
rigid zodiac
stuck karma
here is an example ```py
grid = GridSearchCV(
Lasso(), {'alpha': [1e-5, 0.01...
I'm trying to find in my work, but I cant find something like that before....
this is for pls model right
queen linden
mortal dove
Then I'd suggest either *Elements of Statistical Learning*, or *An Introduction ...
ok thank you
rigid zodiac
stuck karma
here is an example ```py
grid = GridSearchCV(
Lasso(), {'alpha': [1e-5, 0.01...

Explore and run machine learning code with Kaggle Notebooks | Using data from [Private Datasource]
stuck karma
rigid zodiac
check this https://www.kaggle.com/phamvanvung/partial-least-squares-regression-i...
okay but he didnt use grid search :p its a method to optimize the parameters of your model
but
its super iteresting!
lapis sequoia
im using a hand tracking library and want to train a model to detect specific gestures. Whats the best NN for this job?
desert oar
rigid zodiac
Hi guys, have you ever encounter this issue```WARNING:tensorflow:Early stopping ...
show your code. it looks like early stopping is configured to use accuracy, but accuracy isn't valid for your model
rigid zodiac
        filepath='best_model.{epoch:02d}-{val_loss:.2f}.h5',
        monitor='val_loss', save_best_only=True), keras.callbacks.EarlyStopping(monitor='acc', patience=1)
]

# Hyper-parameters
batch_size = 1024
epochs = 50``` I think this is the reason why it cant call backfor what it's worth, you can very efficiently fit the lasso solution path without manually searching over a grid: https://scikit-learn.org/stable/modules/generated/sklearn.linear_model.LassoCV.html
rigid zodiac
desert oar
show your code. it looks like early stopping is configured to use accuracy, but ...
idk what I should change
desert oar
rigid zodiac
``` callbacks_list = [keras.callbacks.ModelCheckpoint(
filepath='best_mo...
well yeah, you wrote monitor='acc'. but according to the error message, accuracy isn't a valid evaluation metric for your model.
rather, it's not called acc
it's called val_accuracy, this is clearly stated in the error message
rigid zodiac
thank you so much
desert oar
it's important to get in the habit of reading and understanding error messages
lapis sequoia
Hello dear pythonistas and data scientists. I have a question, how I know that random forest regression is measuring the impurity of variance as opposed to gini impurity in classification. So what I am really wonderig is what metric is used for feature importance?

So it looks at how much each input is correlated to the target. But is it r2 metric or what is it?
stuck karma
desert oar
it's important to get in the habit of reading and understanding error messages
i dont use lasso it was for the example, thats interesting
the code with lasso is from the documentation of search grid
i use pls
so i dont have choice i guess
but can you help me to correct my code? i really dont know whats wrong
n_components= np.arange(1, 100)
max_iter=[1000]

param_grid = {'n_components':n_components,
              'metric': ['r2']}

grid = GridSearchCV(pls, param_grid, cv=5)

grid.fit(X_train, y_train)

print (grid.best_score_)     # show the best score with best param
print (grid.best_params_)    # show value of the param a
model=grid.best_estimator_   #save the model with best param
print (pls.score(X_test,y_test))  #show score irl
 charred umbra
queen linden
hi guys i am new to data science can any one guide me to become a data scientis...
charred umbra
queen linden
hi guys i am new to data science can any one guide me to become a data scientis...
become fimiliar with classification, regression, dimensionality reduction, and clustering algorithms using computer code languages like python and r
queen linden
Yeh ok thanks
stuck karma
it keeps saying ValueError: Invalid parameter metric for estimator PLSRegression(max_iter=1000, n_components=16). Check the list of available parameters with `estimator.get_params().keys()`.
desert oar
stuck karma
it keeps saying ``ValueError: Invalid parameter metric for estimator PLSRegressi...
we have been over this several times
i told you, the error message means exactly what it says
param_grid = {'n_components': np.arange(1, 100)}
grid = GridSearchCV(pls, param_grid, cv=5, scoring='r2')
grid.fit(X_train, y_train)
metric was valid in that KNN example because the KNN class itself has a metric parameter
i swear i explained this at least twice already
if you don't understand my explanation then i am happy to clarify
stuck karma
desert oar
`metric` was valid in that KNN example because the KNN class itself has a `metri...
Yes I know but I just read the documentation, I didn't keep the code from know changed the metric with something that is specific to régression.
This is what says the documentation
"class sklearn.model_selection.GridSearchCV(estimator, param_grid, scoring=None, n_jobs=None, refit=True, cv=None, verbose=0, pre_dispatch='2*n_jobs', error_score=nan, return_train_score=False)[source],x``` tall lance
https://stackoverflow.com/questions/68928529/pytorch-convnet-loss-remains-unchanged-and-only-one-class-is-predicted
Can anyone help me 1 on 1 with my pytorch program? Here is a link to what I am experiencing on stack overflow. I really am lost and stuck. thank you
Stack Overflow
My ConvNet is only predicting a single class and the loss remains unchanged.
I have tried the following:
added class weights to be proportional to the data sizes (1-(class occurrences/total data))
 versed laurel
Can anyone help a beginner with querying the YouTube Data API? https://stackoverflow.com/questions/68900407/trying-to-retrieve-videoids-from-channel-on-youtube-data-api-and-their-comments
Stack Overflow
I am trying take the list of videoids and extract the comments from those ids in a list. I am having trouble figuring out a way to loop through all of the videoids (I have been able to get one vide...
arctic wedgeBOT
Hey @charred umbra!
It looks like you tried to attach file type(s) that we do not allow (.pdf). We currently allow the following file types: .gif, .jpg, .jpeg, .mov, .mp4, .mpg, .png, .mp3, .wav, .ogg, .webm, .webp, .flac, .m4a.
Feel free to ask in #community-meta if you think this is a mistake.
lapis sequoia
Hey guys, what is the Gamma parameter actually defining in support vector regression?
 hybrid ibex
lapis sequoia
Hey guys, what is the Gamma parameter actually defining in support vector regres...
hybrid ibex
lapis sequoia
Hey guys, what is the Gamma parameter actually defining in support vector regres...
it defines how far the influence of a single training example reaches, with low values meaning 'far' and high values meaning 'close'.
lapis sequoia
hybrid ibex
it defines how far the influence of a single training example reaches, with low ...
I read the same on google. I understand it for SVM because the hyperplane divides instances into classes but for SVR it is different
lapis sequoia
hybrid ibex
it defines how far the influence of a single training example reaches, with low ...
Besides, what does that even mean practically? What does small values do and larger values do?
hybrid ibex
wait , you meant regression
lapis sequoia
hybrid ibex
wait , you meant regression
Yes, support vector regression. We have an epsilon tube, small values mean narrower tube and we fit less data points inside the tube but risk getting more data points outside the tube and increase the slack variables (errors). A larger value of epsilon means larger tube and fit more data points but then risk overfitting the model
hybrid ibex
Yes
lapis sequoia
The C parameter or regularizaiton parameter is a tradeoff between slack minimization and tube width. So how does the Gamma parameter come into play?
hybrid ibex
Gamma is the learning rate
lapis sequoia
After performing grid search I got Epsilon: 0.1, C: 100 and Gamma: 100
So that is a small tube and 100 on C means we allow more errors than a smaller value of lets say 10
And I know Gamma is only for radial basis function (RBF)
But I just want to understand what the gamma actually does here. I realized I got a junk performance when removing gamma completely
So something it must do in support vector regression, that increases the performance
hybrid ibex
the higher the gamma value is , the higher it tries to fit the training data set
 covert cedar
First run at clustering my memberships transactions through an RFM table. Any feedback or tips on improving? Trying to replicate Claritas’ “P$ycle premier”
 lapis sequoia
hybrid ibex
<@456226577798135808> got it?
lapis sequoia
hybrid ibex
<@456226577798135808> got it?
I really appreciate you trying to explain but I just don't understand how the concept applies. Would be ever so grateful if you could explain in more detail
hybrid ibex
C is like the tube shape defining parameter
and gamma is the parameter that defines , when you for eg throw some marbles into it and if theres a force on the oppsite side, how far will it go
if it goes too far , it might over shoot
if it doesnt manage to cross the mid point, it would never reach the point
lapis sequoia
hybrid ibex
if it goes too far , it might over shoot
Oh I see, so if I have small value it means?
lapis sequoia
Thanks a lot!
hybrid ibex
no worries! always happy to help!
 gentle epoch
having this issue with pandas
PS H:\01 Libraries\Documents\Tosh0kan Studios\Coding> & C:/Users/Tosh0kan/AppData/Local/Programs/Python/Python39/python.exe "h:/01 Libraries/Documents/Tosh0kan Studios/Coding/GURPS Vehicles Calc/Vehicles Calc.py"
What's the VSP? 50
Traceback (most recent call last):
  File "C:\Users\Tosh0kan\AppData\Local\Programs\Python\Python39\lib\site-packages\pandas\core\indexes\base.py", line 3361, in get_loc
    return self._engine.get_loc(casted_key)
  File "pandas\_libs\index.pyx", line 76, in pandas._libs.index.IndexEngine.get_loc
  File "pandas\_libs\index.pyx", line 108, in pandas._libs.index.IndexEngine.get_loc
  File "pandas\_libs\hashtable_class_helper.pxi", line 5198, in pandas._libs.hashtable.PyObjectHashTable.get_item
  File "pandas\_libs\hashtable_class_helper.pxi", line 5206, in pandas._libs.hashtable.PyObjectHashTable.get_item
KeyError: (29, 1)

The above exception was the direct cause of the following exception:

Traceback (most recent call last):
  File "h:\01 Libraries\Documents\Tosh0kan Studios\Coding\GURPS Vehicles Calc\Vehicles Calc.py", line 44, in <module>
    hit_points = get_CF()
  File "h:\01 Libraries\Documents\Tosh0kan Studios\Coding\GURPS Vehicles Calc\Vehicles Calc.py", line 17, in get_CF
    hit_points = volume_surfarea_table[rowN,1]
  File "C:\Users\Tosh0kan\AppData\Local\Programs\Python\Python39\lib\site-packages\pandas\core\frame.py", line 3455, in __getitem__
    indexer = self.columns.get_loc(key)
  File "C:\Users\Tosh0kan\AppData\Local\Programs\Python\Python39\lib\site-packages\pandas\core\indexes\base.py", line 3363, in get_loc
    raise KeyError(key) from err
KeyError: (29, 1)```on #help-lemon
please help me out
proven sigil
Hi, I'm rewriting some of the pandas code to pyspark dataframes.
For the below code,
from sklearn.preprocessing import MinMaxScaler
scaler = MinMaxScaler()
data = np.array([df['probability_score']]).T
df['user_score'] = scaler.fit_transform(data).T[0] * 100
df['user_score'] = df['user_score'].astype(int)
so far I've written
from pyspark.ml import Pipeline
from pyspark.ml.feature import VectorAssembler, MinMaxScaler
assembler = VectorAssembler(inputCols=['probability_score'], outputCol='probability_score_vector')
scaler = MinMaxScaler(inputCol='probability_score_vector', outputCol='user_score')
pipeline = Pipeline(stages=[assembler, scaler])
df = pipeline.fit(df).transform(df)
How do I get the assembled vector type of column into a normal (float type) column?
arctic wedgeBOT
Here's how to format Python code on Discord:
```py
print('Hello world!')
```
These are backticks, not quotes. Check this out if you can't find the backtick key.
 craggy sparrow
hello
I'm new here, I'm brazilian
I'm beginning my studying in Data science, I can program in python but I need to learn the specific libraries for data science like pandas
arctic wedgeBOT
:incoming_envelope: :ok_hand: applied mute to @lapis sequoia until <t:1629933575:f> (9 minutes and 59 seconds) (reason: duplicates rule: sent 4 duplicated messages in 10s).
serene scaffold
craggy sparrow
I'm beginning my studying in Data science, I can program in python but I need to...
Focus on learning how to do what you're trying to do, and refer to the docs for whichever libraries will help you do it.
An overview of the fundamental data science/AI libraries:
- numpy is the quintessential library for scientific computing in Python, in that in supports high-performance arithmetic in batches via its
arraydata structure. - pandas builds on numpy in that it supports SQL-style manipulation of tabular data.
Numpy and pandas encourage you to conceptualize your data as "one thing". Unlike the rest of Python, writing "explicit" for loops for numpy and pandas operations is actually less communicative than using the provided functions and methods (which are optimized), and should be avoided as much as possible.
- sklearn has general-purpose machine learning tools as well as ready-made implementations of popular algorithms that you can fit to your data.
- scipy implements functions that are useful for scientific computing that aren't found in numpy.
- matplotlib is used for data visualization.
- PyTorch and Tensorflow are both used for deep learning that can benefit from GPU computation.
serene scaffold
serene scaffold
An overview of the fundamental data science/AI libraries:
* **numpy** is the qui...
I'll probably rewrite that at some point
velvet thorn
serene scaffold
An overview of the fundamental data science/AI libraries:
* **numpy** is the qui...
nobody ever cares about PySpark
😔
serene scaffold
@velvet thorn what even is that
velvet thorn
serene scaffold
<@171929073063297024> what even is that
😔 😔 😔
serene scaffold
Tell me
 ashen sable
PySpark is an interface for Apache Spark in Python. It not only allows you to write Spark applications using Python APIs, but also provides the PySpark shell for interactively analyzing your data in a distributed environment.
ashen sable
idk copy and paste answer
velvet thorn
Spark is basically pandas in Scala but for big data and a lot less ergonomic
PySpark contains the Python bindings
velvet thorn
velvet thorn
Spark is basically `pandas` in Scala but for big data and a lot less ergonomic
well, it's more a data engineering thing
ashen sable
good for data
velvet thorn
it kinda replaces MapReduce, which was an older tool for manipulating huge amounts of data
craggy sparrow
o thanks
I'm using the plotly in one kaggle csv data to see map graphcs
I should be mastering pandas tho
velvet thorn
craggy sparrow
I'm using the plotly in one kaggle csv data to see map graphcs
plotly is a bit less popular than MPL
some feel it has a better interface
serene scaffold
@craggy sparrow don't even try to master pandas. Just try to solve any data manipulation problem you encounter without looping and eventually you'll learn the pandas api
craggy sparrow
I'm learning plotly looking at the site examples and using the codes
craggy sparrow
serene scaffold
<@266225129661399052> don't even try to master pandas. Just try to solve any dat...
you mean, I'll always need to read the pandas doc even if I'm experienced to it?
velvet thorn
craggy sparrow
you mean, I'll always need to read the pandas doc even if I'm experienced to it?
docs are a reference
serene scaffold
@craggy sparrow maybe? I still use the pandas docs.
velvet thorn
like sometimes you encounter a word you don't know
or you want to find a synonym for a word
you use a dictionary/thesaurus, right
it's the same thing
craggy sparrow
yes
the idea is that I don't really need to master a library, but know enough so if I need to use the library one day, I don't need to be scared cu'z I have the idea of how to use them?
velvet thorn
craggy sparrow
the idea is that I don't really need to master a library, but know enough so if ...
yeah
it's more important
to learn how to learn
because there are WAY more frameworks/concepts/languages/etc. out there
craggy sparrow
yea thats the point
velvet thorn
and new ones appear all the time
craggy sparrow
hmmm
my reall challenge is the other steps in data science
like understand the business, find an actual good solution that will make profit
 tender hearth
Hey folks, anyone have a nice English TTS dataset with transcriptions/captions? LibriTTS doesn't seem to have transcriptions
valid pebble
Anyone familar with dask I need some advice
 shrewd grove
Hi - does anyone know what ai do I need to use to put image in and get two numbers out ?
serene scaffold
valid pebble
Anyone familar with dask I need some advice
Go ahead and post your question
royal crest
I'm working with interview texts where I'm trying to see if i can automate the qualitative coding process (as in assigning meaning, adding a label/thick description to a passage of keywords), but i'm struggling to find examples of NLP tools being used for this purpose - perhaps i'm missing a keyword when searching?
I don't want any prediction or generation of text from trained data (which is what a lot of NLP models seem to be about) rather I want the model to pick out keywords that convey certain nuances from a given interview transcription
 soft bolt
In making Python ETL tasks (like in airflow) is it common to do method chaining with data frames, or no?
coral kindle
royal crest
I don't want any prediction or generation of text from trained data (which is wh...
I'm on the same task and ppl recommend me to use a LDA model first as a first step to see how well your topics are parsed
Keep in mind that you have to do a count vectorizer first
You can use either scikit-learn, gensim or apache spark if you have a lot of data
 halcyon vale
🔊 Hello everyone! I have been documenting my journey on Machine Learning and Deep Learning for about a 10 months now. My journey might help you out incase you are confused to get a right path.
✨ The repository just hit 200 ⭐ today. I really appreciate your support. Let's keep learning !!
📒 GitHub : https://lnkd.in/d-aDKvq
GitHub
I am sharing my Journey of 300DaysOfData in Machine Learning and Deep Learning. - 300Days__MachineLearningDeepLearning/README.md at main · ThinamXx/300Days__MachineLearningDeepLearning
 vivid cairn
shrewd grove
Hi - does anyone know what ai do I need to use to put image in and get two numbe...
vivid cairn
shrewd grove
Hi - does anyone know what ai do I need to use to put image in and get two numbe...
If you mean an image of numbers goes in and the recognized number characters go out, I would point you towards an OCR solution like Tesseract.
serene scaffold
I recently encountered a function that is math.prod(sequence) ** (1 / len(sequence)). This appears to be the mean, but shifted up one order, if that's the right terminology. What is this called?
vivid cairn
serene scaffold
I recently encountered a function that is `math.prod(sequence) ** (1 / len(seque...
Not sure about if this is "the mean". It looks like the geometric mean however: https://en.m.wikipedia.org/wiki/Geometric_mean

In mathematics, the geometric mean is a mean or average, which indicates the central tendency or typical value of a set of numbers by using the product of their values (as opposed to the arithmetic mean which uses their sum). The geometric mean is defined as the nth root of the product of n numbers, i.e., for a set of numbers x1, x2, ..., xn, th...
serene scaffold
vivid cairn
Not sure about if this is "the mean". It looks like the geometric mean however: ...
Thanks!
 dull turtle
hello i am working with pandas dataframepython row_data date time open high low close 0 02-Mar-20 09:20 -13.00 -14.10 -7.80 -7.80 1 02-Mar-20 09:22 -4.20 -10.20 -7.95 -7.10 2 02-Mar-20 09:26 -11.00 -11.50 -4.05 -6.10 3 02-Mar-20 09:31 -6.25 -9.00 -6.25 -9.00 4 02-Mar-20 09:40 -3.25 -8.00 -2.70 -7.20 5 02-Mar-20 09:50 -2.55 -7.55 -2.55 -5.05 6 02-Mar-20 09:52 -6.15 -6.70 -6.15 -6.15 7 02-Mar-20 09:53 -6.15 -6.15 -3.05 -8.05 8 02-Mar-20 10:06 -7.60 -7.60 -5.50 -6.00 9 02-Mar-20 10:08 -6.60 -7.15 -5.00 -5.00 10 02-Mar-20 10:10 -8.70 -10.40 -8.00 -10.40 11 02-Mar-20 10:13 -6.30 -9.00 -6.10 -9.00 12 02-Mar-20 10:37 -4.95 -4.95 -4.95 -4.95 13 02-Mar-20 10:49 -7.35 -7.35 -5.20 -6.45 this is my dataframe
i want to calculate min max from open high low close columns in such a way that python 0 02-Mar-20 09:20 -13.00 -14.10 -7.80 -7.80 1 02-Mar-20 09:22 -4.20 -10.20 -7.95 -7.10 2 02-Mar-20 09:26 -11.00 -11.50 -4.05 -6.10 3 02-Mar-20 09:31 -6.25 -9.00 -6.25 -9.00 4 02-Mar-20 09:40 -3.25 -8.00 -2.70 -7.20 5 02-Mar-20 09:50 -2.55 -7.55 -2.55 -5.05 6 02-Mar-20 09:52 -6.15 -6.70 -6.15 -6.15 7 02-Mar-20 09:53 -6.15 -6.15 -3.05 -8.05this will be my first hour```python
8 02-Mar-20 10:06 -7.60 -7.60 -5.50 -6.00
9 02-Mar-20 10:08 -6.60 -7.15 -5.00 -5.00
10 02-Mar-20 10:10 -8.70 -10.40 -8.00 -10.40
11 02-Mar-20 10:13 -6.30 -9.00 -6.10 -9.00
12 02-Mar-20 10:37 -4.95 -4.95 -4.95 -4.95
13 02-Mar-20 10:49 -7.35 -7.35 -5.20 -6.45 ``` this will be second hour
i want to calculate min and max for every hour
my first hour starts at 09:15 am to 09:59 am
my second hour 10:00 am to 10:59 am this way
till 15:00 to 15:30 pm for every date
how i can calculate min and max ?
serene scaffold
So you want to find the min and max for certain slices of time?
dull turtle
serene scaffold
So you want to find the min and max for certain slices of time?
yes
my code```python
for t in df['date']:
print(t)
row_data = df.loc[df['date'] == t]
print('row_data')
print(row_data)
print()
break```
don't use this; look into how to group the dataframe by time
dull turtle
serene scaffold
don't use this; look into how to group the dataframe by time
u mean group on time column ?
serene scaffold
dull turtle
u mean group on time column ?
yes; then you can just do min and max on the grouped dataframe
dull turtle
serene scaffold
yes; then you can just do `min` and `max` on the grouped dataframe
ohh wait i forgot to tell u one thing python 02-Mar-20 row_data date time open high low close 0 02-Mar-20 09:20 -13.00 -14.10 -7.80 -7.80 1 02-Mar-20 09:22 -4.20 -10.20 -7.95 -7.10 2 02-Mar-20 09:26 -11.00 -11.50 -4.05 -6.10 3 02-Mar-20 09:31 -6.25 -9.00 -6.25 -9.00 4 02-Mar-20 09:40 -3.25 -8.00 -2.70 -7.20 5 02-Mar-20 09:50 -2.55 -7.55 -2.55 -5.05 6 02-Mar-20 09:52 -6.15 -6.70 -6.15 -6.15 7 02-Mar-20 09:53 -6.15 -6.15 -3.05 -8.05 8 02-Mar-20 10:06 -7.60 -7.60 -5.50 -6.00 9 02-Mar-20 10:08 -6.60 -7.15 -5.00 -5.00 10 02-Mar-20 10:10 -8.70 -10.40 -8.00 -10.40 11 02-Mar-20 10:13 -6.30 -9.00 -6.10 -9.00 12 02-Mar-20 10:37 -4.95 -4.95 -4.95 -4.95 13 02-Mar-20 10:49 -7.35 -7.35 -5.20 -6.45 14 02-Mar-20 10:56 -7.05 -7.40 -7.05 -7.40 15 02-Mar-20 11:49 -7.95 -8.45 -7.50 -8.25 16 02-Mar-20 13:25 -4.15 -5.15 -4.15 -4.85 17 02-Mar-20 13:41 -6.20 -6.20 -6.20 -6.20 18 02-Mar-20 14:00 -6.20 -8.60 -6.20 -8.60 19 02-Mar-20 14:06 -5.00 -7.95 -5.00 -7.55 20 02-Mar-20 14:31 -6.30 -6.30 -4.80 -6.00 21 02-Mar-20 14:37 -8.35 -8.35 -7.70 -7.70 22 02-Mar-20 14:45 -9.50 -9.50 -6.50 -7.40 23 02-Mar-20 14:58 -10.90 -11.70 -2.70 -2.90 24 02-Mar-20 15:00 -12.10 -12.10 6.15 5.90 25 02-Mar-20 15:04 -7.90 -7.90 -6.20 -6.20 26 02-Mar-20 15:07 -7.95 -7.95 -4.00 -4.00 27 02-Mar-20 15:10 -6.05 -7.00 -4.95 -5.25 28 02-Mar-20 15:11 -10.15 -10.25 -4.80 -9.65 29 02-Mar-20 15:12 -6.60 -8.05 -5.75 -8.05 30 02-Mar-20 15:16 -7.75 -9.25 -5.30 -8.65 31 02-Mar-20 15:18 -5.55 -7.15 -2.90 -6.40 32 02-Mar-20 15:22 -6.20 -6.20 -3.50 -3.50 this is what i get when i do print(row_data)
i want to seprate from above df based on time by hour
do u get my point ?
serene scaffold
dull turtle
do u get my point ?
yes
dull turtle
so my first step is how i can seprate data from row_data based on time
0   02-Mar-20  09:20 -13.00 -14.10 -7.80  -7.80
1   02-Mar-20  09:22  -4.20 -10.20 -7.95  -7.10
2   02-Mar-20  09:26 -11.00 -11.50 -4.05  -6.10
3   02-Mar-20  09:31  -6.25  -9.00 -6.25  -9.00
4   02-Mar-20  09:40  -3.25  -8.00 -2.70  -7.20
5   02-Mar-20  09:50  -2.55  -7.55 -2.55  -5.05
6   02-Mar-20  09:52  -6.15  -6.70 -6.15  -6.15
7 02-Mar-20 09:53 -6.15 -6.15 -3.05 -8.05 ```this will be my first hour this way i want to seprate @serene scaffold can u guide me in this step ?df['timestamp'] = pd.to_datetime(df['date'] + ' ' + df['time'])
df.drop('date time'.split(), axis=1, inplace=True)
grouped = df.groupby(pd.Grouper(key='timestamp', freq='1H'))
grouped.min()
open high low close
timestamp
2020-03-02 09:00:00 -13.00 -14.10 -7.95 -9.00
2020-03-02 10:00:00 -8.70 -10.40 -8.00 -10.40
2020-03-02 11:00:00 -7.95 -8.45 -7.50 -8.25
2020-03-02 12:00:00 NaN NaN NaN NaN
2020-03-02 13:00:00 -6.20 -6.20 -6.20 -6.20
2020-03-02 14:00:00 -10.90 -11.70 -7.70 -8.60
2020-03-02 15:00:00 -12.10 -12.10 -6.20 -9.65
@dull turtle
dull turtle
                      open   high   low  close
timestamp
2020-03-02 09:00:00 -13.00 -14.10 -7.95  -9.00
2020-03-02 10:00:00 -8.70 -10.40 -8.00 -10.40``` can u help me to understand what this result tells ?the minimum value for each one-hour interval
dull turtle
u mean you have calculated based on python 0 02-Mar-20 09:20 -13.00 -14.10 -7.80 -7.80 1 02-Mar-20 09:22 -4.20 -10.20 -7.95 -7.10 2 02-Mar-20 09:26 -11.00 -11.50 -4.05 -6.10 3 02-Mar-20 09:31 -6.25 -9.00 -6.25 -9.00 4 02-Mar-20 09:40 -3.25 -8.00 -2.70 -7.20 5 02-Mar-20 09:50 -2.55 -7.55 -2.55 -5.05 6 02-Mar-20 09:52 -6.15 -6.70 -6.15 -6.15 7 02-Mar-20 09:53 -6.15 -6.15 -3.05 -8.05 this first hour data ?
serene scaffold
yes. that is what grouped = df.groupby(pd.Grouper(key='timestamp', freq='1H')) is for
note (key='timestamp', freq='1H') in particular. it's grouping in one hour intervals according to the timestamp
dull turtle
serene scaffold
yes. that is what `grouped = df.groupby(pd.Grouper(key='timestamp', freq='1H'))`...
also Grouper is this a in built function ?
serene scaffold
dull turtle
also `Grouper` is this a in built function ?
it's pd.Grouper, so you just have to import pandas as pd
dull turtle
serene scaffold
```py
df['timestamp'] = pd.to_datetime(df['date'] + ' ' + df['time'])
df.drop('d...
let me try this code and save output (min/max) values in csv file
can i calculate max_output = grouped.max() maximum value by this way ? @serene scaffold
serene scaffold
dull turtle
can i calculate ` max_output = grouped.max()` maximum value by this way ? <@!...
try it and see 
dull turtle
serene scaffold
try it and see <:lemon_hyperpleased:754441879822663811>
when i try for next date i am getting error
my code ```python
remove duplicate dates
dates = df['date']
dates = dates.drop_duplicates()
print("dates", dates)
for t in dates:
print(t)
row_data = df.loc[df['date'] == t]
print('row_data')
print(row_data)
print()
df['timestamp'] = pd.to_datetime(df['date'] + ' ' + df['time'])
df.drop('date time'.split(), axis=1, inplace=True)
grouped = df.groupby(pd.Grouper(key='timestamp', freq='1H'))
min_output = grouped.min()
max_output = grouped.max()
print("min_output")
print(min_output)
print()

print("max_output")
print(max_output)
print()```
why are you doing this in a for loop?
the code I gave you stands on its own
dull turtle
serene scaffold
why are you doing this in a for loop?
i fixed i guess
let me share my code
# remove duplicate dates
dates = df['date']
dates = dates.drop_duplicates()
print("dates:", dates)
for i in dates:
    print("i:")
    print(i)
    row_data = df.loc[df['date'] == i]
    print('row_data:')
    print(row_data)
    print()
    df['timestamp'] = pd.to_datetime(df['date'] + ' ' + df['time'])
    df.drop('date time'.split(), axis=1, inplace=True)
    grouped = df.groupby(pd.Grouper(key='timestamp', freq='1H'))
    min_output = grouped.min()
    max_output = grouped.max()
    print("min_output:")
    print(min_output)
    print()

    print("max_output:")
    print(max_output)
    print()
break```now let me share this output in csv file
i have ```python
df['timestamp'] = pd.to_datetime(df['date'] + ' ' + df['time'])
df.drop('date time'.split(), axis=1, inplace=True)
grouped = df.groupby(pd.Grouper(key='timestamp', freq='1H'))
min_output = grouped.min()
max_output = grouped.max()
print("min_output:")
print(min_output)
print()
print("max_output:")
print(max_output)
print()

# save min max value of open high low close columns in csv file
new_path = f"F:/practice/difference_per_hour/{script_name}_difference min_max open_high_low_close.csv"
min_output.to_csv(min_output, mode='a', header=True, index=False)
max_output.to_csv(max_output, mode='a', header=True, index=False)
print("per hour difference values stored in csv file.")
print()
break``` tried this way
delete all of this and just do this:
df['timestamp'] = pd.to_datetime(df['date'] + ' ' + df['time'])
df.drop('date time'.split(), axis=1, inplace=True)
grouped = df.groupby(pd.Grouper(key='timestamp', freq='1H'))
print(
    'min_output:',
    grouped.min(), '',
    'max_output:'
    grouped.max(), '',
    sep='\n'
)
There should not be any for loops.
you can save grouped.min() and grouped.max() to variables in advance of the print statement if you want to save them to CSV.
dull turtle
i am getting ```python
Traceback (most recent call last):
File "F:\practice\hacker rank practice.py", line 44, in <module>
min_output.to_csv(min_output, mode='a', header=True, index=False)
File "C:\Users\birha\anaconda3\lib\site-packages\pandas\core\generic.py", line 3387, in to_csv
return DataFrameRenderer(formatter).to_csv(
File "C:\Users\birha\anaconda3\lib\site-packages\pandas\io\formats\format.py", line 1083, in to_csv
csv_formatter.save()
File "C:\Users\birha\anaconda3\lib\site-packages\pandas\io\formats\csvs.py", line 228, in save
with get_handle(
File "C:\Users\birha\anaconda3\lib\site-packages\pandas\io\common.py", line 554, in get_handle
if _is_binary_mode(path_or_buf, mode) and "b" not in mode:
File "C:\Users\birha\anaconda3\lib\site-packages\pandas\io\common.py", line 859, in _is_binary_mode
return isinstance(handle, binary_classes) or "b" in getattr(handle, "mode", mode)
TypeError: argument of type 'method' is not iterable``` this error @serene scaffold
serene scaffold
dull turtle
i am getting ```python
Traceback (most recent call last):
File "F:\practice\h...
did you get rid of the for loop?
dull turtle
serene scaffold
did you get rid of the for loop?
plz check my code https://paste.pythondiscord.com/disojedixi.py here
how i can replace my for loop ?
serene scaffold
import pandas as pd
import datetime

path = "F:/practice/difference_csv files"
script_name = 'ACC'
extention = '.csv'

# read csv file
df = pd.read_csv(f"{path}/{script_name}_difference{extention}", names = ['date', 'time', 'open', 'high', 'low', 'close'])

df['timestamp'] = pd.to_datetime(df['date'] + ' ' + df['time'])
df.drop('date time'.split(), axis=1, inplace=True)
grouped = df.groupby(pd.Grouper(key='timestamp', freq='1H'))
min_ = grouped.min()
max_ = grouped.max()
print(
    'min_output:',
    min_, '',
    'max_output:'
    max_, '',
    sep='\n'
)

min_.to_csv(..., mode='a', header=True, index=False)
max_.to_csv(..., mode='a', header=True, index=False)
This is the whole program. You just need to set paths for the last two lines instead of ...
@dull turtle
dull turtle
serene scaffold
```py
import pandas as pd
import datetime
path = "F:/practice/difference_csv fi...
okay let me do this
serene scaffold
Again, do not write any for loops for the date stuff because df.groupby handles this.
dull turtle
serene scaffold
Again, do not write any for loops for the date stuff because `df.groupby` handle...
see this when i write in csv file i am getting this way

some rows are getting blank
also i want to write date and time also in csv
desert oar
missing data can be written as a blank cell
mode='a' might cause a problem too, since you have header=True you will end up with headers in the middle of the data
dull turtle
desert oar
missing data can be written as a blank cell
when i do print(min_output.head(20)) i get python head min_output: open high low close timestamp 2020-03-02 09:00:00 -13.00 -14.10 -7.95 -9.00 2020-03-02 10:00:00 -8.70 -10.40 -8.00 -10.40 2020-03-02 11:00:00 -7.95 -8.45 -7.50 -8.25 2020-03-02 12:00:00 NaN NaN NaN NaN 2020-03-02 13:00:00 -6.20 -6.20 -6.20 -6.20 2020-03-02 14:00:00 -10.90 -11.70 -7.70 -8.60 2020-03-02 15:00:00 -12.10 -12.10 -6.20 -9.65 2020-03-02 16:00:00 NaN NaN NaN NaN 2020-03-02 17:00:00 NaN NaN NaN NaN 2020-03-02 18:00:00 NaN NaN NaN NaN 2020-03-02 19:00:00 NaN NaN NaN NaN 2020-03-02 20:00:00 NaN NaN NaN NaN 2020-03-02 21:00:00 NaN NaN NaN NaN 2020-03-02 22:00:00 NaN NaN NaN NaN 2020-03-02 23:00:00 NaN NaN NaN NaN 2020-03-03 00:00:00 NaN NaN NaN NaN 2020-03-03 01:00:00 NaN NaN NaN NaN 2020-03-03 02:00:00 NaN NaN NaN NaN 2020-03-03 03:00:00 NaN NaN NaN NaN 2020-03-03 04:00:00 NaN NaN NaN NaN this way
desert oar
yeah, NaN is pandas using IEEE "not-a-number" to represent representing missing data
the corresponding CSV will be something like
-7.95,-8.45,-7.50,-8.25
,,,
-6.20,-6.20,-6.20,-6.20
,,,
i.e. there are empty cells delimited by ,
you can control how pandas represents missing data, it's in the options in to_csv somewhere
dull turtle
desert oar
yeah, `NaN` is pandas using IEEE "not-a-number" to represent representing missin...
see i want to perform operation on data where time is 09:15 am to 15:30 pm for every date
not every hour more than 15:30 pm
do u get my point
i want till python head min_output: open high low close timestamp 2020-03-02 09:00:00 -13.00 -14.10 -7.95 -9.00 2020-03-02 10:00:00 -8.70 -10.40 -8.00 -10.40 2020-03-02 11:00:00 -7.95 -8.45 -7.50 -8.25 2020-03-02 12:00:00 NaN NaN NaN NaN 2020-03-02 13:00:00 -6.20 -6.20 -6.20 -6.20 2020-03-02 14:00:00 -10.90 -11.70 -7.70 -8.60 2020-03-02 15:00:00 -12.10 -12.10 -6.20 -9.65 this @desert oar
desert oar
your original data is like this?
         date   time   open   high   low  close
0   02-Mar-20  09:20 -13.00 -14.10 -7.80  -7.80
1   02-Mar-20  09:22  -4.20 -10.20 -7.95  -7.10
2   02-Mar-20  09:26 -11.00 -11.50 -4.05  -6.10
3   02-Mar-20  09:31  -6.25  -9.00 -6.25  -9.00
4   02-Mar-20  09:40  -3.25  -8.00 -2.70  -7.20
5   02-Mar-20  09:50  -2.55  -7.55 -2.55  -5.05
6   02-Mar-20  09:52  -6.15  -6.70 -6.15  -6.15
7   02-Mar-20  09:53  -6.15  -6.15 -3.05  -8.05
8   02-Mar-20  10:06  -7.60  -7.60 -5.50  -6.00
9   02-Mar-20  10:08  -6.60  -7.15 -5.00  -5.00
10  02-Mar-20  10:10  -8.70 -10.40 -8.00 -10.40
11  02-Mar-20  10:13  -6.30  -9.00 -6.10  -9.00
12  02-Mar-20  10:37  -4.95  -4.95 -4.95  -4.95
13  02-Mar-20  10:49  -7.35  -7.35 -5.20  -6.45
where time is 09:15 am to 15:30 pm for every date
not every hour more than 15:30 pm
i don't understand this part
dull turtle
see i am interested in time in between 09:15 to 15:30 @desert oar
desert oar
And you want to compute some aggregate statistics for every hour, in that range?
dull turtle
desert oar
And you want to compute some aggregate statistics for every hour, in that range?
yes
but now i am getiing more than 03:30 hours
do u get my point what i want in my final output ? @serene scaffold
my code here https://paste.pythondiscord.com/xifuzezigi.py plz check
desert oar
i see, give me a moment
dull turtle
sure ping me when u back
 north river
hey folks, what's the best way to do line cuts of data using pandas?
for instance, I have some table of data from an experiment which I turn into a 2D colormap
and I wish to draw a line somewhere in the colormap and make a 1D plot of the color axos
with raw numpy you just do something like
figure(figsize=(12,10))
pcolormesh(voltages,fields,caps,cmap='cubehelix',vmax=0.658, vmin=0.65)
xlabel('Gate Voltage (V)')
ylabel('Field (T)')
colorbar()
xlim(-0.3,0.6)


vcut = 0.185
axvline(vcut, color='red', ls='--')

cut = np.array(caps)[:,np.argmin(np.abs(voltages-(vcut)))]

figure()
scatter(fields, cut, marker='.')
xlabel("Field (T)")
ylabel("Capacitance (C/Crel)")
well I should say I'm not at all attached to pandas.
and to be clear, I DO NOT want to take a cut indexed by a PARTICULAR value contained in the voltages array
I want functionality that replicates this np.argmin(np.abs(array-value)) idiom
this is crucial
serene scaffold
dull turtle
my code here https://paste.pythondiscord.com/xifuzezigi.py plz check
instead of using append mode, why don't you concatenate the two dataframes together and just write one?
new_path = f"F:/practice/difference_per_hour/{script_name}_difference per_hour.csv"
pd.concat({'min': min_output, 'max': max_output}).to_csv(new_path, header=True, index=False)
 loud kindle
hi guys,
i've got a problem in pandas that i can't seem to crack.
I have a dataframe with two columns and i want to check if the value from each row in column col1 is inside column col2
col1| col2
------
abc | a   <-- don't match
a   | abc <-- match
abc | abc <-- match
c   | a   <-- don't match this
all the functions i can find check if the value is inside the entire column, but i want to check this for each row.
Do i have to use apply for this? or is there a prebuilt function?
desert oar
@dull turtle @serene scaffold https://replit.com/@maximum__/tradinghours#main.py
i really wish there was an alternative to repl.it, shitty scummy company with a great product
desert oar
loud kindle
hi guys,
i've got a problem in pandas that i can't seem to crack.
I have a dataf...
df['col1'].isin(df['col2'])
like this?
 hasty mountain
Does anyone has an article/course suggestion about Reinforced Learning/AI playing games where premade environments aren't used? I'm tired of codes where people simply rely on premade environments such as gym. I want to be able to learn how to map a game and create my own environment.
loud kindle
desert oar
```python
df['col1'].isin(df['col2'])
```
like this?
thanks for your reply 🙂
isin checks if the value is in the entire column, which would result in true true true false, but i need false true true false
.apply(lambda s: s["col1"] in s["col2"], axis=1)
this is what i need, but built-in preferably 🙂
serene scaffold
@loud kindle I still don't understand the desired logic. Why should the first row be False?
Are you trying to find out if the value in col1 is a substring of col2?
vivid cairn
hasty mountain
Does anyone has an article/course suggestion about Reinforced Learning/AI playin...
I thought gyms are used to minimize noise during training and the goal is to transfer skills into the test/production environment? Given proper training the model should generalize well in new environments. The hard part is how to design proper training scenarios and reward functions.
But I recognize that most gyms appear in demonstrator settings
hasty mountain
vivid cairn
I thought gyms are used to minimize noise during training and the goal is to tra...
Idk. When I read articles about Reinforced Learning, all I can see is like: "Well, just create the environment using gym from OpenAI and now we just have to create the agent and make it play"
serene scaffold
@loud kindle I put it on stack overflow for you, as I couldn't come up with a solution: https://stackoverflow.com/questions/68944559/pandas-determine-if-a-string-in-one-column-is-a-substring-of-a-string-in-anothe
Stack Overflow
Consider these series:
a = pd.Series('abc a abc c'.split())
b = pd.Series('a abc abc a'.split())
pd.concat((a, b), axis=1)
0 1
0 abc a
1 a abc...
vivid cairn
hasty mountain
Idk. When I read articles about Reinforced Learning, all I can see is like: "Wel...
Yes I can see that. It goes for most expert beginner type articles.
desert oar
@loud kindle @serene scaffold fwiw the .str accessor might be pretty slow unless you're using pd.StringDtype https://github.com/pandas-dev/pandas/issues/35864
GitHub
I have checked that this issue has not already been reported. I have confirmed this bug exists on the latest version of pandas. (optional) I have confirmed this bug exists on the master branch of p...
serene scaffold
desert oar
<@!213352334766505987> <@!253696366952316929> fwiw the `.str` accessor might be ...
huh really?
desert oar
it seems to be because 1) .str does extra work like checking for nulls, and 2) 'o'-dtype vectorized operations are more or less a for loop anyway
i guess .apply does less work than .str
mortal dove
loud kindle
hi guys,
i've got a problem in pandas that i can't seem to crack.
I have a dataf...
Not my solution, but did find this solution online. I'm assuming performance is the reason you don't want to use apply.
df[[x[0] in x[1] for x in zip(df['col1'], df['col2'])]][['col1', 'col2']]
https://blog.softhints.com/pandas-check-value-column-contained-another-column-same-row/
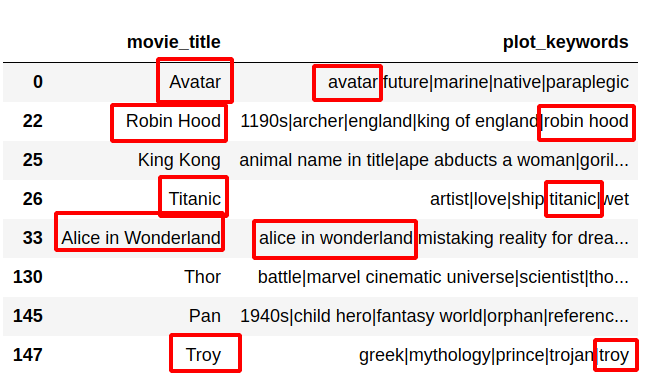
SoftHints - Python, Data Science and Linux Tutorials
In this guide, I'll show you how to find if value in one string or list column is contained in another string column in the same row. In the article are present 3 different ways to achieve the same result. These examples can be used to find a relationship between
desert oar
mortal dove
Not my solution, but did find this solution online. I'm assuming performance is ...
use .tolist(), it can make for loops over series significantly faster
pd.Series([
    a in b
    for a, b
    in df[['col1', 'col2']].tolist()
])
or if the data is big and you don't want to make a copy,
pd.Series([
    a in b
    for a, b
    in df[['col1', 'col2']].itertuples()
])
@loud kindle ^ smarter people than me have given better solutions
desert oar
@serene scaffold https://gist.github.com/gwerbin/263e92f9c2fca9ff6487ce3e1ac3d7f7
 serene scaffold
desert oar
<@!253696366952316929> https://gist.github.com/gwerbin/263e92f9c2fca9ff6487ce3e1...
serene scaffold
desert oar
<@!253696366952316929> https://gist.github.com/gwerbin/263e92f9c2fca9ff6487ce3e1...
just to orient myself, what is this intended to demonstrate?
 arctic ice
how to make opencv check if 2 images are the same if they are I want it to show one of them
anyone???
pls
help
desert oar
serene scaffold
just to orient myself, what is this intended to demonstrate?
GitHub
I have checked that this issue has not already been reported. I have confirmed this bug exists on the latest version of pandas. (optional) I have confirmed this bug exists on the master branch of p...
also i just changed it to zfill, same result (.str is fastest by far)
quasi sparrow
What do you call the result of using a library as backend to process data and a website to pull the data from in data mining?
The backend would be the software library that process data in my computer, the data pipeline would be the "connection" between my computer and the website from where I'm scraping data from.
What is called the processed CSV file?
desert oar
the result of processing the data? 🤷♂️
i don't think these things have names like you think they might
"data mining" is such a stupid outdated term anyway
the sooner we get rid of it the better
the only people who care about "data mining" are business school grads and salespeople at data tech companies
loud kindle
wow thanks guys, i didnt expect this much reaction 😄
I was simply looking for the best way to deal with this.
So whats the resulting argument now? tolist? zip?
desert oar
@loud kindle this is what i'd suggest, in the absence of a proper vectorized solution #data-science-and-ml message
desert oar
quasi sparrow
I'm just trying to use the correct lingo here
your use of the term "backend" is questionable
a "backend" is just the part of a system that users don't interact with
quasi sparrow
Ok
desert oar
basically none of the things in your description have a technical term, they're too general
what do you mean "a website to pull the data from"? you downloaded data from a website? i guess people use the term "data source" to refer to where the data came from
quasi sparrow
Should I just call it "processed data and prepossessed data?
desert oar
but that's not a technical term as such, it's just a description of a thing. it is the source of the data, ergo it is the data source
data that hasn't been processed is often called "raw" data
and yes, once data has been processed is usually called either "processed", "transformed", or "cleaned" depending on what exactly you did
"cleaning" connotes fixing problems, like filling in missing values or normalizing unicode in text
whereas "processing" is more general
"transforming" implies that you're changing the data somehow, maybe calculating new fields or computing aggregations
none of these terms are particularly technical, but they are common/standard ways to describe certain things
nobody is ever going to quiz you on the difference between "cleaning" and "processing" data, and if they do, the difference is what the difference is
this is probably more difficult if you aren't fluent in english, but i would guess that the difference between "clean" and "process" is the same in a lot of languages
quasi sparrow
Thanks! That makes sense.
loud kindle
desert oar
<@!213352334766505987> <@!253696366952316929> fwiw the `.str` accessor might be ...
did you see the reply in the SO thread that sm1 opened?
from numpy.core.defchararray import find find(df['1'].values.astype(str),df['0'].values.astype(str))!=-1
Out[740]: array([False,  True,  True, False])
yeah i didn't know about this
i don't know too much about numpy's string handling
New code (not concerned with
numarraycompatibility) should use arrays of typestring_orunicode_and use the free functions innumpy.charfor fast vectorized string operations instead.
i had no idea this existed, wow https://numpy.org/doc/stable/reference/routines.char.html#module-numpy.char
loud kindle
gonna try a speedtest tomorrow maybe
desert oar
@serene scaffold i'd go with this as the accepted answer https://stackoverflow.com/a/68944856/2954547
Stack Overflow
Consider these series:
a = pd.Series('abc a abc c'.split())
b = pd.Series('a abc abc a'.split())
pd.concat((a, b), axis=1)
0 1
0 abc a
1 a abc...
serene scaffold
@desert oar I think that one came in after but I'll look
desert oar
loud kindle
gonna try a speedtest tomorrow maybe
the docs say it's literally just str.find elementwise, so idk
lapis sequoia
I am doing price prediction of products but I am using SVR
 signal abyss
Could anyone fill me in about the process for canny edge detection?
royal crest
coral kindle
I'm on the same task and ppl recommend me to use a LDA model first as a first st...
cheers, i've used CountVectoriser followed by sentence-transformers for embedding
along with cosine similarity, MSS and MMR so far
biggest challenge is to grasp the contextual stuff
tall lance
What is going on with my loss here? Is my learning rate too high or too low?

it was on a steady decline then got messed up
working with pytorch and convnets btw
 drowsy gale
im currently trying to find the most optimal option for the agent to chose in the gym open ai enviroment, and im confuse regard use list to replace the qtable
is there a way for me to do this?
lapis sequoia
Hey, how can one actually interpret this results? I used support vector regression to predict the price of products using 5 inputs features. Predictions on the test set presented an MAE of 1.865 and RMSE 3.604 and on training MAE of 0.533 and RMSE of 1.484. Is the model not able to predict products with low prices due to noise or what is the problem here?

 royal crest
lapis sequoia
Hey, how can one actually interpret this results? I used support vector regressi...
royal crest
lapis sequoia
Hey, how can one actually interpret this results? I used support vector regressi...
why not plot the difference between actual and predicted as the y axis
if you're looking at how good your prediction is, then the actual price is not really important
lapis sequoia
royal crest
why not plot the difference between actual and predicted as the y axis
How you mean?
lapis sequoia
royal crest
why not plot the difference between actual and predicted as the y axis
I did like this:
plt.figure(figsize=(15,5))
plt.plot(range(500),comp_train['Original(train)'].values[0:500], label='Actual Price', color='blue')
plt.plot(range(500),comp_train['Predicted(train)'].values[0:500], label='Predicted Price', color='red')
plt.title('Training',fontsize=18)
plt.ylabel('Price',fontsize=18)
plt.xticks(rotation=45)
plt.legend()
plt.show()```Not sure how to plot it like you meant
 dim lily
royal crest
plot the delta
dim lily
royal crest
plot the delta
I think he's referring to get predicted - actual prices and plotting in?
royal crest
comp_train['delta'] = abs(comp_train['Original(train)'] - comp_train['Predicted(train)'])
then plot that instead
dim lily
predicted "minus" actual 🤣
royal crest
yeah something like that
because you want to look at how close your predictions are to the actual
rather than looking at raw prices
lapis sequoia
royal crest
```py
comp_train['delta'] = abs(comp_train['Original(train)'] - comp_train['Pred...
I apologize for the newbie question but how can I apply it in my script above?
royal crest
do you want to open a help channel?
lapis sequoia
Besides I don't know how to make the graph better, it looks rather messy
lapis sequoia
royal crest
let's go to a help channel
Yes I understand but I have been refered to ask these data science question here
So which is which?
royal crest
well you opened a help channel about 3 hours ago but no one replied
probably because i was eating breakfast
dim lily
royal crest
well you opened a help channel about 3 hours ago but no one replied
anybody can join into any help channel? 🤔
lapis sequoia
royal crest
well you opened a help channel about 3 hours ago but no one replied
Ok can you please help me if I go to a help channel then?
royal crest
i can't guarantee any hand holding but i am happy to assist in any way i can
royal crest
dim lily
anybody can join into any help channel? 🤔
long as they are elligible to open up a help channel yes
lapis sequoia
royal crest
i can't guarantee any hand holding but i am happy to assist in any way i can
I'm in lemon channel now then
drowsy gale
can someone explain me the way how i can extend the qtable? like how to do it without bellman equation?
 fluid steppe

GitHub
An open-source, low-code machine learning library in Python - GitHub - pycaret/pycaret: An open-source, low-code machine learning library in Python
 bronze lichen
so which pin is best to get started with ML, considering you know the maths
 severe radish
Hey guys can anyone help me with finding the curve fit for a function? I already have the numpy slope and having a little trouble "translating" it into a curve fit with an error bar
 misty flint
 royal crest
nothing wrong with MATLAB. Let’s not go around bashing other languages
bronze lichen
Should i try learning the Math required for ML even tho my school hasnt taught it yet, or should i just improve my Python until then
Ive been using Python for 3 years now tho
royal crest
Why not both?
raw temple
I need some help in the croissant channel if someone could kindly help me with my code and query please 😣
royal crest
It’s dormant
bronze lichen
ok then, can someone layout a nice little ML journey for me
Such as
• Learn the math
• Follow this course -> link
• Once you finish x chapter -> Try making this
• Repeat step 3 for multiple times
• Done
im following this one for now
yk what
Ill just focus on my school math for now
and do something else with Python
until uni
after that ill truly start my ML journey
royal crest
yes
valid pebble
for col in df.columns: r = df.loc[df[col].apply(lambda x: difflib.SequenceMatcher(None,pat,x).ratio(), meta=(col, 'float64')) >= 0.85].index rows.update(r)
can anyone help me make it optimize this in dask for now I am using pandas
I would really appreciate all the help ... files are around 600 mbs and I need to deploy it on production today only
 hidden rapids
do opencv doubts come under here?
 inland zephyr
sorry this i s a silly question about distance. I forgot bout euclidean distance, is the larger value is more similar or more dissimilar?
velvet thorn
inland zephyr
sorry this i s a silly question about distance. I forgot bout euclidean distance...
higher = further away = more dissimilar
inland zephyr
okay
loud kindle
@mortal dove @desert oar @serene scaffold i tested the various functions on my system and from what i can tell, zip is the fastest option and np.char.find the second-fastest. I added my results to the SO thread 🙂
https://stackoverflow.com/a/68952313/6825464
severe dome
hello!
how do i know if i have back propagation in my code?
Also, CNN is basically under neural networks right?
serene scaffold
severe dome
Also, CNN is basically under neural networks right?
it stands for convolutional neural network.
serene scaffold
severe dome
how do i know if i have back propagation in my code?
do you understand what back propagation is?
severe dome
yep i do
severe dome
serene scaffold
it stands for convolutional neural network.
yep, so its a type of neural network if i understand correctly right?
serene scaffold
severe dome
yep, so its a type of neural network if i understand correctly right?
yes
severe dome
ah thank you
 umbral wren
anyone here know how to setup and use CorentinJ/Real-Time-Voice-Cloning?
inland zephyr
I need to ask if someone has do embedding things with keras. I want to do simple feature embedding using pre-trained VGG16. the output of VGG 16 is [None,None,None,512] but i want is only single array of 512 element. When i try reshape it gives error ValueError: total size of new array must be unchanged, input_shape = [7, 7, 512], output_shape = [512, 1]
_________________________________________________________________
Layer (type)                 Output Shape              Param #
=================================================================
VGG INPUT (InputLayer)         [(None, None, None, 3)]   0
_________________________________________________________________
...
_________________________________________________________________
VGG_OUTPUT                   (None, None, None, 512)   0
_________________________________________________________________
dense (Dense)                (None, None, None, 512)   262656
_________________________________________________________________
reshape (Reshape)            (None, 512, 1)            0
=================================================================
Total params: 20,287,040
Trainable params: 20,287,040
Non-trainable params: 0
_________________________________________________________________```
and this is my modelnvm, i need to declare the last to GlobalAverage instead MaxPooling
serene scaffold
!e
import numpy as np
arr = np.arange(12)
arr.shape = (3, 4)
print(arr)
@serene scaffold :white_check_mark: Your eval job has completed with return code 0.
001 | [[ 0  1  2  3]
002 |  [ 4  5  6  7]
003 |  [ 8  9 10 11]]
I didn't realize this was supported.
desert oar
huh
 ripe forge
Huh, I didn't realise that either. I could have sworn shape was read only, but maybe that was pandas
serene scaffold
!e
import pandas as pd, numpy as np
df = pd.DataFrame(np.array((3, 4)))
df.shape = 4, 3
print(df)
@serene scaffold :x: Your eval job has completed with return code 1.
001 | <string>:3: UserWarning: Pandas doesn't allow columns to be created via a new attribute name - see https://pandas.pydata.org/pandas-docs/stable/indexing.html#attribute-access
002 | Traceback (most recent call last):
003 |   File "/snekbox/user_base/lib/python3.9/site-packages/pandas/core/generic.py", line 5496, in __setattr__
004 |     object.__setattr__(self, name, value)
005 | AttributeError: can't set attribute
006 |
007 | During handling of the above exception, another exception occurred:
008 |
009 | Traceback (most recent call last):
010 |   File "<string>", line 3, in <module>
011 |   File "/snekbox/user_base/lib/python3.9/site-packages/pandas/core/generic.py", line 5506, in __setattr__
... (truncated - too many lines)
Full output: https://paste.pythondiscord.com/esiseyuxip.txt?noredirect
serene scaffold
@ripe forge it would appear so, but reshaping a dataframe has added implications about the indexing structure.
ripe forge
True. To be honest maybe I'm just not used to it, but being able to assign on the shape feels wrong for some reason
stuck karma
hello, i want to save B as a dataframe with first column: number of X_trains index, and second column pls.coef_