#data-science-and-ml
1 messages · Page 334 of 1
 undone flare
also median is robust to outliers right?
 stuck karma
i wrote ```py
#graphique
n_components = list(range(2, 30))
scores = {}
for n in n_components:
pls = PLSRegression(n_components=i, max_iter=500)
scores[n]= pd.DataFrame(cross_validate(pls, X,  y, cv=2, scoring="r2", return_train_score="true"))
```
ok sorry im slow im reading your messages
 desert oar
stuck karma
also its not a scatter
desert oar
stuck karma
what are these lines 👀 ```py
scores = pd.concat(scores)
scores.index.names = ['...
desert oar
stuck karma
also its not a scatter
desert oar
stuck karma
what are these lines 👀 ```py
scores = pd.concat(scores)
scores.index.names = ['...
!e ```python
import pandas as pd
dfs = {
'a': pd.DataFrame({'x': [11, 12, 13], 'y': [21, 22, 23]}),
'b': pd.DataFrame({'x': [81], 'y': [91]})
}
df = pd.concat(dfs)
df.index.names = ['key', 'original_index']
print(df)
 arctic wedgeBOT
@desert oar :white_check_mark: Your eval job has completed with return code 0.
001 |                      x   y
002 | key original_index
003 | a   0               11  21
004 |     1               12  22
005 |     2               13  23
006 | b   0               81  91
mh
 lapis sequoia
Hi guys, just briefly I used SVR to predict prices. On the training data I obtained an MAE of 0.056 whereas on the test set 0.146. What is interesting here is that r2 on training was 0.90 while on test set only 0.35. So what is wrong here? Is the model overfitting? Is mae and rmse good respetively? Seems like these results are good but the r2 score is a mess.
stuck karma
i really thought it would be easy to plot like py plt.plot(x,y)
stuck karma
lapis sequoia
Hi guys, just briefly I used SVR to predict prices. On the training data I obtai...
overfitting
i think overfitting is when your train and test result are very different
how did you split your data?
lapis sequoia
stuck karma
overfitting
Correctly but how come MAE is so good?
lapis sequoia
stuck karma
how did you split your data?
X_train, X_test, y_train, y_test = train_test_split(X,y,test_size=0.2, random_state=2)
svr.fit(X_train_pca, y_train)

y_pred_train = svr.predict(X_train_pca)

y_pred_test = svr.predict(X_test_pca)

#Metrics - if squared = True returns MSE value, if squared = False returns RMSE value.

#Performance on training set
mae_train = mean_absolute_error(y_train,y_pred_train)
rmse_train = mean_squared_error(y_train,y_pred_train, squared = False)

#Performance on testing set
mae_test = mean_absolute_error(y_test, y_pred_test)
rmse_test = mean_squared_error(y_test, y_pred_test, squared = False) ```Interesting, the graphs shows otherwise


 severe ruin
can anyone help me with matplotlib?
 serene scaffold
severe ruin
can anyone help me with matplotlib?
serene scaffold
severe ruin
can anyone help me with matplotlib?
go ahead and put your question out there, and then people can see if they can help
severe ruin
how do i graph the y axis as dates like august 16th - august 28th
stuck karma
lapis sequoia
Interesting, the graphs shows otherwise
mh, looks like the amplitude is too much low for your predicted values but i dont know why
thats wy your MAE is good
wait why do you have 2 graphs
lapis sequoia
stuck karma
wait why do you have 2 graphs
Im checking training vs testing respectively
stuck karma
did you try to shuffle your samples before the validation?
i dont know if they are ordered
but sometimes they are
lapis sequoia
stuck karma
did you try to shuffle your samples before the validation?
I have follwed the convention of proper data science, shuffle, scaling, gridsearch, pca so there is nothing leftout here
stuck karma
yes basically you mix the samples randomly on the begining, just after reading your data
it worked in my case but it depends on your data
lapis sequoia
even did log transformation to price to get a more gaussian-like distribution
So not sure what is going on
lapis sequoia
stuck karma
try a cross validation
Wait this is correct, right?
 stuck karma
grid search
lapis sequoia
Just wondered if all is in order so that I did not mix up the variables or anythiing
Except correctly printing the values haha
stuck karma
tbh i didnt try it yet, i'm still "new" and i didnt try grid search yet
will try probably tomorrow
but did you followed a tutorial?
lapis sequoia
Yeah ok so gridsearch finds the optimal hyperparameter
stuck karma
seems like you want to follow specific steps
yes i know
ijust didnt try it
im not familiar
lapis sequoia
I am a computer science student so im following academic literature but I can however not understand why this is overfitting
lapis sequoia
It's not that I want but necessary steps in the right order to obtain a model that can generalize well
I use support vector regression (SVR). I did a principal component analysis (PCA) to reduce the dimensions as to one, reduce training time, and two avoid overfitting
lapis sequoia
14 features
6197 in training and 1550 in test
I did pca so that I have the treshold of variance set to 95%
stuck karma
okay , and svc doestn reduce dimension? because you dont have a lot of features so i wonder if the pca is necessar
lapis sequoia
PCA is rather neccessary than not so doubt that is the problem
Actually I obtained better results with PCA
lapis sequoia
stuck karma
okay , and svc doestn reduce dimension? because you dont have a lot of features ...
Why would it reduce dimensions?
stuck karma
yeah but you know that pca is a unsupervised method and sometimes it doesnt keep the most predictive features
no i was asking, but i would try without pca to see, but i guess you tried
and i would try a cross validation to see if the results are different depending of the folders or no
or if they are homogeneous
and also i would see if you have a parameter in your model to set the number of iteration? because sometimes your model needs to train for a few iterations before giving good results
undone flare
stuck karma
yeah but you know that pca is a unsupervised method and sometimes it doesnt keep...
It can be used in supervised learning . When you have large number of features one way to reduce it and avoid overfitting can be done using feature reduction method like PCA
stuck karma
undone flare
It can be used in supervised learning . When you have large number of features o...
yes but he only have 14 features
lapis sequoia
stuck karma
yes but he only have 14 features
It does not matter. After PCA we still have as much "power"
We don't lose any information
lapis sequoia
stuck karma
Would read your answers if you find a solution tomorrow :)
So yeah PCA is aimed to reduce dimensionality resulting in a less expensive model. However it also makes the model more prone to underfitting Moreover too much of the variance in data is surpressed. You can read up on the concept of "Bias–variance tradeoff" which explains this problem.
desert oar
stuck karma
mh
 vestal agate
bruh

 somber prism
guys i have one doubt , i have this dataset that has 200k in the training set alone but its taking too long to train the model for the cross validation so if i try to do it like this clf = model() batches = [(0,10000),(10001,20001) ... ] for batch in batches: # batches of training datasets xt = x_train.loc[batch[0] : batch[1]] yt = y_train.loc[batch[0] : batch[1]] clf.fit(xt, yt)
will this try to fit the x_train and y_train batch by batch or the new batch will overwrite the old one ?
 ripe forge
Overwrite pretty much
If speed is the issue, you could try without cv once, and train simpler models
somber prism
ripe forge
If speed is the issue, you could try without cv once, and train simpler models
oh ok
undone flare
Q1 = df["MinTemp"].quantile(0.25)
Q3 = df["MinTemp"].quantile(0.75)
IQR = Q3 - Q1

upper = df["MinTemp"] >= (Q3 + 1.5 * IQR)
print(len(np.where(upper)[0]))

lower = df["MinTemp"] <= (Q1 - 1.5 * IQR)
print(len(np.where(lower)[0]))
```so I am trying to find outliers in my data and this gave me 11 and 71, so will this have any effect on the model?it depends on the model , if you want you can drop those outliers or keep them
undone flare
somber prism
it depends on the model , if you want you can drop those outliers or keep them
like some of them has 28952 0
so can't really drop them
somber prism
then keep them , or use robust scaler
undone flare
hmm
 fossil bobcat
Can anyone help me understand self organizing maps and how to implement it for imputation of missing values using python ? thanks!
 livid kiln
I'm trying to merge concat two options chains together on their strikes, anyone know how to?
There are two df, which both have a column called strike, they intersect on most rows, however not all rows. I would like the two df to be concat on the 3rd axis. So basically 2 2D df are put on top of each other to make a 3D df where both df have the same strike value, where one df has say strike x and the other df does not, that row would be dropped and not be part of the 3D df.
import pandas as pd
import numpy as np
import yfinance as yf
stock = yf.Ticker("DELL")
c1 = stock.option_chain(stock.options[0]).calls
c2 = stock.option_chain(stock.options[1]).calls

print(c1)
print(c2)
sounds like you really are trying to merge.
desert oar
livid kiln
I'm trying to merge ~~concat~~ two options chains together on their strikes, an...
3d dataframes aren't really a thing. you can make a dataframe with hierarchical column names, though
i don't have the yfinance library - when you say they "intersect", what do you mean?
livid kiln
desert oar
i don't have the yfinance library - when you say they "intersect", what do you m...
pip install yfinance
desert oar
...and even if i do install the library, i still wouldn't know what you meant by "intersect"
serene scaffold
are you trying to do an inner join on the two dataframes, basically?
more coherently, an inner join between the two dataframes on strike
livid kiln
desert oar
i don't have the yfinance library - when you say they "intersect", what do you m...
There is a column in the first df1 called strike, there is a column in the second df2 called strike.
serene scaffold
the join (which will be merge in pandas) will still return a 2d structure, but you can reshape the underlying array if you need it to be 3d for a certain calculation.
livid kiln
0      60.0
1      70.0
2      75.0
3      80.0
4      85.0
5      87.5
6      90.0
7      92.5
8      95.0
9      97.5
10    100.0
11    105.0
12    110.0
13    115.0
14    120.0
15    125.0
16    140.0
17    145.0
Name: strike, dtype: float64
@livid kiln do you know what an inner join is?
livid kiln
0      55.0
1      75.0
2      80.0
3      85.0
4      87.5
5      90.0
6      92.5
7      95.0
8      97.5
9     100.0
10    105.0
11    110.0
12    115.0
13    120.0
14    125.0
15    140.0
Name: strike, dtype: float64
looking it up now... I remember something like that from databases back in undergrad
livid kiln
livid kiln
looking it up now... I remember something like that from databases back in under...
https://www.w3schools.com/sql/sql_join_inner.asp yes this is it!
The issue I'm having it how do I do a join in 3D space?
serene scaffold
You don't; you have to convert it to an array and reshape it after the fact.
result = df1.merge(df2, on='strike', how='inner')  # how='inner' is actually the default
result.to_numpy().reshape((2, a, b))
something like that
livid kiln
serene scaffold
You don't; you have to convert it to an array and reshape it after the fact.
import yfinance as yf
stock = yf.Ticker("DELL")
c1 = set(stock.option_chain(stock.options[0]).calls.strike)
c2 = set(stock.option_chain(stock.options[1]).calls.strike)

c1.intersection(c2)
they're sets now?
desert oar
c1 = c1.set_index('strike')
c2 = c2.set_index('strike')
cs = pd.concat(
    {stock.options[0]: c1, stock.options[1]: c2},
    axis=1,
)
cs.columns.names = ['option_date', 'variable']
i downloaded the damn library
people don't realize that concat also performs an outer join
it's annoyingly the only way to get a multiindex as a result of a join
and this is indeed an outer join operation
desert oar
i thought they wanted the non-overlapping ones too
serene scaffold
they said inner join for sure
desert oar
oh you're right
so yes you need .dropna
c1 = c1.set_index('strike')
c2 = c2.set_index('strike')
cs = pd.concat(
    {stock.options[0]: c1, stock.options[1]: c2},
    axis=1,
).dropna()
cs.columns.names = ['option_date', 'variable']
doing
{stock.options[0]: c1, stock.options[1]: c2}and notdict(zip(stock.options, (c1, c2)))
desert oar
heh
i try to avoid ziping things of different lengths
in this case stock.options is a list of YMD strings
stock is an object, ane instance of some "stock" class
stock.option_chain is a method that returns a dataframe given the YMD string
livid kiln
desert oar
```python
c1 = c1.set_index('strike')
c2 = c2.set_index('strike')
cs = pd.concat...
What is the best way to view "different layers" of this?
desert oar
the other way is to turn it into a multiindex in advance and then use .join or pd.merge:
c1 = c1.set_index('strike')
c1.columns = pd.MultiIndex.from_tuples([
    (stock.options[0], c) for c in c1.columns
], name=['option_date', 'variable'])

c2 = c2.set_index('strike')
c2.columns = pd.MultiIndex.from_tuples([
    (stock.options[1], c) for c in c2.columns
], name=['option_date', 'variable'])

cs = c1.join(c2, how='inner')
if you print the dataframe you'll see that there are 2 layers of column names. do you want to list the column names? or access an inner layer?
you can write cs['2021-08-20'] to access the sub-dataframe under the 2021-08-20 heading
if you want to access lastTradeDate inside 2021-08-20, you would write cs[('2021-08-20', 'lastTradeDate')]
note the ()s - those are necessary
so this isn't "3d" but the columns are hierarchical and the hierarchy can be arbitrarily deep
this is called a MultiIndex https://pandas.pydata.org/pandas-docs/stable/reference/api/pandas.MultiIndex.html
livid kiln
wow, thank you so much! the solution is perfect!
desert oar
that is, cs.columns is an instance of pd.MultiIndex, whereas normally it would just be a pd.Index
livid kiln
I will need to study multiindex, never used it before, never even seen it being used!
desert oar
serene scaffold
> doing `{stock.options[0]: c1, stock.options[1]: c2}` and not `dict(zip(stock.o...
pd.MultiIndex.from_product(
    itertools.repeat(stock.options[0]),
    c1.columns,
)
admittedly the pandas documentation for it is not that good, and it can be annoying to use at times
e.g. more verbose column names
but it's an extremely powerful pandas feature
it's worth spending time working with it and understanding it
the pandas user guides and tutorials are a good place to get a feel for these features, even if they don't explain things well
the reference documentation does a better job of explaining what each function does
livid kiln
How did you learn about multiindex? Is reading the docs enough?
desert oar
so read the guide, get confused, go read the reference docs for that function, and experiment on your own data
docs + experimenting + occasionally needing to look something up on stackoverflow
the "read the guide" and "go read the reference docs" part is important. people tend to just do the "get confused" and "experiment on your own data" parts
which are fine things to do (especially getting confused, imo if you're not confused once in a while then you're not working on interesting problems), but without the other 2 steps you don't really learn anything
livid kiln
does reference docs mean the API on the docs website?
desert oar
ah they changed it to "API"
yes
it's common in programming docs to use "API" or "API reference" or "Reference manual" for the section where they list every single function/method/class/etc in detail
and "User guide" is for more conceptual explanations, example code, and tutorials
also in the future it would help if you could be more specific about the data when asking for help. it's not always feasible for someone to download a library and fetch a bunch of data from the web
livid kiln
Thank you very much for your help, I've asked this question on 3 other groups, 2 being specifically groups of devs in the finance industry, none could produce the solution.
livid kiln
desert oar
also in the future it would help if you could be more specific about the data wh...
Sorry about this, what would the best way to represent the data for this question? It kind of uses data to get data therefore I wasn't sure how to show an end to end example
desert oar
livid kiln
Sorry about this, what would the best way to represent the data for this questio...
!paste it would be easiest if you used our paste site (👇 ) to show the dataframes (because they're not very big), maybe as csv, so people can easily copy and paste them to work with them
arctic wedgeBOT
Pasting large amounts of code
If your code is too long to fit in a codeblock in discord, you can paste your code here:
https://paste.pydis.com/
After pasting your code, save it by clicking the floppy disk icon in the top right, or by typing ctrl + S. After doing that, the URL should change. Copy the URL and post it here so others can see it.
desert oar
but in this case it was no big deal, the fact that it was a finance library turned out to be somewhat relevant because i showed you the idea of using the option date as the multiindex level
in general having sample data can never hurt, but explanations of what the sample data is can help too
livid kiln
desert oar
in general having sample data can never hurt, but explanations of what the sampl...
Awesome, I'll definitely keep that in mind next time. I never thought of explaining the data, but on hindsight it seems something that I should have thought of and done.
desert oar
livid kiln
Awesome, I'll definitely keep that in mind next time. I never thought of explain...
no problem, we need some kind of standardized "how to get data help" document
it's different from other code help, more requirements
livid kiln
desert oar
if you want to access `lastTradeDate` inside `2021-08-20`, you would write `cs[(...
cs['2021-08-20'].lastTradeDate also seems to work
This way makes more sense to me as it is how I usually get a column from a df. Also it nice in a loop as all I need to do is make that date into a variable
desert oar
I don't like dotted column accessing
I know it's familiar from R, but I think it's a questionable design and it's not worth it to me to save the keystrokes
 velvet thorn
desert oar
I know it's familiar from R, but I think it's a questionable design and it's not...
velvet thorn
desert oar
I know it's familiar from R, but I think it's a questionable design and it's not...
AGREED
IT'S A SIN IMO
serene scaffold
desert oar
I don't like dotted column accessing
I do it in repls sometimes but not in production
velvet thorn
serene scaffold
I do it in repls sometimes but not in production
did you learn pandas that way?
or is it like a holdover from something else
bracket access just seems so much more intuitive to me
like to me __getattr__ is for what a thing is, and __getitem__ is for what a thing contains...
...and DataFrames contain columns.
wtf
.a
serene scaffold
We need to fix that
velvet thorn
...and
serene scaffold
velvet thorn
did you learn `pandas` that way?
I didn't really learn pandas, it just sort of clicked one day. But I don't like using getattr for columns in production because it's conflating the two namespaces.
velvet thorn
serene scaffold
I didn't really learn pandas, it just sort of clicked one day. But I don't like ...
yeah.
tbh I feel it was a bad design choice
but then again
the ecosystem was probably different last time
velvet thorn
desert oar
I know it's familiar from R, but I think it's a questionable design and it's not...
and I didn't know this
if it was to ease the transition from R
I think that's defo justifiable
serene scaffold
I assume given attributes being available for column names isn't guaranteed and any release could introduce a new attribute?
Ie a method, accessor, what have you.
velvet thorn
serene scaffold
I assume given attributes being available for column names isn't guaranteed and ...
precisely
so it's not forward compatible
 lusty stag
umm is extra trees classifier bagging or boosting?
velvet thorn
lusty stag
umm is extra trees classifier bagging or boosting?
hm
what do you think? 😉
lusty stag
similar to random forest so bagging?
velvet thorn
lusty stag
similar to random forest so bagging?
indeed
lusty stag
but has by default bootstrap false
velvet thorn
why do you ask
lusty stag
it isn't using bootstrap so why is it bagging?
velvet thorn
okay, hold up
serene scaffold
velvet thorn
precisely
In that case I don't think it matters. Though I did recently have someone who was confused as to why they couldn't access a column with spaces in the name .
velvet thorn
lusty stag
it isn't using bootstrap so why is it bagging?
if you mean "bagging" in the strict sense
i.e. boostrap aggregation
then no, it's not
hey, I never knew bootstrap=False was the default
hold up let me read the docs
lusty stag
so from which perspective it's considered bagging?
 royal wasp
hi
velvet thorn
lusty stag
so from which perspective it's considered bagging?
it's not I guess
since the whole dataset is used for each tree by default
I'm not sure why that is the case, but I would guess it's to counteract the increased bias/decreased variance of the extra trees approach
lusty stag
i'm totally new to this what I learned from google is
boosting classifiers have "boost" named in it like gradientboost and xgboost
while trees are called "bagging"
but extra trees seems to be different
undone flare
is median robust to outliers? and should I only remove outliers from my train dataset?
velvet thorn
lusty stag
i'm totally new to this what I learned from google is
boosting classifiers have ...
uh
okay do you know what bagging and boosting are?
lusty stag
I have to write for my paper so will it be wise to include extra trees as "bagging" or just don't mention explicitly?
velvet thorn
undone flare
is median robust to outliers? and should I only remove outliers from my train da...
what do you think?
undone flare
for the second one I think yes but no idea about the first one
lusty stag
velvet thorn
okay do you know what bagging and boosting are?
I have a visual idea but no in depth sense
velvet thorn
undone flare
for the second one I think yes but no idea about the first one
okay, so think about this
what does it mean to say that a summary statistic is sensitive to outliers?
velvet thorn
lusty stag
I have a visual idea but no in depth sense
okay
BASICALLY
boosting means
you take a weak classifier and fit it on your dataset
because it's weak, the errors will be high
fit another weak classifier on those errors
that will give you errors of the errors
undone flare
velvet thorn
what does it mean to say that a summary statistic is sensitive to outliers?
I don't get it
velvet thorn
fit ANOTHER weak classifier on that
repeat
then you combine all of them
so each successive classifier "boosts" the accuracy of the previous one
velvet thorn
undone flare
I don't get it
you asked this
is median robust to outliers?
what does "robust" mean to you?
bagging stands for "bootstrap aggregation"
lusty stag
yes
velvet thorn
basically it means...you take your dataset, and you draw a number of samples from it (usually same number as the rows in your dataset) to form a new dataset
and you repeat it multiple times
undone flare
velvet thorn
> is median robust to outliers?
something which is not affected
lusty stag
oh I get it now
velvet thorn
so now you have many sub-datasets that are drawn from the original
and you fit one model on each
then you combine them all
undone flare
I if the range is larger the mean would be misleading
velvet thorn
undone flare
I if the range is larger the mean would be misleading
but why?
lusty stag
so extra trees can be concluded as bagging as I can implement bootstrap if I want to
velvet thorn
show me an example?
velvet thorn
lusty stag
so extra trees can be concluded as bagging as I can implement bootstrap if I wan...
indeed
I'm not sure why it's not that way by default
in sklearn
you would have to ask someone more familiar with the statistical methodology/codebase than I
I haven't touched DS/ML in a year+
lusty stag
well I got my answer thank you ❤️
velvet thorn
lusty stag
well I got my answer thank you ❤️
yw 👋
undone flare
velvet thorn
but why?
it would be more towards the larger value?
lusty stag
funny thing is for my model extra trees is working better than random forest
all of the papers I'm reading regarding my topics never utilized extra trees at all
velvet thorn
undone flare
it would be more towards the larger value?
hm
let me rephrase this
imagine you have 5 values
1, 2, 3, 4, 5
the mean is clearly 3
the median is also 3
now imagine a case where I change ONE value a lot
so the dataset might be 1, 2, 3, 4, 50000
how will the mean and median change?
finally, think about what would happen if I change another value a lot
again, how will the mean and median change?
if you understand that, you will know the answer to your question
😉
velvet thorn
yup
 empty jetty
I need the best book for data visualisation
serene scaffold
empty jetty
I need the best book for data visualisation
I doubt one particular book is the best in every conceivable way. Have you looked to see if O'Riley has any books about matplotlib?
 grave frost
Stanford is pivoting to positioning itself as #1 at academic ML Scaling (e.g. GPT-4) research.

arXiv.org
AI is undergoing a paradigm shift with the rise of models (e.g., BERT,
DALL-E, GPT-3) that are trained on broad data at scale and are adaptable to a
wide range of downstream tasks. We call these...
LMFAO 🤣
 acoustic halo
Just got into the GPT-3 beta, how shall I waste my credits?
grave frost
acoustic halo
Just got into the GPT-3 beta, how shall I waste my credits?
Just try one thing for the love of mankind 🙏
joe [MASK], Candice [MASK] Sug[MASK]
Also, ask it to autocomplete jokes starting with the above tokens ^^
acoustic halo
I feel like I'm missing something but I daren't ask in case it's a sugma balls joke
But you got a specific prompt in mind?
grave frost
acoustic halo
I feel like I'm missing something but I daren't ask in case it's a sugma balls j...
yes it is - I wanna know whether it can autocomplete the joke (Neo and J can't)
acoustic halo
I'll give it a try in playground tomorrow and let you know, I have no idea how to properly put together a good prompt so probably won't be any good
 burnt delta
any good roadmaps to develop on data analysis ?
im currently studying engineering at uni and would love to learn python , would appreciate suggestions :))
thank you !
vestal agate
what method should i do to predict crypto currencys
 hollow path
Trying to do a pandas conditional column that references the previous row's value (of the same conditional column) and shift(1) is not yielding expected results
via np.where, or .loc
anyone run into this? the 30+ google search results I've gone through on the subject don't really solve for the same column.. but typically deal with shifting other columns in the dataframe
 hollow lagoon
Good evening everyone. Iv been doing some linear regression using python(from sklearn.linear_model import LinearRegression) and i came by an error that only happens when i write df['engine-size'] instead of df[['engine-size']]. The Error is Reshape your data either using array.reshape(-1, 1) if your data has a single feature or array.reshape(1, -1) if it contains a single sample. Once i rewrite the double [] everything work. So my question to you all beautiful and amazing people is what is the technical difference betwee df['engine-size'] and df[['engine-size']]. Thanks !
oh the error happens when i try fitting the data, ex. python myLinearObject.fit(myXdata, myYdata)
 idle abyss
I've got a spreadsheet with columns of sports stats produced by a webscraper. The spreadsheet has a totals row (produced by pandas, but checked in excel and is accurate) and a "league average" row. leagueAverage is produced by pandas:
df.loc['lgAvg'] = df.mean()
In excel, doing:
=AVERAGE(first cell: last cell)
gives dramatically different results to lgAvg though.
=sum(firstCell:lastCell)/#rows agrees with =AVERAGE.
Anyone know why lgAverage is so different? It does seem like lgAverage is the one that's wrong, based on a casual glance.
 bronze skiff
empty jetty
I need the best book for data visualisation
bronze skiff
empty jetty
I need the best book for data visualisation
the only book you ever need is tufte's book: https://www.amazon.com/Visual-Display-Quantitative-Information/dp/1930824130

The Visual Display of Quantitative Information
everything else is vanity
velvet thorn
idle abyss
I've got a spreadsheet with columns of sports stats produced by a webscraper. Th...
null values, perhaps?
I don't know how it works in Excel
but by default
pandas skips nulls
so e.g. the mean of [1, 2, null, 3, null] would be 2, not 1.2
pass skipna=False to mean() and see if the results tally
idle abyss
I've got df = df.fillna(0) in there, that should do the same thing effectively right?
yeah, skipna=False gave me the same lgAvg totals, because I no longer have any null values.
velvet thorn
idle abyss
I've got `df = df.fillna(0)` in there, that should do the same thing effectively...
no
well
yes in this sense
velvet thorn
idle abyss
yeah, skipna=False gave me the same lgAvg totals, because I no longer have any n...
ye that's the issue then
neither is "wrong"; it's just a different method of calculation
arctic wedgeBOT
@mortal parrot Please don't try to ping @everyone or @here. Your message has been removed. If you believe this was a mistake, please let staff know!
 quiet vault
How do I force outputs to be integers for binary classification problems
I have two output nodes and a softmax function but it gives me a number in between 0 and 1
i want it to be either 1 or 0
idle abyss
.round()?
quiet vault
No. I want the neural network to do it. Rounding is not a good way to do it for multiple reasons
 ruby hatch
am I just really unlucky so far, or is windows a bad base of operations to try to do AI/ML/data analytics from?
ruby hatch
Pastebin
Pastebin.com is the number one paste tool since 2002. Pastebin is a website where you can store text online for a set period of time.
that
I'm trying to learn by reading Hands-On Machine Learning with Scikit-learn, keras, and TensorFlow
and i'm on the first jyputer notebook in the github repo for the book and when pycharm asks to restore packages I get that error
ruby hatch
last time it was the current version of pandas not working with windows
which lead me to install insder preview which I just reinstalled windows to get rid of
undone flare
@ruby hatch looks like xgboost is not installing properly?
ruby hatch
I got that part
undone flare
okay I can only see xgboost logs in there
ruby hatch
it looks to me like it's having issues compiling some cpp code
but i've gotta be wrong, aren't pip packages supposed to be binaries?
undone flare
How did you try to install it
ruby hatch
uh, pycharm asked if i'd like to install prereqs and I said yes
livid kiln
hollow lagoon
Good evening everyone. Iv been doing some linear regression using python(from sk...
I think if you do type(df['engine-size']) and type(df[['engine-size']]), the first one is a series and the second one is a dataframe
quiet vault
Does anyone know why I cannot use model.predict_classes() on a Sequential model?
AttributeError: 'Sequential' object has no attribute 'predict_classes'
model = Sequential()
model.add(LSTM(50, input_shape=(n_steps, n_features)))
model.add(Dense(20, activation='relu'))
model.add(Dense(1, activation='softmax'))
model.compile(loss='binary_crossentropy', optimizer='adam', metrics=['accuracy'])

# Fitting model
model.fit(x_test, y_test, epochs=100, batch_size=32, verbose=0)```your features need to be a 2D array (corresponding to a DataFrame)
when you use two brackets, you're actually passing a list of columns
like this:
columns = ['this', 'that', 'something_else']
df[columns]

# same as

df[['this', 'that', 'something else']]
if you pass a single column name, you get back a Series (corresponding to a 1D array) instead of a DataFrame
and this is a problem because
if your training data is 1D
you can't distinguish between samples and features
e.g. in 2D, (10, 100) means "10 samples with 100 features", and (100, 10) means "100 samples with 10 features"
but in 1D, if you have (10,), you can't tell the difference between "10 samples with 1 feature" and "1 sample with 10 features"
 old meteor
Hi all. I'm new to coding but have some experience with pandas dataframe now. Can someone show me the direction to make a 3D dataframe? Say I have already a standard 2D dataframe, but these data changes every day. What I need is to pile on the new data each day, so that in the end I can track also the change by the 3rd index (date). What should I be looking into?
quiet vault
are you using yfinance to download the data?
old meteor
No, pretty much just my own code
old meteor
sorry what do you mean 1 day into the future?
quiet vault
like what are you trying to predict
old meteor
Just get data everyday, so I can look back what happened
old meteor
No, not predicting at the moment
quiet vault
ok
so
I recommend using yfinance to download stock data due to the fact that it updates everyday and it outputs it in a data frame. If your code works fine, then you don't need to use it. If you want to update the data frame everyday to get the data from the last day, yfinance does it for you. If you don't want to do so, you can turn the dataframe into a list and append the new day of data.
To make the data frame 3d, you can turn the data frame into a numpy array and use the reshape() function.
What variables or features are you importing with the datafrane?
old meteor
My data contains lots of stuff not very standard, e.g. sentiment on a stock. So I guess I need to do it on my own.
OK. All I need is a general idea on what to do. I'll look into what you suggested.
Many thanks.
quiet vault
Your welcome
 viscid bridge
Can someone explain to me the derivation of (cost function formula ) in linear regression .
 faint prairie
SUS
 sterile wraith
Hey so i wanted to work on a little project: I want to teach my computer to identify debit and credit
 gentle acorn
acoustic halo
gentle acorn
acoustic halo
Depends on what it actually does
acoustic halo
Okay, but like is it just if you say a certain phrase, it does an action?
@grave frost No luck on the sugma, it did mention dick jokes, but I think it was down to a badly worded prompt
grave frost
acoustic halo
<@!738058085083381760> No luck on the sugma, it did mention dick jokes, but I th...
😦
something like "tell me a joe mama joke"?
undone flare
My target label is categorical(binary) and it has null values should I impute them with the mode?
Also the class is unbalanced
acoustic halo

An API for accessing new AI models developed by OpenAI
@grave frost Best i could get out of it was "fugma cock" when i gave it fugma to start with, then on its own it came up with "dickma dicks"
grave frost
acoustic halo
<@!738058085083381760> Best i could get out of it was "fugma cock" when i gave i...
well, atleast that's a start 😂
 limpid oak
hello
I'm looking for output like this
                   '2021-07-02': {'cloud_cover': '7'},
                   '2021-07-03': {'cloud_cover': '7'},
                   '2021-07-04': {'cloud_cover': '4'},
                   '2021-07-05': {'cloud_cover': '7'}
}
}```try to convert this list
[('501', '03991', 'Akola', 'Akola', '2021-08-17', '2021-08-18', '18.1', '26.1', '21.7', '93', '86', '14', '294', '8'), ('501', '03991', 'Akola', 'Akola', '2021-08-17', '2021-08-19', '7.3', '24.3', '21.3', '92', '86', '17', '293', '8'), ('501', '03991', 'Akola', 'Akola', '2021-08-17', '2021-08-20', '0.9', '28', '21', '86', '73', '19', '293', '8'), ('501', '03991', 'Akola', 'Akola', '2021-08-17', '2021-08-21', '0', '29.1', '21.8', '81', '70', '14', '293', '8'), ('501', '03991', 'Akola', 'Akola', '2021-08-17', '2021-08-22', '13.8', '31.4', '22.5', '91', '62', '9', '295', '6')]
 wicked wing
what
limpid oak
what am I missing here
for row in result:
  dict[row[1]] = {}
  dict[row[1]][row[5]]= {}
  dict[row[1]][row[5]]['rainfall_mm'] = row[6]
  dict[row[1]][row[5]]['temp_max_deg_c'] = row[7]
  dict[row[1]][row[5]]['temp_min_deg_c'] = row[8]
  dict[row[1]][row[5]]['humidity_1'] = row[9]
  dict[row[1]][row[5]]['humidity_2'] = row[10]
  dict[row[1]][row[5]]['wind_speed_ms'] = row[11]
  dict[row[1]][row[5]]['wind_direction_deg'] = row[12]
  dict[row[1]][row[5]]['cloud_cover_octa'] = row[13]

dict```in output it only showing last value
   'temp_max_deg_c': '31.4',
   'temp_min_deg_c': '22.5',
   'humidity_1': '91',
   'humidity_2': '62',
   'wind_speed_ms': '9',
   'wind_direction_deg': '295',
   'cloud_cover_octa': '6'}
}
}```some text from expected output removed due to limit
somber prism
guys if i have a imbalanced dataset for eg output variable class ratio is like 15:5, is it applicable to create a 3 separate dataset then train those 3 dfs in 3 models of same kind ( svm ) then output mode
m1 = svm()
m2 = svm()
m3 = sum()
df = some dataset of shape = (200, 2)
df_0 = df[df.target == 0]
df_1 = df[df.target == 1]
# xtrain , xtest, ytrain and ytest for all those dfs
m1.fit(x_train1, y_train1)
m2.fit(x_train2, y_train2)
m3.fit(x_train3, y_train3)

new_samples_for_testing = some new samples
pred1 = m1.predict(nenew_samples_for_testing)
pred2 = m2.predict(nenew_samples_for_testing)
pred3 = m3.predict(nenew_samples_for_testing)

preds = [1 if sum(i) > 1 else 0 for i in list(zip(pred1,pred2,pred3))]```something like this
 flat hollow
If I have a Series like this, how do I choose all the values that have the value 'ktrans' in the multiindex' column ktrans? This Series is in a list and doing AICs[0].loc["ktrans"] gives me KeyError: 'ktrans' (AICs is a list of Series)
 velvet thorn
flat hollow
If I have a `Series` like this, how do I choose all the values that have the val...
velvet thorn
flat hollow
If I have a `Series` like this, how do I choose all the values that have the val...
so
if I understand correctly
you have a multi index
with 5 columns?
flat hollow
6
it comes from a big dataframe which doesnt actually have that many datapoints, but it's part of research so we tried a bunch of different things and looked at the outcomes, resulting in a hugely nested multiindex
the ktrans column has 2 values in it and I just want to split it up using those 2 values
AICs[0][AICs[0].index.get_level_values('ktrans') == 'ktrans']
done
(though I was hoping for a more elegant solution)
serene scaffold
flat hollow
If I have a `Series` like this, how do I choose all the values that have the val...
I would probably reset the index and use it like a normal dataframe
If you need six values to uniquely identify an observation, it may be just as well that you use a range index for all of this.
serene scaffold
 young juniper
Any data science/ AI beginners here?
young juniper
Any data science/ AI beginners here?
I'm not a beginner per se, but I am an imposter. Why do you ask?
young juniper
Wanted to take up some beginner projects
Possibly with someone with the same skill level
 dark swallow
a 12
a 7
a 10
b 5
b 19
b 20
Say i want to coerce every first occurence of the alphabets to a new value, how do i go about it? my result i want a 12 to turn to a 0, b 5 to b 0, yet keeping the other values the same. pinging @wicked wing for continued support
dark swallow
in your code first_occurrences = [x.idxmax() for x[1] in df.groupby(["ACCT_KEY"]), x is supposed to be my main df?
dark swallow
np
wicked wing
!e
import pandas as pd

df = pd.DataFrame(columns=["col1", "col2"])
df["col1"] = ["a", "a", "a", "b", "b", "b"]
df["col2"] = [12, 7, 10, 5, 19, 20]

first_occurrences = df.groupby(["col1"]).apply(lambda x: x.first_valid_index())
print(first_occurrences)
@wicked wing :white_check_mark: Your eval job has completed with return code 0.
001 | col1
002 | a    0
003 | b    3
004 | dtype: int64
if you want the indices as a list, just put a .to_list() at the end:
first_occurrences = df.groupby(["col1"]).apply(lambda x: x.first_valid_index()).to_list()
@dark swallow
dark swallow
sick ! it works
i guessed first_valid_index would only return boolean but i was wrong
dark swallow
so i just need to left join on index, if not None and we're gucci
wicked wing
ganbare!
dark swallow
any rep system in this server?
serene scaffold
dark swallow
any rep system in this server?
the satisfaction of knowing that you're making quality contributions to our community 
wicked wing
👍
undone flare
undone flare
My target label is categorical(binary) and it has null values should I impute th...
anyone?
undone flare
serene scaffold
how many nans are we talking about here?
3k
serene scaffold
undone flare
3k
out of how many?
undone flare
150k I can drop them probably
If I drop all the null values from the dataset it would become 50k should I drop all of them and not worry about them?
 dull turtle
hello i need help in this questionpython Which of the following statements is/are true for input excitatory neuron? a) Output is 1 if input of excitatory neuron is 1. b) Output is 0 if input of excitatory neuron is 1. c) Input of excitatory neuron alone cannot decide output. d) Output is 1 if input of excitatory neuron is 0. e) Output is 0 if input of excitatory neuron is 0.
please ping me when u are replying
ripe forge
I'll answer that with a question. How does a neuron work?
dull turtle
ripe forge
I'll answer that with a question. How does a neuron work?
in cnn ?
neuron is responsible forming a network and passing information through different layers
ripe forge
Architecture doesn't matter at all. And that's too vague. How does a single neuron work?
Or to phrase it differently what exactly does a neuron do?
dull turtle
ripe forge
Architecture doesn't matter at all. And that's too vague. How does a single neur...
it passes signal
ripe forge
How
dull turtle
like as our brain cell
ripe forge
Still too vague. What exactly does it do?
dull turtle
i am not able to put my ans in correct words , can u correct me ?
ripe forge
Do you know how a neuron works? What exactly is a single neuron doing?
I suppose I should clarify, not the neuron of the brain. We're talking data science neuron yes?
dull turtle
ripe forge
I suppose I should clarify, not the neuron of the brain. We're talking data scie...
yes
ripe forge
So, at its essence, if we strip away all the marketing nonsense, what exactly is a neuron?
dull turtle
ripe forge
So, at its essence, if we strip away all the marketing nonsense, what exactly is...
it is a layer consists of small individual units
ripe forge
A neuron is not a layer. I'm interested in one of those units.
What exactly is one unit doing?
dull turtle
it is nodes through which data and computations flow
ripe forge
Too vague. Well it's kinda correct at a high lvl but it's not the level that will get you the answer. So okay.
If you're not sure, I'll give you a hint. A neuron does "something" to an input to give some output. That's all it is. It's nothing special. Do you know what it does to the input?
flat hollow
Darr is looking for an answer that contains the mathematical steps taken inside the actual neuron, not just "flow of information".
ripe forge
A neuron can be thought of as a simple mathematical equation ultimately.
ripe forge
Okay, so I was assuming that you were asking this as a part of formal studies. Are you just self learning? What's the context
Essentially, there's seemingly a big gap in your knowledge right now. That's my impression
dull turtle
ripe forge
Essentially, there's seemingly a big gap in your knowledge right now. That's my ...
yes
ripe forge
Oh ok. So I'd say this. A CNN is formed from individual units. Those units are neurons. The question you'd need to ask yourself is, how exactly does a neuron work. And for that I'd perhaps suggest starting from some resource that teaches normal neural network from scratch, no need to do CNN before a normal feed forward neural network. The first topic should be about perceptrons
dull turtle
ripe forge
Oh ok. So I'd say this. A CNN is formed from individual units. Those units are n...
i will definately do but now can u please help me to ans this question
ripe forge
What's this question for? Is this a quiz?
dull turtle
ripe forge
What's this question for? Is this a quiz?
yes quiz
ripe forge
Quiz for what, school?
dull turtle
ripe forge
Quiz for what, school?
yes
ripe forge
So have you not been taught about neurons before discussing cnns? This is a bit.. Worrying to me
As a principle I personally don't like giving answers to quizzes directly but instead try to lead folks there whenever possible.
dull turtle
actually i missed some of beginning lectures
ripe forge
Aha. That does it. Okay.. You need to cover that ground.
dull turtle
as i was suffereing from fever 2 weeks ago thats why
ripe forge
Take this as a warning sign right now. This is bad.
ripe forge
For now, I'll tell you this. A neuron multiplies an input with some weight, to give an output. The value of weight can be arbitrary. So, a neuron is like y = weight * input. (and some other stuff im simplifying)
Now. I'll ask this. What happens if the weight is 0? And what happens if the weight is 1? And if weight is 0.5?
dull turtle
if weight is 0 then y will be 0
if weight will be 1 then y will be 1
and if weight 0.5 then y will be 0.5
flat hollow
if you wish, here is a quick overview of a single ML neuron https://www.kaggle.com/ryanholbrook/a-single-neuron
ripe forge
Y won't be 1,ir would be equal to input.
But in either case, you see how weight and input both play a role in the equation yes?
dull turtle
ripe forge
But in either case, you see how weight and input both play a role in the equatio...
yes
ripe forge
So to answer your question, just input alone is not enough to figure out y. Weight matters too
Can you see which option is making sense?
dull turtle
ripe forge
Can you see which option is making sense?
Which of the following statements is/are true for input excitatory neuron?
 Output is 1 if input of excitatory neuron is 1.
 Output is 0 if input of excitatory neuron is 1.
 Input of excitatory neuron alone cannot decide output.
 Output is 1 if input of excitatory neuron is 0.
Output is 0 if input of excitatory neuron is 0.``` Output is 1 if input of excitatory neuron is 1. is this the correct option
?
flat hollow
You have just learned that input alone is not enough to determine the output.
 merry glacier
Where should I start with machine learning?
dull turtle
flat hollow
You have just learned that input alone is not enough to determine the output.
Input of excitatory neuron alone cannot decide output. is this answer ?
flat hollow
does it sound right to you?
dull turtle
flat hollow
does it sound right to you?
yes
dull turtle
okay but Input of excitatory neuron alone cannot decide output. this is the correct ans na ?
just confirming
bcoz i have only 1 attempt
@flat hollow can u plz confirm once
flat hollow
merry glacier
Where should I start with machine learning?
kaggle.com has nice courses, I also found it helpful to read a book that curated the explanation of the basics to my own degree (in my case A high-bias, low-variance introduction to Machine Learning for physicists), you should get familiar with modules like numpy and matplotlib first so you dont waste time being confused by python
 reef bone
ripe forge
For now, I'll tell you this. A neuron multiplies an input with some weight, to g...
reef bone
ripe forge
For now, I'll tell you this. A neuron multiplies an input with some weight, to g...
I'd probably add that it also adds something rather than just multiplying by something, since just multiplication could hint at the last option being correct too
merry glacier
flat hollow
kaggle.com has nice courses, I also found it helpful to read a book that curated...
Okay.
dull turtle
reef bone
I'd probably add that it also adds something rather than just multiplying by som...
actuaaly i got confused in multiple options
can u plz help me to select correct ? @reef bone
flat hollow
!rule 8
arctic wedgeBOT
8. Do not help with ongoing exams. When helping with homework, help people learn how to do the assignment without doing it for them.
flat hollow
we gave you the tools to answer
reef bone
I believe you have been given the answer already
dull turtle
reef bone
I believe you have been given the answer already
Input of excitatory neuron alone cannot decide output is this the correct ans ? can u plz confirm once
reef bone
flat hollow
You have just learned that input alone is not enough to determine the output.
If you take this answer as plain truth, can you link it to one of the options 😄
Yes it is the correct answer; the other users are just trying to get you to put more independent thought into your solutions
dull turtle
thanks
flat hollow
I am using Akaike Information Criterion to determine the best models fitted to data using scipy.optimize.least_squares function. This allows me to use ΔAIC = 2k + n ln(RSS) (from wiki) where RSS is the sum of the residual vectors and n is the number of data points in that vector. The 2*k is meant to punish models for having more parameters (k) than others. My issue is with the numbers I'm getting. While 2*k is 1,4 or 6 in my cases, n* ln(RSS) goes into the negative hundreds or even thousands. How come the punishment for the extra model parameters is so mild? Have I done something wrong? (the AIC numbers do favour the visually best model, it's just weird to me that the 2 parts of the equation give such different values if one is to affect the other meaningfully)
dull turtle
Which of following features of deep learning can lead to overfitting?
A.    High capacity
B.    Numerical stability
C.    Sharp minima
D. non-robustness ``` can @reef bone u help me in this ?stop asking for people to give you the answers.
velvet thorn
 wheat yew
any numpy pros here?
wheat yew
any numpy pros here?
do you have a specific question?
wheat yew
yep
velvet thorn
go ahead
 wheat yew
Create function get_row_vectors that returns a list of rows from the input array of shape (n,m), but this time the rows must have shape (1,m). Similarly, create function get_columns_vectors that returns a list of columns (each having shape (n,1)) of the input matrix .
Example: for a 2x3 input matrix
[[5 0 3]
[3 7 9]]
the result should be
Row vectors:
[array([[5, 0, 3]]), array([[3, 7, 9]])]
Column vectors:
[array([[5],
[3]]),
array([[0],
[7]]),
array([[3],
[9]])]
The above output is basically just the returned lists printed with print. Only some whitespace is adjusted to make it look nicer. Output is not tested.
wheat yew
okay one sec
velvet thorn
so
wheat yew
this should eb quite easy i think
flat hollow
they want you to use list slicing on the numpy arrays
wheat yew
i dont know how to do that stacking thing
velvet thorn
you have this:
[[5, 0, 3],
 [3, 7, 9]]
how do you get [5, 0, 3] from it?
wheat yew
list[0]
velvet thorn
and [3, 7, 9]?
wheat yew
1
wheat yew
i know basic stuff of off lists
wheat yew
ah array
velvet thorn
wheat yew
i guess but it has to be [[]]
the reason it's like this
is that it's a 2D array
watch this
wheat yew
yea i get its 2d
velvet thorn
!e
import numpy as np

a = np.array([[1, 2, 3]])
print(a)
print(a.shape)

b = np.array([1, 2, 3])
print(b)
print(b.shape)
@velvet thorn :white_check_mark: Your eval job has completed with return code 0.
001 | [[1 2 3]]
002 | (1, 3)
003 | [1 2 3]
004 | (3,)
so with a[0] we get a 1D slice
how do we get a 2D slice?
velvet thorn
yeah
okay, so think about this
the meaning of a[0]
is basically
"the 0th row of the array a"
wheat yew
yep
wheat yew
yes the row is 1d
velvet thorn
okay
now imagine
I wanted to get 2 rows
out of a 3-row 2D array
the result would be 2D too, right?
!e
import numpy as np

a = np.array([[1, 2, 3], [4, 5, 6], [7, 8, 9]])

print(a)
print(a[:2])
@velvet thorn :white_check_mark: Your eval job has completed with return code 0.
001 | [[1 2 3]
002 |  [4 5 6]
003 |  [7 8 9]]
004 | [[1 2 3]
005 |  [4 5 6]]
there we go
wheat yew
yep okay
wheat yew
a[0][0]
velvet thorn
no, that would give you a single number
namely, 1
(also, a[0, 0] would be more appropriate)
wheat yew
and okay yeah i get that it gives 1
velvet thorn
velvet thorn
the result would be 2D too, right?
look at this
a[:2] means "all the rows up to the 2nd, exclusive"
wheat yew
yep
wheat yew
a[1]
velvet thorn
no, that would be 1D, remember
wheat yew
slice means like
velvet thorn
slice just means subset
wheat yew
yeah okay
velvet thorn
so
velvet thorn
wheat yew
if you do a[:1] it gives the first
this specifies only the end
how do you also specify the start of a slice?
desert oar
(you can also use array-based indexing, x[[row_num]])
velvet thorn
desert oar
(you can also use array-based indexing, `x[[row_num]]`)
indeed you can
wheat yew
or a[start:end]
velvet thorn
wheat yew
a[start, end]
this would give you a[row_index, column_index]
wheat yew
true
velvet thorn
desert oar
(you can also use array-based indexing, `x[[row_num]]`)
maybe this is more ergonomic? but more distant from the fundamentals IMO
velvet thorn
wheat yew
or a[start:end]
yup
so how would you use this to get the 2D slice containing only the 2nd row?
and by that I mean
wheat yew
2nd row, first index?
velvet thorn
[[1, 2, 3],
 [4, 5, 6],
 [7, 8, 9]]

# I want [[4, 5, 6]]
ye
velvet thorn
okay, so, remember, we got the first row with a[:1], yeah?
wheat yew
yep
velvet thorn
this would just be a[1:2]
wheat yew
it makes it 2d?
velvet thorn
or, as @desert oar notes, a[[1]]
velvet thorn
wheat yew
it makes it 2d?
yes
because when you use slice notation
you're saying
"get me a number of sub-arrays in this dimension"
in particular...get me all the rows, starting with the 1st and ending with the 2nd, exclusive
wheat yew
huh okay
velvet thorn
so the result must be 2D, because it contains a number of rows
it's just that in this case that number happens to be 1
!e
import numpy as np

a = np.array([[1, 2, 3], [4, 5, 6], [7, 8, 9]])

print(a[1:2])

# other method
print(a[[1]])
@velvet thorn :white_check_mark: Your eval job has completed with return code 0.
001 | [[4 5 6]]
002 | [[4 5 6]]
see?
wheat yew
yep okay i get hta
 lost trail
I want to learn AI to implement in my website
velvet thorn
the one about getting the row vectors
I've shown you the pattern
so that's a good start
you need to do the same thing for columns
velvet thorn
and there I will give you a hint
see this
!e
import numpy as np

a = np.array([[1, 2, 3], [4, 5, 6], [7, 8, 9]])

print(a[:, 1])
@velvet thorn :white_check_mark: Your eval job has completed with return code 0.
[2 5 8]
: in numpy basically means "everything in this dimension"
wheat yew
yep that i know
i actually got the numbers from the 2nd function correctly
but
idk how to stack them lke that
like they want it
velvet thorn
wheat yew
like they want it
it's all about shapes
there are many ways to do it
oh, one last interesting thing
!e
import numpy as np

a = np.array([1])

print(a[:, np.newaxis, np.newaxis, np.newaxis, np.newaxis, np.newaxis])
@velvet thorn :white_check_mark: Your eval job has completed with return code 0.
[[[[[[1]]]]]]
!eval ```python
import numpy as np
x = np.arange(12).reshape((3,4))
print(x)
Using a slice
y = x[1:2]
print(y.shape, y)
Using np.newaxis
Note that np.newaxis is an alias for None
y = x[1][np.newaxis, :]
print(y.shape, y)
Using advanced indexing + slicing
NOTE: you can (and usually should) omit the , : part,
but I included it so you can see what's going on.
y = x[[1], :]
print(y.shape, y)
@desert oar :white_check_mark: Your eval job has completed with return code 0.
001 | [[ 0  1  2  3]
002 |  [ 4  5  6  7]
003 |  [ 8  9 10 11]]
004 | (1, 4) [[4 5 6 7]]
005 | (1, 4) [[4 5 6 7]]
006 | (1, 4) [[4 5 6 7]]
@desert oar do you ever use stride_tricks
desert oar
@wheat yew some light reading for you:
Slicing: https://numpy.org/doc/stable/reference/arrays.indexing.html#basic-slicing-and-indexing
Newaxis: https://numpy.org/doc/stable/user/basics.indexing.html#structural-indexing-tools
Advanced indexing + slicing: https://numpy.org/doc/stable/reference/arrays.indexing.html#combining-advanced-and-basic-indexing
desert oar
velvet thorn
<@!389497659087650836> do you ever use `stride_tricks`
nope, i've never had a need for it (or at least i never thought i did)
velvet thorn
usually you don't but well
it's like einsum
it'll blow your mind
tbh I don't know how einsum works because I never had occasion to use it but if I ever go back to DS/ML I'll defo have to learn
desert oar
yeah it lets you change the stride pattern of the array right? if you need to do something weird like sum every 3rd element
velvet thorn
yeah
velvet thorn
desert oar
yeah it lets you change the stride pattern of the array right? if you need to do...
you can get super weird things from it apparently
I think it's helpful if you want to reimplement convolution (in the ML sense)
like strided convolution
actually IIRC even normal convolution can benefit from reinterpreting the array in a certain way
all right I'm out 😴
desert oar
apparently analytics vidhya moved to medium? https://medium.com/analytics-vidhya/a-thorough-understanding-of-numpy-strides-and-its-application-in-data-processing-e40eab1c82fe
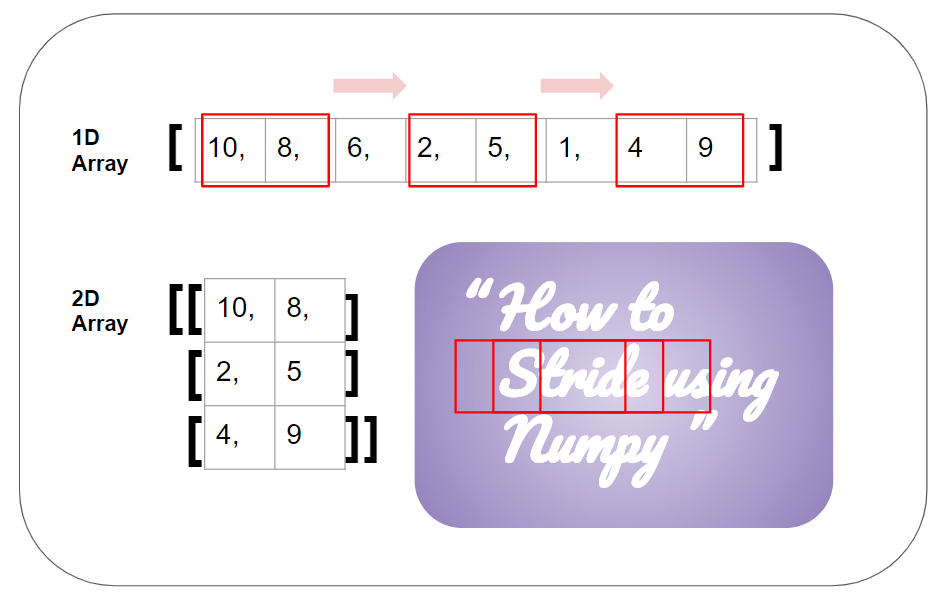
Medium
Striding is like taking steps with a given window size in the data. It is a very common technique which you will see in all kinds of data…
flat hollow
I am using Akaike Information Criterion to determine the best models fitted to data using scipy.optimize.least_squares function. This allows me to use ΔAIC = 2k + n ln(RSS) (from wiki) where RSS is the sum of the residual vectors and n is the number of data points in that vector. The 2*k is meant to punish models for having more parameters (k) than others. My issue is with the numbers I'm getting. While 2*k is 2,4 or 6 in my cases, n* ln(RSS) goes into the negative hundreds or even thousands. How come the punishment for the extra model parameters is so mild? Have I done something wrong? (the AIC numbers do favour the visually best model, it's just weird to me that the 2 parts of the equation give such different values if one is to affect the other meaningfully)
desert oar
flat hollow
I am using Akaike Information Criterion to determine the best models fitted to d...
FWIW the AIC is 2*k + 2*ln(L) where L is the maximum likelihood
flat hollow
desert oar
FWIW the AIC is `2*k + 2*ln(L)` where `L` is the maximum likelihood
yes, but there is a slightly different definition you can get when you're using residuals, it's at the very bottom of the AIC wiki page
desert oar
oh i see you got that from the RSS->Likelihood formula on the wikipedia page
flat hollow
yup
it's the first time I've even heard of AIC, I was asked by supervisor to use it and I'm trying to understand it on an intuitive level (the one thing my physics education taught me)
desert oar
i think a difference in AIC is asymptotically equal to a difference in KL divergences
flat hollow
KL stands for...?
desert oar
so ΔAIC(model1, model2) is an estimate of KL(real-life, model1) - KL(real-life, model2)
Kullback-Leibler divergence, https://en.wikipedia.org/wiki/Kullback–Leibler_divergence
"relative entropy", information theory stuff
flat hollow
first time seeing it, but I understand it's some statistics number that the computer spits out, so that's fine
desert oar
also i think the "ΔAIC" on wikipedia is sloppily notated
flat hollow
yeah it is
difference without a difference, took me a while to understand what it was
desert oar
function ΔAIC(m1,m2)
    aic1 = 2*nparam(m1) + n*ln(rss(m1)
    aic2 = 2*nparam(m2) + n*ln(rss(m2)
    aic1 - aic2
end
the thing is I'm not really using it to get a number as a difference between models, I'm just plotting the ΔAIC values and seeing how they change for the models

 brave owl
has anyone has an idea why is MultinomialNB throwing Value Error when trying to fit data?
desert oar
oh, so you're asking what the k is doing there
yeah it's not doing all that much in a small model
flat hollow
right so it owuld be more visible with 50 variables in something akin to neural netwrok?
desert oar
yes, although good luck computing that likelihood function
acoustic halo
brave owl
has anyone has an idea why is MultinomialNB throwing Value Error when trying to ...
probably because your training data is bad, as in the wrong type
brave owl
acoustic halo
probably because your training data is bad, as in the wrong type
DataFrame?
desert oar
flat hollow
right so it owuld be more visible with 50 variables in something akin to neural ...
a better example would be how in a bayesian model the prior is equivalent to 1 extra observation. so if you have a lot of training data, the prior basically disappears
desert oar
brave owl
has anyone has an idea why is MultinomialNB throwing Value Error when trying to ...
!paste share your code, share a sample of your data that reproduces the error, and post the full error message. see below 👇
arctic wedgeBOT
Pasting large amounts of code
If your code is too long to fit in a codeblock in discord, you can paste your code here:
https://paste.pydis.com/
After pasting your code, save it by clicking the floppy disk icon in the top right, or by typing ctrl + S. After doing that, the URL should change. Copy the URL and post it here so others can see it.
acoustic halo
brave owl
DataFrame?
I would bet one of your columns you are feeding in is non-numerical without knowing anything else
desert oar
otherwise you're forcing people to interrogate you to learn anything @brave owl . this is one step away from "don't ask to ask". the only answer anyone can give to your quesion is "because you did something wrong 🤷♂️ "
or people have to guess like spagoose did
flat hollow
desert oar
a better example would be how in a bayesian model the prior is equivalent to 1 e...
ah okay, unfortunately my statistics is not quite where it should be but I get the idea of setting a value a-priori and then changing it, I suppose I just got scared of ghosts, thanks a lot 🙂
brave owl
desert oar
otherwise you're forcing people to interrogate you to learn anything <@!74080234...
aha ya xD
brave owl
acoustic halo
I would bet one of your columns you are feeding in is non-numerical without know...
It's not, all cols are either int64 or float64
desert oar
and the full error?
brave owl
desert oar
why are you using naive bayes on a regression problem?
also, you should be using a separate LabelEncoder instance for each feature. i'm about to get in a meeting, i'll show you how to do this efficiently afterwards
brave owl
desert oar
why are you using naive bayes on a regression problem?
I'm trying all models 😬
desert oar
well read the error
brave owl
desert oar
also, you should be using a separate `LabelEncoder` instance for each feature. i...
cool
desert oar
it says "unknown label type", it doesn't know wtf to do with this y because it's not a valid type of label for this model
do you even know what naive bayes is?
 sharp harness
https://paste.pythondiscord.com/ejuzezekey.py
I'm running this on google colab and it keeps showing:
ValueError: could not broadcast input array from shape (96,96,3) into shape (96,96) How would I resolve this error?
bronze skiff
it would be incredibly helpful if you told us where that error occured
i.e. the trace
sharp harness
Oh sorry! Line 59
acoustic halo
brave owl
I know I guess
Specifically look up the difference between regression and classification
bronze skiff
no prob!
so your images image = Image.open(path).resize((GENERATE_SQUARE, GENERATE_SQUARE),Image.ANTIALIAS)
are reshaped to (96,96)
brave owl
acoustic halo
Specifically look up the difference between regression and classification
I realised I need to read more,
bronze skiff
but then you want to reshape them to (96,96,3)?
lusty stag
hi I need help with terminology
I was given 3 datasets
I trained my model on 2 datasets and tested on 3rd (70/30 split considering the amount of data)
is this hold out cross validation?
bronze skiff
sharp harness
Oh sorry! Line 59
are you sure you don't want to resize the image as (GEN_SQ, GEN_SQ, IMG_CHANS)?
in the initial image load line
bronze skiff
lusty stag
hi I need help with terminology
I was given 3 datasets
I trained my model on 2 d...
no, that's just very perverse normal train-test loop
whats the purpose of training on two datasets if you're not gonna distinguish either one
sharp harness
bronze skiff
are you sure you don't want to resize the image as `(GEN_SQ, GEN_SQ, IMG_CHANS)`...
when I try doing that, I get TypeError: argument 1 must be sequence of length 2, not 3
lusty stag
oh my datasets are overlapped so I can't cross validate within same data so I want to train on 2 and keep the 3rd to check if I'm overfitting or not
bronze skiff
cross validation is when you use a single dataset split up into multiple folds, in which you train on all folds but one and test on the last fold repeatedly
this gives you an estimator for the generalization error
sharp harness
bronze skiff
is it actually 96x96x3?
the image dimensions vary to begin with, so on that line I'm trying to resize them to 96x96
lusty stag
ok I should reword my question
I have datasets from 3 different users performing 5 different activities
I'm windowing every 500 samples with 50% overlap for feature engineering
if I k-fold cross validate it won't give me the real estimation because of the overlapping
or else what is a better method for validating overlapped data?
ripe forge
reef bone
I'd probably add that it also adds something rather than just multiplying by som...
yeah, that's a good shout, you're right
 rocky hemlock
yes
 fervent vale
Hello, I have a question regarding data augmentation and deep learning. Is there any way to augmentate some training dataset modifying the annotation files simultaneously or should I re-labbel each image for supervised learning ?
limpid oak
please suggest corrections
                                  'humidity_1': '72',
                                  'humidity_2': '40',
                                  'rainfall': '0.0',
                   '2021-07-02': {'cloud_cover': '7',
                                  'humidity_1': '68',
                                  'humidity_2': '37',
                                  'rainfall': '0.0',
                                  'temp_max': '34.7',
                                  'temp_min': '24.2',
                                  'wind_direction': '293',
                                  'wind_speed': '25.0'},
                   '2021-07-03': {'cloud_cover': '7',
                                  'humidity_1': '69',
                                  'humidity_2': '38',
                                  'rainfall': '0.0',
                                  'temp_max': '34.2',
                                  'temp_min': '23.7',
                                  'wind_direction': '288',
                                  'wind_speed': '24.0'},
                   '2021-07-04': {'cloud_cover': '4',
                                  'humidity_1': '70',
                                  'humidity_2': '33',
                                  'rainfall': '0.0',
                                  'temp_max': '35.1',
                                  'temp_min': '23.7',
                                  'wind_direction': '291',
                                  'wind_speed': '24.0'},
                   '2021-07-05': {'cloud_cover': '7',
                                  'humidity_1': '69',
                                  'humidity_2': '33',
                                  'rainfall': '0.0',
                                  'temp_max': '34.5',
                                  'temp_min': '23.9',
                                  'wind_direction': '293',
'wind_speed': '23.0'}}}```code
'humidity_1','humidity_2','wind_speed_ms',
'wind_direction_deg','cloud_cover_octa']

final_data = {a:[dict(zip(row,i[5:])) for i in b] for a, b in itertools.groupby(result, key=lambda x:x[1])}
final_data```current output
{'03991': [{'forecast_date': '2021-08-18',
   'rainfall_mm': '18.1',
   'temp_max_deg_c': '26.1',
   'temp_min_deg_c': '21.7',
   'humidity_1': '93',
   'humidity_2': '86',
   'wind_speed_ms': '14',
   'wind_direction_deg': '294',
   'cloud_cover_octa': '8'},
  {'forecast_date': '2021-08-19',
   'rainfall_mm': '7.3',
   'temp_max_deg_c': '24.3',
   'temp_min_deg_c': '21.3',
   'humidity_1': '92',
   'humidity_2': '86',
   'wind_speed_ms': '17',
   'wind_direction_deg': '293',
   'cloud_cover_octa': '8'},
  {'forecast_date': '2021-08-20',
   'rainfall_mm': '0.9',
   'temp_max_deg_c': '28',
   'temp_min_deg_c': '21',
   'humidity_1': '86',
   'humidity_2': '73',
   'wind_speed_ms': '19',
   'wind_direction_deg': '293',
   'cloud_cover_octa': '8'},
  {'forecast_date': '2021-08-21',
   'rainfall_mm': '0',
   'temp_max_deg_c': '29.1',
   'temp_min_deg_c': '21.8',
   'humidity_1': '81',
   'humidity_2': '70',
   'wind_speed_ms': '14',
   'wind_direction_deg': '293',
   'cloud_cover_octa': '8'},
  {'forecast_date': '2021-08-22',
   'rainfall_mm': '13.8',
   'temp_max_deg_c': '31.4',
   'temp_min_deg_c': '22.5',
   'humidity_1': '91',
   'humidity_2': '62',
   'wind_speed_ms': '9',
   'wind_direction_deg': '295',
   'cloud_cover_octa': '6'}]}
 modern beacon
Hi! I am planning to create an AI in Python using Tensorflow and Keras, that will create a replay with the beatmap as input, based on training data of many replays and beatmaps coresponding to replays. The replay & the beatmap format can easily be converted to CSV or JSON or any other serialization format. I've never played around with AI's, so that's why I am asking it here. Thanks in advance.
 quasi schooner
Quick question. Does Machine learning require external API source or is everything run inside the local environment?
desert oar
quasi schooner
Quick question. Does Machine learning require external API source or is everythi...
usually the latter, or you rent cloud computing time. there are web apis that claim to do machine learning for you, but i don't know if they're any good.
desert oar
limpid oak
```row =['forecast_date','rainfall_mm','temp_max_deg_c','temp_min_deg_c',
'humid...
you want to turn the first snippet into the 2nd? and you are just looking for code review, or something isn't working?
this might be better in a help channel since it's not really specific to data science or ai
 chilly skiff
So I'm trying to iterate through a panda's dataframe as fast as possible. I don't believe vectorization is possible since each operation on each row depends on a state determined by previous rows. Thus, I am simply trying to find the fastest way of iterating through the panda's dataframe via traditional loop.
The fastest method I've come up with is converting necessary columns into lists, and then doing a basic loop and access needed data in each list. That method was 12x faster than panda's iterrows method.
Any suggestions would be appreciated. (Also note this code is simplified for this question, so this is not my completed code)
def strat(df, rsi, sma, close, oversold, overbought):
        owns_stock = False
    for i, row in df.iterrows():
        current_rsi = row[rsi]
        if (current_rsi < oversold and owns_stock == False):   #Buys AAPL stock if rsi checks out and we don't own a stock
            owns_stock = True   #We now own AAPL stock since we bought it
        if (current_rsi > overbought and owns_stock == True):   #Sells AAPL stock if rsi checks out and we own a stock
owns_stock = False #We no longer own AAPL stock since we sold it```@chilly skiff can you post an example of the dataframe as text and the expected output as text?
chilly skiff
This is the dataframe
 serene scaffold
@chilly skiff it must be text with no columns missing
chilly skiff
the output essentially just finds the difference between the price when the stock was bought and sold and just adds it to an Integer. I didn't include that since it is not necessary for my question
ok
ill get that ina sec
serene scaffold
!paste
arctic wedgeBOT
Pasting large amounts of code
If your code is too long to fit in a codeblock in discord, you can paste your code here:
https://paste.pydis.com/
After pasting your code, save it by clicking the floppy disk icon in the top right, or by typing ctrl + S. After doing that, the URL should change. Copy the URL and post it here so others can see it.
serene scaffold
^ use this if it's too large. you do not need to include every row.
serene scaffold
chilly skiff
it is a very very large dataframe. Want me to just take the top 100 rows?
10 would probably be fine.
# not idiomatic
        if (current_rsi < oversold and owns_stock == False):   #Buys AAPL stock if rsi checks out and we don't own a stock
            owns_stock = True   #We now own AAPL stock since we bought it
        if (current_rsi > overbought and owns_stock == True):   #Sells AAPL stock if rsi checks out and we own a stock
            owns_stock = False   #We no longer own AAPL stock since we sold it
# idiomatic
        if current_rsi < oversold and not owns_stock:   #Buys AAPL stock if rsi checks out and we don't own a stock
            owns_stock = True   #We now own AAPL stock since we bought it
        if current_rsi > overbought and owns_stock:   #Sells AAPL stock if rsi checks out and we own a stock
            owns_stock = False   #We no longer own AAPL stock since we sold it
@chilly skiff for future reference, you shouldn't wrap entire conditions in parentheses or do explicit comparisons to True or False.
chilly skiff
Okay thank you. I've primarily used Java and C# so trying to learn python syntax 😅
serene scaffold
No problem
chilly skiff
time
2019-08-16 09:31:00  28.879431  29.024378  28.879431  28.999387  863760  NaN
2019-08-16 09:32:00  28.994389  29.029376  28.944408  29.019380  840588  NaN
2019-08-16 09:33:00  29.014382  29.106848  29.006885  29.065113  560162  NaN
2019-08-16 09:34:00  29.069362  29.084356  29.034375  29.084356  425968  NaN
2019-08-16 09:35:00  29.089354  29.144334  29.084356  29.099351  706160  NaN
2019-08-16 09:36:00  29.104349  29.164327  29.103649  29.144284  322300  NaN
2019-08-16 09:37:00  29.144334  29.149333  29.039373  29.099301  315520  NaN
2019-08-16 09:38:00  29.094303  29.139336  29.059365  29.114345  232524  NaN
2019-08-16 09:39:00  29.114345  29.139336  29.064364  29.089354  342950  NaN
2019-08-16 09:40:00 29.084356 29.103499 29.019380 29.021879 184356 NaN ``` The rsi doesn't show up in console. Not sure why but if you need to see rsi I'll look into itif rsi isn't part of the calculation then it's fine
chilly skiff
Well in that case I'll see why it isn't showing up xD
serene scaffold
can you explain in what way a given iteration depends on a previous iteration?
chilly skiff
ima guess pycharm has a max width
serene scaffold
do print(df.head(10).to_csv()) and paste the result exactly.
chilly skiff
2019-08-16 09:31:00,28.8794313016,29.0243782569,28.8794313016,28.9993874025,863760,,
2019-08-16 09:32:00,28.9943892316,29.0293764277,28.9444075229,29.019380086,840588,,
2019-08-16 09:33:00,29.0143819151,29.1068480763,29.0068846588,29.0651133495,560162,,
2019-08-16 09:34:00,29.0693617947,29.0843563073,29.0343745986,29.0843563073,425968,,
2019-08-16 09:35:00,29.0893544782,29.1443343578,29.0843563073,29.0993508199,706160,,
2019-08-16 09:36:00,29.1043489908,29.1643270413,29.1036492469,29.1442843761,322300,,
2019-08-16 09:37:00,29.1443343578,29.1493325287,29.0393727695,29.0993008382,315520,,
2019-08-16 09:38:00,29.0943026674,29.1393361869,29.059365453,29.1143453326,232524,,
2019-08-16 09:39:00,29.1143453326,29.1393361869,29.0643636238,29.0893544782,342950,,
2019-08-16 09:40:00,29.0843563073,29.1034993018,29.019380086,29.0218791714,184356,,```so the reason why it needs previous iterations is I don't want it to 'buy' a stock multiple times. So essentially I want it to go" buy, sell, buy, sell, buy, sell rather than: buy, buy, sell, sell, selll, buy, sell, buy, buy, sell, sell, sell
thus, whenever it buys, it sets the boolean (owns_stock) to True, meaning it owns the stock
and it won't buy again until it sells
desert oar
it sounds like a dataframe isn't the right datastructure for your project
the best way to iterate over a dataframe is df.itertuples(), which you can do here, and keep the current state in a dict
serene scaffold
so what if we marked every row where you would buy or sell, without context taken into account, and then do a second pass where each "buy" in between a buy and a sell is marked as "hold".
chilly skiff
desert oar
the best way to iterate over a dataframe is `df.itertuples()`, which you can do ...
I believe that method is slower than converting each column into a list. But tbf, I haven't checked the spead of df.itertuples
desert oar
itertuples will be significantly faster than iterrows at any rate
where is the "if we currently own it" logic?
 summer mulch
Im trying to convert object to json
but it's gives me some props with between []
can help please?
 desert oar
stelercus' idea is good if the dataframe isn't big and you can afford to make 2 passes over the data
chilly skiff
serene scaffold
so what if we marked every row where you *would* buy or sell, without context ta...
that would work, I was trying to avoid going through the dataframe twice for speed purposes, but if it would be faster it would be worth it
desert oar
summer mulch
Im trying to convert object to json
but it's gives me some props with between ``...
this isn't a data science question. see #❓|how-to-get-help
@serene scaffold @chilly skiff wouldn't that be impossible because the current state depends on the previous state?
serene scaffold
desert oar
stelercus' idea is good if the dataframe isn't big and you can afford to make 2 ...
T(n) := 2n is still O(n) 
desert oar
afaict you don't know at t+2 if you'll buy or sell until you know the full portfolio at t+1
chilly skiff
desert oar
itertuples will be significantly faster than iterrows at any rate
I know intertuples is faster than itterrows. I converted the columns into lists and got a loop 12x faster than itterrows(). Would itertuples still be faster than the list method I've done you think?
desert oar
no, the lists will be faster
you might want to convert the whole df into a list of dicts
that could be a good balance of ergonomics and efficiency
also run this under pypy if you can deal with python 3.7. looping over a list should be much faster in pypy than cpython (the standard python implementation)
another possibility is to rewrite the "hot" parts of your code in cython
chilly skiff
I converted the entire dataframe into 1 large dict. It was 2x slower than the lists method. I could try seperate dict lists if you think that would be even faster
arctic wedgeBOT
Pasting large amounts of code
If your code is too long to fit in a codeblock in discord, you can paste your code here:
https://paste.pydis.com/
After pasting your code, save it by clicking the floppy disk icon in the top right, or by typing ctrl + S. After doing that, the URL should change. Copy the URL and post it here so others can see it.
chilly skiff
sure, but it might be pretty confusing. If you don't understand it at all I can remove and alter a lot of stuff to make it easier to read
desert oar
that's fine, let's just see what you have
also how big is this dataframe? approx. number of rows is fine
and some sense of: how much faster it needs to be, and how often this has to run
chilly skiff
sorry if the code is messy and/or not properly syntaxed. Still new to python and have messing around with a lot of the code today
chilly skiff
desert oar
also how big is this dataframe? approx. number of rows is fine
the shape of the dataframe is (192668, 7)
oops
sorry
pasted the wrong method in the code
sorry about that
and I'm not looking for an exact speed increase. I just know I'll be doing large computations soon and later down the road, so just trying to do anything I can to make it it compute faster
@desert oar any ideas?
 tired oxide
Is there any difference between tf.math.sqrt(x) and tf.math.pow(x, 0.5)?
Im getting different results when using them as custom activation functions
And I'm really confused about why
 umbral ferry
so let's say I've got all my parameters tuned and I'm happy with my model. now let's say I want to make an actual prediction (not test data), do I just train the model once and then use that as my final model? or do I run it a bunch of times and average the prediction??
I'm just not sure the best way to say "ok, this is my final function I will use to make actual decisions which have stakes and money attached"
 karmic spear
Hi, somebody knows how to change dpi scale of matplotlib? I am showing a plot on android, but everything looks very small, the labels and axes are almost not readeable
I know it's a bit of topic, but matplotlib is used a lot in data science, so this seemed the best fitting channel
flat hollow
karmic spear
Hi, somebody knows how to change dpi scale of matplotlib? I am showing a plot on...
plt.subplots has a dpi keyword, default is 100
you can also change the figsize keyword
karmic spear
Thanks, Will kook into it
flat hollow
karmic spear
Thanks, Will kook into it
I used dpi = 96 res = (1920,1080) with figsize = (res[0]/dpi, res[1]/dpi) on my 1080p monitor and it fills it up nicely
karmic spear
Thanks for the help!
umbral ferry
umbral ferry
so let's say I've got all my parameters tuned and I'm happy with my model. now l...
bump :)
flat hollow
umbral ferry
bump :)
I havent finished a model in a while, but I remember being left with a file that contained my final model which you then should be able to use to do your predictions. Whatever module youre using should allow you to save the model and then predict. From what I understand about models, you train on train data, test on test data and whatever model works best you then save and use. I dont know how people continuously update their models with new data without running into over/underfitting issues.
 mortal dove
Looking for a good academic book(ideally free, but don't mind paying) covering time series analysis. Looking for a book that's more focused on the mathematics and less on the application.
umbral ferry
flat hollow
I havent finished a model in a while, but I remember being left with a file that...
what I'm running into, is that when I run my model over and over on the same data (same test/train split, but randomly sampled each time), my model does slightly better or worse each time, which makes sense. So do I just train it a bunch, and then cherry pick the model that gave me the best test validation score?
flat hollow
ye
umbral ferry
I'm also comparing it to the train score as a measure of overfitting
flat hollow
it's normal to rerun the model a bunch of times to minimise the chance of getting stuck in local minima
umbral ferry
ahh ok
so it's just running it a bunch until you're confident, based on previous experience, that this particular instance isn't in a false minima
flat hollow
last time I remember I had 2 keywords: epoch which was essentially what you're doing - rerunning the entire model and something else that was higher than epoch number and determined how many iterations NN would do before stopping within one epoch
flat hollow
umbral ferry
so it's just running it a bunch until you're confident, based on previous experi...
something like that, if youre using TF or similar the models should allow you to do that automatically, including the choice of best model
umbral ferry
I'm just in Jupyter notebook lol, not sure what TF is (ik it means tensor flow)
flat hollow
umbral ferry
I'm just in Jupyter notebook lol, not sure what TF is (ik it means tensor flow)
The number of epochs is the number of complete passes through the training dataset.``` this is what I was talking about, just found ityeah TF = tensorflow
umbral ferry
I'm doing gradient boosting, I think the terms are slightly different. I think one epoch is one tree
I think epoch, iteration, estimator, tree, all the same thing
flat hollow
ah, this is for gradient descent
umbral ferry
yep
flat hollow
umbral ferry
I'm doing gradient boosting, I think the terms are slightly different. I think o...
https://machinelearningmastery.com/avoid-overfitting-by-early-stopping-with-xgboost-in-python/ you might find this useful
umbral ferry
not quite what I mean, I've found an optimal number of epochs. I'm wondering what I do after I am happy with all my parameters, including # of epochs
flat hollow
right, so I guess just save the model and use to predict
umbral ferry
on a semi unrelated note, I'm not sure what this means, but the distribution of errors from my model is approximately normal, with a mean of 0. So if I take my predicted target variables, subtract the actual ones, and create a bar chart of the errors, it looks like a bell curve centered on 0
so for a large-ish subset of test data, it can predict the average target variable pretty well, which I think makes sense?
lusty stag
which metrics should I look at other than accuracy for 10 class classification? I have balanced dataset and the classes have no correlation
serene scaffold
@lusty stag precision recall F1?
lapis sequoia
A question regarding SVM's. Hard-margin SVM does not allow for errors. So what happens to data points that fall outside of the margin? The reason I'm asking is because soft-margin SVM allows for errors/misclassified instances by using a slack variable which penalizes errors.
velvet thorn
lapis sequoia
A question regarding SVM's. Hard-margin SVM does not allow for errors. So what h...
what do you mean
what happens
assuming the problem is soluble, all points should be outside the margin
do you mean inside?
lapis sequoia
velvet thorn
do you mean inside?
Oh yes I mean inside
velvet thorn
lapis sequoia
Oh yes I mean inside
that’s not possible
velvet thorn
velvet thorn
assuming the problem is soluble, all points should be outside the margin
because of this
it’s a hard margin
if the dataset is not linearly separable
then the optimisation problem is insoluble because its constraints will be unsatisfied
 prime hearth
hello, for machine learning- is it better to drop out a string catergory of names then binary encoding it? Because there are 30 different names for the. people, but they are all unique names and i feel like it not neccesary to include them
umbral ferry
what are you trying to predict? and you're going to be using names as an input feature?
prime hearth
@umbral ferry it is in the dataset
but it seems irrelevant
im trying to predict the loan
given age and name
but name doesnt seem to be important ; for example the names dont contain the title, only the name of person
umbral ferry
you have only age and name as your predictors of loan?
and all the name values are unique?
prime hearth
yes
im using K means clsuter algo
when i dont include names it has high accuracy
but when i include names by converting names using One Hot encoding it comes not as high
umbral ferry
yeah, having a unique value for each entry tells you nothing
 white parrot
I was making a RNN to generate a Trump speech ( for the memes ) and I got
AttributeError: 'Sequential' object has no attribute 'predict_classes'. So I went on Tensorflow's poetry generator and I got the same error. Big confuse yes.

 steel hill
Does anyone know what the cause of a "contour levels must be increasing" error is?
ive tried many solutions online and none of them seem to work
im worried its just becuase of the amount of data im graphing, about 115 million graph points
 late shell
Why is logistic regression considered a classification model when, underneath it's actually a regression algorithm. You just slap a little condition on top of the model (y=1 if p>0.5, else 0), and call it a classification model? WTH.
acoustic halo
@late shell regression and classification are not necessarily mutually exclusive
because, like you said, you can use regression to make classifications
We normally just name them based on their final output
 slender sand

Medium
An Updated Collection of the Best Data Science Books to Read Right Now
at least half the list is statistics books
 inland zephyr
i want to asking again about sigmoid function
i accidentally run this method when get the prediction
            ypred = model.predict(x = testX)
            print(ypred)
            ypred = ypred.argmax(axis=-1)
when my last layer on my cnn is Dense(2,activation='sigmoid') is it okay instead calling np.where.(ypred> 0.5).astype('int32') since sigmoid and softmax has similiar method but softmax has stricter sum must be = 1
and the output from the sigmoid looks like this [[9.9727041e-01 2.3626047e-03] [1.0000000e+00 4.6164155e-20] [9.9998736e-01 1.0490192e-05] [1.0000000e+00 7.2155764e-15] [8.2602571e-19 1.0000000e+00] [4.0638729e-04 9.9959069e-01] [5.7351838e-07 9.9999964e-01] [2.6459084e-05 9.9998164e-01]]
and output after argmax like this:
[0 0 0 0 1 1 1 1]
should be fine or not, since i using model.predict instead the deprecated model.predict_class
acoustic halo
Depends whether you are happy with multiple classifications or not
inland zephyr
actually it should be a binary classification one but i dont know why it returns two output on the predict method
i happy with the result but worry if the class is sweped from 0 or 1 class
acoustic halo
because you have 2 outputs in Dense(2,activation='sigmoid')
inland zephyr
oh because i have two different class, 0 and 1
acoustic halo
yeah but that can be represented by a single number
n<0.5 = class one n>=0.5 = class two
inland zephyr
i just want to play safe to differentiate it, since it's pretty ambiguous if i using np. where ypred
in case when the value is 0.5
so i set strictly to 2 class instead one
acoustic halo
I mean at the end of the day, if the final accuracy works for you, then sure its fine
inland zephyr
the accuracy just fine for me although cannot beat what people do on paper
acoustic halo
argmax and softmax methods would likely have the same end result as well
acoustic halo
inland zephyr
the accuracy just fine for me although cannot beat what people do on paper
Thats likely to be due to something else other than the final activation function
acoustic halo
Thats what I mean
 acoustic forge
Is a box test only relevant for residuals? Or can you use it on your 'original' time series?
 glad aspen