#data-science-and-ml
1 messages · Page 333 of 1
 velvet thorn
 grave frost
it should work if your shapes are correct
 hasty mountain
Nvm, it seems it actually worked. Probably the problem isn't with my X, but with my y and the Value Error simply includes the X when reporting the error.
velvet thorn
hasty mountain
Nvm, it seems it actually worked. Probably the problem isn't with my `X`, but wi...
ye
hasty mountain
Thanks
velvet thorn
yw
 wise citrus
which language besides Python do you recommend me related to ML, AI, Data Science?
velvet thorn
wise citrus
which language besides Python do you recommend me related to ML, AI, Data Scienc...
??
what do you want to do
Python is top
but
C++, Scala, Kotlin, Julia, R, and JS see use in various parts of the ecosystem
wise citrus
Yeah, I'm already working w Python, but idk if there's other language
wise citrus
velvet thorn
C++, Scala, Kotlin, Julia, R, and JS see use in various parts of the ecosystem
Nice
wise citrus
velvet thorn
C++, Scala, Kotlin, Julia, R, and JS see use in various parts of the ecosystem
So I guess that I can complement Python with all of those langauges related to IA, or one in particular?
velvet thorn
wise citrus
So I guess that I can complement Python with all of those langauges related to I...
like I said, it depends
on what you want to do.
e.g.
R is used more for analytics and ML
Scala for data engineering
also
I wouldn't recommend learning 6 languages at once
just get good @ Python first
wise citrus
velvet thorn
on what you want to do.
Something related to ML, CV or similar
velvet thorn
wise citrus
Something related to ML, CV or similar
well
velvet thorn
velvet thorn
C++, Scala, Kotlin, Julia, R, and JS see use in various parts of the ecosystem
I said this
you know what
just get good @ Python first
IMO
you can worry about a 2nd language some other time
and when you do I would suggest a statically typed language
C++/Scala/Java (ew)
 umbral ferry
when you say get good at python what do you mean? so far all I know how to do is use pandas and matplotlib lmao
velvet thorn
umbral ferry
when you say get good at python what do you mean? so far all I know how to do is...
use them well
umbral ferry
how do you know if you're using them well?
as someone who's never taken an actual comp sci or related class, I have no idea what good code looks like lol
velvet thorn
umbral ferry
as someone who's never taken an actual comp sci or related class, I have no idea...
hm
well
okay while code quality is important
I meant more
knowing how to solve a wide range of problems with those libraries
okay, for example
say you have this:
!e
import pandas as pd

print(pd.Series([0, 0, 1, 1, 1, 1, 1, 0, 1, 0, 0, 1, 1, 0, 0, 0, 1, 1, 1]))
 arctic wedgeBOT
@velvet thorn :white_check_mark: Your eval job has completed with return code 0.
001 | 0     0
002 | 1     0
003 | 2     1
004 | 3     1
005 | 4     1
006 | 5     1
007 | 6     1
008 | 7     0
009 | 8     1
010 | 9     0
011 | 10    0
... (truncated - too many lines)
Full output: https://paste.pythondiscord.com/agoticetal.txt?noredirect
velvet thorn
how do you find the length of the longest chain of 1s?
umbral ferry
ig I'd iterate over the rows, make like a new list when ever I see a 1, stop making the list when I see the first 0, then compare list sizes
new list when I see a 0 followed by a 1
 pine wolf
can you think of a way that doesn't require making new lists
umbral ferry
maybe have two lists, one for the previous string, one for the current, if you finish the current and it's longer than the previous, replace the previous with the current
other wise keep previous
pine wolf
how about with 0 lists
umbral ferry
don't tell me there is like a df.longest_run(1) function lol
pine wolf
no idea, but really there's only a single piece of information you need to store while you're iterating
well, i suppose two pieces of information
umbral ferry
the position of the 0s?
velvet thorn
umbral ferry
ig I'd iterate over the rows, make like a new list when ever I see a 1, stop mak...
iteration is generally a sin in pandas
pine wolf
in numpy in general
velvet thorn
that's an example of what I mean
there are many ways to solve problems
but it's important to be able to come up with the idiomatic, efficient ones
umbral ferry
how do you avoid iteration? like how does something like df.sort_values() NOT use iteration?
velvet thorn
umbral ferry
how do you avoid iteration? like how does something like df.sort_values() NOT us...
you avoid explicit iteration
because where possible, pandas (through numpy) will parallelise operations (basically)
you take that capability away from it when you iterate explicitly
umbral ferry
and what ever explicit iteration is, can only be serial?
velvet thorn
umbral ferry
and what ever explicit iteration is, can only be serial?
for ... in ...
umbral ferry
so list comprehensions should be avoided when speed is a concern?
velvet thorn
umbral ferry
so list comprehensions should be avoided when speed is a concern?
it depends on the content of your comprehension
e.g. df[[col for col in df.columns if col.endswith('take_me')]] is fine
because the set of columns is "small" (hopefully)
(and anyway there's no faster method)
there are some times you just have to
that's life
but most of the time you don't
umbral ferry
so how would you solve the posed problem by leveraging pandas?
pine wolf
i don't know of no vectorized way of solving the problem with numpy, is there something specific to pandas?
oh is there a groupby function in numpy
pine wolf
vectorized is the "implicit" loop
velvet thorn
I actually forgot
pine wolf
and i meant i didn't know a way, not that i knew a way
velvet thorn
you need to use shift
pine wolf
you can sort of do it with unique, but it's more complicated than a simple for-loop
velvet thorn
then you compare to the original
and get the greatest distance between two True values
okay maybe that was a bit of a hard one
pine wolf
personally, i'd just use a for-loop because the solution is simple
remember that most things that are vectorizable involve constant striding and this is a variable stride problem
umbral ferry
so do you know these pandas functions parallelize? or do you just know they will be faster or as fast as anything you can come up with?
pine wolf
they're just written in c so you try to avoid the python as much as possible and use the c code
velvet thorn
okay I remember now
!e
import pandas as pd

s = pd.Series([0, 1, 0, 0, 0, 1, 1, 0, 1, 1, 1, 1, 0])

print((s == 0).cumsum()[s == 1].value_counts().max())
@velvet thorn :white_check_mark: Your eval job has completed with return code 0.
4
shift works too but is harder
okay, maybe a bit too hard and not something I would expect
velvet thorn
umbral ferry
so do you know these pandas functions parallelize? or do you just know they will...
faster, because they use different processor functions
@ the lowest level there are instructions that let your processor apply the same operation to multiple pieces of data at the same time, basically
so each operation has to be independent
for example, simple addition
a more appropriate example
umbral ferry
is there a collection of problems like this with solutions for the purpose of practice?
velvet thorn
pd.Series is backed by a np.array
which has a fixed size
you may see this in normal Python:
data = []

for something in something_else:
    processed = do_something_to(something)
    data.append(processed)
and this is okay
but when you use np.append, a new array is created
as a copy of the original
so:
a = np.array([])

for something in something_else:
    processed = do_something_to(something)
    a = np.append(a, processed) # note the reassignment
is Very Bad
pine wolf
In [232]: s = np.array([0, 1, 0, 0, 1, 1, 0, 1, 1, 1, 1, 0])
     ...: uniques, counts = np.unique((s == 0).cumsum(), return_counts=True)
     ...: uniques[np.argmax(counts)]
Out[232]: 4
i converted it to numpy
velvet thorn
because you're creating one (including the original) array that's thrown away for each element in something_else
umbral ferry
why does np.append even exsist then?
well, I suppose this is just how to use it wrong
umbral ferry
I did take an intro to comp. methods class where they emphasized the efficiency of arrays over lists and when to use both, but that's about it
thanks btw, for all the info :)
 glad mulch
why does .corr in pandas not give an option for pvalues
arctic wedgeBOT
@stone grotto Please don't try to ping @everyone or @here. Your message has been removed. If you believe this was a mistake, please let staff know!
 pseudo drift
Does anyone have any experience using the networkx altair library?
The documentation isn't great, and I'm getting a deprecation warning from pandas on the module's draw_networkx function.
|| If anyone has experience, ill write an actual help ticket.||
 tall sail
Hi, I decided, that I want to write a program, that takes an image as input and outputs a terminal theme.
I want to start by extracting colors from the image by correlating the RGB values of the pixels.
Sadly this is an np-hard problem. What are some good approximations?
 slate hollow
hey uh
so you know how if you have a really skewed dataset
an algorithm might look really good accuracy wise but actually be really crap
so how do you make it not do that
 undone flare
SGDClassifier
velvet thorn
slate hollow
hey uh
so you know how if you have a really skewed dataset
an algorithm might lo...
are you asking
how to evaluate?
or how to ameliorate
slate hollow
the latter
slate hollow
yeah
9000 negative's, 100 positive's
well in my case it's actually around 20k negatives lol

bc rn this is what's happening
velvet thorn
slate hollow
9000 negative's, 100 positive's
oversampling and changing class weights
are two common tools
slate hollow
oversampling?
velvet thorn
ye
slate hollow
ok i'll look into that
uh for changing class weights
do i just implement a custom loss function?
velvet thorn
help(model.fit) 😉
 velvet thorn
👋
 desert oar
aha, that makes a lot of sense. i always wondered about that
 slow phoenix
Hello all, I am looking for some assistance on my GUI Handwritten digit prediction. The data being trained on is the MNIST database. Here is the link to my train/test code: https://paste.pythondiscord.com/udebufuqax.py and this is the link to my GUI prediction code: https://paste.pythondiscord.com/wixihageti.rb
The specific function that seems to be the issue is the predict_digit(img) function, which looks like this: ```py
def predict_digit(img):
#resize image to 28x28 pixels
img = img.resize((28,28))
#convert rgb to grayscale
img = img.convert('L')
img = np.array(img)
#reshaping to support our model input and normalizing
img = img.reshape(1,28,28,1)
img = img/255.0
#predicting the class
res = model.predict([img])[0]
return np.argmax(res), max(res)```
also is it possible to get overfitting with a database such as MNIST? and could that be the problem here?
undone flare
~~Code: https://paste.pythondiscord.com/oqurinaxuk.apache~~
~~Output: https://paste.pythondiscord.com/lofofurude.py~~
I don't know why it is not working
 wispy blade
Hello Guys, hope everyone doing great,
I just started Machine Learning with Python Do you have any advice.
Or Can You refer a mentor so I can learn from him/her
 acoustic isle
what are the prerequisite math topics required for ML
Also where can i get started with ML
 split latch
you can try to read the pins. there's some helpful resources to start
acoustic isle
This is useful indeed
Not sure if going to be the best resource tho, but will give it a shot
 sour spindle
well i just reviewed the code and it works properly. its just that my yahoo finance dates where just messed up since some dates where missing.
 unborn glacier
Meaning it is predicting future data?
sour spindle
yes
unborn glacier
Nice! Yeah keep testing, I would definitely try predicting like the next week of data or something and see how the values compare
sour spindle
thanks for the support
 tame cedar
YOOO making chatbots r fun
 sleek iron
virtal enviorment hell
sour spindle
bet
undone flare
if I have 10 classes would 2 x 256 dense layers do fine or it's mostly just trial and error? (CNN)
 inner pebble
Hi everyone, is it possible to use duplicated on a pd.dataframe to test duplication on 3 or more columns?
If yes how and if no how can we test duplication on more than 2 variables (3+) for each line of a dataset?
for info, I googled it and found some solutions around groupby but I m really surprised that it s not possible with duplicated
 barren bison
hi guys
i am new to python and coding in general, i have used c++ in past for one unit and now i am in my final year and i am stuck how to do some task in python
can someone help me
 austere swift
undone flare
if I have 10 classes would 2 x 256 dense layers do fine or it's mostly just tria...
austere swift
undone flare
if I have 10 classes would 2 x 256 dense layers do fine or it's mostly just tria...
if you're saying it's a CNN then there should be some convolutional layers in it as well, or else its just a standard DNN
also its pretty much just educated trial and error
different architectures work for different datasets
undone flare
austere swift
if you're saying it's a CNN then there should be some convolutional layers in it...
yes it has two Conv2D layers
 smoky veldt
Hello guys, how to use SQLite in memory, any good article with example to teach me how, thx
grave frost
undone flare
yes it has two Conv2D layers
what's the shape of the projection from the conv block?
usually you can make a pretty good guess from that
undone flare
grave frost
what's the shape of the projection from the conv block?
(64, 64, 1)
grave frost
undone flare
`(64, 64, 1)`
how many classes?
undone flare
grave frost
how many classes?
10
grave frost
undone flare
10
a single dense layer should do it
but you have to do trial and error
 lapis sequoia
yo so im messing around with the imagedatagenerator, and im wondering, why is it outputing an 8 bit image, when i pass in float images into it
like when I do np.max(X[100]) for example its always like 0.99
but when I do it on the image extracted from the datagen, i get like 230, 240
ive tried putting in a rescale value as well, get the same result
nevermind i have figured it out
desert oar
grave frost
a single dense layer should do it
what rule of thumb are you following for this
btw @undone flare this "successive halving" thing really does a good job, i got more or less the same results as with scikit-optimize BayesSearchCV, but in significantly less time.
it might be really powerful if you use that technique with deep learning, where the "resources" is some combination of the number of epochs and the number of data points. but for that you will have to write it yourself, because scikit-learn doesn't support that use case.
 somber prism
can someone explain me how SVM is a hard classifier ( non scoring ) ,it also scores like logistic regg
grave frost
desert oar
what rule of thumb are you following for this
intuitition ¯_(ツ)_/¯
usually it works for
but 64 -> 32 -> 10 also may work
velvet thorn
somber prism
can someone explain me how SVM is a hard classifier ( non scoring ) ,it also sco...
by default it doesn’t
it gives only a prediction
the score you get is basically by fitting multiple models on different subsets and ensembling them
see the docs
under the probability parameter
somber prism
ok
 shadow birch
Hello guys , I had the question if it is hard to make a multiple time frame software where i can see the charts from tradingview anyone has suggestion 🙂
undone flare
desert oar
btw <@!298841376563527690> this "successive halving" thing really does a good jo...
thanks for the suggestion 👍
 molten hamlet
Does Adam preserves gradient momentum for next fit calls?
 sonic scaffold
Hey so in matplotlib sometimes my plots look messy

Something like this happens how do i spread it or clean it
undone flare
you can make them vertical if you want
sonic scaffold
Oh ya
desert oar
velvet thorn
under the `probability` parameter
somber prism
desert oar
<@!393393798350372876> see also, https://scikit-learn.org/stable/modules/generat...
ok
 desert void
import pandas as pd
import numpy as np
import chart_studio.plotly as py
import cufflinks as cf
import seaborn as sns
import plotly.express as px
%matplotlib inline

# Make Plotly work in your Jupyter Notebook
from plotly.offline import download_plotlyjs, init_notebook_mode, plot, iplot
init_notebook_mode(connected=True)
# Use Plotly locally
cf.go_offline()
it's not displaying iplot
 modest mulch
fucking hell it's so hard to get a good accuracy on real time data compared to test set accuracy
 meager turtle
desert void
```
import pandas as pd
import numpy as np
import chart_studio.plotly as py
impo...
meager turtle
desert void
```
import pandas as pd
import numpy as np
import chart_studio.plotly as py
impo...
I think plotly express is All You Need™️
Cufflinks and go_offline aren't needed anymore afaik
undone flare
@desert oar I tired many CNN models but I can't get it more than 85% this is what I have right now: https://paste.pythondiscord.com/ubahixujul.apache
 modest mulch
undone flare
<@!389497659087650836> I tired many CNN models but I can't get it more than 85% ...
modest mulch
undone flare
<@!389497659087650836> I tired many CNN models but I can't get it more than 85% ...
Maybe it's something to do with the dataset, or could be just a domain problem
undone flare
hmm
unborn glacier
Is this MNIST?
undone flare
unborn glacier
Is this MNIST?

Turkey Ankara Ayrancı Anadolu High School's Sign Language Digits Dataset
unborn glacier
Hmm. It does seem like you should be able to get higher than 85%. Have you tried a lot more epochs?
Most of the code examples do 100 or so
undone flare
model won't improve
loss: 0.2858 - accuracy: 0.9163 - val_loss: 0.5886 - val_accuracy: 0.8232
loss: 0.1133 - accuracy: 0.9727 - val_loss: 0.5401 - val_accuracy: 0.8499
loss: 0.5411 - accuracy: 0.8205 - val_loss: 0.6576 - val_accuracy: 0.8208
loss: 0.5233 - accuracy: 0.8369 - val_loss: 0.6588 - val_accuracy: 0.8111
loss: 0.4792 - accuracy: 0.8454 - val_loss: 0.6088 - val_accuracy: 0.8305
loss: 0.3176 - accuracy: 0.8914 - val_loss: 0.7147 - val_accuracy: 0.8136
loss: 0.3695 - accuracy: 0.8836 - val_loss: 0.5808 - val_accuracy: 0.8160
loss: 0.3193 - accuracy: 0.9030 - val_loss: 0.5555 - val_accuracy: 0.8378
loss: 0.3566 - accuracy: 0.9084 - val_loss: 0.5796 - val_accuracy: 0.8160
loss: 0.0758 - accuracy: 0.9885 - val_loss: 0.5546 - val_accuracy: 0.8571
loss: 0.2685 - accuracy: 0.9309 - val_loss: 0.5798 - val_accuracy: 0.8329
different models score
unborn glacier
Weird
If you post your code on github I'd be interested in looking at it, up to you though
undone flare
tho max epoch that I tried was 50
undone flare
unborn glacier
If you post your code on github I'd be interested in looking at it, up to you th...
I have only kept best two models for now if you want I can undo
unborn glacier
Yeah I don't need to see everything
Just curious why it's not working that well in general
undone flare
@unborn glacier https://paste.pythondiscord.com/jegagavize.apache
desert oar
undone flare
<@!389497659087650836> I tired many CNN models but I can't get it more than 85% ...
interesting, that's not any better than ym SVM
undone flare
yea
should I even bother to use logistic regression for multi class classification?
grave frost
undone flare
<@!304021064483340299> https://paste.pythondiscord.com/jegagavize.apache
clearly overfitting - add regularization
I don't know what adding dropout to maxpooling would do - atleast I hope keras automatically applies it to the conv layer
but most prob you are applying dropout to maxpooling which is perhaps not what you wantedto do
undone flare
grave frost
clearly overfitting - add regularization
how do you know that, can you elaborate please?
grave frost
undone flare
how do you know that, can you elaborate please?
# loss: 0.0758 - accuracy: 0.9885 - val_loss: 0.5546 - val_accuracy: 0.8571
clearly, the accuracy is like 13% ahead of val_acc - or the loss is like 0.48 apart..
grave frost
uh-huh
 sly flicker
Hello guys, we use decision boundaries just for plotting purposes,r right? It doesn't have anything to do with the getting the predictions or anything?
lapis sequoia
Is there a difference between normal log-transformation and log + 1? For example:
-
df2['log_price'] = np.log(df2['price']+1) -
df2['log_price'] = np.log(df2['price'])
 dreamy geode
Hey I have started ML course by Andrew NG but I am afraid that nowadays everyone uses Python and R but he is using octave would that be a problem for me ahead?
desert oar
undone flare
should I even bother to use logistic regression for multi class classification?
You will need to do some data pre-processing like PCA, because you can't rely on the RBF kernel finding good features
But if you want a probability model, PCA + Logistic should give you better calibrated output than the SVM
If you are still working on the sign language problem, I think it might be a good idea to try some outline detection or something like that
I have no idea if that's a standard technique but it seems like a reasonable first pass at feature engineering
What did people use back in the day? Fourier decomposition stuff?
 polar dock
hi yall, is anyone really proficient with airflow? I'm trying to start using it today, not sure how to go about it.
 lusty stag
all these papers published online showing 90%+ accuracy do they use cross validation or test on complete raw data? raw dataset seems more noisy than observed dataset
unborn glacier
undone flare
<@!304021064483340299> https://paste.pythondiscord.com/jegagavize.apache
95+%
Just slapped some more conv layers on there
Also your code didn't have the train test split for some reason, I think you modified it so it doesn't work on a fresh notebook
Epoch 40/100
165/165 [==============================] - 1s 5ms/step - loss: 0.0037 - accuracy: 1.0000 - val_loss: 0.1553 - val_accuracy: 0.9613
Epoch 41/100
165/165 [==============================] - 1s 5ms/step - loss: 0.0029 - accuracy: 1.0000 - val_loss: 0.1380 - val_accuracy: 0.9685
Epoch 42/100
165/165 [==============================] - 1s 5ms/step - loss: 0.0028 - accuracy: 1.0000 - val_loss: 0.1521 - val_accuracy: 0.9540
Over-fitting, but not that's to be expected with such a small dataset
desert oar
polar dock
hi yall, is anyone really proficient with airflow? I'm trying to start using it ...
I'm not proficient at all, but if you state your question more specifically someone can probably help. "Don't ask to ask" as they say
 oblique drum
Would it be possible to label the tone of the voice
as in what mood the client is in
sad, happy, fustrated
then
adapt the voice assistance to the mood
 serene scaffold
oblique drum
Would it be possible to label the tone of the voice
serene scaffold
oblique drum
Would it be possible to label the tone of the voice
Yes, if you had enough training data
@oblique drum this article appears to discuss it https://towardsdatascience.com/speech-emotion-recognition-with-convolution-neural-network-1e6bb7130ce3

Medium
Recognizing Human Emotion from Audio Recording
 little compass
Hey everybody:) Anyway, I am an ML engineer that occasionally makes videos on intermediate/advanced ML+DL topics. The channel is very coding heavy and I try to implement everything from "scratch". I hope some of you could find it helpful!

YouTube
Creating educational content with a focus on Machine Learning, Deep Learning and Python.
If you have any video suggestions or you just wanna chat feel free to join the discord server: https://discord.gg/a8Va9tZsG5
grave frost
unborn glacier
```
Epoch 40/100
165/165 [==============================] - 1s 5ms/step - loss: ...
tried it on the test set? I daresay it won't work well
unborn glacier
What test set?
Only had 2 files in it form the website, I did 80:20 split train-valid
grave frost
unborn glacier
Only had 2 files in it form the website, I did 80:20 split train-valid
has a test set too https://www.kaggle.com/datamunge/sign-language-mnist
if that's what OP is doing
 iron basalt
Important: After testing on the test set you can no longer modify the model without getting a new dataset.
The test set is like a final exam.
It needs to not be part of the model iteration loop.
 blissful nymph
for pytorch i keep on getting
CUDA error: CUBLAS_STATUS_ALLOC_FAILED when calling `cublasCreate(handle)`
and googling it tells me to run CUDA_LAUNCH_BLOCKING=1
How would i do this on jupyter notebook? the program is quite large and it will be very tedious and messy to move it to a single file
 balmy junco
Anybody familiar with scipy for python? I'm trying to apply a survival function (sf) on a 3d numpy array (3d image). I don't want to flatten it, and I don't want to include the nans in the calculation, but I want to keep them as nan.
desert oar
balmy junco
Anybody familiar with scipy for python? I'm trying to apply a survival function ...
Do you want to apply it separately to each color channel of the image?
Can you give a small example array and explain how you want to apply the output?
I assume you are talking about the sf method of a scipy random variable
balmy junco
oh lol looks like you saw it @desert oar
so let's say we had a numpy array like
[[[np.nan 2 3] [2 3 np.nan] [5 9 1]]
 [[np.nan np.nan 5] [3 5 6] [1 1 1]]
[[0 4 3] [2 3 7] [9 np.nan np.nan]]]```I completely made this up but
It doesn't seem that .sf will accept a numpy array of these dimensions
I am able to filter it out and get the non-nans with arr[~np.isnan(arr)] but that's 1d
or maybe it is related to the fact that i fitted it with a 1d array
but i dont think thats the case
desert oar
you might need to just ravel, mask, apply, unmask, unravel
or swap the mask/ravel order, same thing
i'm surprised it only accepts 1d input
wait..
@balmy junco it works fine:
In [4]: import numpy as np
   ...: import scipy.stats
   ...:
   ...: y = np.array([
   ...:     [[np.nan, 2, 3], [2, 3, np.nan], [5, 9, 1]],
   ...:     [[np.nan, np.nan, 5], [3, 5, 6], [1, 1, 1]],
   ...:     [[0, 4, 3], [2, 3, 7], [9, np.nan, np.nan]]
   ...: ])
   ...:
   ...: dist = scipy.stats.expon(10)
   ...:
   ...:

In [5]: dist.sf(y)
Out[5]:
array([[[nan,  1.,  1.],
        [ 1.,  1., nan],
        [ 1.,  1.,  1.]],

       [[nan, nan,  1.],
        [ 1.,  1.,  1.],
        [ 1.,  1.,  1.]],

       [[ 1.,  1.,  1.],
        [ 1.,  1.,  1.],
        [ 1., nan, nan]]])
it worked?
desert oar
is that not what you expected?
 gilded quiver
balmy junco
Anybody familiar with scipy for python? I'm trying to apply a survival function ...
gilded quiver
balmy junco
Anybody familiar with scipy for python? I'm trying to apply a survival function ...
Try check the the documentation of the scipy functions, there is a parameter that you can use to specify how to handle nan values
desert oar
what were you expecting?
In [6]: import numpy as np
   ...: import scipy.stats
   ...:
   ...: y = np.array([
   ...:     [[np.nan, 2, 3], [2, 3, np.nan], [5, 9, 1]],
   ...:     [[np.nan, np.nan, 5], [3, 5, 6], [1, 1, 1]],
   ...:     [[0, 4, 3], [2, 3, 7], [9, np.nan, np.nan]]
   ...: ])
   ...:
   ...: dist = scipy.stats.expon(1)
   ...:

In [7]: dist.sf(y)
Out[7]:
array([[[           nan, 3.67879441e-01, 1.35335283e-01],
        [3.67879441e-01, 1.35335283e-01,            nan],
        [1.83156389e-02, 3.35462628e-04, 1.00000000e+00]],

       [[           nan,            nan, 1.83156389e-02],
        [1.35335283e-01, 1.83156389e-02, 6.73794700e-03],
        [1.00000000e+00, 1.00000000e+00, 1.00000000e+00]],

       [[1.00000000e+00, 4.97870684e-02, 1.35335283e-01],
        [3.67879441e-01, 1.35335283e-01, 2.47875218e-03],
        [3.35462628e-04,            nan,            nan]]])
i just got a syntax error but keep in mind i fitted it to a flattened numpy array without the nans (not sure if they affect the fit?). i can show you
arctic wedgeBOT
Pasting large amounts of code
If your code is too long to fit in a codeblock in discord, you can paste your code here:
https://paste.pydis.com/
After pasting your code, save it by clicking the floppy disk icon in the top right, or by typing ctrl + S. After doing that, the URL should change. Copy the URL and post it here so others can see it.
balmy junco
gilded quiver
Try check the the documentation of the scipy functions, there is a parameter tha...
for the sf? i passed 3 params
ill show you
actually i might be able to show it here bc i wont need ot put that much to show
arr = np.round(np.array(full_arr).flatten())
arr = arr[~np.isnan(arr)]

dist = gumbel_r()
params = dist.fit(data)

sf = gumbel_r.sf(full_arr[~np.isnan(full_arr)], *params)
what is apply_fit?
balmy junco
<nibabel.arrayproxy.ArrayProxy object at ...>
The difference won't be relevant
I can always do np.array(nifti.dataobj)
the result is the same
balmy junco
gilded quiver
Try check the the documentation of the scipy functions, there is a parameter tha...
i think that might be what im mising
@desert oar i tried just passing my array in and i got all nans
desert oar
@balmy junco ```python
import numpy as np
import pandas as pd
import scipy.stats
y = np.array([
[[np.nan, 2, 3], [2, 3, np.nan], [5, 9, 1]],
[[np.nan, np.nan, 5], [3, 5, 6], [1, 1, 1]],
[[0, 4, 3], [2, 3, 7], [9, np.nan, np.nan]]
])
def nonnull1d(x):
return x[pd.notnull(x)]
dist_cls = scipy.stats.gumbel_r
params = dist_cls.fit(nonnull1d(y.ravel()))
dist = dist_cls(*params)
print( dist.sf(y) )
```ipython
In [19]: %run sf.py
[[[       nan 0.7138246  0.52351747]
  [0.7138246  0.52351747        nan]
  [0.22914799 0.03156846 0.87895537]]

 [[       nan        nan 0.22914799]
  [0.52351747 0.22914799 0.14290545]
  [0.87895537 0.87895537 0.87895537]]

 [[0.97166877 0.35547717 0.52351747]
  [0.7138246  0.52351747 0.0873199 ]
  [0.03156846        nan        nan]]]
i used pd.notnull but you can use ~np.isnan too
same result
balmy junco
hm ill give that a shot
looks like it might be what im looking for
Hm not sure why it doesn't seem to be working
It certainly must relate to how mine is handling nans
oh wait
nvm no luck
creating np.array from the nifti.dataobj and seeing if that makes a difference
desert oar
can you provide a minimal example that reproduces the problem? it's very likely that this thing that is "basically" a numpy array is not in fact a numpy array and does not behave like a numpy array
balmy junco
well i made it into a numpy array but same result
these nifti files are really big
hmm
how about i backtrack
ill try to get it to work on the np array above
and see if i can get that to work
i copied your example, and your example worked interestingly
@desert oar apparently i was being super foolish. sorry about that. you helped me
since the images are sooooo big, I thought it was all nan
But actually the outer portion was nan
I filtered down the result
to the nonnans and it was actually good
thank you
desert oar
balmy junco
<@!389497659087650836> apparently i was being super foolish. sorry about that. y...
you are welcome! in the future it really helps if you can provide a minimal example that demonstrates the problem, otherwise you force people to guess a lot
this might be why your question went unanswered for a long time - it wasn't answerable in its original form
balmy junco
desert oar
you are welcome! in the future it really helps if you can provide a minimal exam...
good point. ill improve upon that in the future
thanks again
 snow narwhal
Apparently torch==1.0.1 isn't showing up from versions: ERROR: Could not find a version that satisfies the requirement torch===1.0.1 (from versions: 0.1.2, 0.1.2.post1, 0.1.2.post2, 1.4.0, 1.4.0+cpu, 1.4.0+cu100, 1.4.0+cu92, 1.5.0, 1.5.0+cpu, 1.5.0+cu101, 1.5.0+cu92, 1.5.1, 1.5.1+cpu, 1.5.1+cu101, 1.5.1+cu92, 1.6.0, 1.6.0+cpu, 1.6.0+cu101, 1.6.0+cu92, 1.7.0, 1.7.0+cpu, 1.7.0+cu101, 1.7.0+cu110, 1.7.0+cu92, 1.7.1, 1.7.1+cpu, 1.7.1+cu101, 1.7.1+cu110, 1.7.1+cu92, 1.7.1+rocm3.7, 1.7.1+rocm3.8, 1.8.0, 1.8.0+cpu, 1.8.0+cu101, 1.8.0+cu111, 1.8.0+rocm3.10, 1.8.0+rocm4.0.1, 1.8.1, 1.8.1+cpu, 1.8.1+cu101, 1.8.1+cu102, 1.8.1+cu111, 1.8.1+rocm3.10, 1.8.1+rocm4.0.1, 1.9.0, 1.9.0+cpu, 1.9.0+cu102, 1.9.0+cu111, 1.9.0+rocm4.0.1, 1.9.0+rocm4.1, 1.9.0+rocm4.2) ERROR: No matching distribution found for torch===1.0.1. Does anyone know how to resolve this?
undone flare
unborn glacier
Also your code didn't have the train test split for some reason, I think you mod...
I would have forgot to copy paste lol
undone flare
unborn glacier
Just slapped some more conv layers on there
Also how would you know how many conv layers you need?
undone flare
desert oar
If you are still working on the sign language problem, I think it might be a goo...
Oh
unborn glacier
undone flare
Also how would you know how many conv layers you need?
I just kept adding them until the score was highest 😆
undone flare
unborn glacier
I just kept adding them until the score was highest 😆
lol, also were you always a helper or I am just going crazy?
unborn glacier
Nah got my role today haha
undone flare
Congrats
unborn glacier
Thanks!
undone flare
@unborn glacier are you sure the code you changed isn't overfitting?
unborn glacier
I'm sure it IS overfitting, but the 95% is on brand new data, and I just care that it gives good results on the validation/test data
Basically if you give an NN a small dataset, that NN will look for the simplest, most completely arbitrary way to solve the problem, often just memorizing the answers, which is the bad king of overfitting. But if the NN is designed to simulate a reasonable approach (like CNNs), then when it fits it will be more likely to be able to generalize those results, which is the okay kind of overfitting
The only way to solve that is by getting more data
undone flare
Should I prefer overfitted model if it gives me better test accuracy?
unborn glacier
Yes
Even if it gets 100% accuracy on train, improving the loss can make it more likely to pick good answers on the test data
 jaunty moth
it runs and get close automatically after running
 unborn glacier
jaunty moth
it runs and get close automatically after running
unborn glacier
jaunty moth
it runs and get close automatically after running
Looks like a general python question? You can grab a channel in the available help channels section
jaunty moth
unborn glacier
Looks like a general python question? You can grab a channel in the available he...
where i ask this question
undone flare
what's the best monitor for early stopping in this case? val_accuracy?
unborn glacier
Currently help-mango, help-cherries, help-orange are open, though that will change. It's on the sidebar under available help channels
unborn glacier
undone flare
what's the best monitor for early stopping in this case? val_accuracy?
Usually people wait until the val_acc starts to get worse, then revert back to the model where it was the best
Though often it just plateaus at a certain point and stays there, so that's fine as well
Like mine stayed at ~95% for dozens of epochs, and probably would continue like that indefinitely
undone flare
yea, thanks for the help
 pastel valley
yo how to start with machine learning like image processing and nlp?
unborn glacier
pastel valley
yo how to start with machine learning like image processing and nlp?
Lots of ways. There are tools that can apply machine learning with no code, there are libraries like keras that let you easily implement ML without writing all the code by hand, and you could also write something from scratch
Many people suggest learning the math and advanced techniques involved, but you certainly don't have to if you just want to mess around with it
pastel valley
i have a thesis idea and i need image processing or nlp for it
i just dont know where to start hahaha
or how to start
like the knowledge needed for it
unborn glacier
Why is it either or? They are fairly different
unborn glacier
Ah okay
pastel valley
do i need so much math with it ? am kind of suck at math
unborn glacier
It's more about the math theory than the math. Like vector spaces and matrices
I couldn't to matrix math by hand to save my life, but I know the purpose of it in machine learning
pastel valley
i hope i can learn it on youtube hehe
undone flare
ye
unborn glacier
Yeah there are a million tutorials
pastel valley
also do i need a good hardware for ml?
unborn glacier
No, you can use virtual machines online
pastel valley
what site?
unborn glacier
Google Colab, AWS, Google Cloud
unborn glacier
They used to give away like $100 in VM credits when you sign up, not sure if that's still true
pastel valley
if my idea got rejected illl ask for ideas in this server is it good or bad?
undone flare
unborn glacier
They used to give away like $100 in VM credits when you sign up, not sure if tha...
needs credit card I think
pastel valley
oh i dont have card
undone flare
pastel valley
if my idea got rejected illl ask for ideas in this server is it good or bad?
asking for projects? sure
pastel valley
undone flare
asking for projects? sure
i wont get kicked ? nicenice
undone flare
pastel valley
oh i dont have card
google colab and kaggle provide for free tho they have quota
undone flare
pastel valley
i wont get kicked ? nicenice
no
unborn glacier
Unless they are NSFW you can ask for advice about projects
undone flare
asking for project ideas is fine
pastel valley
undone flare
google colab and kaggle provide for free tho they have quota
right right noted sir 😅 👍
undone flare
like if I try to do this image classification task on my cpu it's just too loud haha
 chilly geyser
unborn glacier
They used to give away like $100 in VM credits when you sign up, not sure if tha...
chilly geyser
unborn glacier
They used to give away like $100 in VM credits when you sign up, not sure if tha...
They still do, but I don't recommend signing for the credits until you know what you are doing
If you don't need a GPU, then Oracle Cloud also provides a perma-free compute
Although I don't think anyone has been able to get their really good free computes
pastel valley
to make a ml project accurate the maths should be on point is it true?
undone flare
you are not going to implement all the math
pastel valley
do you have some recommendation on youtube or free online course for ml?
unborn glacier
You go to a university @pastel valley ?
pastel valley
unborn glacier
You go to a university <@!694276264273641483> ?
yeah
but they dont teach us that
unborn glacier
See if they have Udemy courses and/or the o'reilly books for free
Sometimes they'll pay for a subscription for all the students
And there are some really good udemy courses
pastel valley
udemy is kind of a good site for online courses?
unborn glacier
I'd say so, I learned NLP that way
pastel valley
nicen ice thank you again
unborn glacier
But the courses are really expensive if you have to pay for them, so it would only really make sense if your university pays for them
pastel valley
how can i know ?
unborn glacier
If you are just learning for a thesis especially
pastel valley
do i use my uni email?
unborn glacier
Usually there is some website through the library portal that has a special link
You could ask a librarian or professor
At your school
pastel valley
i see thank you again hehe
unborn glacier
Otherwise there are lots of youtube tutorials, but I haven't used any myself so I can't make a specific recommendation
Basically see what the end result of the tutorial is (like what they end up building) see if it's the right level of difficulty, and if you are happy with both of those things then try it out
 late shell
Hey, I have an image dataset of about 20k photos. Does anyone know how can I calculate the correlation of pixels and then visualize them??
velvet thorn
late shell
Hey, I have an image dataset of about 20k photos. Does anyone know how can I cal...
...correlation of pixels...?
what do you mean
late shell
 late shell
velvet thorn
...correlation of pixels...?
late shell
velvet thorn
...correlation of pixels...?
how does each pixel relate to the same pixel in other pictures...ig
late shell
late shell
I've an assignment which requires to perform EDA on X-ray images and I came across this on stackexchange. I thought I could do this on my dataset as well. Not sure how though, as I've never worked with image data before
iron basalt
Computing the correlation of pixels is pretty pointless. What matters is their correlation with the latent variables that cause them to take the values that they have.
 gusty frost
I'm asking if I want to be a Data Scientist. What should I learn after I learn python?
 toxic pier
Hello, it is a fine channel to ask for suggestions about a beginner project i would like to start? (sorry, i know my english is terrible)
iron basalt
gusty frost
I'm asking if I want to be a Data Scientist. What should I learn after I learn p...
See pins.
undone flare
toxic pier
Hello, it is a fine channel to ask for suggestions about a beginner project i w...
project related to data science?
gusty frost
toxic pier
Hello, it is a fine channel to ask for suggestions about a beginner project i w...
If it's not related you can try this https://careerkarma.com/blog/python-projects-beginners/
Career Karma
If you’re just starting out with learning Python, these creative projects for beginners can help you develop your skills while having fun!
toxic pier
Thanks for your reply guys. I would like to start a small beginner project in python related to fluid mechanics, do you have any suggestion? Thanks YOSH i will sure look in to it!
again, if i'm posting in the wrong channel i ask sorry in advance!
undone flare
@toxic pier if this is not related to data science ask in #python-discussion
toxic pier
a project about data related to fluid mechanics would also do the job for me!
undone flare
oh
toxic pier
sorry my bad english does not let me explane well enough. I would be happy to start a beginner project even in data analysis, the one thing i would love is to be related to fluid mechanics in some way just because it is the field i wanna explore
undone flare
not that I am aware of any dataset related to fluid mechanics but you can try searching for it on kaggle
toxic pier
oh i didnt know about it
undone flare
@unborn glacier managed to get loss: 0.0494 - accuracy: 0.9891 - val_loss: 0.1782 - val_accuracy: 0.9540 (sorry for the ping)
 grave frost
toxic pier
sorry my bad english does not let me explane well enough. I would be happy to st...
grave frost
toxic pier
sorry my bad english does not let me explane well enough. I would be happy to st...
you can search for relevant datasets here https://datasetsearch.research.google.com/
 severe minnow
Hello! I just joined this server and wanted to ask if someone has experience with the python library simply called "Chess" or "python-chess"? (I am not really good at coding but this is just a fun project):
https://python-chess.readthedocs.io/en/latest/
Really looking for help with implementation of SIMPLE computer ai (maybe depth of 1 or 2) and board value evaluation.
Any help or comments on my code so far would suffice :))
serene scaffold
severe minnow
Hello! I just joined this server and wanted to ask if someone has experience wit...
how much progress have you made?

 undone flare
@hexed ibex tf.compat.v1.reset_default_graph()
 hexed ibex
okey i am trying
@undone flare
session = tf.InteractiveSession()
AttributeError: module 'tensorflow' has no attribute 'InteractiveSession'```tf.compat.v1.InteractiveSession()
hexed ibex
 undone flare
if I get these types of error I usually search on google with "interactive session tensorflow"
hexed ibex
Traceback (most recent call last):
  File "C:\Users\sezer\Desktop\AIChatbot-master\Source Code\chatbot.py", line 319, in <module>
    inputs, targets, lr, keep_prob = model_inputs()
  File "C:\Users\sezer\Desktop\AIChatbot-master\Source Code\chatbot.py", line 158, in model_inputs
    inputs=tf.placeholder(tf.int32,[None,None],name="inputs")
AttributeError: module 'tensorflow' has no attribute 'placeholder'```everything is not just tf.placeholder
hexed ibex
undone flare
everything is not just tf.placeholder
should i add compat.v1
undone flare
yes
hexed ibex
undone flare
yes
inputs, targets, lr, keep_prob = compat.v1.model_inputs() like that?
undone flare
are you by any chance using v1 code in v2
hexed ibex
undone flare
are you by any chance using v1 code in v2
oh no
inputs, targets, lr, keep_prob = tf.compat.v1.model_inputs()
NameError: name 'compat' is not defined
but..
undone flare
I don't know what model_inputs() is
hexed ibex
okey
undone flare
try tf.compat.v1.model_inputs()
if model_inputs is even a thing
what are you trying to do
@hexed ibex https://www.tensorflow.org/guide/upgrade
hexed ibex
undone flare
what are you trying to do
i mean what you say
undone flare
no do you have tensorflow v1 code?
hexed ibex
undone flare
no do you have tensorflow v1 code?
no
 zealous ermine
What projects do you guys do to like learn stuff? Got a friend who wants to do a data science project, and I can’t think of a good suggestion
I feel that stuff like making a bot, protocol stuff, websites, etc doesn’t really fall into data science as a category
desert oar
zealous ermine
What projects do you guys do to like learn stuff? Got a friend who wants to do a...
Hard to go wrong with kaggle to get started
It depends on the domain they're interested in
Coming up with your own project can be hard, but it can't hurt to just grab any data set you can get your hands on and start analyzing
hexed ibex
i need help
zealous ermine
What would be some examples of domains in data science?
desert oar
zealous ermine
I feel that stuff like making a bot, protocol stuff, websites, etc doesn’t reall...
I agree this doesn't fall into that category unless they are specifically building around around some data science work they already did
desert oar
zealous ermine
What would be some examples of domains in data science?
Like real world problem domains, things you can apply data science to. Social science, image/text/audio/video machine learning, basically anything where you can get data
It depends also if they want to do "machine learning" specifically or if they are just wanting to work with data
zealous ermine
desert oar
Like real world problem domains, things you can apply data science to. Social sc...
Huh ok ig that makes sense
zealous ermine
desert oar
It depends also if they want to do "machine learning" specifically or if they ar...
I’ll forward this stuff on to them and see what they say
Thanks for the advice 🙂
 desert oar
I'm sure if they hunt around the Internet for data science project ideas they will find no shortage of interesting suggestions
hexed ibex
i can't fix it
severe minnow
serene scaffold
how much progress have you made?
Hey! I've come far enough to be able to play a full game of chess, but the computer only make randomly generated moves and will capture a piece every time possible (it's a start lol). Also the game ends whens someone is checkmated. I already have a table of piece value and board square value for each piece, but don't know how to implement it.
serene scaffold
severe minnow
Hey! I've come far enough to be able to play a full game of chess, but the compu...
Hmm, I'm not super familiar with game theory
hexed ibex
hexed ibex
can you help me
serene scaffold
except that I know the game map of chess is insanely large
serene scaffold
hexed ibex
you're more likely to get help when you provide the error message as text so that people can google parts of it.
undone flare
hexed ibex
tf.compat.v1.placeholder
I would recommend when you get some sort of error like attribute not found, documentation helps
serene scaffold
 ashen sable
how can i make a ai text generator
ashen sable
how can i make a ai text generator
Depends on how realistic you want the responses to sound and what sorts of topics it's supposed to know about
umbral ferry
you can just make it respond to everything with "cheese" 5 times
ashen sable
serene scaffold
Depends on how realistic you want the responses to sound and what sorts of topic...
yk kinda like a google assistant
serene scaffold
ashen sable
yk kinda like a google assistant
That would be pretty ambitious
ashen sable
serene scaffold
That would be pretty ambitious
dunno i've been struggling with it
thought of using gpt-2 but quickly realised its not open source
serene scaffold
It's also computationally expensive. But gpt isn't for things like voice assistants
ashen sable
its like i convert speech to text then process the text then send back the text
as speech
serene scaffold
If it's a voice assistant, try to isolate what things the voice assistant should fo
Do*
 copper hatch
ashen sable
how can i make a ai text generator
copper hatch
ashen sable
how can i make a ai text generator
You can check out Rasa for that 🙂
ashen sable
copper hatch
You can check out Rasa for that 🙂
thanks i am checking it rn
copper hatch
Used that a couple of times! They have an open source portion that's more than capable of building larger bots. It'll even do the training for you and you can connect databases etc via simple Python functions. Can recommend it enough 😉
ashen sable
copper hatch
Used that a couple of times! They have an open source portion that's more than c...
damn thats great i read the installation doing it right away tysm !
 hardy hornet
anyone know why x.shape = (3,) while output has only 1 row

i think x.shape should be (1,3)
 verbal lily
Rows and columns don't apply in one-dimensional arrays
serene scaffold
What you have is a vector, not to be confused with a row vector.
 fading cobalt
just had an idea for an ai: ai that learns to play mini motorways
I'd like to try but I'm not sure where to start
serene scaffold
fading cobalt
just had an idea for an ai: ai that learns to play mini motorways
Is that game realtime or turn based?
fading cobalt
realtime but you can pause and make your moves
hexed ibex
 fading cobalt
hexed ibex
fading cobalt
hexed ibex
Do pip install pyaudio?
hexed ibex
fading cobalt
Do pip install pyaudio?
yes but it didn't work, first I downloaded pipwin and then installed it with pipwin
lusty stag
should I include my validation set in my final (production) model?
it's 60/20/20 now I think model will get a little bit more accuracy if it trains on 80%
 barren vortex
lusty stag
it's 60/20/20 now I think model will get a little bit more accuracy if it trains...
barren vortex
lusty stag
it's 60/20/20 now I think model will get a little bit more accuracy if it trains...
if it is above 80% is a good model just make sure that you're not making overfitting
lusty stag
okay thanks
grave frost
lusty stag
it's 60/20/20 now I think model will get a little bit more accuracy if it trains...
80/10/10 split if much better imo
and you should ensure test accuracy is above 95%+ for production
iron basalt
severe minnow
Hello! I just joined this server and wanted to ask if someone has experience wit...
Minimax algorithm with alpha-beta pruning (the alpha-beta pruning is an optimization added later (but it's a huge performance gain)) .
 pearl tundra
grave frost
80/10/10 split if much better imo
pearl tundra
grave frost
80/10/10 split if much better imo
Yeah, I think this split is more common
 snow stag
anyone knows anything about linear discriminant analysis?
 hollow lagoon
df['HS and Up'] = np.where(df['Education'].astype('string') == "HS-grad", True, False)
Question: how can i compare a series ( column ) with a string
iv tried astype(str) also but it doesnt seem to work.
 native patrol
do you get an error running it? - it should work
hollow lagoon
it works but it makes no sense
becuase in that column there are HS-grad and Bachelors and so on
but when i do df[ hs and up].value_counts() i get all False

False    32561
Name: HS and Up, dtype: int64
i tried str.lower() also with hs-grad and nother worked
i also did this
df['MoreThan50k'] = np.where(df['Annual Income']> 50000, True, False)
with the outcome of
True     30289
False     2272
Name: MoreThan50k, dtype: int64
screenshots are probably not the best way to debug this
can you check the individual elements?
try running print(repr(df.loc[2, 'Education'])) : 2 hopefully being the index (based on the screenshot) where you see HS-grad just to check for extraneous spaces etc.
native patrol
yup - see the starting space? that's causing it to not match
hollow lagoon
are you serious, iv been telling myself to strip it for like 2 hours but thought it was something else
native patrol
df['Education'].astype('string').str.strip() == "HS-grad" should fix it
hollow lagoon
so str.lower().strip() should work?
native patrol
.str.lower().str.strip()
native patrol
np -- with pandas, display can be misleading specially related to spaces
so it's a bit confusing to debug when everything visually looks ok
hollow lagoon
Yea
im gonna do it and be back for resuts
results
False    22060
True     10501
It worked, thanks so much
native patrol
btw you don't need np.where here
df['Education'].astype('string').str.strip() == "HS-grad" this already returns bools
same with np.where(df['Annual Income']> 50000, True, False) - just df['Annual Income'] > 50000 is sufficient
hollow lagoon
that makes sense, but if i wanted more than one condition then i must use that correct
?
hollow lagoon
native patrol
screenshots are probably not the best way to debug this
can you check the indivi...
Could you elaborate on what exactly this piece of code does ?
hollow lagoon
hollow lagoon
that makes sense, but if i wanted more than one condition then i must use that c...
df['MoreThan50k'] = df['Annual Income'] > 50000 and df['Education'].str.lower().str.strip()
OUTPUT
The truth value of a Series is ambiguous. Use a.empty, a.bool(), a.item(), a.any() or a.all().
not necessarily, you could do something like
(df['Education'] == 'HS-grad') & (df['Amount'] > 50000)
you need & instead of and for chaining those conditional expressions in pandas
pandas overrides the bitwise operators for this purpose
hollow lagoon
i know, i just tried and to make sure it wasnt that.
native patrol
i.e. | for or, & for and and ~ for not
hollow lagoon
native patrol
not necessarily, you could do something like
```py
(df['Education'] == 'HS-grad'...
Sorry i dont understand the syntax here there is an extra right loding square bracket
closing *
native patrol
thanks! fixed
hollow lagoon
ok i will explore and come back
native patrol
hollow lagoon
Could you elaborate on what exactly this piece of code does ?
this one just prints the repr of the string
df.loc[2, 'Education'] indexes the "cell" at index-2 and "Education" column - returning the value of that "cell"
hollow lagoon
df['MoreThan50k'] = (df['Annual Income'] > 50000) & (df['Education'].str.lower().str.strip() == 'hs-grad')
``` this worksbut i like pandas
just started learning data analysis
cool things
serene scaffold
@native patrol nice role color 
hollow lagoon
how do i do multiple like code in python ?
df['MoreThan50k'] = (df['Annual Income'] > 50000) & (df['Education'].str.lower().str.strip() == 'some-college') | (df['Education'].str.lower().str.strip() == 'bachelors') | (df['Education'].str.lower().str.strip() == 'masters') | (df['Education'].str.lower().str.strip() == 'doctorate') | (df['Education'].str.lower().str.strip() == 'hs-grad')
this is all one line on jupyter notebook and looks really ugly
i tried entering after every or symbole but it breaks
do i have to indent ?
df['MoreThan50k'] = (df['Annual Income'] > 50000) &```SyntaxError: invalid syntax ^
native patrol
serene scaffold
<@137415565265338368> nice role color <:lemon_hyperpleased:754441879822663811>
lol thanks 😃
native patrol
hollow lagoon
how do i do multiple like code in python ?
```python
df['MoreThan50k'] = (df['A...
formatting - I just leave it upto black
df["MoreThan50k"] = (
    (df["Annual Income"] > 50000)
    & (df["Education"].str.lower().str.strip() == "some-college")
    | (df["Education"].str.lower().str.strip() == "bachelors")
    | (df["Education"].str.lower().str.strip() == "masters")
    | (df["Education"].str.lower().str.strip() == "doctorate")
    | (df["Education"].str.lower().str.strip() == "hs-grad")
)
add an extra set of parens so that you don't run into the syntax error
serene scaffold
what about
df["MoreThan50k"] = (
    (df["Annual Income"] > 50000)
     &
    (df["Education"].str.lower().str.strip().isin((
       "some-college",
       "bachelors",
       "masters",
       "doctorate",
       "hs-grad"
      ))
    )
)
I don't really know how to indent it.
serene scaffold
hollow lagoon
why am i so newbie
everyone starts that way. and then the insatiable appetite for code ensues.
@hollow lagoon did it work?
hollow lagoon
give me a sec im playing around with the indentation to know the limits and trying to break my code,
serene scaffold

hollow lagoon
serene scaffold
<:lemon_surprised:754441881831735327>
it worked!
 white venture
Anyone use tensorflow here?
hollow lagoon
on one line, because everytime i try to multiline something in python everything break
breaks
iron basalt
hollow lagoon
on one line, because everytime i try to multiline something in python everything...
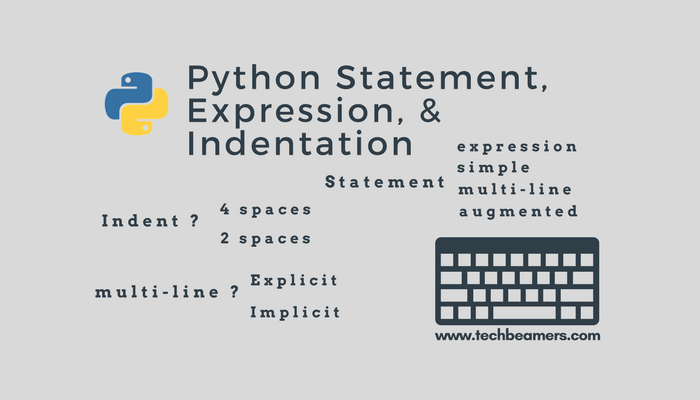
Learn Programming and Software Testing
Learn about Python statement, expression and see their difference. Also, learn how to use multi-line Statement and indentation in Python.
See the section "Multi-line Statement in Python".
Statements can be made multiline by adding \ at the end of the line letting python know that the next line is part of the same line. But when using (), [] or {}, these \ get added automatically (implicit line continuation since python knows that it should expect a matching ), ] or }).
Note that all functions have the () and so the arguments can be put on multiple lines.
>>> def foo(a, b, c, d, e, f, g):
...     print("Hello", a, b, c, d, e, f, g)
...
>>> foo(
...     "a",
...     "b",
...     "c",
...     "d",
...     "e",
...     "f",
...     "g"
... )
Hello a b c d e f g
 thorn bobcat
anyone here up?
austere swift
thorn bobcat
anyone here up?
yeah there are tons of people in this server from many time zones, if you have a question it's better to just go ahead and ask it and someone can answer it when they get the chance to
thorn bobcat
ahh i see
I was gonna ask if AI video compression can be implemented
then ran into Nividia Maxine
oh wait it's not compression just first order motion?
 umbral plover
hi im using open cv and i having trouble cropping images i dont know what numbers to type in the brackets. how to know what numbers to type
these numbers

like i want to crop the ball how will i know the numbers to type

 vital ledge
owh...just plot the image using matplot
hover ur mouse
can see the cordinnates
then key in in your code
or tkinter
iron basalt
If you want to do trial and error in code you can do a binary search starting with the right side for example. Make it half the image width, if it cuts off the ball then make it half between half and the full width, continue.
 humble birch
Hey quick question does the sum. Sum the columns or rows
iron basalt
humble birch
Hey quick question does the sum. Sum the columns or rows
A summation can sum over anything, even abstractly.
iron basalt
Which sum function in what context?
humble birch
Um like summing value in a df
iron basalt
white venture
Is anyone available to help me with my TensorFlow error? 🥺
 copper loom
white venture
Is anyone available to help me with my TensorFlow error? 🥺
copper loom
white venture
Is anyone available to help me with my TensorFlow error? 🥺
what is it?
white venture
I get this error where it says my "input 0 of layer_sequential_3" is incompatible with my layer
it says it expects a minimum ndim of 4 and it says my ndim is 3
vital ledge
check input data
white venture
see this is where it gets tricky for me
bc my training and test data set don't really come in as a matrix when I print it out, idk if that matters
vital ledge
white venture
bc my training and test data set don't really come in as a matrix when I print i...
TensorFlow
Specifies the rank, dtype and shape of every input to a layer.
vital ledge
white venture
bc my training and test data set don't really come in as a matrix when I print i...
white venture
<_OptionsDataset shapes: ((300, 300, 3), ()), types: (tf.uint8, tf.int64)>
this is what I get when I print my train
@vital ledge
vital ledge
white venture
<_OptionsDataset shapes: ((300, 300, 3), ()), types: (tf.uint8, tf.int64)>
try to make dummy date to achieve ndim 4, but actually , u must reconstruct ur model
vital ledge
vital ledge
try to make dummy date to achieve ndim 4, but actually , u must reconstruct ur m...
better u try open source gui based on basic algo model...
vital ledge
vital ledge
better u try open source gui based on basic algo model...
in order to skip understanding of model....
white venture
well how do I convert this data into a matrix?
vital ledge
 gentle epoch
how can I do type(a) == numpy.float64 if the code editor thinks numpy.float64 is a variable and not a data type
same for just float64
undone flare
@gentle epoch
!e
import numpy as np
a = np.float64(2)
print(type(a) == np.float64)
um okay?
oh needed the cmd first
also did you assign something to numpy.float64?
velvet thorn
gentle epoch
how can I do type(a) == numpy.float64 if the code editor thinks numpy.float64 is...
why do you need to do that?
gentle epoch
undone flare
also did you assign something to `numpy.float64`?
I'm not using numpy at all. it's just that pandas read_csv uses numpy's float 64 rather than python's regular float
gentle epoch
velvet thorn
why do you need to do that?
because I'm new to programming and I set up a variable that, depending on certain conditions, can be either a float or a string
and I was trying to do an if where it asks if type(var) == float
velvet thorn
gentle epoch
because I'm new to programming and I set up a variable that, depending on certai...
I would recommend you avoid such situations
maybe you can elaborate on what exactly you're trying to do
 rotund latch
Hi, I'm using Pandas for the first time. I have a rasperry pi where I write temperature and humidity in a file referencing epoch time. How do I plot a nice line chart that shows me the temperature over the last x hours?
 chilly geyser
rotund latch
Hi, I'm using Pandas for the first time. I have a rasperry pi where I write temp...
chilly geyser
rotund latch
Hi, I'm using Pandas for the first time. I have a rasperry pi where I write temp...
You just need alldata.plot(x="date", y="temperature")
I tested it with fake data on Colab

This is the result image

You can certainly customise it
rotund latch
@chilly geyser thanks! This was easier than I thought 🙂
 thorn bobcat
anyone here know how apply-able is Machine Vision in video compression?
chilly geyser
rotund latch
<@!178897388507758592> thanks! This was easier than I thought 🙂
Haha yes, if you're presenting this data, I'd customise the x-axis though. You need some ticker handling with that basically
For that, you can just import MatPlotLib directly, the data can be referenced via the columns
And it should be similar to what you get above
lusty stag
my model is trained on 40 features/columns
for testing I was sent 20 datasets 1 of them has 39 columns
how do I adapt this to my model?
or do I have to create a completely new model for 39 columns?
grave frost
thorn bobcat
anyone here know how apply-able is Machine Vision in video compression?
there are some archs that maintain temporal coherency over the latent space to make the output video close, but its pretty bad
 dire echo
I spend 1 minute writing these lol
serene scaffold
@dire echo wat
dire echo
Idk
 dire echo
The danger of mind uploading /shrug
serene scaffold
We're a long ways away from "mind uploading" being a thing
dire echo
Yea i walk too fast
grave frost
that has to be the worst logic ever
lapis sequoia
Got a quick question. I did SVR to predict price of products. I used log transformation on the response variable price to reduce skewness and variability. However I did following df2['log_price'] = np.log(df2['price']+1) by following a post from Towards Data Science. What is the differene between regular np.log? And how do I get predicted values back to real prices and not log_price?

The log transformed does not say much really rather than showcasing good fit
arctic wedgeBOT
numpy.exp(x, /, out=None, *, where=True, casting='same_kind', order='K', dtype=None, subok=True[, signature, extobj]) = <ufunc 'exp'>```
Calculate the exponential of all elements in the input array.
Similar names: numpy.numpy.exp
lapis sequoia
chilly geyser
The inverse of logarithm is exponentiation, which is .exp
How can that be translated into code?
undone flare
lapis sequoia
How can that be translated into code?
just apply that to a column?
if it's a 1D array you can do np.exp(df["..."])
lapis sequoia
Don't know how to do that because I have trained the model already with splitted data
undone flare
did you get the final predictions?
lapis sequoia
Please see image

So how do I do it here then?
transformed_price = np.exp(y_pred_test)?
undone flare
yes
lapis sequoia
undone flare
yes
stupid question. because I initially did np.log(df2['price']+1) don't I have to now also do np.exp(y_pred_test - 1)
or where ever the minus goes?
undone flare
is there any reason why you did +1?
but anyways I think you would do np.exp(y_pred_test) - 1
lapis sequoia
undone flare
is there any reason why you did +1?
Well I took it from a post from Towards Data Science
lapis sequoia
undone flare
is there any reason why you did +1?
Apparently it reduces skewness better
But I could not find posts why this would be better and how it would impact a models prediction
I don't want to clutter this thread too much but I think I have received the help needed. I appreciate all your help
undone flare
lapis sequoia
But I could not find posts why this would be better and how it would impact a mo...
I don't know, I would just apply np.log10
 ashen flower
Hi, hope everyone is doing well. Does anyone have any source to learn about increasing video quality and framerate usin AI? Any book, video or algorythm you find important?
Thanks,
grave frost
video interpolation?
ashen flower
Yes
gusty frost
Is it somewhat fun to be a Data scientist or is it all boring?
serene scaffold
gusty frost
Is it somewhat fun to be a Data scientist or is it all boring?
Depends on your interests
desert oar
gusty frost
Is it somewhat fun to be a Data scientist or is it all boring?
It's difficult and rewarding, it's almost never boring
Once in a while you have to grind through some manual data labeling or something like that, or you have to go do some data engineering stuff
So maybe that's more boring than building models, but the reality is that building models is only one part of a big job
gusty frost
Okay thanks.
grave frost
gusty frost
Is it somewhat fun to be a Data scientist or is it all boring?
pretty boring for work in the industry imo 🤷
chilly geyser
Do research, research is always stimulating
grave frost
chilly geyser
Do research, research is always stimulating
ikr. I can't think of doing standard stuff at a company, cleaning data and deploying stuff
I generally don't like programming
iron basalt
There is a lot of fun things in industry, e.g. predicting salt deposits from satellite images, swarm robotics optimization at warehouses, genetic algorithms for designing optimal parts.
grave frost
the thing is, for how long you would get those before you go back to scraping websites for clients to advertise as AI?
corporate research is kinda oxymoronic, but that's what FAIR, Brain and DeepMind does which seems appealing
iron basalt
Depends how much you need money (at that moment). Much like being a web dev vs anything else in programming.
grave frost
indeed, that's a big factor - though I assume positions in DeepMind and Brain pay well?
iron basalt
Don't go for DeepMind and Brain, just like don't get a web dev job at FAANG
DeepMind has so much money they can pay you a lot to do nothing, like most positions at Google.
shots
grave frost
iron basalt
DeepMind has so much money they can pay you a lot to do nothing, like most posit...
that's good, right? 🤔
iron basalt
Well if you want to live in a money coma and do nothing interesting ever.
grave frost
I expect monetary returns from investing anyways - I am quite interested in finance
I just am interested in cutting-edge AI stuff - like robotics, Transformers - and ofc, AGI (HTM) 😁
iron basalt
This is not financial advice. If you are actually investing and not gambling then it should work out, even if you need to wait 20 years.
grave frost
iron basalt
This is not financial advice. If you are actually investing and not gambling the...
ikr. holding equity over time can be golden
one of my family member was kinda of an idiot - held their shares for 15 years depite the shares peaking 1000% thrice
never sold, valuation under water. 🤷
hollow lagoon
Goood evening everyone
as i explore and learn pandas i get confused and therefore have a nice newbie questions for everyone
now what i mainly want to do is apply a condition on the values of a column and if it is true then include it into a count
``i have col df['Annual Icome']
and i want to get the count of everyone that has a value of 50k plus
print(len(df['Annual Income' > 1400000].index))
this failed
print(len(df['Annual Income']>14000))
``` This also failed, it gives me back df.shape[0] which i dont wantseriesObj = empDfObj.apply(lambda x: True if x['Age'] > 30 else False , axis=1)
# Count number of True in series
numOfRows = len(seriesObj[seriesObj == True].index)
is there any other ways than this ?
 odd lion
hollow lagoon
```python
print(len(df['Annual Income']>14000))
``` This also failed, it gives m...
odd lion
hollow lagoon
```python
print(len(df['Annual Income']>14000))
``` This also failed, it gives m...
Use another set of brackets. That is df[[‘Annual Income’]]
hollow lagoon
print(len(df[['Annual Income']]>140000000))
its still giving me the df.shape[0]
because i know nothing is more than 14 million
df['NewCol']=df.apply(lambda x: True if x['Annual Income'] > 50000 else False)
This also gives me
ValueError: The truth value of a Series is ambiguous. Use a.empty, a.bool(), a.item(), a.any() or a.all().
i keep losing track of tags sadly.
odd lion
hollow lagoon
```python
print(len(df[['Annual Income']]>140000000))
```
print(len(df[df['Annual Income']>140000000]))
Try that
hollow lagoon
well, that worked. Mind explaining briefly?
what is df df annual income
what is df[df['Annual Income']
vs df['annual income']
odd lion
I think the latter is a series of that column, whereas the former is getting a data frame based on that series
I more know how to use pandas than the specifics
 brittle arrow
I want to create an app that converts texts to images. So if i write dog, then a picture of a dog should be generated (or downloaded). I don't know what this is called though. What should I search for on the internet so that I can learn to do this?
hollow lagoon
what a philosophical question. Break it down
is the text predefined? aka only dog cat and horse
if so just write an app to read the file, match the text(animal) and then request a google search get the first image
brittle arrow
That's one way to do it. But that hardly makes it an AI thing. Let's suppose the text is not predefined. How do I do it then? @hollow lagoon
hollow lagoon
Oh sorry, i forgot the ai part.
cant help you sorry, very min knownledge on ai.
more data science field, and learning.
brittle arrow
alright thanks. if i can;t figure out the ML way then google images is always an option.
velvet thorn
brittle arrow
I want to create an app that converts texts to images. So if i write `dog`, then...
well
generated and downloaded
are two different things
if you want "downloaded"
I'd just use something like flickr's API
search for "dog" and get a random image
generated...you need ML for that
brittle arrow
velvet thorn
generated...you need ML for that
Yes i would like it to be generated. What exactly do i search to start learning that?
velvet thorn
brittle arrow
Yes i would like it to be generated. What exactly do i search to start learning ...
generative adversarial networks would be a good start
 limpid oak
does anyone have datascience and ml practice notebooks?
austere swift
limpid oak
does anyone have datascience and ml practice notebooks?
check out kaggle, theres tons of them on there
limpid oak
Thank you, i will check it
pastel valley
yo i found this course on coursera anyone took this? is this beginner friendly? https://www.coursera.org/learn/machine-learning

Coursera
Offered by Stanford University. Machine learning is the science of getting computers to act without being explicitly programmed. In the past ... Enroll for free.
undone flare
Hey @pastel valley, thanks for sharing this. I haven't tried this course but it would certainly help
But I don't know if they use Python hands on or what? but concepts would help
grave frost
velvet thorn
I do
ya, calling anything boring is subjective anyways since it depends on their interests
grave frost
brittle arrow
I want to create an app that converts texts to images. So if i write `dog`, then...
VQGAN + CLIP combo, check out r/deepdream to see how it would look, TPU Podcast server if you want to meet up with like-minded people, or the DALL E server on discord
 eager imp

KDnuggets
If you are wondering how to implement dropout, here is your answer - including an explanation on when to use dropout, an implementation example with Keras, batch normalization, and more.
 peak grotto
Hi i need help please
I need to visualise two pieces of binary data and one piece of categorical data
industry (categorical), application submitted (binary), customer won (binary)
 deep swift
 sullen linden
Hello
my dataset has a timestamp with a non-uniform pitch. how to resample the Timestamp column with a step of 10 minutes? then replace the Nan by the zeros
 half cloud
Guys i need to create a N-gram combinations of a text, anyone has an idea?
undone flare
sullen linden
Hello
my dataset has a timestamp with a non-uniform pitch. how to resample the ...
!d pandas.Series.resample I think you are looking for this
arctic wedgeBOT
Series.resample(rule, axis=0, closed=None, label=None, convention='start', kind=None, loffset=None, base=None, on=None, level=None, origin='start_day', offset=None)```
Resample time-series data.

Convenience method for frequency conversion and resampling of time series. The object must have a datetime-like index (DatetimeIndex, PeriodIndex, or TimedeltaIndex), or the caller must pass the label of a datetime-like series/index to the `on`/`level` keyword parameter.
Similar names: pd.pandas.Series.resample
half cloud
half cloud
Guys i need to create a N-gram combinations of a text, anyone has an idea?
for example: if i had this string 'hello my name is fish', it will bring me back a list that holds ['hello my', 'my name', 'name is', 'is fish'] for bi-gram... i can do it with loops but i belive that there is better way to do it...
grave frost
eager imp
https://www.kdnuggets.com/2018/09/dropout-convolutional-networks.html <- do you ...
there isn't any rule of thumb - depends on your dataset
 odd meteor
Please can someone help me with my code.
I'm new to python I need help in solving this. I have a dataframe named df. I want to convert the Month and Day to zero (0) whenever the Year = 0
I've tried defining a function to solve this, I've also tried for loop and if statement but I've not been able to get it right.
Year      Month     Day
0                 1                 1
2010              1                 15
2018              10                9
0                 1                  1
0                 1                  1
2010               4                27
I want the dataframe to look like this:
Year    Month    Day
0          0       0
2010       1       15
2018    10          9
0         0        0
0         0        0
2010      4       27
This is my initial code
def get_date(data):
    if data['Year'] == 0:
        data['Month'].replace({1:0}, inplace=True)
        data['Day'].replace({1:0}, inplace=True)
But when I try to apply the code to my dataframe it's giving an error message. I tried doing these
df.apply(get_date(), axis = 1)
df.apply(lambda data: get_date(data), axis =1)
get_date(df)
undone flare
If I have initial shape of (145460, 23) and if I dropped null values (I think they are MCAR) and the new shape became (56420, 23) is that a good idea? or should I impute the missing values
lapis sequoia
How to I make this easy to plot? I want to generate a line graph to track the prices

 river sail
hello
 rigid zodiac
Anyone know how to create a def get_category() ? i need some help
serene scaffold
lapis sequoia
How to I make this easy to plot? I want to generate a line graph to track the pr...
dataframes have a .plot method
serene scaffold
rigid zodiac
Anyone know how to create a def get_category() ? i need some help
knowing that the name of the function is get_category isn't enough to infer what the function is intended to do. are you sure this is data science related?
serene scaffold
lapis sequoia
How to I make this easy to plot? I want to generate a line graph to track the pr...
if you do print(df.head(10).to_csv()) and paste the text into the chat (no screenshots) I can look into how to make a plot out of it.
rigid zodiac
I think so, so I have this before that ```def vel_acc(final):
prev_frame_0 = final[0]
prev_frame_1 = final[1]
current_frame = final[2]
x1,y1,z1,t1 = prev_frame_0[0],prev_frame_0[1],prev_frame_0[2],prev_frame_0[3]
x2,y2,z2,t2 = prev_frame_1[0],prev_frame_1[1],prev_frame_1[2],prev_frame_1[3]
x3,y3,z3,t3= current_frame[0],current_frame[1],current_frame[2],current_frame[3]
vel_x1= (x2 - x1) / (t2 - t1)
vel_y1= (y2 - y1) / (t2 - t1)
vel_z1= (z2 - z1) / (t2 - t1)
vel_x2= (x3 - x2) / (t3 - t2)
vel_y2= (y3 - y2) / (t3 - t2)
vel_z2= (z3 - z2) / (t3 - t2)

acc_x = (vel_x2 - vel_x1)   / (t3 - t2)
acc_y = (vel_y2 - vel_y1)   / (t3 - t2)
acc_z = (vel_z2 - vel_z1)   / (t3 - t2)
#print(acc_x , acc_y , acc_z)
cat(vel_acc)
now I want to create a function def get_cat( ): get the acc_x on the previous thing in here. but idk what to put!code
arctic wedgeBOT
Here's how to format Python code on Discord:
```py
print('Hello world!')
```
These are backticks, not quotes. Check this out if you can't find the backtick key.
serene scaffold
Remember the py
def vel_acc(final):
    prev_frame_0 = final[0]
    prev_frame_1 = final[1]
    current_frame = final[2]
    x1,y1,z1,t1 = prev_frame_0[0], prev_frame_0[1], prev_frame_0[2], prev_frame_0[3]
    x2,y2,z2,t2 = prev_frame_1[0], prev_frame_1[1], prev_frame_1[2], prev_frame_1[3]
    x3,y3,z3,t3 = current_frame[0], current_frame[1], current_frame[2], current_frame[3]

    vel_x1 = (x2 - x1) / (t2 - t1)
    vel_y1 = (y2 - y1) / (t2 - t1)
    vel_z1 = (z2 - z1) / (t2 - t1)
    vel_x2 = (x3 - x2) / (t3 - t2)
    vel_y2 = (y3 - y2) / (t3 - t2)
    vel_z2 = (z3 - z2) / (t3 - t2)

    acc_x = (vel_x2 - vel_x1)   / (t3 - t2)
    acc_y = (vel_y2 - vel_y1)   / (t3 - t2)
    acc_z = (vel_z2 - vel_z1)   / (t3 - t2)
    #print(acc_x , acc_y , acc_z)
    cat(vel_acc)
now I want to create a function def get_cat( ): get the acc_x on the previous thing in here. but idk what to put
@rigid zodiac one would also need to know whatfinalis and what is in it. Please runprint(final.to_csv())and paste it into the paste bin
!paste
arctic wedgeBOT
Pasting large amounts of code
If your code is too long to fit in a codeblock in discord, you can paste your code here:
https://paste.pydis.com/
After pasting your code, save it by clicking the floppy disk icon in the top right, or by typing ctrl + S. After doing that, the URL should change. Copy the URL and post it here so others can see it.
rigid zodiac
so this is what I have prior to that
serene scaffold
@rigid zodiac please put large code samples in the paste bin. In either case, I'm only interested in final at the moment.
rigid zodiac
like the outcome??
serene scaffold
Just print(final) and put it in the paste bin, and I will come back with further instructions
!paste
arctic wedgeBOT
Pasting large amounts of code
If your code is too long to fit in a codeblock in discord, you can paste your code here:
https://paste.pydis.com/
After pasting your code, save it by clicking the floppy disk icon in the top right, or by typing ctrl + S. After doing that, the URL should change. Copy the URL and post it here so others can see it.
serene scaffold
^ this is the link to the paste bin
rigid zodiac
it's a stream type, so it's continuous..... idk whether I can print all of it or not
serene scaffold
that's fine
Imagine that I am standing next to you at your computer, and I'm just trying to figure out what the variables are
No amount of explanation will ever be better than just seeing what it is 😛
rigid zodiac
This is the final, it contain [x,y,z,time]

like i'm struggling to create a new def get_cat( ): Idk what to put inside the parenthesis
i know that I want to get the acc_x, acc_y,acc_z right beneath it
serene scaffold
I won't be able to help, unfortunately
rigid zodiac
:sad: awe it's ok
rigid zodiac
serene scaffold
Just `print(final)` and put it in the paste bin, and I will come back with furth...
can you see this by chance? https://paste.pythondiscord.com/geqazujowu.py
serene scaffold
rigid zodiac
can you see this by chance? https://paste.pythondiscord.com/geqazujowu.py
I just wanted to see the result of print(final) in the pastebin.
serene scaffold
rigid zodiac
https://paste.pythondiscord.com/kawovefepu.json
can you do print(type(final)) and paste the result into this chat?
sonic scaffold
In seaborn distplot() is deprecated and the alternative displot() shows me a graph with count instead of density?
serene scaffold
rigid zodiac
https://paste.pythondiscord.com/siyemewibe.kotlin
alright, let me see if I can figure it out
@rigid zodiac so final is list[list[int]]. what do the outer lists represent and what do the inner lists represent?
rigid zodiac
that's im trying to figure out too. like my senior engineer was like this this this and then he said convert my code into that.... i'm like wtf
serene scaffold
rigid zodiac
that's im trying to figure out too. like my senior engineer was like this this t...
sounds like the data model is not documented.
 haughty badge
Guys can some one link me the practice scenarios to learn python for data analytics or ETL
 lyric lodge
not sure if this is the best place to ask, but maybe you guys know... is the only way to use bioconda on windows through WSL?
blissful nymph
i have this network written in python, i don't know why but this is the error message that i am getting:
RuntimeError: shape '[16, 65536]' is invalid for input of size 984064
Input images are 256x256, with 3 channels:
here is the network:
class Net(nn.Module):
def init(self, num_classes = 2):
super(Net, self).init()
self.conv1 = nn.Conv2d(3, 6, kernel_size=3)
self.conv2 = nn.Conv2d(6, 16, kernel_size=3)
    self.fc1 = nn.Linear(16 * 64 * 64, 120)
    self.fc2 = nn.Linear(120, 84)
    self.fc3 = nn.Linear(84, num_classes)

    self.pool = nn.MaxPool2d(2, 2)

def forward(self, x):
    x = F.relu(self.pool(self.conv1(x)))
    x = F.relu(self.pool(self.conv2(x)))
    #x = torch.flatten(x, 1) # flatten all dimensions except batch
    #x = x.view(-1, 64*64*self.layer_vals[2])
    #print(x)
    x = x.view(x.size(0), 64*64*16)

    x = F.relu(self.fc1(x))
    x = F.relu(self.fc2(x))
    x = self.fc3(x)

    return x
Hi
serene scaffold
blissful nymph
i have this network written in python, i don't know why but this is the error me...
RuntimeError: shape '[16, 65536]' is invalid for input of size 984064
When you reshape an array, the values you provide have to multiply to the number of elements.
(16, 61504) would be a legal shape for an array that is currently (984064,)
gentle epoch
is it possible to change the type of float pandas' read_csv uses? from float64 to the regular float used by vanilla Python?
 flat hollow
gentle epoch
is it possible to change the type of float pandas' read_csv uses? from float64 t...
flat hollow
gentle epoch
is it possible to change the type of float pandas' read_csv uses? from float64 t...
but regular python float is the same as float64?
is float64 giving you trouble in your code or sth?
if I try to specify float as column dtype when reading it in I get float64
desert oar
gentle epoch
is it possible to change the type of float pandas' read_csv uses? from float64 t...
no, but you can use dtype='O' if you really really really need pure python floats
(but why?)
gentle epoch
flat hollow
but regular python float is the same as float64?
not really. if you try to to compare a float64 to just float it returns False
gentle epoch
desert oar
(but why?)
just trying to understand pandas better
because part of a program I was doing had an if statement where it asked if a variable was a float
 tidal bough
wait what
tidal bough
!e
import numpy as np
print(np.float64(1.535423) == 1.535423)
@tidal bough :white_check_mark: Your eval job has completed with return code 0.
True
pandas floats should be the numpy floats
desert oar
gentle epoch
since float != float64, it wouldn't trigger
did you write type(x) is float somewhere and find that it didn't work as you expected?
grave frost
tidal bough
!e
```py
import numpy as np
print(np.float64(1.535423) == 1.535423)
```
what? 🤯
tidal bough
Oh, I get it now. Yeah, you probably used type instead of isinstance
gentle epoch
desert oar
did you write `type(x) is float` somewhere and find that it didn't work as you e...
yes.
if type(x) == float:
blah```yeah, don't do that
tidal bough
actually, nevermind, isinstance(np.float64, float) is Falseisinstance(np.float64(), float) is True
gentle epoch
and it wouldn' trigger
desert oar
that's not good python style anyway
gentle epoch
yeah I know
I've already reworked my if block
I'm new to python
started just over 2 weeks ago
I'm still stumbling on what's good practice and what isn't
but it did give me so much grief, you wouldn't believe it
desert oar
import numpy as np

x = np.float64(3.5)

# bad
if type(x) == float:
    ...

# good
if isinstance(x, float):
    ...
it's understandable, there are a lot of "idioms" like this that you won't know until someone tells you
this particular situation has to do with how classes work in python
you don't need to know why it works at this point, just know to use isinstance for type checks
hollow lagoon
Hey, just recently learned python and wondering what is happening here
pearson_coef, p_value = stats.pearsonr(df['wheel-base'], df['price'])
I have 2 variable names ? does that function give back 2 values?
desert oar
@hollow lagoon yes, the function returns a tuple, and python lets you "unpack" iterable values with =
data = 1, 2, 3
x, y, z = data
mind explodes
desert oar
the () around a tuple is optional if the syntax is unambiguous
hollow lagoon
ok thanks that makes sense now
desert oar
!eval ```python
x = 1
y = 2
print(f'{x=}, {y=}')
x, y = y, x
print(f'{x=}, {y=}')
have fun with that one 🙂
arctic wedgeBOT
@desert oar :white_check_mark: Your eval job has completed with return code 0.
001 | x=1, y=2
002 | x=2, y=1
mmhmmm ok ok i see...
python is strange i swear
but cool, i like it
and the () were not needed unless code gets complex
desert oar
sometimes you want it for visual clarity
hollow lagoon
yea i would probably be using it
for clarity
so x, y = (3,5)
x = 3 and y = 5 correct ?
desert oar
yes
gentle epoch
desert oar
you don't need to know why it works at this point, just know to use `isinstance`...
it was more of an academic interest. I'm interedted in how python functions just as much as writing python programs, but thanks. I'll read on it
desert oar
that's the same as
__tmp = (3, 5)
x = __tmp[0]
y = __tmp[1]
del __tmp
if you're interested in python internal stuff, #internals-and-peps is the channel for that topic
desert oar
!e @hollow lagoon this is just for fun and not at all practical, but here's a demonstration of what you can do with python's syntax around "unpacking" of iterable things:
def recursive_map(f, x):
    if not x:
        return []
    else:
        x1, *xs = x
        return [f(x1), *recursive_map(f, xs)]

results = recursive_map(lambda val: val*10, range(5))
print(results)
@desert oar :white_check_mark: Your eval job has completed with return code 0.
[0, 10, 20, 30, 40]
that's more or less how map is implemented in haskell:
https://hackage.haskell.org/package/base-4.15.0.0/docs/src/GHC-Base.html#map
map :: (a -> b) -> [a] -> [b]
map _ []     = []
map f (x:xs) = f x : map f xs
however, haskell can optimize this into something sensible, while in python it'd be really slow
hollow lagoon
desert oar
!e <@!581389659909914624> this is just for fun and not at all practical, but her...
Thanks for the effort you're putting in but i dont understand what * does( unpacking i think? ) and lambda is unfamiliar to me and i havn't studied map function just yet
but thanks for the effort @desert oar
desert oar
that's ok, come back to it in a while 🙂
hollow lagoon
it means alot
i will def learn python properly. The course im in rushed us in one week, one week we learned everything from variables to classes and objects
because our main focus was analysis and panda
and numpy
and sql
 unborn glacier
blissful nymph
why would a neural network look like this:
unborn glacier
blissful nymph
why would a neural network look like this:
If you zero out the weights (usually by setting learning rate too high) it will stop learning
blissful nymph
@unborn glacier but the learning rate is like 0.001
unborn glacier
barren bison
i am stuck with my assignment?
You can grab a help channel in available channels and if someone knows how to help they will
blissful nymph
@unborn glacier its just the most simple cats and dogs one
unborn glacier
K you can share your code and I can take a look if you want
 stuck karma
Hello guys
I m making a plsr with scikitlearn and tried different components values
I would like to plot something with x the number of components and y the score (R^2)
I guess I should make a loop? This is what I tried:
for i in range (1,30):
                               pls=Plsregression(n_component=i, max_iter=500)

   scores=cross_validation(pls, X, y , CV=2 , scoring="r2", return_train_score="true")
plt.plot(n_components,scores)```Sorry for indentation I'm on phone
Plsregression is the function for the model with scikitlearn
X is my features
Y the variable I want to predict
CV the number of folders for cross validation
Would like to know what number of components I should put. That's why I want to plot a graphic with the R2 (n_components)
I know R2 will increase with number of components until a certain value
And then it will be like q Constant
Can you ping me if you answer please
desert oar
@stuck karma like this?
import matplotlib.pyplot as plt
import numpy as np
import pandas as pd
from sklearn.cross_decomposition import PLSRegression
from sklearn.model_selection import cross_val_score

# Use a random state with a fixed seed, for reproducibility
rs = np.random.RandomState(47730)

# Load your data here:
X = ...
y = ...

n_components = list(range(2, 30))
scores = {}
for n in n_components:
    pls = PLSRegression(n_components=n, max_iter=500)
    scores[n] = pd.DataFrame(
        cross_val_score(pls, X, y, cv=2, scoring='r2', random_state=rs)
    )

scores = pd.concat(scores)
scores.index.names = ['n_components', 'fold']
scores = scores.groupby(level='n_components').agg('mean')
scores.plot.scatter('n_components', 'test_score')
plt.show()
you might as well use GridSearchCV for this... same thing but less code
import matplotlib.pyplot as plt
import numpy as np
import pandas as pd
from sklearn.cross_decomposition import PLSRegression
from sklearn.model_selection import GridSearchCV

# Use a random state with a fixed seed, for reproducibility
rs = np.random.RandomState(47730)

# Load your data here:
X = ...
y = ...

grid_search = GridSearchCV(
    PLSRegression(max_iter=500),
    {'n_components': list(range(2, 30))},
)
grid_search.fit(X, y)

scores = pd.DataFrame(grid_search.cv_results_)
scores.plot.scatter('n_components', 'test_score')
plt.show()
I heard about grid search but never had the occasion to look about it
desert oar
i might have made a mistake in the first version with the for loop
but you get the idea
stuck karma
I don't know if there is a website which explain
desert oar
you pretty much reinvented it
loop over a list of parameter combinations and pick the best performing combination