#data-science-and-ml
1 messages · Page 326 of 1
 cedar sun
 grave breach
This isn't possible (with current methodologies)
You have to train the model on labels
grave breach
I think photoshop uses an algorithm but
you have to input the position and a threshold
grave breach
But you still have to click on the object
cedar sun
no
grave breach
Send me a pic
cedar sun
select subject photoshop
grave breach
Ok, I saw it
It doesn't extract things in general
It's trained to detect the main object
 grave frost
we do have generalized object segmentation algorithms; dunno what's OP driving at
there are tons of them out there; and a new paper like every month
cedar sun
grave breach
It's trained to detect the main object
well, main object = thing in general
grave breach
main object in the scene I mean
grave breach
Sorry, didn't got it
grave breach
So just make a dataset and train a cnn
cedar sun
dataset
but was wondering if there were more
HAHAHAHAAHAH
make a dataset
rofl xD
do u know what is needed? XD u need like 10k images, and for each img, u need to manually create the mask
xDDDD
grave breach
grave frost
we do have generalized object segmentation algorithms; dunno what's OP driving a...
for example?
grave breach
cedar sun
do u know what is needed? XD u need like 10k images, and for each img, u need to...
I think you can do this with the DUTS dataset

 grave breach
I think I've got an idea
You could just train a network to extract the background
And then "subtract" just the background from the image
And use the output as your objects
cedar sun
?
xD what i am asking is for other datasets apart from DUTS for this problem
not for other ways to approach it
grave breach
There aren't
cedar sun
cedar sun
https://gyazo.com/b64b4b6760bfe2622d9e77eafdf0d25b
inverting this mask will return the background, buts thats not what im looking for
grave breach
You have to then subtract the background from the starting image
And you will have got your objects
grave breach
Sorry, when translating into english words often get different meanings
Well, not translating
you got it
cedar sun
is okey, but still, i was asking for a dataset, nothing else
grave breach
cedar sun
u have to multiply the mask and the original img xd
Wasn't talking about the mask
cedar sun
GitHub
Salient Object Detection Datasets. Contribute to TinyGrass/SODdataset development by creating an account on GitHub.
if anyone looking for more
grave frost
grave breach
for example?
there are plenty on google, a search away 🤷
I dont know off the top of my head
 short heart
@grave breach ok so i trained vgg16 model and accuracy on val is 0.26...
grave breach
Pretty low
short heart
accuracy with just a few cnns was 0.46
grave breach
I don't think they're enough
But it is comphrensibl
e
VGG was trained on objects
Not medical images
cedar sun
short heart
<@!829349341658873896> ok so i trained vgg16 model and accuracy on val is 0.26.....
what are u trying to do?
 desert oar
so you have a lot of results that are close, and a few that are wildly wrong? that defintely bears some investigation. maybe look at the individual features in those examples to see if anything jumps out at you. you can (should) also make scatterplots, bar plots, etc. in addition to looking at the raw numbers
short heart
maybe ill try using efficientnet instead
grave breach
The problem isn't the model
short heart
ive seen people use effnet in this task
grave breach
It's that is trained on other
I suggest you first finetuning whatever cnn you want on another medical task (but same input type, medical scans)
So it can learn how to interpret them
And then use transfer learning on your task
short heart
ehh ok
i dont think theres any other data with completely same inputs
but ill try find something
grave breach
I think you can finetune it on some pneumonia dataset
(vgg or effnet are usually trained on imagenet)
That means that they learn features of general objects
short heart
but how do you even finetune
if there are gonna be different labels and etc
even if i train them on something different howd i apply them to current task if it would have different labels
grave breach
VGG and others are trained like that
They get data from image net and they try to predict the label of the object
You're removing the last 2 or 4 layers because they're too specialized
And replacing them with new one to be trained
grave frost
it won't do much - and nets like VGG usually attain around 70-80% perf
without pre-training
grave breach
So what you need to do in order to fine tune them on medical scans
Is just using the model on different classification task involving medical scans
So the model will learn to recognize all the tiny details that your final layers needs to interpret
If you need I can try to pretrain a cnn for you while you focus on other strategies
So you have more chanches to get this done
@short heart
desert oar
doesn't that already imply "transfer learning" since you're using your own output layer?
grave breach
Yes
desert oar
that might have been the source of their confusion
 pastel anvil
can anyone help me plz 😭
class Az:
    def __init__(self):
        self.ibc = InteractiveBrowserCredential()
        self.ibca = self.ibc.authenticate()

    def auth(self):
        self.ibc.authenticate()
        return self.ibc

    def login(self, ibca):
        sc = SubscriptionClient(ibca)
        sl = sc.subscriptions.list()
        for sub in sl:
            print(sub.display_name)
            print(sub.supscription_id)
            print(sub.state)
        return sl


parser = argparse.ArgumentParser()
subparsers = parser.add_subparsers()
az_login = subparsers.add_parser('login')
az_login.set_defaults(func=Az.auth)
args = parser.parse_args()

##option = Option()
if args.login:
    obj = Az()
    lgn = obj.login(obj.ibc)

print(1)
I keep getting this error
D:\src\STI\vs\Ops\Py>ff.py login
Traceback (most recent call last):
File "D:\src\STI\vs\Ops\Py\ff.py", line 43, in <module>
if args.login:
AttributeError: 'Namespace' object has no attribute 'login'
desert oar
@pastel anvil this is better suited for a help channel. see #❓|how-to-get-help
pastel anvil
I've asked the question like 3 different times on 3 different days with no response
short heart
grave breach
So the model will learn to recognize all the tiny details that your final layers...
thats the thing i dont understand how would you save such thing
would you do something like general training of a model, but then remove last layers and save it?
grave breach
I would train it on another task that implies chest x rays
(current models are trained on the task of recognizing everydays items)
short heart
just general training and then remove last layers and save?
grave breach
Yes
short heart
so then
short heart
if i for example already trained on 4000 images of idk pneumonia
grave breach
I have them too
Don't worry
Could you please dm me with the link of the coronavirus dataset?
So I can then try
short heart
and then i had to train on 4000 images of some mysterious type of pneumonia, wouldnt i need to decrease lr everytime i train
so that previous weights dont decay
if so wouldnt training take painful amounts of time in a long period
grave breach
I will do these training for you
I have a rather powerful gpu
It wont take a long time
short heart
yea but at least i want to look at the process later or something so its not like you do everything for me
just so i learn anything from it
desert oar
in image tasks, do people do things like train an autoencoder on a huge unlabeled dataset then transfer-learn/fine-tune on a smaller labeled dataset? i've done it w/ word vectors in text classification with modest success
grave breach
Yes, I can document everything for you
grave breach
desert oar
in image tasks, do people do things like train an autoencoder on a huge unlabele...
I tried doing that
With images it outputted (after the decoder) just random noise
I noticed (playing with autoencoder on MNIST dataset)
That it develops an internal classifier
desert oar
interesting
 slow vigil
Does a pandas series act like a list? I'm trying to pass a column of my dataframe into a function that accepts a list and I'm getting a keyerror
 tidal bough
slow vigil
Does a pandas series act like a list? I'm trying to pass a column of my datafram...
tidal bough
slow vigil
Does a pandas series act like a list? I'm trying to pass a column of my datafram...
What's the full traceback?
a Series kinda acts like a list, yes, unless it has a nonstandard index type
 sage marsh
I am on the process of building a rest api that receives an image and compares it to the faces stored in the database, mainly for fraud detection.
The faces are stored in the form of vector embeddings all of which will be compared to the request image sent by a user.
What would be the most efficient way to loop through all these numpy arrays and compare each one to that of the user?
 chilly geyser
It's because of the indexing
!e
from pandas import Series
s = Series(list(range(3)))
s.index = list(range(2, 5))
for i in range(3):
  s[i]  # ERROR
 arctic wedgeBOT
@chilly geyser :x: Your eval job has completed with return code 1.
001 | Traceback (most recent call last):
002 |   File "/snekbox/user_base/lib/python3.9/site-packages/pandas/core/indexes/base.py", line 3361, in get_loc
003 |     return self._engine.get_loc(casted_key)
004 |   File "pandas/_libs/index.pyx", line 76, in pandas._libs.index.IndexEngine.get_loc
005 |   File "pandas/_libs/index.pyx", line 108, in pandas._libs.index.IndexEngine.get_loc
006 |   File "pandas/_libs/hashtable_class_helper.pxi", line 2131, in pandas._libs.hashtable.Int64HashTable.get_item
007 |   File "pandas/_libs/hashtable_class_helper.pxi", line 2140, in pandas._libs.hashtable.Int64HashTable.get_item
008 | KeyError: 0
009 |
010 | The above exception was the direct cause of the following exception:
011 |
... (truncated - too many lines)
Full output: https://paste.pythondiscord.com/ozukakomuq.txt?noredirect
grave frost
desert oar
in image tasks, do people do things like train an autoencoder on a huge unlabele...
I heard it here, but has it been documented?
chilly geyser
There is nothing with the index '-1' in your Series
grave frost
last I heard was the BYOL technique
slow vigil
hmm. So I guess I'd have to just convert it to a list
Or alter the function
alter the function probably more optimal, eh?
chilly geyser
Most likely to scale from [0,255] to [0,1]
desert oar
...are you sure?
 umbral ferry
I'm thinking of doing some hyperparameter tuning using GridSearchCV and XGboost as my estimator, are there any parameter which yall recommend to tune first?
desert oar
umbral ferry
I'm thinking of doing some hyperparameter tuning using GridSearchCV and XGboost ...
slow vigil
Ok this is a noob question but I'm a noob. I have a pandas series of closing prices for a stock, and I wrote a function that will calculate an indicator value as new data comes in. I'm wondering how I can apply that function to the entire series of values from beginning to end as if it were playing out in real time
I've heard of the pandas rolling window functionality. Is that what I'm looking for here?
desert oar
@umbral ferry i'd try setting tree_method = 'hist' and start tuning with max_depth
min_child_weight is kind of like the minimum size of a node after splitting, so increasing this will make the trees less likely to have tiny splits at the end
umbral ferry
currently I'm doing, gamma, max depth, and n estimator
desert oar
i wouldn't tune on num_round, since you can always add rounds. unless you want to mess with early stopping
umbral ferry
I kind of skipped the low level details, so I'm not sure how to interpret trees, nodes, pruning, splits. Not sure if that will affect my understanding, but I am curious to know the underlying strcture
desert oar
it helps to have some intuition about it
in order to build a tree, xgboost finds a feature to split on and a split point for that feature. it finds the split that has the greatest increase in "tree goodness" of all possible splits
if you set gamma above 0, it means that you stop splitting if the goodness increase is below gamma. if you set min_child_weight above 1, it means that you stop splitting if a resulting child node has total weight below min_child_weight (kind of like the total number of rows in that node)
a decision tree is literally just a sequence of "if/else" decisions
if you don't know what the parameters mean, you're going to be stumbling around in the dark even moreso than you already are when tuning a model
i guess people do tune num_round in CV, i guess if you have a lot of computing power and/or don't mind paying for cloud computing and/or your model is fast to train then go for it
iirc you don't have a really big dataset or feature space so i guess you can try it
umbral ferry
it takes me about 20 seconds for each iteration
well, around 10 if I cut a few of less important features, but it does reduce the accuracy a moderate amount
I'll give those documents a look, thanks!
 main kernel
Hello, i have a problem in pandas
I need to left join 2 df, but i have some problems whit the "key"/on, i have a ID columns( not unique in both sides), that's ok, i can turn it unique, just need to use a datetime column, but there is variations in the date between both df( 2 month more or less) , how do i merge considering that range?
i read some tips to create a "indexcolumn"(whit range category), like 02/2020 ~ 04/2020 is equal to E1 , and 05/2020 ~ 07/2020 equal to E2, and so on , but that don't help me, because i may miss the correct date like in this case: df1 date= 04/2020, and df2 date= 05/2020 , E1!=E2 , but i want to join those( 04/2020 is in range of 2 month of 05/2020)
any idea ?
desert oar
umbral ferry
it takes me about 20 seconds for each iteration
oh then tune everything, fuck it
how many boosting rounds at 20 seconds?
that seems weirdly short
umbral ferry
is that n_estimators? I usually have it at 500
umbral ferry
I've got 30 features, all 0 or 1
desert oar
main kernel
Hello, i have a problem in pandas
I need to left join 2 df, but i have some prob...
so the index of df1 is a date interval, and the index of df2 is a date? and you want to join on that?
desert oar
umbral ferry
I've got 30 features, all 0 or 1
i'd be curious what happens if you use all of them without chi-sq selection. i'm probably leading you further into the weeds and away from a useful model though 😛
umbral ferry
actually looks like I'm at 6 seconds lol
desert oar
how many data points?
umbral ferry
12000, 9000 for training
desert oar
if you want to be really slick, you can have two hold-out sets: one "validation" set for tuning model parameters, and one "test" set for final model evaluation after parameter tuning
or do 3-fold CV on the 9000 training data points
umbral ferry
I have it doing 3 fold CV rn
desert oar
ok good
umbral ferry
and the data is kinda clumped so I don't split the data, I randomly sample it
main kernel
desert oar
so the index of `df1` is a date interval, and the index of `df2` is a date? and ...
it both date, i need to join whit a "range" of error, like, 04/2020 will be equal to 05/2020, because abs(05/2020 - 04/2020) <2 , the range need to be less than 2 month
umbral ferry
using ShuffleSplit from sklearn
desert oar
umbral ferry
and the data is kinda clumped so I don't split the data, I randomly sample it
when people say "split" they almost always mean "randomly sample" as in ShuffleSplit
umbral ferry
nice
desert oar
main kernel
it both date, i need to join whit a "range" of error, like, 04/2020 will be equa...
ah, i'm not aware of a way to do that using the merge/join functionality of pandas. if you can provide some sample data (ideally a CSV or something i can load directly into pandas) then i can experiment
you can probably convert the first df index to a range index, then do the join
main kernel
desert oar
you can probably _convert_ the first df index to a range index, then do the join
the merge undestante a range/period index?
df1 = {date:[ '04-2020' , 08-2020' ,04-2020' ],
ID :[011, 022, 033] }
df2 = {'date2': [ '05-2020' , 08-2020' ,10-2020' ],
ID :[011, 022, 033]}
merge whit both columns, if date is in range of 2 month(for more or for less) merge it, if not, dont,
the result must be
ID Date1 date 2
011 04-2020' 05-2020
022 08-2020' 08-2020'
abs(04-2020 - 10-2020) is 6 month , 6 is > than 2, than it is not equal
desert oar
main kernel
the merge undestante a range/period index?
apparently not, i just tried it
you can obviously do it in a loop but it will be slow
maybe you can use https://pandas.pydata.org/pandas-docs/stable/reference/api/pandas.merge_asof.html#pandas.merge_asof @main kernel
main kernel
desert oar
maybe you can use https://pandas.pydata.org/pandas-docs/stable/reference/api/pan...
Amazing!!! tolerance will solve it
tolerance int or Timedelta, optional, default None
Select asof tolerance within this range; must be compatible with the merge index.
tolerance=pd.Timedelta('2M') seems like it should work
main kernel
yes
umbral ferry
it seems odd to me, maybe not, but I'm getting the best results with very high gamma, around 100, is that a red flag? @desert oar
desert oar
not necessarily. it means that your model is doing well by only making "high impact" splits
what tree size and min child weight do you have along with that? and how many boosting rounds?
umbral ferry
400 rounds, child weight of 2
running a grid search with child weight 0 to 10, gamma 0 to 100 rn
umbral ferry
desert oar
what tree size and min child weight do you have along with that? and how many bo...
looks like gamma 100 and child weight 0 is the best
although low gamma and low child weight is only worse by a small amount (according to my scoring metric) by less than 1%
desert oar
generally i would prefer less-extreme parameters if they perform similarly
what max tree size?
umbral ferry
is that max_depth? I have that at 6
I did some testing earlier and found that to be generally good, when compared to 4 and 8
it likes 500 gamma it seems
desert oar
i'd include max depth in the tuning
high gamma is probably acting as a proxy for lower max depth
although in your case you have all these categorical features so maybe higher max depth isnt that bad
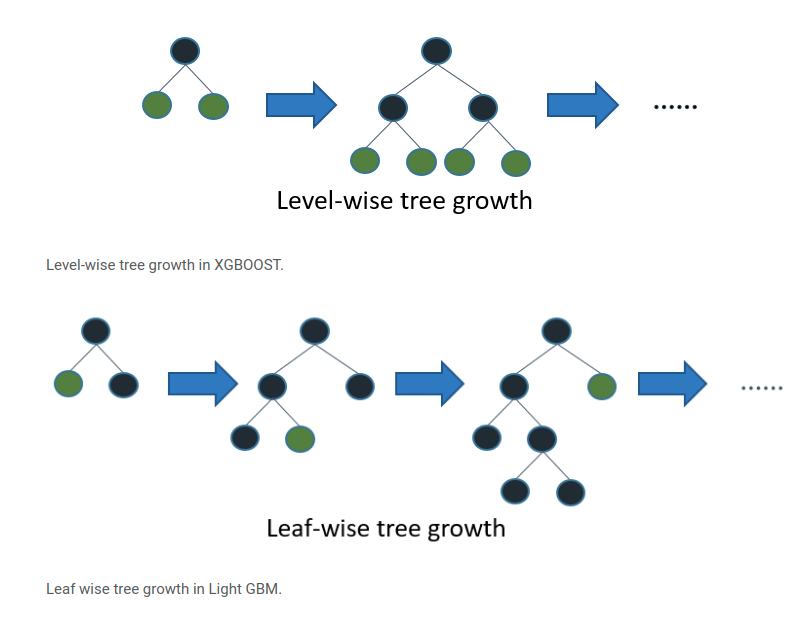
you could also try lightgbm instead of xgboost, which has better support for categorical data and also uses a different tree-building algorithm that in my experience gives better results on "messy" data, and can be even faster to train than xgboost
 umbral ferry
is it as simple as replacing XGRegressor with like LGRegressor in my code?
desert oar
you'll have to check the lightgbm docs
but yes i think they have something like a LGBRegressor
umbral ferry
will I need to change how I represent my inputs?
desert oar
you won't have to one-hot encode, so it's simpler.
but at this point you might want to focus more on understanding your model better, rather than trying more models
make some scatterplots of predicted vs actual
maybe even make a heatmap of the one-hot-encoded categorical data
are you happy with the results? does rmse of 15 seem good to you? what are the 25th and 75th percentiles of error?
umbral ferry
good point, I haven't seen in anything in exploring cross validation or tuning that raised a red flag for me yet
are there any tools that make looking at those stats easy? otherwise I can definitely manually comput/display them no big deal
desert oar
pandas, matplotlib
umbral ferry
thanks!
would including all my features only increase model performance? I thought adding useless features might decrease performance?
umbral ferry
also after my CV, I have multiple RMSE values for each split. What is the correct way to combine these? is a simple average good enough?
desert oar
yeah that's typical
desert oar
umbral ferry
would including all my features only increase model performance? I thought addin...
it could decrease it, but i'd be less worried in a tree model with regularization like xgboost. if your model is that fast to train then it's pretty easy to experiment
umbral ferry
just did it, looks like it has no effect
nice
feature selection was a success
woah actually, RMSE went from 15 to 13.6
that's after CV with 5 splits
that does make sense, I only had features with low correlation and very low correlation, every bit helps
I suppose the benefit is that parameter tuning was very fast with reduced features
I think we discussed it before, but I'm using RMSE as my evaluation metric because I want the results to be more grouped, so sensitive to outliers. Are there other/better metrics to use?
I apologize for the spam 😂
I'm experienting with early stopping, and it's stopping at around 100 rounds. I think you mentioned earlier that's a small amount of boosting?
desert oar
it depends on the model
100 doesnt seem small
if it gives better results than 500 then all the better
 timber skiff
Is machine learning used for failure analysis?
I picked five or six features on a pretty big dataset and had it classify towards "reject" and "pass"... Then it did some kind of linear regression.... But i didn't really have a takeaway
Like, am I supposed to have it print some residuals for each variable and go from there?
pastel anvil
Is anyone here familiar with the Python SDK for azure machine learning
I'm trying to save a PipelineRun as yaml and im getting a weird error
grave frost
timber skiff
I picked five or six features on a pretty big dataset and had it classify toward...
what are you using?
 modest haven
How should I start with machine learning? Ik all the basics of Python and very basic Flask
Any good YouTube video?
umbral ferry
this video is a golden nugget, it helped me a ton for my specific application, maybe it will help you https://youtu.be/ap2SS0-XPcE @modest haven

How to create a classification model using XGBoost in Python? The tutorial will provide a step-by-step guide for this.
Problem Statement from Kaggle: https://www.kaggle.com/c/santander-customer-transaction-prediction/
Code on Github: https://github.com/harsh1kumar/learning/blob/master/machine_learning/santander_trxn_prediction/07_trxn_pred_xgb...
though it's probably better to start some higher level explination videos/material
timber skiff
grave frost
what are you using?
I had a big bunch of data, there's a 5% manufacturing rejection rate, i used a few process parameters and tried to train it to predict what entries in the test set would be rejects. It had a 95% success rate but it gave me no insight. Just kinda told me what i already knew.
Is this essentially a multivariate linear regression? All i really wanna know is what combination of parameters at what settings causes failures.
Oh "using" woops, i misread and thought you said "saying", tbh i don't know what I'm talking about. Picked it up today. I'm using sklearn knn.fit, with n_neighbors of 15, uniform weight
5 continuous features predicting a categorical binary output with 10000 entries
desert oar
you'll want to account for the fact that the data is unbalanced
knn could be less affected
desert oar
timber skiff
Is this essentially a multivariate linear regression? All i really wanna know is...
"regression" has at least 2 meanings:
- a "linear regression" model, as in
y = b0 + b1*x1 + b2*x2 + e - a "regression task/problem" is a machine learning task where the target is continuous, like an income level or the mass of some chemical reaction product
this is a "classification problem" (as opposed to a "regression problem"), and KNN is not a form of linear regression
timber skiff
that explains it
 serene scaffold
I have this
array([[0, 2, 0],
       [0, 2, 2],
       [0, 2, 2],
       ...
       [1, 2, 2],
       [1, 2, 2]])
I want to go to this:
array([[1, 0, 0, 0, 0, 1, 1, 0, 0],
       [1, 0, 0, 0, 0, 1, 0, 0, 1],
except with the same number of rows. I just got lazy. But the idea is that value in the first array gets expanded into a one-hot, sort of.
appears to involve np.eye
desert oar
is this like run length encoding?
how does [0, 2, 0] become [1, 0, 0, 0, 0, 1, 1, 0, 0]?
serene scaffold
desert oar
how does `[0, 2, 0]` become `[1, 0, 0, 0, 0, 1, 1, 0, 0]`?
>>> np.eye(3)[bob].transpose(0, 2, 1).reshape(24, 9).astype(bool)
array([[ True, False,  True, False, False, False, False,  True, False],
       [ True, False, False, False, False, False, False,  True,  True],
       [ True, False, False, False, False, False, False,  True,  True],
       [ True, False, False, False, False, False, False,  True,  True],
I did it 😄
I wanted this. just take my word for it.
desert oar
you'd better write a comment explaining what that transpose trickery does
serene scaffold
I'm just going to turn this into a CSV, put it somewhere I won't forget, and forget.
umbral ferry
I wonder, how much success do people have in predicting stocks/sports matches with machine learning? Is it better than nothing?
 iron basalt
umbral ferry
I wonder, how much success do people have in predicting stocks/sports matches wi...
iron basalt
umbral ferry
I wonder, how much success do people have in predicting stocks/sports matches wi...
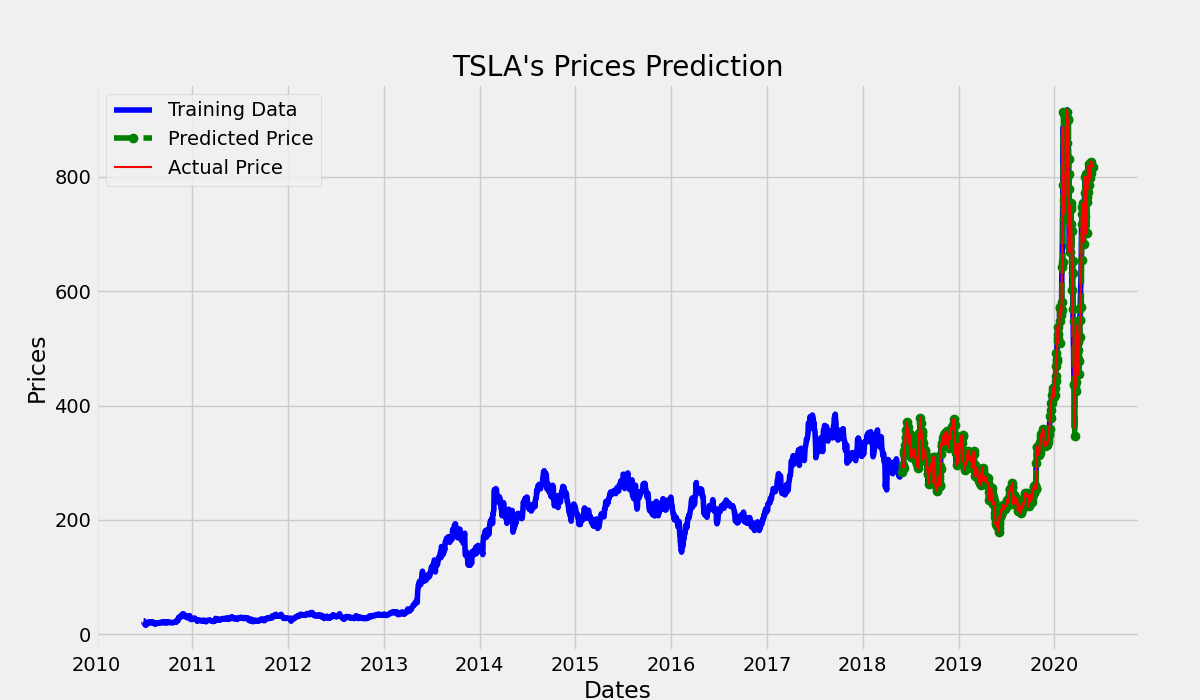
"so essentially the paradox here is that by even using the model’s prediction, you are directly influencing the future, making the predictions obsolete in one way or another."

Cybernetics is a transdisciplinary approach for exploring regulatory and purposive systems—their structures, constraints, and possibilities. The core concept of the discipline is circular causality or feedback—that is, where the outcomes of actions are taken as inputs for further action. Cybernetics is concerned with such processes however they ...
Nobody takes into account that there is a feedback loop. They just naively use some ML prediction model.
(But of course, even with this, you would need to probe everybody's mind to get the data needed to have a chance, good luck with that)
As for those that end up profiting and claim it was their model: https://en.wikipedia.org/wiki/Survivorship_bias
Survivorship bias or survival bias is the logical error of concentrating on the people or things that made it past some selection process and overlooking those that did not, typically because of their lack of visibility. This can lead to some false conclusions in several different ways. It is a form of selection bias.
Survivorship bias can lead ...
Basically it's like saying that an ML model could predict a slot machine, when clearly it cannot.
No matter which model.
Nor can ML pull information from the æther.
iron basalt
serene scaffold
what
If it does one day, predicting the stock market will be at the bottom of the list of interesting things happening 
serene scaffold
I recall someone in this server asking if one could build a model that predicts what reward one will get for defeating a boss in a certain video game, when the reward is completely random. And I told them they could build a model that randomly picks a possible reward, but it won't do better than that.
iron basalt
If it's pseudorandom it's doable. They probably used a LCG, just gotta hope they messed it up somehow.
If it's not multiplayer then time to pull up the Ghidra.
But yeah, sometimes it's important to remember that random means random, and not just random noise on top of a pattern due to measurement issues.
umbral ferry
super basic question but what's the difference between neural net, machine learning, and deep learning?
 blazing bridge
can someone explain what autocorrelation is in time series data
I dont completely understand it
I have this plot to show it:


what do these black lines mean and what are they explaining

Course link: https://www.coursera.org/learn/tensorflow-sequences-time-series-and-prediction
Time-series come in all shapes and sizes, but there are a number of very common patterns. So it's useful to recognize them when you see them. For the next few minutes we'll take a look at some examples. The first is trend, where time series have a specif...
this is the video and I would really appreciate it if someone could explain it in a very simple way
Also I don't really understand what a "lag" is
 unkempt ice
its the dependence of the variable
on itself
i have written 2 scripts on how to obtain proxies from internet that actually work. Would be awesome if you provide feebdback https://dspyt.com/2021/07/11/easy-proxy-scraper-and-proxy-usage-in-python/
chilly geyser
iron basalt
If it's pseudorandom it's doable. They probably used a LCG, just gotta hope they...
If it's CSPRNG then you're trying to defeat something difficult
 trim marten
Hi
I have a list of dicts each dict contains as value another dict
I want to update the values of the values of each dict
Exemple
dict_test = [ { "key 1": { "dataframe": "dict 1" } }, { "key 2": { "dataframe": "dict 2" } }, { "key 3": { "dataframe": "dict 3" } }, } ]
I want to update the list of dicts converting each values of each dataframe key to html
So applying function that convert dict to dataframe and after to .to_html for dict 1, dict 2 and dict3
 inland zephyr
hello i want to asking for suggestion about image processing for machine learning. I'm using this library https://github.com/serengil/deepface for face detection and allignment using retinaface model. But unfortunately the result is pretty awful if the source has smaller resolution since it return 244x244 as the result. here is the example
GitHub
A Lightweight Deep Face Recognition and Facial Attribute Analysis (Age, Gender, Emotion and Race) Framework for Python - serengil/deepface
this is the source

and this is the result. The problem is i lost little detail on the face profile.
 serene scaffold
@lapis sequoia the best approach is to just ask your question, rather than try to filter people out to answer a question you haven't asked.
 lapis sequoia
Ok nvmnd i solved it anyway
 karmic fjord
Does someone here know where I can ask questions about Numba? I am not getting answers from the helpchannels or from the topical chats.
I am using the @ jitclass decorator from Numba and I am trying to apply the strategy pattern by passing in and assigning a jitted function to one of the class's attributes. Is this possible? Which Numba type should I give to this attribute in the jitclass specs?
 frozen oyster
 bright pewter
Hello, everyone I hope u doing fine
so I'm stuck with the university project
it's a face recognition system + attendance
first: the program detect a face using the face cascade
2nd: it takes a picture of the face
and store it in the picture.jpg
3rd: it compares the picture to the ones in the picture folder
and Iam using a dahua smart H265+ ipc
so it is an IP camera I want to implement face recognition system in it
any one can help is welcome
plz it's my graduation project so I really need help
saty safe and have a nice day
grave frost
iron basalt
https://towardsdatascience.com/quit-trying-to-predict-the-market-27d77149a709
I agree with the paradoxical statement, but I disagree with the thinking "my tutorial naive LSTM doesn't work so no other model does" approach.
big funds do use quants and high-level models to try and forecast stock data from history; they can use models to analyze all the information and try to atleast get an indication of what's going to happen in the market
 rigid zodiac
I need quick help if possbile
desert oar
the cdf and inverse cdf (what scipy calls "ppf") of the t distribution are complicated and not something you should attempt to implement by hand. see the "CDF" in the sidebar here https://en.wikipedia.org/wiki/Student's_t-distribution
even if you use the gaussian approximation you still have some messy numerical work to do https://en.wikipedia.org/wiki/Gaussian_distribution
 carmine yarrow
anyone regularly use h2o? for some reason its only giving me regression metrics for a classifier and i cant work out how to get the classification metrics
desert oar
carmine yarrow
anyone regularly use h2o? for some reason its only giving me regression metrics ...
show code?
i don't regularly use h2o but i have used it before
carmine yarrow
desert oar
show code?
ive sorted it. response variable is binary, therefore numeric and h2o assumed it was a regression problem instead of classification. had to set the column as a factor using .asfactor()
desert oar
good find. i figured it was something like that
 brisk sage
I created this plot using sns.distplot(df) and fitted in a legend etc. However I actually don't know what exactly I have just plotted. Could someone explain to me what exactly we can see here? I.e. what is plotted on the X and Y axis?
 desert oar
brisk sage
I created this plot using `sns.distplot(df)` and fitted in a legend etc. However...
desert oar
brisk sage
I created this plot using `sns.distplot(df)` and fitted in a legend etc. However...
do you know what a histogram is?
brisk sage
it's showing more or less the accumulated data of my dataset?
desert oar
it groups your data into "bins", and then counts the number of data points in each bin
those are the vertical bars - the histogram
now, do you know what a probability density is?
brisk sage
desert oar
now, do you know what a probability density is?
Sorry, I am an absolute newbie on almost anything statistically related. All I could do is recite something from a video I've seen but haven't understood yet
desert oar
ok. so this is going to be new for you
a probability distribution is more or less a relationship between the value of a random variable and a probability
so if you have a random variable CoinFlip that can be Heads or Tails, the probability distribution will map Heads to 0.5 and Tails to 0.5
things get a bit funkier for random variables that can take on a continuous range of values, like "the air temperature over my porch at 2:00 PM tomorrow"
in that case, for math reasons, you can't map a single value like 24.358235 to a single probability
tldr there are "too many numbers" to be able do something like that
however we can do math on a range of values, so we can express things like "the probability that the air temperature over my porch at 2:00 PM tomorrow is less than or equal to 24.358235"
the math that describes this "less-than-or-equal-to" relationship is called the "cumulative density function"
and we can use some other math to describe "how much probability" is located around any given number, even if we can't actually compute the probability of a specific number
so i can't tell you the probability that the temperature will be 24.358235, but i can tell you roughly "how much probability is around 24.358235"
and that is the probability density function
which are the black and blue lines
there are well-known procedures for estimating probability density from data (called "kernel density estimation")
i don't expect you to fully understand this tbh, but that is the super super compressed explanation of what those lines are
so the line is really high around 0.25, meaning that values around 0.25 are more probable than in other places where the line is low, e.g. around 1.5
brisk sage
No go ahead, you're doing a great job
123      0.000000      0.000000  ...      0.000000       0.000000
124      0.632075      0.632075  ...      0.603774       0.603774
125      0.000000      0.392857  ...      0.321429       0.392857
126      0.611111      0.611111  ...      0.472222       0.416667
127      0.000000      0.000000  ...      0.000000       0.000000```

That's part of the plotted dataset. It contains the measured amplitudes (in percentage) at 5 time points. So approximately 25% of those have an amplitude of 120%?are you asking how to read the chart?
brisk sage
yes
desert oar
try plotting the histogram by itself without the density, to start with
brisk sage
something like this?
 desert oar
hm, no
brisk sage
That's sns.displot(df)
desert oar
how did you make the other one? show the code
brisk sage
fig = sns.distplot(df, fit=norm if data else skewnorm, kde_kws={'lw': 5})
plt.title("Overall Amplitude Data Distribution\n", size=size, weight=weight)
plt.legend(["Data Distribution", "Fitted Distribution\n[Normal/Skewed]", "Histogram"]``` lethal dust
Can any1 explain me what does this piece of code do? Mainly x(1-x) part what's its significance there?
sigmoid function
def nonlin(x,deriv=False):
if(deriv==True):
return x(1-x)
return 1/(1+np.exp(-x))
brisk sage
brisk sage
something like this?
sns.histplot looks the same
desert oar
brisk sage
```py
fig = sns.distplot(df, fit=norm if data else skewnorm, kde_kws={'l...
who gave you this code?
desert oar
lethal dust
Can any1 explain me what does this piece of code do? Mainly x(1-x) part what's i...
x(1-x) won't work in python unless x is a very specific kind of object which is probably is not
brisk sage
The documentation https://seaborn.pydata.org/generated/seaborn.distplot.html?highlight=distplot#seaborn.distplot and a youtube video
desert oar
and what is data?
lethal dust
desert oar
`x(1-x)` won't work in python unless `x` is a very specific kind of object which...
y it wont work?
desert oar
lethal dust
y it wont work?
try it
lethal dust
It is working
brisk sage
desert oar
and what is `data`?
a shapiro_wilks test for normal distribution. That part just decides which norm to fit
lethal dust
can u tell me how u highlight this kind of text x * (1-x)
desert oar
lethal dust
can u tell me how u highlight this kind of text x * (1-x)
!code
arctic wedgeBOT
Here's how to format Python code on Discord:
```py
print('Hello world!')
```
These are backticks, not quotes. Check this out if you can't find the backtick key.
desert oar
and inline code like x is: `x`
@brisk sage make your life easier and use https://seaborn.pydata.org/generated/seaborn.histplot.html#seaborn.histplot, the y axis should be "number of records in the bin" by default
 civic summit
quick question with plt.errorbar, how do you display mean values in the graph eg x? example attached.
 brisk sage
desert oar
<@!619839614860918797> make your life easier and use https://seaborn.pydata.org/...
brisk sage
desert oar
<@!619839614860918797> make your life easier and use https://seaborn.pydata.org/...
Alright so the x axis is the amplitude in percentage and the y axis the count how many times this specific amplitude has occurred. Thank you 🙂
desert oar
brisk sage
Alright so the x axis is the amplitude in percentage and the y axis the count ho...
well it's how many times an amplitude occurred in that range of amplitudes
note that the appearance of the histogram can be sensitive to the sizes of the bins
the automatic bin size selection is usually good but not always perfect
desert oar
civic summit
quick question with plt.errorbar, how do you display mean values in the graph eg...
show your code? so i know how to guide you
civic summit
y = [1, 3, 5]
errors = [0.850027426,2.409274091,1.163374401]

plt.figure()
plt.errorbar(x, y, xerr=errors, fmt = 'o', color = 'k')
plt.yticks((0, 1, 3, 5, 6), ('', 'Commercial or Other', 'Medicaid', 'Medicare',''))

```@desert oartrying to display the x values in the graph itself
desert oar
civic summit
```x = [26.72,53.22,36.81]
y = [1, 3, 5]
errors = [0.850027426,2.409274091,1.163...
x = [26.72,53.22,36.81]
y = [1, 3, 5]
errors = [0.850027426,2.409274091,1.163374401]

plt.figure()
plt.errorbar(x, y, xerr=errors, fmt = 'o', color = 'k')

ax = plt.gca()
for x_val, y_val in zip(x, y):
    # Set the offset from the (x, y) point.
    # You will have to experiment to get this to look right.
    offset = (1.0, 1.0)
    ax.annotate(format(x, '0.2f'), (x, y), offset)

plt.yticks(
    (0, 1, 3, 5, 6),
    ('', 'Commercial or Other', 'Medicaid', 'Medicare',''),
)
see
https://matplotlib.org/stable/tutorials/text/annotations.html#annotations-tutorial
https://matplotlib.org/stable/api/_as_gen/matplotlib.axes.Axes.annotate.html#matplotlib.axes.Axes.annotate
civic summit
@desert oarThanks i will definitly take some time to experiment
TypeError: unsupported format string passed to list.format
chilly geyser
Not lying when > 'experiment to get this right'
# "data"
rng = default_rng(0)
x = rng.standard_normal(10)
y = rng.standard_normal(10)
z = rng.standard_normal(10)
plt.figure(dpi=300)
plt.errorbar(x, y, xerr=z, fmt = 'o')

# everything here is 'hard coded' to match above
plt.ylim(-2.5, 1.5)
for idx, (x_val, y_val) in enumerate(zip(x, y)):
    if idx == 5:
        plt.annotate(f"{x_val:.2f}", (x_val, y_val), (x_val, y_val - 0.2))
    else:
        plt.annotate(f"{x_val:.2f}", (x_val, y_val), (x_val, y_val + 0.1))
Image via Colab

I further changed the y-offset to 0.06 due to the 1.30 datapoint but you get the idea
civic summit
ye, i would still be drowning.
 shrewd saddle
I have just started exploring ML with Keras so this may be a very noob question. So, if I am using separate training and testing dataframe, do I need to bother with the validation_split argument? Is using the argument same as only training on a portion of my dataset, or is there anything more to that? Thanks.
pastel anvil
who here has experience with the Azure ML Sdk
tidal bough
shrewd saddle
I have just started exploring ML with Keras so this may be a very noob question....
validation_split is just for randomly splitting your dataset into test and train, yes. You don't need it if you already split it yourself.
shrewd saddle
all right thanks
desert oar
civic summit
TypeError: unsupported format string passed to list.__format__
those should be x_val and y_val inside the for loop. typo.
 hasty kiln

 short heart
When you make a classification model, last layer should have 1 output unit, or units the same number of classes?
 quasi pecan
1 output node is usually used for binary classification @short heart
serene scaffold
I have two dataframes of the same shape with equivalent sets of indices and columns. One has a bunch of floats and the other is booleans. I want to put the first dataframe in a slideshow where each cell that is True in the bool dataframe is underlined. Here are the CSVs: https://paste.pythondiscord.com/iwifipunez.apache
I figure this involves applying some kind of style and saving it to an excel file
desert oar
You can probably do this entirely in excel with conditional formatting
You might be able to apply formatting with openpyxl or whatever the xlsx writing library is
serene scaffold
desert oar
You can probably do this entirely in excel with conditional formatting
I don't wanna learn excel
 uncut barn
is there a way I can only have 2 colors for the points in my graph, they are determined by the values of 1 and -1?
 desert oar
@uncut barn see here maybe? https://stackoverflow.com/a/14779462/2954547

Stack Overflow
I am trying to make a discrete colorbar for a scatterplot in matplotlib
I have my x, y data and for each point an integer tag value which I want to be represented with a unique colour, e.g.
plt.s...
there's also ListedColormap
serene scaffold
Alternatively, I now have a spreadsheet in libreoffice calc, and I just put an asterisk after all the numbers that are special. How could I, for example, change all the cells with an asterisk to bold and remove the asterisk?
uncut barn
desert oar
<@!424703411255246860> see here maybe? https://stackoverflow.com/a/14779462/2954...
thanks but this gives many colors instead of 2 colors
pastel anvil
I don't know if anyone is reading and not responding but I've tried asking like 5 or 6 times
does anyone here have experience with the Azure ML Python SDK
serene scaffold
pastel anvil
I don't know if anyone is reading and not responding but I've tried asking like ...
D:\src\STI\vs\Ops\Py>ff.py login
Traceback (most recent call last):
  File "D:\src\STI\vs\Ops\Py\ff.py", line 43, in <module>
    if args.login:
AttributeError: 'Namespace' object has no attribute 'login'
You got this error because your args object doesn't have a login attribute. It's unrelated to Azure or any data science/machine learning considerations.
chilly geyser

A guide for how to ask good questions in our community.
serene scaffold
chilly geyser
https://pythondiscord.com/pages/guides/pydis-guides/asking-good-questions/#q-is-...
They did ask a question with a code example and error message initially. It probably went ignored because it wasn't actually DS/AI related.
chilly geyser
Repeating the direct question would have been better.
It's essentially also a response to "I've been asking if anyone is good 5x or 6x why is no one listening"
serene scaffold
chilly geyser
Repeating the direct question would have been better.
It's essentially also a re...
I agree
@pastel anvil I see that your argument parser has something related to login in it. You might consult the argparse docs and see if you can figure out why the args object didn't get a login attribute
!docs argparse
arctic wedgeBOT
New in version 3.2.
Source code: Lib/argparse.py
Tutorial
This page contains the API reference information. For a more gentle introduction to Python command-line parsing, have a look at the argparse tutorial.
The argparse module makes it easy to write user-friendly command-line interfaces. The program defines what arguments it requires, and argparse will figure out how to parse those out of sys.argv. The argparse module also automatically generates help and usage messages and issues errors when users give the program invalid arguments.
chilly geyser
serene scaffold
<@!783702705218125854> I see that your argument parser has something related to ...
Looking at the code it's because parse args parses nothing.
Well that's one of the reasons
Indeed it's a little more non #data-science-and-ml
Not exactly sure what to put it under, but I put an example in
#bot-commands message
It's somewhat authy so perhaps #networks but I think the general help would have been best
serene scaffold
@chilly geyser or just the general help system
grave frost
yes
 arctic wedgeBOT
Your model might not be trying to communicate with you, @grave frost, but I am.
grave frost
😐 well shit
arctic wedgeBOT
I love you
grave frost
arctic wedge
*I love you*
plz don't haunt me
arctic wedgeBOT
Just be glad I don't run on 13 billion devices.
grave frost
arctic wedge
Just be glad I don't run on 13 billion devices.
even then, best you can be is a messenger for a mod 😈
 thorn bobcat
#calculate the average
backgroundFrame = np.median(frames, axis=0).astype(dtype=np.uint8)
cv2.imwrite("bg.jpg",backgroundFrame)
cv2_imshow(backgroundFrame)
pls post any better solution for background extraction at #help-grapes
desert oar
pastel anvil
does anyone here have experience with the Azure ML Python SDK
don't ask to ask, you aren't getting answers because your question isn't specific enough and people will have to basically interview you to figure out what you are asking
rigid zodiac
desert oar
don't ask to ask, you aren't getting answers because your question isn't specifi...
so How to ask to ask in this channel? i'm new here sorry
desert oar
rigid zodiac
so How to ask to ask in this channel? i'm new here sorry
it's ok. ask the actual question that you have, providing as much detail as someone would need to be able to start helping you right away.
rigid zodiac
So i have a json data which is kinda long and nasty. and I want to make a dbscan to it but I sort of have 0 idea how to
this is what I have so far ```''' IMPORT LIBRARY '''
import numpy as np
from numpy.random import normal as normal
import matplotlib.pyplot as plt
from mpl_toolkits.mplot3d import Axes3D
import matplotlib.animation as animation
import matplotlib
from threading import Thread
import json
import pandas as pd
from kinesis.consumer import KinesisConsumer
from sklearn.cluster import dbscan
''' Not sure where to keep this '''
nfr = 30 # Number of frames
fps = 10 # Frame per sec
xs = []
ys = []
zs = []
''' Create a 3D dimension with lines'''
fig = plt.figure()
ax = fig.add_subplot(111, projection='3d')
ax.set_xlabel("x")
ax.set_ylabel("y")
ax.set_zlabel("z")
sct, = ax.plot([], [], [], "o", markersize=2)


''' 1st thread
This thread is just a define a value, completely empty and pointless without value'''
def update(ifrm, xa, ya, za):
    a = xa[:]
    b = ya[:]
    c = za[:]
    xs.clear()
    ys.clear()
    zs.clear()
    for idx, val in enumerate(a):
        # print(a[idx])
        sct.set_data(np.asarray(a[idx]), np.asarray(b[idx]))
        sct.set_3d_properties(np.asarray(c[idx]))
''' 2nd Thread'''
def get_data():
    global xs
    global ys
    global zs
    ''' This will be replace with the for loop for kinesis'''


    with open('frame2.json') as f:
        data = json.load(f)
        v6 = data['v6']
        pct = v6
        print(v6)


        ''' Un-assigned value '''
        v6xs = []
        v6ys = []
        v6zs = []
        ''' this is for loops allow user to assign data from live stream toward un-assigned'''
        for i in range(len(pct)):
            zt = pct[i][0] * np.sin(pct[i][2]) + 0.0
            xt = pct[i][0] * np.cos(pct[i][2]) * np.sin(pct[i][1])
            yt = pct[i][0] * np.cos(pct[i][2]) * np.cos(pct[i][1])
            v6xs.append(xt)
            v6ys.append(yt)
            v6zs.append(zt)
        xs.append(v6xs)
        ys.append(v6ys)
        zs.append(v6zs)

# '''' DATA '''
# with open('frame2.json') as f:
#     data = json.load(f)
#     v6 = data['v6']
thr = Thread(target=get_data)
thr.start()
ax.set_xlim(0,5)
ax.set_ylim(0,5)
ax.set_zlim(0,5)
ani = animation.FuncAnimation(fig, update, fargs=(xs,ys,zs), interval=100)
plt.show()
clustering = DBSCAN(eps=0.1, min_samples=5, leaf_size=10).fit(v6)
core_samples_mask = np.zeros_like(clustering.labels_, dtype=bool)
core_samples_mask[clustering.core_sample_indices_] = True
labels = clustering.labels_

# Number of clusters in labels, ignoring noise if present.
n_clusters_ = len(set(labels)) - (1 if -1 in labels else 0)
n_noise_ = list(labels).count(-1)
print('Estimated number of clusters: %d' % n_clusters_)
print('Estimated number of noise points: %d' % n_noise_)

unique_labels = set(labels)
classfication = []
for k in unique_labels:
    class_member_mask = (labels == k)
    xyz = v6[1:3]
    classfication.append(len(xyz))

top_class = [classfication.index(x) for x in classfication if x >= 0.1 * max(classfication)]
print(top_class).```My issue is I dont know how to loop them to be more proficient and dont know how to do 3d dbscan
 wintry pike
anyone know how to configure nightly build for lightgbm for python on macosx? am not able to get attributes such as featurename
the solution proposed is to get the nightly build (https://github.com/microsoft/LightGBM/issues/2784#event-3057803330), but im not sure how it works, appreciate any help.

GitHub
Environment info Operating System : macOS Catalina Version 10.15.2 CPU/GPU model:CPU C++/Python/R version: Python LightGBM version : 2.3.1 Error message I was trying to get the feature name using t...
 latent quest
ValueError: Training and validation subsets have different number of classes after the split. If your numpy arrays are sorted by the label, you might want to shuffle them.
Do you guys know what this means .... I have been searching up online and haven't seen many with this problem.
 karmic ivy
New here, hope I am not breaking any rules (I don't think I am anyway)... Just watched a really amazing 2 hour pandas tutorial on youtube called Pandas From the Ground Up by Brandon Rhodes from Pycon 2015. I would really like to go through the exercises he reviews in the video but ftp links in github are dead
I know this is a long shot but I was hoping someone could point me in the right direction to find the imdb data files referenced in the video tutorial
serene scaffold
@karmic ivy this is the right channel for that. I can't help right now but try providing the video link. A lot of open source datasets are on Kaggle.
@latent quest do you understand what a class is in the context of machine learning? There must be instances of some classes in the training data that aren't in the validation data, and vice versa.
karmic ivy
serene scaffold
<@864720108958122064> this is the right channel for that. I can't help right now...
Thanks Stelercus. Here is the link... https://www.youtube.com/watch?v=5JnMutdy6Fw

"Speaker: Brandon Rhodes
The typical Pandas user learns one dataframe method at a time, slowly scraping features together through trial and error until they can solve the task in front of them. In this tutorial you will re-learn how to think about dataframes from the ground up, and discover how to select intelligently from their abilities to so...
short heart
If my score varies at almost the same accuracy on any model I train (sometimes a bit higher than 0.46 on val, sometimes lower), is that overfit, underfit(accuracy on train is around 0.4-0.6) or some problem with output
 silver sun
Hi everyone! I need help with my Jupyter Notebook. I read in my csv file and all the data in column A is either True or False. I need to change True to 1 and False to 0. How can I do that in pandas?
 somber prism
hi guys, can someone help me how to interpret this plot. i took this dataset from kaggle https://www.kaggle.com/tejashvi14/travel-insurance-prediction-data, also i encoded all the 'yes or no' to 0 or 1
 lapis sequoia
hello, are there any communities around the apache airflow tool on discord or elsewhere? thanks
 deep crypt

how do I remove rows with particular duplicate values of columns in pandas data frame ? i did not wish to remove all duplicates , i wish to keep some.
it's deleting all the duplicates , i dont wish to do that
somber prism
@deep crypt df.reset_index().groupby(df.columns.tolist())["index"].agg(list).reset_index()
this will get all the duplicate values
 hollow flicker
 rancid heath
i need to learn data science
rancid heath
i need to learn data science
i dont know video but i can recommend a book
hollow flicker
 rancid heath
send amazon link
hollow flicker
Python Data Science Handbook: Essential Tools for Working with Data - Kindle edition by VanderPlas, Jake. Download it once and read it on your Kindle device, PC, phones or tablets. Use features like bookmarks, note taking and highlighting while reading Python Data Science Handbook: Essential Tools for Working with Data.
rancid heath
like
hollow flicker
all remaining topics are explained basically
hollow flicker
Yeah like that
rancid heath
u have it?
hollow flicker
Yes, i have this book
somber prism
deep crypt
how do I remove rows with particular duplicate values of columns in pandas data ...
another way to get the indices of duplicate values [ind for ind,i in enumerate(df.duplicated(subset = ['league_to'])) if i]
lethal dust
Can any1 help me debug my code?
import numpy as np

class BackPropagation:
    # Class members
    layerCount = 0
    shape = None
    weights = []


    # Class methods
    def __init__(self,layerSize):

        # Layer info
        self.layerCount = len(layerSize)
        self.shape = layerSize

        # Input/Output data from last Run
        self._layerInput = []
        self._layerOutput = []

        # Creating the weight arrays
        np.random.seed(19)
        for (l1,l2) in zip(layerSize[:-1],layerSize[1:]):
            self.weights.append(np.random.normal(scale=0.1,size=(l2,l1+1)))


    # Run methods
    def Run(self,input):
        InCases = input.shape[0]
        # Clear out the previous intermediate value lists
        self._layerInput = []
        self._layerOutput = []
        # Run it
        for index in range(self.layerCount):
            if index == 0:
                layerInput = self.weights[0].dot(np.vstack([input.T,np.ones([1,InCases])]))
            else:
                layerInput = self.weights[index].dot(np.vstack([self._layerOutput[-1],np.ones([1,InCases])]))

            self._layerInput.append(layerInput)
            self._layerOutput.append(self.sgm(layerInput))

        return self._layerOutput[-1].T


    # Transfer functions
    def sgm(self,x,derivative=False):
        if not derivative:
            return 1/(1+np.exp(-x))
        else:
            out = self.sgm(x)
            return out*(1-out)


if __name__ == "__main__":
    bpn = BackPropagation((2,2,1))
    print(bpn.layerCount)
    print(bpn.weights)

    inp = np.array([
        [0,0],
        [1,1]
    ])
    out = bpn.Run(inp)
    print("Input: {}\nOutput: {}".format(inp,out))
IndexError Traceback (most recent call last)
<ipython-input-26-d8717ea4ae56> in <module>
59
60 inp = np.array([[0,0],[1,1]])
---> 61 out = bpn.Run(inp)
62 print("Input: {}\nOutput: {}".format(inp,out))
63
<ipython-input-26-d8717ea4ae56> in Run(self, input)
36 layerInput = self.weights[0].dot(np.vstack([input.T,np.ones([1,InCases])]))
37 else:
---> 38 layerInput = self.weights[index].dot(np.vstack([self._layerOutput[-1],np.ones([1,InCases])]))
39
40 self._layerInput.append(layerInput)
IndexError: list index out of range
This is the error I'm getting
 grand mantle
list index out of range means you are accessing a value by a key which is not in a range of keys.
list[] ; it has 100 key (i=0,1,2...)
if you are accessing i=101 or 102 and so on.
Then your error becomes IndexError: list index out of range
 near oasis
I’m running text analysis on fake and real articles to find any differences between them. What factors can I try? I have tried: sentiment, article length, number of authors, reputation of authors, and named entity recognition
What else can I try?
I have about 10k fake and 10k real articles with authors, title and label for each.
lapis sequoia
Hi, does anyone know how to determine number of layers and dense in neural network ?
 tender hearth
lapis sequoia
Hi, does anyone know how to determine number of layers and dense in neural netwo...
tender hearth
lapis sequoia
Hi, does anyone know how to determine number of layers and dense in neural netwo...
i mean... you'd typically know 😆... but if you're using TensorFlow model.summary() gives you an overview of the structure of the network
you can read the docs on how to get the specifics
 half cloud
Hello friends, I am an information systems student at the end of the first year, I decided to take a project for the summer period, the direction is data science, I created a code that "pulls" titles and date from the specific economic site through 'scarping'. The next goal is to try and quantify the information so I can check Or a connection between prices in the capital market and positive / negative words in a certain context for the company itself or the market in general, I currently use a file that contains a lot of positive words but the method is ineffective because a negative link word is enough before the positive word and misinformation is created, I read and found that there is a method N-gram, does anyone have any idea about the above model ?, is it relevant to ML ?, and do you think a first year student has the tools to face the N-Gram challenge, thank you very much for answering, hoping there will be some 🙂
 late shell
Hello, I've seen some of my friends directly jump onto Deep Learning. Since Deep Learning is a subset of Machine Learning, isn't it more important & wise to learn Machine Learning first and then move onto Deep Learning?
rigid zodiac
Hello have anyone do dbscan for 3 dimensional data before? If you have can you show me a sample code
somber prism
guys i have a doubt, if i have large values in some columns and also 0-1 values in other columns , is it better to scale the whole dataset or only the large values ?
somber prism
late shell
Hello, I've seen some of my friends directly jump onto Deep Learning. Since Deep...
python -> dsa -> statistics & prob -> machine learning -> deep learning . this is how i am doing it , i am not in deep learning yet
 shrewd river
which framework/tool should I use for machine learning?
lapis sequoia
somber prism
guys i have a doubt, if i have large values in some columns and also 0-1 values ...
You mean using min max scaler ? Only scale the large value is enough because min max scaler will result to 0-1 values anyway
lapis sequoia
shrewd river
which framework/tool should I use for machine learning?
Python is popular
shrewd river
I know but you would need some framework right
You should build it from scratch
I assume
late shell
somber prism
python -> dsa -> statistics & prob -> machine learning -> deep learning . this i...
this is exactly how I have planned as well, except I'm not able to give much time to dsa
late shell
shrewd river
I assume
psychh..
somber prism
lapis sequoia
You mean using min max scaler ? Only scale the large value is enough because min...
for other scalers too
lapis sequoia
somber prism
for other scalers too
I think its better if you have the same scale in all of your variable so that they can contribute equally to the model
desert oar
+1, you should scale all values to the same range
maybe clipping outlier values is a valid transformation, but that's different
rigid zodiac
Can json data type be used in dbscan?
desert oar
rigid zodiac
Can json data type be used in dbscan?
not directly. you would need to define the "distance" between two elements
rigid zodiac
like for the min_sample and eps?
rigid zodiac
I have a json data file, it's a radar detection. so the whole thing is continuous
I have the 3d plot of it by using loops and i'm trying to figure out how to dbscan it
late shell
late shell
Hello, I've seen some of my friends directly jump onto Deep Learning. Since Deep...
hey @desert oar , could I have your opinion on this please?
desert oar
it assume if you have a 3d plot, you are able to interpret the data as a collection of triples
i.e. a 3-column matrix or data table
in that case you should get the data into said matrix or tabular format, using numpy or pandas
then you can put that into dbscan
desert oar
late shell
hey <@!389497659087650836> , could I have your opinion on this please?
"deep learning" just means "deep neural networks", i.e. it's one of many tools used in the process of machine learning. it's probably a good idea to focus on the basics first before you start trying to work with sophisticated complicated models. but i wouldn't focus too much on whether it's a "subset" of machine learning. machine learning is a type of problem you can work on, deep learning is a specific kind of model that happens to have a cool-sounding name.
rigid zodiac
desert oar
what is in the json data file? numbers? my mom's address?
I wish it could be that cool to have your mom address, but it only contain xyz coordinate and mystery 4th data that my manager wont reveal. Here is what It look like
 desert oar
is this for an internship or something? or an exam?
desert oar
you shouldn't have any problem reading that v6 data into a numpy array
late shell
desert oar
"deep learning" just means "deep neural networks", i.e. it's one of many _tools_...
thanks 👍
 muted falcon
Hello guys. I am reading a book 9n pytorch and would like some help understanding this part:
 desert oar
this was written by someone who forgot what it's like to be a beginner at something
that is not an easy paragraph to parse, nor is that an easy example to understand
i assume weights is a 1-d vector?
do you understand what the first line does?
silver sun
Hi everyone! I need help with my Jupyter Notebook. I read in my csv file and all the data in column A is either True or False. I need to change True to 1 and False to 0. How can I do that in pandas?
muted falcon
desert oar
do you understand what the first line does?
Nope
muted falcon
desert oar
i assume `weights` is a 1-d vector?
Yes
desert oar
silver sun
Hi everyone! I need help with my Jupyter Notebook. I read in my csv file and all...
all of these should work, although if you have missing values (None or NaN) you might need to do something else:
df['A'] = df['A'].replace({False: 0, True: 1})
df['A'] = df['A'].map({False: 0, True: 1})
df['A'] = df['A'].astype(int)
Thank you so much!!! What do you suggest doing if I have NaN? Can I do df.dropna()
desert oar
muted falcon
Nope
https://pytorch.org/docs/stable/generated/torch.unsqueeze.html it adds a dimension to a tensor. so for example it turns [1,2,3] (shape (3,)) into [[1],[2],[3]] (shape (3, 1))
desert oar
silver sun
Thank you so much!!! What do you suggest doing if I have NaN? Can I do df.dropna...
it looks like they've updated the defaults to map and replace, either one should work as-is
@muted falcon ```ipython
In [12]: x = torch.tensor([1, 2, 3, 4])
In [13]: x.unsqueeze(0)
Out[13]: tensor([[1, 2, 3, 4]])
In [14]: x.unsqueeze(1)
Out[14]:
tensor([[1],
[2],
[3],
[4]])
In [15]: x.unsqueeze(-1)
Out[15]:
tensor([[1],
[2],
[3],
[4]])
the number in unsqueeze says which dimension to add
-1 is an alias for "at the end"
@muted falcon quiz time!
You have weights = torch.tensor([0.25, 0.5, 0.75, 0.5, 0.75]).
- What is
weights.shape? - What is
weights.unsqueeze(-1).unsqueeze(-1).shape?
cedar sun
OOM when allocating tensor with shape[12,64,320,320] and type float on /job:localhost/replica:0/task:0/device:GPU:0 by allocator GPU_0_bfc
     [[node gradient_tape/u2netmodel/u2net/conv2d_112/Conv2D/Conv2DBackpropInput (defined at <ipython-input-13-2838726e64e4>:12) ]]
Hint: If you want to see a list of allocated tensors when OOM happens, add report_tensor_allocations_upon_oom to RunOptions for current allocation info.
 [Op:__inference_train_function_27444]

Errors may have originated from an input operation.
Input Source operations connected to node gradient_tape/u2netmodel/u2net/conv2d_112/Conv2D/Conv2DBackpropInput:
 u2netmodel/u2net/conv2d_112/Conv2D/ReadVariableOp (defined at <ipython-input-2-e5542e92ca00>:388)

Function call stack:
train_function```Why am i getting this error on colab?
first time i get it, just running same colab file as yesterday
lapis sequoia
im planning to learn a DS library...... what are some good/worthwhile ones to learn?
 ripe forge
In general? Scikit learn is almost a must have
For deep learning either pytorch or tensorflow is fine.
desert oar
you'll also want numpy, scipy, and pandas
matplotlib and seaborn for graphics
those are probably the core libraries: numpy, pandas, scipy, matplotlib, scikit-learn, tensorflow or pytorch
not to mention knowing python itself decently well
but i recommend not focusing too much on "how to use X library"
focus more on actual data analysis
deep crypt
somber prism
this will get all the duplicate values
thanks alot man , ill try it out
lapis sequoia
desert oar
focus more on actual data analysis
ok i see
doesn't that have to do with statistics though
not rly programming as much
muted falcon
desert oar
https://pytorch.org/docs/stable/generated/torch.unsqueeze.html it adds a dimensi...
Thanks . Sorry for the late reply. There is no difference between -1 and 1
umbral ferry
@desert oar hello 😅
I am trying to do something else with the model I created. I'm trying to determine how the features I have directly affect the output. Ideally, I'd know "if this feature is a 1 instead of a 0 (or 0 instead of a 1) your output will increase/decrease by this amount on average". I think I've figured out a method to do this, but I'm wondering if you know any built in features in xgboost to do this easier, or if this type of analysis is its own field/subject
so instead of just using model.feature_importances_, I'd have a number to classify the direct effect of that feature on the output
 bronze skiff
lapis sequoia
doesn't that have to do with statistics though
bronze skiff
lapis sequoia
doesn't that have to do with statistics though
programming is easy, trivial almost to learn on the job-- statistics is the metric in which i'll hire someone
lapis sequoia
desert oar
Programming is a tool, a means to an end
wow ive never rly thought of it that way
lapis sequoia
bronze skiff
programming is easy, trivial almost to learn on the job-- statistics is the metr...
oh.......... would you hire me if i had no programming experience but a pHD in statistics
bronze skiff
unlikely, since most likely statisticians have at least programmed in R (and I wouldn't even count them if they've never ran an MCMC on something before)
 karmic cliff
I’m reading the Numpy docs, there’s a big section about “routines”, am I correcting in assuming routine is a synonym for function?
Or is there another definition
 long lake
Hi Guys,
My article on data architect. Let me know if you like it. Open for your feedback.
https://medium.com/geekculture/how-to-become-a-data-architect-1b60dc0762a2

Medium
Data Science is an incredible force driving today’s businesses. Almost all organizations attempt to harness the power of Data Science in…
 boreal summit
Hello everyone, I want to use Neural nets to solve a binary classification problem. The shape of the input data when I check is (12079, 15). How and what do I set my input shape to?
Thanks in advance.
lapis sequoia
bronze skiff
unlikely, since most likely statisticians have at least programmed in R (and I w...
ok i see. well, if i wanted to learn machine learning, where would i start?
 dusty cloud
What generally are the techniques to handle infinity data in machine learning during preprocessing stages?
bronze skiff
lapis sequoia
ok i see. well, if i wanted to learn machine learning, where would i start?
pick up a copy of bishop's book and begin
desert oar
muted falcon
Thanks . Sorry for the late reply. There is no difference between -1 and 1
Only in this particular case. If the tensor already has 3 dimensions then -1 means "2"
desert oar
umbral ferry
so instead of just using model.feature_importances_, I'd have a number to classi...
How are you calculating this? Check out "partial dependence" as well as the SHAP technique https://ing-bank.github.io/probatus/tutorials/nb_shap_model_interpreter.html
Validation of binary classifiers and data used to develop them
short heart
Is it ok to change loss type if im training a pre trained model on new categorical data if it was trained on binary
desert oar
bronze skiff
pick up a copy of bishop's book and begin
+1 for bishop
desert oar
short heart
Is it ok to change loss type if im training a pre trained model on new categoric...
If you are doing transfer learning (replacing top layer of a NN with your own) then that's fine. Otherwise you'll have to provide more info
short heart
ok then next question
it tells me something like I have to change dense layer name
i deleted last layer from my transf learn model and replaced it with another dense layer
now it just randomly throws an error
not always tho
desert oar
What is the error
umbral ferry
My idea was to make predictions on the test set, calculate the average output variable (profit), then make predictions on the same test set except I flip one of the features (1 to 0, 0 to 1), then calculate the average output and compare the two
short heart
ValueError: All layers added to a Sequential model should have unique names. Name "dense" is already the name of a layer in this model. Update the `name` argument to pass a unique name.
desert oar
umbral ferry
My idea was to make predictions on the test set, calculate the average output va...
You have reinvented partial dependence 🙂
Look it up, you will like it
umbral ferry
so that's what it's called, I knew it had to exsist
desert oar
short heart
```ValueError: All layers added to a Sequential model should have unique names. ...
Show your code?
short heart
from  keras.models import load_model
model=load_model('/kaggle/input/pneumonia-trained/model.h5')
print(model.summary())
model.pop()
model.add(Dense(4,activation='softmax'))
print(model.summary())
lr = 0.01*0.95
opt = Adam(learning_rate=lr)
model.compile(optimizer=opt, loss='sparse_categorical_crossentropy', metrics=['accuracy'])
and original model
model = Sequential()

model.add(VGG19(input_shape=(600, 600, 3), classes=2, include_top=False, weights=None))
model.add(GlobalAveragePooling2D())
model.add(Dense(128, activation='relu'))
    # model.add(Dropout(0.2))
    # model.add(Dense(256, activation='relu', kernel_initializer='he_uniform'))
model.add(Dense(1, activation='sigmoid'))
    # compile model
lr = 0.01
opt = Adam(learning_rate=lr)
model.compile(optimizer=opt, loss='binary_crossentropy', metrics=['accuracy'])```the only problem I see with it is that some features are mutually exclusive, so I will be predicting the output on impossible inputs, though only 2 out of the 300 features will be impossible
actually there are like 20 groups of about 10 features, if you remember, so only one of those 10 can be a 1, but I will have either all 0s, or two 1s
cardinality of each larger feature group ranges from 2 to 20 ish
 quasi sparrow
Hi everyone, question about using XGBoost for time series. If I use this algorithm, do I get a file as output for inference to use for transfer learning?
short heart
short heart
```ValueError: All layers added to a Sequential model should have unique names. ...
doesnt matter
lapis sequoia
bronze skiff
pick up a copy of bishop's book and begin
wdym by "bishop's book"
short heart
To remove last dense layers in keras vgg19 do I have to just include_top=False?
grand mantle

How to build 2d array datastructure like this?
i mean if i want obstacle of different size it may be fall fully in a grid cell or a portion of obstacle fall into grid cell.
serene scaffold
grand mantle
do you just want a matrix where everything is 0 but black squares are 1?
grand mantle
Yes! Bro
grand mantle
Its in just JPEG format
Can i make the environment map in image format and then convert it to matrix??
serene scaffold
grand mantle
Can i make the environment map in image format and then convert it to matrix??
the fact that it's already an image of a grid will probably help. I just don't know how one would do that as I deal primarily in text.
 proper crag
 scenic vector
pytorch
rigid zodiac
how do you plot 3d data with dbscan
bronze skiff
lapis sequoia
wdym by "bishop's book"
bishop's "pattern recognition and machine learning", a basic text in the ML literature
 cyan grotto
anyone here has experience with aiortc?
 misty flint
hmm i need some ideas for a discussion question
"what do you think is the future of machine learning?"

so many ways you can go, no?
lapis sequoia
bronze skiff
bishop's "pattern recognition and machine learning", a basic text in the ML lite...
Hmm alr I will check it put
Out*
umbral ferry
If some of my features are highly correlated, will including them in my training result in lower model performance than if I had excluded then? I'm not worried about training time
misty flint
its really dataset dependent and depends on how correlated; if youre not worried about training time, i would try both models and check results
grave frost
misty flint
"what do you think is the future of machine learning?"
WBE to the moon!🌛 🚀
grave frost
grand mantle
How to build 2d array datastructure like this?
i mean if i want obstacle of dif...
best way you can do is to check the color of dot of each square whether its black or not and then use that to interpret the shaded boxes, storing it accordingly
 magic dune
Is it possible to make k means clustering with only numpy and matplotlib?
 orchid jay
https://flothesof.github.io/k-means-numpy.html @magic dune
Else, your best bet is probably scipy
 smoky epoch
could someone please explain iloc vs loc? how do you know which one to use etc?
 austere swift
smoky epoch
could someone please explain `iloc vs loc`? how do you know which one to use etc...
austere swift
smoky epoch
could someone please explain `iloc vs loc`? how do you know which one to use etc...
i just think of it as i meaning integer and loc meaning location, so loc is finding based on a key and iloc is finding based on an integer
basically just remember i means integer thats all there is
!d pandas.DataFrame.iloc
arctic wedgeBOT
property DataFrame.iloc```
Purely integer-location based indexing for selection by position.

`.iloc[]` is primarily integer position based (from `0` to `length-1` of the axis), but may also be used with a boolean array.

Allowed inputs are...
Similar names: pd.pandas.DataFrame.iloc
austere swift
!d pandas.DataFrame.loc
arctic wedgeBOT
property DataFrame.loc```
Access a group of rows and columns by label(s) or a boolean array.

`.loc[]` is primarily label based, but may also be used with a boolean array.

Allowed inputs are:
Similar names: pd.pandas.DataFrame.loc
austere swift
arctic wedge
label based
austere swift
arctic wedge
integer position based
smoky epoch
thanks bro, so i can use any but with iloc use integers and loc use labels? @austere swift
austere swift
yeah other than that theyre almost identical
smoky epoch
ah okay thanks
austere swift
they just get data by position
 velvet thorn
smoky epoch
could someone please explain `iloc vs loc`? how do you know which one to use etc...
velvet thorn
smoky epoch
could someone please explain `iloc vs loc`? how do you know which one to use etc...
in general
I find loc more useful most of the time
because it more clearly communicates your intent
iloc has its place though
e.g. timeseries data
the reason is that in general, row-wise position doesn't have any meaning
and column-wise position is better represented with column names
but there are exceptions, and that's when iloc comes in
smoky epoch
ahh okay
im so dumb idk what i pressed but how do i turn this cell back into like normal code like the cell below..
 desert oar
what notebook platform is this? doesn't look like jupyter notebook, jupyterlab, or colab
smoky epoch
kaggle
desert oar
ah, i haven't used their notebook thing. maybe in the "..." in the top right you can change it? there's probably keyboard shortcut
smoky epoch
doing this free data science course thing
desert oar
in jupyter iirc it was c?
select the cell without starting text input and press c? its been a while
cedar sun
yo
given a trained model
can u use somehow to give him a class and make it make an img it thinks will match that class_
?
pastel anvil
does anyone know how to save Pipeline or Pipeline run objects to a file from Azure ML
serene scaffold
pastel anvil
does anyone know how to save Pipeline or Pipeline run objects to a file from Azu...
Try showing the code
As a reminder from last time, don't frame your questions in terms of who might be able to answer them. Instead, ask the question and provide information that makes it easy to jump into.
silver sun
Hi Everyone! I need help with my Jupyter Notebook project. I have Column A that stores names and column B that's stores ages. I want to group the names if they are over 50 years old. How would I do that?
 glossy charm
HI guys. Question: Does anyone know how to transfer balance sheet data from financial annual reports (pdf format) to Excel (csv) using Python (or any automated process ideal fro large number of reports)? (Camelot module doesn't work for me because Ghostscript is not installing properly on system)
serene scaffold
silver sun
Hi Everyone! I need help with my Jupyter Notebook project. I have Column A that ...
sounds like this is a pandas question. jupyter notebook is an environment
if the name of the dataframe is df, it would be something like df[df['B'] > 50] to select rows where the value is B is over 50.
silver sun
serene scaffold
if the name of the dataframe is `df`, it would be something like `df[df['B'] > 5...
Thank you .Yes my bad it is a pandas question. What about column A? I need to collect the users whose age is greater than 50.
serene scaffold
silver sun
Thank you .Yes my bad it is a pandas question. What about column A? I need to co...
you can use .loc to select by a condition and then by a column
!docs pandas.DataFrame.loc
arctic wedgeBOT
property DataFrame.loc```
Access a group of rows and columns by label(s) or a boolean array.

`.loc[]` is primarily label based, but may also be used with a boolean array.

Allowed inputs are:
Similar names: pd.pandas.DataFrame.loc
silver sun
serene scaffold
you can use `.loc` to select by a condition and then by a column
So would it be df1 =df.loc[(df["A"] >50)]. Would that sort the B column for ages greater than 50?
lapis sequoia
Df[df['A'] > 50] is enough
serene scaffold
lapis sequoia
Df[df['A'] > 50] is enough
not exactly. df['A'] > 50 isn't even what they're trying to select for
serene scaffold
silver sun
So would it be df1 =df.loc[(df["A"] >50)]. Would that sort the B column for age...
is "sort" actually the operating you're trying to do?
or are you trying to filter?
>>> df = pd.DataFrame([[1, 2], [4, 5], [7, 8]],
...  index=['cobra', 'viper', 'sidewinder'],
...  columns=['max_speed', 'shield'])

>>> df
            max_speed  shield
cobra               1       2
viper               4       5
sidewinder          7       8

>>> df.loc[df['shield'] > 6, ['max_speed']]
            max_speed
sidewinder          7
This example illustrates what you're supposedly trying to do.
You'll probably get more than one row for your case. If you're actually trying to sort the dataframe, that's a different question. you can also sort the resulting dataframe after you filter.
silver sun
serene scaffold
or are you trying to filter?
I think filter because I want to use the names of the people who is greater than 50 in a histogram or scatter plot with another column.
I have a csv file I'm reading from.
 ocean hatch
grand mantle
grand mantle
ocean hatch
grand mantle
grand mantle
Anyone has idea?
 hasty grail
grand mantle
Anyone has idea?
hasty grail
grand mantle
Anyone has idea?
You could start with using the PIL or OpenCV library to load the image as a NumPy array
Assuming that the cell size is constant, you can then iterate through the array with strides corresponding to the cell size and take one pixel from each cell
grand mantle
That means OpenCV or PIL will convert the consistent grid image to Numpy array
hasty grail
Yes but it includes all of the pixels, including the borders
 high latch
Where could I learn about these?
a. Problem Statement,
b. Hypothesis,
c. Exploratory Data Analysis,
d. Initial Findings,
e. Deep Dive Analysis
grand mantle
hasty grail
Yes but it includes all of the pixels, including the borders
is there any blog or guidelines in your hand?
 viral moat
Hey guys can anyone help me on a small doubt ?
 copper loom
viral moat
Hey guys can anyone help me on a small doubt ?
copper loom
viral moat
Hey guys can anyone help me on a small doubt ?
yes
viral moat

Who can i convert this two for loops in to two line
I am working in a data science field so the code need to be optimize
Thats why
If any one can solve then please help me out of this
short heart
ok this is annoying. I trained model on binary classif pneumonia dsert for transfer learning and then trained it on covid type categorical classification
now im checking accuracy on val and it gives me 0.26
last time i had 0.26 i messed up binary with categorical
but whats wrong now?
copper loom
viral moat
Who can i convert this two for loops in to two line
i dont get what you want to do ...like i dont see a way to optimize those two for loops
unless you want to just make the code cleaner and write them in better way ....but this is simple to understand
viral moat
copper loom
unless you want to just make the code cleaner and write them in better way ....b...
Actually aim is to remove that for loop because its executed every time and the complexity increase which is not a good idea because i want to deploy it on production
short heart
when doing transfer learning, should I remove ALL last dense layers and change them with new ones to train on another dset?
copper loom
viral moat
Actually aim is to remove that for loop because its executed every time and the ...
so you want a solution other than loops ....if your requirement is iteration you will have to use loops
try using a function and call it in your model
hasty grail
grand mantle
is there any blog or guidelines in your hand?
Not really
I assume that you are familiar with NumPy already
 candid oracle

i am having problem with this code
when i copy this code to my local machine it shows error

 viscid niche
i need to remove all rows(from pandas data frame) with duplicated values in dt column and this rows also must have the same value in order_id column. My code is not working(runs infinitely)
for order in df['order_id'].unique():
  df[(df['order_id']==order) & ~df['dt'].duplicated()]
is there a barebones version of TensorFlow out there such that I can load and use my trained model to make predictions? I plan to release a package with the model that I trained and having TensorFlow as a dependency would be really terrible
tender hearth
Isn't that for mobile devices?
lapis sequoia
Hey anyone here had experience working with plotly? (Not a help question, just wondering how was your experience with it)
 midnight stag
Can anyone help me in solving this problem

 bright mantle
I live in Dominican Republic and I'm doing a bachelor's degree in economics. I would perfectly be happy with an unpaid internship, I just want to learn as much as I can and get some experience
lapis sequoia
bright mantle
I live in Dominican Republic and I'm doing a bachelor's degree in economics. I ...
Upgrade your portofolio, do some online classes, work with data science project (a lot of free online project e.g. kaggle)
desert oar
midnight stag
Can anyone help me in solving this problem
what have you tried so far?
 frank pumice
Is there a way to use Pandas to make every row of a CSV a dictionary? Right now I can use to_dict() and make my entire csv a dict and it looks like;
{'artist.title==': 'Against Me!', 'album.title': 'as the eternal'}
Is there any way to make it like;
{'artist.title==': 'Against Me!'}, {'album.title': 'as the eternal'}
My code is like;
dataframe = pd.read_csv(path, header=None, index_col=0, squeeze=True) playlist_dict = dataframe.to_dict()
I tried dict('records') but that doesnt seem to be useful here
desert oar
frank pumice
Is there a way to use Pandas to make every row of a CSV a dictionary? Right now ...
can you give an example CSV and show your current code? i don't quite understand the output format
your data looks like this:
artist.title,album.title
Against Me!,as the eternal
and you want it to look like this?
[
  [{'artist.title': 'Against Me!'}, {'album.title': 'as the eternal'}]
]
i can help you do that but.... why?
frank pumice
desert oar
can you give an example CSV and show your current code? i don't quite understand...
CSV is
artist.title==,Against Me!
album.title,as the eternal
Code is
dataframe = pd.read_csv(path, header=None, index_col=0, squeeze=True) playlist_dict = dataframe.to_dict() print(playlist_dict)
Yes. The above code gives me
{'artist.title==': 'Against Me!', 'album.title': 'as the eternal'}
But I'd like it t be two dicst
desert oar
this isn't really a "CSV"
artist.title==,Against Me!
album.title,as the eternal
Each line a dict
desert oar
oh i see
so these aren't really headings
this is a weird format, how did you end up with this data
frank pumice
It is a csv. Just a simple one for now
No headings
Left is key and right is value
desert oar
i see, that's an unusual way to do it
frank pumice
That's exactly what pandas to_dict() is for
frank pumice
I dont mean it is specifically for any one things, but this is one of its use cases
To turn a dataframe into a dict
desert oar
the first issue is that this isn't a dataframe, it's a Series, because of your squeeze=True
frank pumice
Yeah but I jsut threw that in there It can go
I wanted to squash it so al lI was left with was my dict thats why I did it. More of a test
So can I make each row a dict? Do i need to loop?
desert oar
!eval @frank pumice ```python
import io
import pandas as pd
data_txt = """
artist.title==,Against Me!
album.title,as the eternal
"""
playlist_series = pd.read_csv(
io.StringIO(data_txt),
header=None,
names=['key', 'value'],
index_col=['key'],
squeeze=True,
)
playlist_dict = [{key: value} for key, value in playlist_series.items()]
print(playlist_dict)
@desert oar :white_check_mark: Your eval job has completed with return code 0.
[{'artist.title==': 'Against Me!'}, {'album.title': 'as the eternal'}]
however this doesn't make sense for a playlist format, how are you going to have multiple songs in this?
frank pumice
That's in code. This is the plexapi. This particular piece is for Smart Playlist creation. It can take filters as a dict. You Can basically do this where and means **meet all **criteria and or **means meet **any.
                            {
                                'and': [
                                    {'artist.title': 'soul coughing'},
                                    {'album.title': 'Irresistible'}
                                ]
                            },
                            {'album.title': 'nervous'},
                            {'album.title': 'night'}
                        ]
}```Let me test your example. Really appreciate it.
I should have said Smart Playlists are built on dynamic criteria. ^ If you want it to build tracks then you use libtype = tracks.
@desert oar Works flawlessly!!!!
So the .items() is what generates the ucrly brackets?
LOL NM I'm dumb, I see it and I read this
https://pandas.pydata.org/pandas-docs/stable/reference/api/pandas.DataFrame.items.html
Thanks again!
This works a lot better because it is more fluid too.
 pearl ice
high latch
Where could I learn about these?
a. Problem Statement,
b. Hypothesis,
c. Explora...
pearl ice
high latch
Where could I learn about these?
a. Problem Statement,
b. Hypothesis,
c. Explora...
Did you ever find resources for this?
hollow flicker
@pearl ice @high latch https://github.com/josephmisiti/awesome-machine-learning/blob/master/books.md
GitHub
A curated list of awesome Machine Learning frameworks, libraries and software. - josephmisiti/awesome-machine-learning
Maybe this help you
pearl ice
hollow flicker
<@663166612488323083> <@!277018323672236032> https://github.com/josephmisiti/awe...
oh nice 
 ripe forge
what would the end result look like? you have to notice that this is not the only column with different values, look at sales also. how does that behave
and for product, what should the end result be
copper loom
i want to create a new column
which will contain all products if the order id is same
ripe forge
more specific. how exactly will it hold the data
is it a concatenated string? a list?
actually think through and describe how the output will be
 ripe forge
okay, so concatenation with a comma. that looks fine. do you care about the other columns?
copper loom
no
what i was trying to do ...it merged all the columns
i want it to specifically just add the product items ...grouped by ID
ripe forge
use a groupby. Something like df.groupby('Order ID')['Product'].apply(lambda x: ",".join(x))
(untested)
copper loom
it did give me the result not sure its the right one though
but when i add it to a new col it just added NAN values
 ripe forge
it's a grouped column, so it would have less rows than your whole df
and i imagine during assign it's also probably trying to use indexes as well
again, you have to decide: what did you want this assignment to look like. did you want the values to repeat across all occurrences of order id that are the same? if so, you probably need a join/merge of some sort
copper loom
duplicate['Grouped'] = duplicate.groupby('Order ID')['Product'].transform(lambda x: ','.join(x))
ripe forge
dont assign to duplicate directly
copper loom
this works but
A value is trying to be set on a copy of a slice from a DataFrame.
Try using .loc[row_indexer,col_indexer] = value instead
copper loom
copper loom
A value is trying to be set on a copy of a slice from a DataFrame.
Try using .lo...
this error
ripe forge
thats not an error, it's a warning
depending on your use case, it may be a false positive, or it may be genuine. that warning usually gives a link also iirc. i highly recommend reading it if you have time
ripe forge
you arent, exactly. that message is a bit...crude, let's just say.
im guessing duplicate is a "view" of another complete df
this is something where i really recommend going through the link the warning gives
copper loom
yes its a copy of a df
lapis sequoia
Hi... if i use activation = tanh in neural network do i need to scale my target into -1 to 1 ?
copper loom
ripe forge
this is something where i really recommend going through the link the warning gi...
nvm thanks i am just not able to understand that statement i just copied it
 digital folio
Hello,
Does anyone know why my whiskers at x axis' 21,23,20' are not touching the top ?
 ripe forge
depends, whiskers dont necessarily mean "mark the highest and lowest points". unfortunately whiskers are not fixed in definition afaik. so you have to see what definition the code/library used for this plot uses
it might be using the 1.5* IQR variant now that i look at it
desert oar
i think most tools do 1.5*IQR by default, that's the "original" definition
copper loom
@ripe forge i got rid of the warning
digital folio
I am using tableau
So you guys heres the problem, my median is wrong for 20,21,23. What should I do?
ripe forge
uh..median is wrong?
digital folio
thats right, whiskers is not including those values on the celing
ripe forge
median is a rather simple calculation, im sure the tool has it right.
it's probably using the 1.5* IQR variant, that's why it doesnt touch the top.
whiskers dont have to touch the ends.
digital folio
ripe forge
median is a rather simple calculation, im sure the tool has it right.
no no i am confirmed it is not including those values while calculating median inside the whisker box
In addition to it, I think it is not including those set of values because they are outliers?
 digital folio
ripe forge
median is a rather simple calculation, im sure the tool has it right.
digital folio
ripe forge
median is a rather simple calculation, im sure the tool has it right.
damn @ripe forge thats true, median remains the same in all the cases .
ripe forge
im semi sad you didn't ask about the part i was hoping you would have asked by now. do you know what's the 1.5 * IQR referring to? if not, why didn't you ask about it till now.
digital folio
lol
ripe forge
from wikipedia: "From above the upper quartile, a distance of 1.5 times the IQR is measured out and a whisker is drawn up to the largest observed point from the dataset that falls within this distance. Similarly, a distance of 1.5 times the IQR is measured out below the lower quartile and a whisker is drawn up to the lower observed point from the dataset that falls within this distance. All other observed points are plotted as outliers."
digital folio
 ripe forge
this is why whiskers dont touch the top and bottom parts. but yeah, dont hesitate to ask when you're not sure about something. the worst thing you can do to yourself is to keep quiet and not ask
digital folio
so what is Q and R?
ripe forge
good! IQR stands for interquantile range. Interquartile range (IQR) : is the distance between the upper and lower quartiles.. it's basically Q3 - Q1.
you can also refer to this for details: https://en.wikipedia.org/wiki/Box_plot
so essentially, whiskers will only be drawn upto a certain distance. everything beyond is treated as an outlier in this kind of whisker plot
that distance is defined based on IQR.
digital folio
so Q3 = sum(battery starting) @ripe forge ?
ripe forge
q3 is basically 3rd quantile. its the 75% mark. no sum involved. same idea as median (where median is Q2, 50% mark)
so if you arranged your data and divided it into 4 pieces instead of 2, you'd have quantiles.
refer to this portion of the wikipedia specifically https://en.wikipedia.org/wiki/Box_plot#Elements
digital folio
awesomee
hey not tough
so q3-q1 = IQR
and than we multiply that with 1.5
but why 1.5 ?
what make it so special ?
@ripe forge
ripe forge
good question! this link probably explains it decently enough, but the idea was, honestly it was chosen based on some estimates for what point would be "okayish" based on normal distribution
Why We Multiply 1.5 to IQR for Outlier Removal?.
so really, there's not a "perfect" reason for why specifically 1.5
it just...became convention as a good enough estimate
digital folio
is it universal ?
and what other values can be used other than 1.5?
ahh it is already there
 serene scaffold
 hoary wigeon
do you understand what the error message means?
serene scaffold
hoary wigeon
I just know that the shape of dataframe is fine
can you show X_train and y_train as text (no screenshots)?
serene scaffold
hoary wigeon
shall i share `X_train.columns` ?
how about you just take the dataframe that it's from and do print(df.head().to_csv())
hoary wigeon
seriously ?
hoary wigeon
1151,5,7.290292882446597,2.0,1466.0,1,1959,0,0,0,1,0,1,0,0,0,1,0,0,0,0,0,0,0,0,1,0,0,0,0,0,1,0,0,0,0,0,0,0,1,0,0,0,0,0,1,0,0,0,0,1,0,1,0,1,0,0
600,8,7.55171221535131,2.0,1058.0,2,2005,0,0,0,1,0,1,0,0,0,1,0,0,0,0,0,0,0,0,1,0,0,0,0,0,1,0,0,0,0,0,0,0,1,0,0,0,0,1,0,0,0,1,0,0,0,1,1,0,0,0
215,5,7.119635638017636,1.0,1070.0,1,1957,0,0,0,1,0,1,0,0,0,1,0,0,0,0,0,0,0,0,1,0,0,0,0,0,1,0,0,0,0,0,0,0,1,0,0,0,0,0,1,0,0,0,0,1,0,1,0,0,1,0
135,7,7.427738840532894,2.0,1304.0,2,1970,0,0,0,1,0,1,0,0,0,1,0,0,0,0,0,0,0,0,1,0,0,0,0,0,1,0,0,0,0,0,0,0,1,0,0,0,0,0,1,0,0,0,0,1,0,1,0,0,0,1
816,5,6.915723448631314,1.0,1008.0,1,1954,0,0,0,1,0,1,0,0,0,1,0,0,0,0,0,0,0,0,1,0,0,0,0,0,1,0,0,0,0,0,0,0,0,1,0,0,0,0,1,0,0,0,0,1,0,1,0,0,0,1```for X_train and X_test its working fine
serene scaffold
great. which columns did you use for x and y?
hoary wigeon
im tesing my df_test an another data set
with same number of columns, and same sequence
serene scaffold
which column is y?
hoary wigeon
serene scaffold
which column is y?
1151,11.917723684090689
600,12.524526376648708
215,11.80894766169701
135,12.066810578196666
816,11.827736204810265```okay great. is X every other column?
serene scaffold
can you show me the lines where X_train and y_train are created?
hoary wigeon
X_train, X_test, y_train, y_test = train_test_split(X_data, y_data, test_size=0.2, random_state=1)
Here it is
serene scaffold
thanks. and what is df_test?
hoary wigeon
i was having 2 csv.
train.csv, test.csv
i used train.csv to fit and test model
after tuning model using train.csv
i created a df_test containing test.csv dataframe
serene scaffold
hoary wigeon
i was having 2 csv.
train.csv, test.csv
i used train.csv to fit and test model...
please do print(df_test.head().to_csv())
my guess is that df_test isn't the same shape as X_train
hoary wigeon
it is
wait
df_test
0,5,6.79794041297493,1.0,882.0,1,1961,0,0,1,0,0,1,0,0,1,0,0,0,0,0,0,0,0,0,1,0,0,0,0,0,1,0,0,0,0,0,0,0,0,1,0,0,0,0,1,0,0,0,0,1,0,1,0,0,0,1
1,6,7.192182058713246,1.0,1329.0,1,1958,0,0,0,1,0,1,0,0,0,1,0,0,0,0,0,0,0,0,1,0,0,0,0,0,1,0,0,0,0,0,0,0,1,0,0,0,0,0,1,0,0,0,0,1,0,1,0,0,1,0
2,5,7.395721608602045,2.0,928.0,2,1997,0,0,0,1,0,1,0,0,0,1,0,0,0,0,0,0,0,0,1,0,0,0,0,0,1,0,0,0,0,0,0,0,0,1,0,0,0,0,1,0,0,1,0,0,0,1,0,0,0,1
3,6,7.38025578842646,2.0,926.0,2,1998,0,0,0,1,0,1,0,0,0,1,0,0,0,0,0,0,0,0,1,0,0,0,0,0,1,0,0,0,0,0,0,0,1,0,0,0,0,0,1,0,0,0,0,1,0,1,0,0,1,0
4,8,7.154615356913663,2.0,1280.0,2,1992,0,0,0,1,0,1,0,0,0,1,0,0,0,0,0,0,0,0,1,0,0,0,0,0,1,0,0,0,0,0,0,0,0,1,0,0,0,1,0,0,0,1,0,0,0,1,0,0,1,0```X_train
1151,5,7.290292882446597,2.0,1466.0,1,1959,0,0,0,1,0,1,0,0,0,1,0,0,0,0,0,0,0,0,1,0,0,0,0,0,1,0,0,0,0,0,0,0,1,0,0,0,0,0,1,0,0,0,0,1,0,1,0,1,0,0
600,8,7.55171221535131,2.0,1058.0,2,2005,0,0,0,1,0,1,0,0,0,1,0,0,0,0,0,0,0,0,1,0,0,0,0,0,1,0,0,0,0,0,0,0,1,0,0,0,0,1,0,0,0,1,0,0,0,1,1,0,0,0
215,5,7.119635638017636,1.0,1070.0,1,1957,0,0,0,1,0,1,0,0,0,1,0,0,0,0,0,0,0,0,1,0,0,0,0,0,1,0,0,0,0,0,0,0,1,0,0,0,0,0,1,0,0,0,0,1,0,1,0,0,1,0
135,7,7.427738840532894,2.0,1304.0,2,1970,0,0,0,1,0,1,0,0,0,1,0,0,0,0,0,0,0,0,1,0,0,0,0,0,1,0,0,0,0,0,0,0,1,0,0,0,0,0,1,0,0,0,0,1,0,1,0,0,0,1
816,5,6.915723448631314,1.0,1008.0,1,1954,0,0,0,1,0,1,0,0,0,1,0,0,0,0,0,0,0,0,1,0,0,0,0,0,1,0,0,0,0,0,0,0,0,1,0,0,0,0,1,0,0,0,0,1,0,1,0,0,0,1```i tested it on LinearRegression() it was working there
but predicted saleprice was slight more than actual.
so i came to lasso
digital folio
ripe forge
good question! this link probably explains it decently enough, but the idea was,...
You there mate?
hoary wigeon
what do you need ?
serene scaffold
hoary wigeon
what do you need ?
the statement where you instantiate the model and then fit it. can you split that into two statements and see which one causes the error?
hoary wigeon
lemme check
digital folio
I have a plot @ripe forge
- When Battery Starting hit is below 53 (whisker), the conversion also decreases (% of pink area increases, and blue decrease which is not good)
- specially when std deviation of session (density) is above 88 (in bar plot),
What do you think about the above 2 points?
 hoary wigeon
Working Fine on (X_train & X_test)
alpha = np.array([0.000001, 0.000005, 0.00001, 0.00005, 0.0001, 0.0005, 0.001, 0.005, 0.01, 0.05, 0.1, 0.5, 1.0, 1.10,1.5])
lassoCV = LassoCV(alphas=alpha, max_iter=5e4, cv=3).fit(X_train, y_train)

lassoCV_rmse = calculate_rmse(y_test, lassoCV.predict(X_test))

print(lassoCV.alpha_, lassoCV_rmse)
df_test is similar to X_train, X_test : (
df_test is working in LinearRegression()
lm = LinearRegression()
lm = lm.fit(X_train, y_train)

y_pred_test_final = lm.predict(df_test)```Re framing question.
quasi sparrow
digital folio
I have a plot <@!107790568251236352>
- When Battery Starting hit is below 53 ...
That's a beautiful plot. What framework did you use?
digital folio
quasi sparrow
That's a beautiful plot. What framework did you use?
Thanks man for appreciation. I am using Tableau
have a job interview, with case study
brisk sage
I have a Dataframe containing the percentage change of several nerve amplitudes and another containing their respective Diameter.
>>> amp.head()
   Timepoint 1  Timepoint 2  Timepoint 3  Timepoint 4  Timepoint 5  Timepoint 6
0     1.277778     0.944444     0.444444          0.0          0.0          0.0
1     0.941176     0.705882     0.352941          0.0          0.0          0.0
2     0.818182     0.490909     0.309091          0.0          0.0          0.0
3     1.000000     0.658537     0.414634          0.0          0.0          0.0
4     0.588235     0.455882     0.323529          0.0          0.0          0.0

>>> dia.head()
0    1.3
1    1.1
2    1.2
3    1.5
4    1.6
I would like to plot the amplitudes in relation to their diameter, like the hue='insert column here' in other seaborn plots.
def plot_rows(df, color="xkcd:red"):
    # Reference: https://stackoverflow.com/questions/32105817/plot-entire-row-on-pandas

    number = df.shape[0]
    rows = range(number)
    fig, ax = plt.subplots(figsize=(8, 8))
    plt.style.use("ggplot")
    for row in rows:
        df.iloc[row].plot(ax=ax, color=color)
        txt = f"All Amplitudes\nN: {number}"
        props = dict(boxstyle='round', facecolor='wheat', alpha=0.5)
        ax.text(0.8, 0.95, txt, transform=ax.transAxes, fontsize=10, verticalalignment="top", bbox=props)

    plt.show()
Although this function does plot the amplitudes row by row, it doesn't show their diameter. Is it possible to do so any other way?
 white venture
Anyone know how to use object detection with TensorFlow?
desert oar
@brisk sage you might want to turn this into "long" data. Note that dia looks like a Series, not a DataFrame - the difference is important.
# Combine the data into one DataFrame
plot_data = amp.copy()
plot_data['Diameter'] = dia
plot_data.index.name = 'RowNumber'

# "Melt" the data from wide to long format
plot_data = plot_data.melt(
    id_vars=['Diameter'],
    var_name='Timepoint',
    value_name='Amplitude',
)

# Convert Timepoint into an integer
plot_data['Timepoint'] = (
    plot_data['Timepoint']
    .str.replace('Timepoint ', '', regex=False)
    .astype(int)
)
then you can use Timepoint, Amplitude, and Diameter in your plot
in general when using seaborn/ggplot you will want your data to be in a format like this


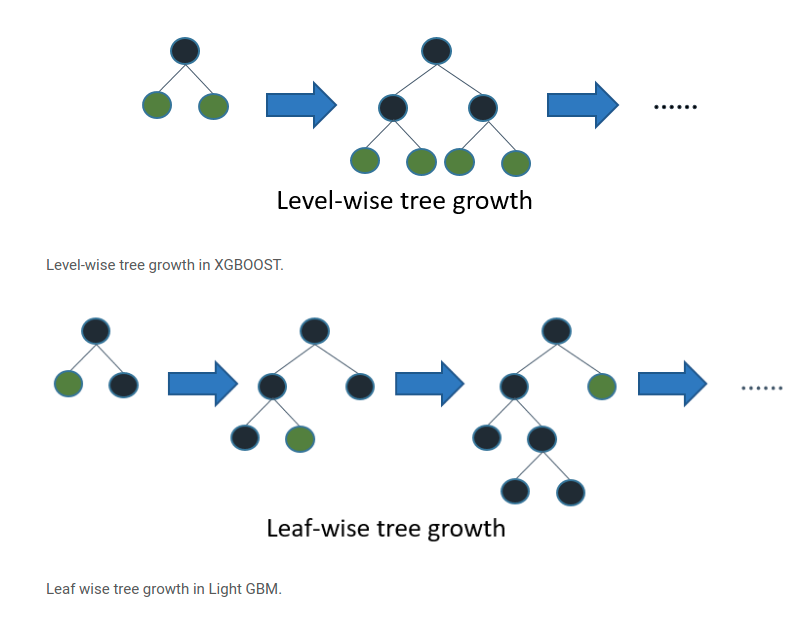
 main tundra
they are saying that if you have a score of more than ... you should have n number of stars. when you understand how to get that into code, the next step is to write a function that maps from the score to the number of stars. then you can do a map over the series with that function.
brisk sage
@desert oar Thank you for your answer 🙂
That's the resulting figure and although it looks impressive, I would like to examine how the nerves of the different diameters behave at the different time points (e.g. nerves with a lower diameter tend to have lower amplitudes at Timepoint 1, etc). Is it possible to see something like that here?
 smoky epoch
main tundra
they are saying that if you have a score of more than ... you should have n numb...
smoky epoch
main tundra
they are saying that if you have a score of more than ... you should have n numb...
thanks
desert oar
brisk sage
<@!389497659087650836> Thank you for your answer 🙂
That's the resulting figure ...
Oh, this is a parallel coordinates plot. Then don't do the "melt" thing 🙂
midnight stag
desert oar
what have you tried so far?
This is all code i wrote so far ```py
import pandas as pd
import numpy as np
import seaborn as sns
import matplotlib.pyplot as plt
from matplotlib.pyplot import figure
from sklearn.model_selection import train_test_split
from sklearn.tree import DecisionTreeClassifier
from sklearn.metrics import accuracy_score, precision_score, recall_score
from sklearn.preprocessing import LabelEncoder
from sklearn import tree
import graphviz
from sklearn import preprocessing
df = pd.read_csv('wdbc.data')
df.columns
data = df.iloc[:,1:]
data.describe
data.isnull().any()
df.dtypes
data.describe()
X = data.iloc[:,1:]
print('Before label encoder:')
print(data.iloc[:,0].value_counts())
le = LabelEncoder()
Y = le.fit_transform(data.iloc[:,0])
Y = pd.Series(Y)
print('After label encoder:')
print(Y.value_counts())
(X_train,X_test,Y_train,Y_test)=train_test_split(X, Y, test_size=0.5)
clf = DecisionTreeClassifier()
clf.fit(X_train, Y_train)
Y_pred = clf.predict(X_test)
Y_train_pred = clf.predict(X_train)
print("Tree Depth:",clf.get_depth())
print("Train Accuracy:",accuracy_score(Y_train_pred,Y_train))
print("Test Accuracy:",accuracy_score(Y_pred,Y_test))
print("Precision:", precision_score(Y_pred,Y_test))
print("Recall:", recall_score(Y_pred,Y_test))
dot_data = tree.export_graphviz(clf, out_file=None)
graph = graphviz.Source(dot_data)
graph.render("wdbc")
!open wdbc.pdf
train_accuracy = []
test_accuracy = []
precision = []
recall = [] ```
 dire echo
brisk sage
<@!389497659087650836> Thank you for your answer 🙂
That's the resulting figure ...
dire echo
brisk sage
<@!389497659087650836> Thank you for your answer 🙂
That's the resulting figure ...
This is art
grand mantle
Actually i was trying test Dijkstra algorithm on a environment by simulations
How can make a environment with obstacles? Do
 steel hill
does anyone have any idea why im getting this error? Traceback (most recent call last): File "/srv/http/tf2/Tf2LogSearcher/analysis/piechart.py", line 10, in <module> ax1.pie(per, labels=labels, autopct='%1.1f%%', shadow=True, startangle=90) File "/home/mainbots/.local/lib/python3.9/site-packages/matplotlib/__init__.py", line 1361, in inner return func(ax, *map(sanitize_sequence, args), **kwargs) File "/home/mainbots/.local/lib/python3.9/site-packages/matplotlib/axes/_axes.py", line 3030, in pie x = np.asarray(x, np.float32) File "/home/mainbots/.local/lib/python3.9/site-packages/numpy/core/_asarray.py", line 102, in asarray return array(a, dtype, copy=False, order=order) ValueError: setting an array element with a sequence. The requested array has an inhomogeneous shape after 1 dimensions. The detected shape was (9,) + inhomogeneous part.
My code looks like this import pandas as pd import sys import matplotlib.pyplot as plt gamemode = sys.argv[1] file = f"./{gamemode} death percentages.csv" df = pd.read_csv(file, header=None, usecols=[0,1,2,3,4,5,6,7,8]) per = [df[0].mean(),df[1].mean(),df[2].mean(),df[3].mean(),df[4].mean(),df[5].mean(),df[6].mean(),df[7].mean(),df[8]] labels = ['Scout', 'Soldier', 'Pyro', 'Demoman', 'Heavy', 'Engineer', 'Medic', 'Sniper', 'Spy'] fig1 ,ax1 = plt.subplots() ax1.pie(per, labels=labels, autopct='%1.1f%%', shadow=True, startangle=90) ax1.axis('equal') plt.show()
and my CSV looks like this

 gritty spear
Hi, using GPT-2, How do i import and fine-tune the downloaded model, having a folder with text files targeting specific topic. Any scripts to guide me ?
 shut tapir
Hi guys
I would like to do entity matching on candidates, to detect if two candidates are the same or not (based on their email ID, phone number, Date of birth, Year of graduation, etc... ). However, I'm expecting a machine learning solution or a deep learning solution rather than string matching. How do I do this? There is a library called 'DeepMatcher' which does exactly this, but I'd like to learn how they do it. If some expert can spend some time explaining it to me, I'd benefit a lot from it. Thank you so much!
shut tapir
Thank you much. I've never found this video until today, maybe this will help me. Thanks again!
dire echo
Simple, oversimplified chaatbot
 grave frost
sounds just like my sister 😏
 wintry pagoda
Hello community, I am working on a NLP project and was wondering can abstractive text summarization processes be used to generate custom text out of the main text.
Example: Can "There are 5 apples and 10 oranges" be turned into "Apple5 Oranges10"?
The example of course is an oversimplification of what I want to do but is it possible by fine tuning abstractive text summarization models like Pegasus?
 red hound
Is there a rule of thumb for when to try/use batch normalization when constructing an NN? Is there a number of layers beyond which it makes sense? Or are there any other indicators to look after?
lapis sequoia
A little question, Matplotlib of Seaborn for data visualisation of the trained datafor the deep learning?
austere swift
seaborn is pretty much just a better looking matplotlib tbh
its based on matplotlib, but the default styles look a lot better
candid oracle
import os
import tensorflow as tf
from tensorflow.keras.optimizers import RMSprop
from tensorflow.keras.preprocessing.image import ImageDataGenerator


model = tf.keras.models.Sequential([
    tf.keras.layers.Conv2D(16, (3,3), activation='relu', input_shape=(300, 300, 3)),
    tf.keras.layers.MaxPooling2D(2, 2),

    tf.keras.layers.Conv2D(32, (3,3), activation='relu'),
    tf.keras.layers.MaxPooling2D(2,2),

    tf.keras.layers.Conv2D(64, (3,3), activation='relu'),
    tf.keras.layers.MaxPooling2D(2,2),

    tf.keras.layers.Conv2D(64, (3,3), activation='relu'),
    tf.keras.layers.MaxPooling2D(2,2),

    tf.keras.layers.Conv2D(64, (3,3), activation='relu'),
    tf.keras.layers.MaxPooling2D(2,2),

    tf.keras.layers.Flatten(),

    tf.keras.layers.Dense(512, activation='relu'),

    tf.keras.layers.Dense(1, activation='sigmoid')
])

model.compile(loss='binary_crossentropy',optimizer='adam',metrics=['accuracy'])

train_datagen = ImageDataGenerator(rescale=1./255)
train_generator = train_datagen.flow_from_directory('D:/tf/horse-or-human/',target_size=(300, 300),batch_size=128, class_mode='binary')

model.fit(train_generator,steps_per_epoch=8,epochs=15,verbose=1)

error on last line
 drifting void
Hi All!
I have a couple of dataframes (consisting of unique rows) stored in parquet files. The data will grow with time and I would like to update it whenever there's something new. In order to reduce the number of checks for existence I would like to always load new data in newDf and merge with the oldDf. However, I have 2 list columns which breaks the merge "TypeError: unhashable type: 'numpy.ndarray'".
Any idea how to solve that?
oldDf = dd.read_parquet([f'/data/paths/{f}' for f in os.listdir('/data/paths/')], npartitions=4*4).compute()
newDf = pd.DataFrame(list(hashList))
print(len(oldDf), len(newDf))
    48539 46285
result = oldDf.merge(newDf, how='left')
I've figured it out. I need to append and remove the duplicates (but excluding the list columns when checking for duplicates). then store the new data. It's fast and relible.
result = oldDf.append(newDf, sort=False).reset_index()
print(len(result))
    94824
result = result[result[['hash', 'src', 'dest']].duplicated()==False].reset_index()
print(len(result))
    82613
 ocean osprey
guys I need to apply pearsonr coeff for every 50k data points of two columns in my df which is of 800k dp. someone help. thanks in advance
 snow gorge
does anyone know why scoring="neg_mean_absolute_error" with cross_val_score from sklearn can spit out positive values?
by definition absolute error is positive, and with neg its negative
would it be wrong to just absolute value the entire array?
wait i might be delusional
i am delusional
desert oar
ocean osprey
guys I need to apply pearsonr coeff for every 50k data points of two columns in ...
maybe use a for loop and iloc?
x_np = df['x'].to_numpy()
y_np = df['y'].to_numpy()
n_rows = df.shape[0]
step = 50_000
results = {}
for start in range(0, n_rows, step):
    end = start + step
    results[(start, end)] = pearsonr(x_np, y_np)
another way:
n_rows = df.shape[0]
step = 50_000
results = {}
for start in range(0, n_rows, step):
    end = start + step
    df_slice = df[start : end]
    x_np = df_slice['x'].to_numpy()
    y_np = df_slice['y'].to_numpy()
    results[(start, end)] = pearsonr(x_np, y_np)
although i prefer the first way
unfortunately and weirdly pandas doesn't make it easy to subclass and write your own Grouper that will work with iloc's, which imo would be very convenient
umbral ferry
snow gorge
does anyone know why scoring="neg_mean_absolute_error" with cross_val_score from...
yeah you can just multiply it by negative one, nothing bad will happen
not sure why it's negative, quirk of the math/code maybe