#data-science-and-ml
1 messages · Page 325 of 1
 limber tendon
 silver lion
im new to AI , i would like to try simple , say..... tic-tac-toe
maybe that level is boring .... i want to model it inPY3 then squish it into a 8 core microcontroller
limber tendon

In this challenge I take the Tic Tac Toe game from coding challenge #149 and add an AI opponent for a human player by implementing the Minimax algorithm.
💻Code: https://thecodingtrain.com/CodingChallenges/154-tic-tac-toe-minimax.html
🎥 Coding Challenge #149: Tic Tac Toe: https://youtu.be/GTWrWM1UsnA
Links discussed in this video:
🔗 Minimax: ht...
@silver lion
silver lion
thanks kid , im also looking for a searchable ( offline ) PDF of every PY3 command , and subtle thingy
PY3 is a mighty big pair of boots
i use tutorialspoint ( saved ) and stackoverflow ........ but there is such subtle code tweeks i get overloaded
-- i practice coding concepts in PY3 then translate to uC ( microcontroller )
George Hotz
do you know -- George Hotz
 upbeat shard
To everyone who helped me out with my machine learning stuff earlier, thank you! It's alive! 😄

 grave frost
silver lion
George Hotz
grave frost
silver lion
George Hotz
that wannabe-self-driving-ceo guy?
 upbeat shard
Oh, I should've probably typed that better. The text is normal sentence capitalization
the speaker names are all first and last name, capitalised
with a colon at the end
silver lion
low cost -- available hardware / software for artifiacial arms and computer interfaces for disabled people
grave frost
upbeat shard
Oh, I should've probably typed that better. The text is normal sentence capitali...
!e
testcase = '''MAIN SPEAKER:\nLoremIpsum\nllllolol\nNEXT GUY:\nlalilueli '''
#The problem here is that you have to load the whole file into memory as a string - but since its pretty small, I don't think this should matter much tbh

#Function won't return anything, modify as you need
def find_speaker(testcase, speaker_to_find):
  tokens = testcase.split('\n')
  for token in tokens:
    if token == speaker_to_find:
      print(f"--> {tokens[testcase.index(speaker_to_find)+1]}")

find_speaker(testcase, 'MAIN SPEAKER') #You don't have to put the semi-colon in front of the speaker you have to find
Holy crap...that's elegant. And regex is still an alien language to me
grave frost
upbeat shard
Holy crap...that's elegant. And regex is still an alien language to me
that's not regex
upbeat shard
ooooh xD
grave frost
its basic python. if you want regex, maybe someone else might know
upbeat shard
nah I dont need it
silver lion
senator_eyepatch , why a eyepatch
upbeat shard
That's not a photo of me. Its some random stock art I found years ago, and it's been my online handle ever since lol
silver lion
-- why a eyepatch
upbeat shard
Are you speaking in linux
silver lion
i use W10 ( dont hate me ) , and Ubuntu
upbeat shard
grave frost
!e
```py
testcase = '''MAIN SPEAKER:\nLoremIpsum\nllllolol\nNEXT GUY:\nlalilueli...
I think this should work although I'm waiting on my GAN to run right now. Thank you so much! 🙂
silver lion
PY3 - python 3
is what i use on both , raspi3B+ shit also
some microcontroller shit also
some linguistics shit also
i use shit also... here there ... everywhere
upbeat shard
So now i have a text document...with 3.3m words. All of them spoken by Donald Trump. Time to train my TrumpSpeech AI model lol
 upbeat shard
Like can I build an app that does that? Or use an AI model to do that? No, dont know enough at the moment for that I'm afraid. I am a newbie
silver lion
good -- it means your not predudice yet .. corrupted
i have bits and pieces -
of stuff
upbeat shard
grave frost
!e
```py
testcase = '''MAIN SPEAKER:\nLoremIpsum\nllllolol\nNEXT GUY:\nlalilueli...
Unfortunately, as much as I appreciate the help I am not sure it works the way I need it (I dont have an understanding of tokens)- there are a variable amount of lines between.
If I can try to explain better:
MAIN SPEAKER: Normal text here.

SPEAKER TWO: Normal text here.

Normal text line 2 here.

SPEAKER THREE: Normal text here.

MAIN SPEAKER: Normal text here.

Normal text line 2 here.
There are also an arbitrary number of speakers (hundreds, with different names)
I basically need to get everything from MAIN SPEAKER: to the next set of capital letters. But I need to exclude both the "MAIN SPEAKER:" string and ignore anything that comes after "SPEAKER X:" until the next "MAIN SPEAKER:" string.
I've been up for almost 48 hours now and my mind is shot O_o
 solemn thicket
I have been trying to make an AI that plays Snake game using a deep Q network (tensorflow agents). After a little bit of research I have found people that sugest to give an small area of cells around the snake head as the observation so there is correlation between the given data and the head position, there are other ideas such a giving the whole board and mark the head position in some way and another way that would be to give the agent the snake body and head positions + amount of free cells if the snake moves towards each direction. Any sugestion of what would be a good aproach on this?
Same about rewards system. From "give points if the snake reachs the food and punish if it doesnt" to "give rewards based on the distance between food and snake head positions"
upbeat shard
I read the first part of your sentence and was about to say- that sounds like a genetic algorithm almost. Putting an observer and incrementing a "score" lets the AI know they're doing better each time

I trained a recurrent neural network to play Mario Kart human-style.
MariFlow Manual & Download: https://docs.google.com/document/d/1p4ZOtziLmhf0jPbZTTaFxSKdYqE91dYcTNqTVdd6es4/edit?usp=sharing
Mushroom Cup: https://www.twitch.tv/videos/183296063
Flower Cup: https://www.twitch.tv/videos/183296268
Star Cup: https://www.twitch.tv/videos/183296400...
this guy uses a genetic algorithm and a reward system to train mario kart
also gives source code
its not in python but the concepts are super similar
genetic algorithms are...way different than what tensorflow uses...I think? I'm a relative newbie, though
 eager hamlet
Hey @slate scroll, I wanted to start learning ML and AI but I don't know where to start
 slate scroll
Well, I wish was more help but my entry was very academic. After a BS and MBA and some work in remote sensing (satellite imaging) I moved into medical imaging and finally into big data.
eager hamlet
For my first project I was thinking I'd make a TicTacToe bot, but I'm not sure if that'd be too hard or if that even falls under ML
eager hamlet
slate scroll
Well, I wish was more help but my entry was very academic. After a BS and MBA an...
Oh, so like you looked at medical scans and searched for illnesses and stuff?
Using AI
slate scroll
I used machine learning to extract features (we liked to call them biomarkers) that correlated with disease progression.
slate scroll
From there I actually got a job as a data engineer and learned a lot more technology and data pipelining before moving over to ML engineering
eager hamlet
All this happened over the course of a few years I suppose?
slate scroll
After my masters I was in my PhD (medical imaging) for about 4 years. Then I worked in data engineering for about 18 months and transitioned to ML engineering over the next 6 months
eager hamlet
Wow!
haha im still in high school and i have no idea where to start
slate scroll
There is so much to learn! which is really exciting of course. I think a huge part of your journey has to be finding what interests you. It sounds like medical research catches your eye. Almost every engineer I interview/hire has a different story. There is no one path to MLE.
eager hamlet
Hmm yeah, I'll start with looking into all the applications of AI I think
slate scroll
Great idea but I wouldn't limit yourself, I think (my opinion of course) that AI will be nearly universal within 5-10 years. All companies are becoming tech companies and nearly all companies will have some use for AI. Whether it's pizza delivery or pharmaceutical research they're all moving that direction.
eager hamlet
that's kinda crazy to think about haha
But thanks, I'll make sure to look into various areas
slate scroll
Yeah no problem at all. It is crazy to think about. The possibilities are endless and personalization is the future.
Just focus on your studies, learn the underlying concepts well and you'll be a step ahead of the rest. Then follow your passion wherever that takes you.
eager hamlet
slate scroll
Just focus on your studies, learn the underlying concepts well and you'll be a s...
Got it
Thanks a lot for your guidance 😄
slate scroll
No problem.
 iron basalt
eager hamlet
Hey <@!215151355390722048>, I wanted to start learning ML and AI but I don't kno...
iron basalt
eager hamlet
Hey <@!215151355390722048>, I wanted to start learning ML and AI but I don't kno...
What is your programming and math background?
eager hamlet
iron basalt
What is your programming and math background?
Hmmm I've been doing python for ~2 months and math I'd say I'm at 11th-12th grade level?
iron basalt
eager hamlet
Hmmm I've been doing python for ~2 months and math I'd say I'm at 11th-12th grad...
Any linear algebra, calculus, and statistics?
What's the most complicated program you have completed?
eager hamlet
iron basalt
Any linear algebra, calculus, and statistics?
I know basic derivation and integrated calculus
Not sure what linear algebra is exactly but I'm somewhat familiar with vectors and matrices
I'd say I know very basic statistics
eager hamlet
iron basalt
What's the most complicated program you have completed?
I'd say it was a maze generator (using randomised depth-first-search) and a pathfinder (a* pathfinding)
iron basalt
Did you learn programming on your own or in a school?
eager hamlet
On my own
I am learning in school as well but I'm ahead of what they're teaching rn
iron basalt
Ok, you should be fine in terms of programming. The main goals should be linear algebra and statistics.
iron basalt
As for machine learning, the goto is Pattern Recognition and Machine Learning by Bishop.
For math + ml + computer science all in one place: https://brilliant.org

Brilliant - Build quantitative skills in math, science, and computer science with fun and
challenging interactive explorations.
not sponsored
(and physics)
eager hamlet
iron basalt
As for machine learning, the goto is Pattern Recognition and Machine Learning by...
This is a book, correct?
iron basalt
Yes
AI is not well defined, but you are probably looking for reinforcement learning based algorithms (they tend to feel the most "AI" from ML).
eager hamlet
Ah I see
eager hamlet
iron basalt
For math + ml + computer science all in one place: https://brilliant.org
Is this fully paid or?
slate scroll
Be careful jumping straight into any deep learning technique. You'd be better served having a strong understanding of bayesian inference and linear algebra (in industry at least)
iron basalt
eager hamlet
Is this fully paid or?
You can do the first few from each course, but yes it does cost.
slate scroll
Techniques like RL are fun and interesting but way out of reach for all but the top tech companies in the next decade.
iron basalt
The book by Bishop is a strong foundation for all of ML.
eager hamlet
slate scroll
Be careful jumping straight into any deep learning technique. You'd be better se...
Got it
slate scroll
one book and "all of ML", I'm concerned
That book would need to be taller than the eiffel tower. Focus on basic mathematical understanding, statistics and linear algebra.
iron basalt
slate scroll
That book would need to be taller than the eiffel tower. Focus on basic mathemat...
It assumes you know the math. The math should be decently known before going into it. It will only give a brief review of probability theory.
slate scroll
If you can master those techniques and build a portfolio of projects (such as on Github) while you continue your studies you'll be well positioned.
slate scroll
iron basalt
It assumes you know the math. The math should be decently known before going int...
If that book assumes you "know the math" for ML. It is not appropriate for someone at an 11th-12th grade math level.
eager hamlet
slate scroll
That book would need to be taller than the eiffel tower. Focus on basic mathemat...
Alright, so I'll start with fully understanding the math behind ML then move into actually learning ML
iron basalt
eager hamlet
Alright, so I'll start with fully understanding the math behind ML then move int...
Yes, ML comes after.
iron basalt
slate scroll
If that book assumes you "know the math" for ML. It is not appropriate for someo...
This is why the goals of linear algebra and statistics were recommended prior.
eager hamlet
slate scroll
Be careful jumping straight into any deep learning technique. You'd be better se...
So is this "bayesian inference" a specific thing which would really help in ML or is it just a part of statistics
eager hamlet
iron basalt
For math + ml + computer science all in one place: https://brilliant.org
Should I start with the mathematical thinking course?
iron basalt
Math foundations and mathematical thinking yes.
In this course, we'll introduce the foundational ideas of algebra, number theory, and logic that come up in nearly every topic across STEM.
This course is ideal for anyone who's either starting or re-starting their math education. You'll learn many essential problem solving techniques and you'll need to think creatively and strategically to so...
eager hamlet
Got it, thanks a lot @iron basalt and @slate scroll!
 sinful gale
Im confused between feature importance and correlation matrix - What is their diffrence? Seems like they want to do the same thing
 supple hatch
r = model.fit(
  x=training_set,
  validation_data=test_set,
  epochs=10,
  steps_per_epoch=len(training_set),
  validation_steps=len(test_set)
)```TypeError: __array__() takes 1 positional argument but 2 were given
x is basically images that i collected using flow_from_directory and y contains the validation images.This is a model i am using for facial recognition.
sinful gale
supple hatch
```py
r = model.fit(
x=training_set,
validation_data=test_set,
epochs=10,
...
which line?
supple hatch
sinful gale
which line?
The first line.
print(training_set.image_shape),This gives me (244,244,3).
 spice crypt
Heeeyy. How does batch number affect CNN's accuracy? Is it better to keep it at higher number or lower number?
 vital lodge
Hey I have two directories with me which are point annotations and images
they look like this:


the 2nd image isnt pitch black if you zoom enough you may see dots of the images
I've never worked with point annotations
and thats why i was wondering if anyone can give some refrences to working with point annotations data
 lapis sequoia
Hi guys, I'm trying to rewrite my pandas dataset in loop, but instead of original pointer, new dataframe is assigned to the copy
datasets = [X, X_test]
for data in datasets:
    # Keep only 'Age' and 'Fare'
    data = data[['Age', 'Fare']]
    print('Data shape in loop: {}'.format(data.shape)) # (891, 2)

print('Data shape after loop: {}'.format(X.shape))
# (891, 11), not (891, 2)
Any advices?
 ripe forge
Sounds like a mismatch between how things work and how you think they work. That code you posted, X should 100% stay the same.
data = data[cols] does a subset of the df, and then assigns it to a data variable. This is not a mutation, so all older references stay as is, just data starts pointing to a subsetted df
So, if you want a mutation, you should be using some kind of inplace=True operation, not an assignment.
lapis sequoia
thanks for the response! I haven't found any function that would allow you to simply exclude all columns except for some. But the closest solution looks like using Counter:
from collections import Counter

feats = ['Age', 'Fare']
datasets = [X, X_test]
for data in datasets:
    cols_to_drop = list(Counter(data.columns) - Counter(feats))
    data.drop(cols_to_drop, axis=1, inplace=True)

print(X.shape) # (891, 2)
anyway thx
 acoustic narwhal
hi i am trying to learn fast ai but i am really stuck on how to get screen coordinates to make a bounding box ```py
image = r"D:\dataset\enemy\20237.png"
result = learn.predict(image)
print(result)
how could i get cordinates from the result ?
i am trying to follow the course but i dont understand this part
lapis sequoia
what are some examples of ML application in industry ?
 hidden flint
https://dpaste.com/3YE3PKVT4 please help me in data processing with pandas, I want to add more rows to the dataframe based on the existing column value of each row, I'm not getting what's the best way to do it
 slim moss
lapis sequoia
what are some examples of ML application in industry ?
slim moss
lapis sequoia
what are some examples of ML application in industry ?
more than you think, there are movie recommender systems, image detection systems, smart environment detection systems and so much more
 proven sigil
lapis sequoia
what are some examples of ML application in industry ?
proven sigil
lapis sequoia
what are some examples of ML application in industry ?
computer vision, predictions, natural language processing, anomaly detection, etc
proven sigil
lapis sequoia
thanks for the response! I haven't found any function that would allow you to si...
data = data[feats]
lapis sequoia
proven sigil
```data = data[feats]```
yep, I've tried, but it doesn't work in loop of DataFrames
proven sigil
ok, your method works for that case
but instead of counter you can use set
or do list comprehension
lapis sequoia
proven sigil
but instead of counter you can use set
yeah, that's a good idea!
 rotund crow
Can anyone recommend a good course on data science/analytics with Python? I know there are books, but I have ADHD and book learning is much rougher for me then auditory/lecture/project based, with some form of accountability. I know Cornell University is advertising a course rn, but it's really expensive.
upbeat shard
So I'm 99% done with some data curating I'm doing on a large corpus of Donald Trump speeches

My issue is my regex is not capturing multiple paragraphs of what Donald trump is saying
this will be for a Donald Trump speech generator AI thing I'm doing
I have an open help question in #help-honey if anyone is interested 🙂

 tidal bough
I wonder how possible it is to do deepfake-style video generation on a normal machine
because if it's not too computationally hard, you can make video too 😛
upbeat shard
that's so beyond me right now. but Deepfake Tom Cruise is pretty amazing
youtube "Sassy Justice"- the South Park guys did a Trump deepfake too
grave frost
tidal bough
I wonder how possible it is to do deepfake-style video generation on a normal ma...
by normal machine, do you mean that server you have with Quadro 8000 and Ryzen i9?
grave frost
upbeat shard
Current results from my TrumpAI speech generator:
you can compare with the trump model we have and see the results
I believe its on that annoying and weird place "huggingface models"
upbeat shard
grave frost
you can compare with the trump model we have and see the results
You have a trump model?!
grave frost
upbeat shard
You have a trump model?!
not me, on huggingface someone had put it there
upbeat shard
hahah gotchya
grave frost
upbeat shard
hahah gotchya
?
upbeat shard
I'll have to check it out sometime!
My current results
DONALD TRUMP: The wall is the state of Ohio, and I think it may be worse than it is a disaster.
I live in Ohio so...this is creepy
grave frost
upbeat shard
My current results
```
DONALD TRUMP: The wall is the state of Ohio, and I think...
https://huggingface.co/huggingtweets/realdonaldtrump you can try it out there only
upbeat shard
You're awesome @grave frost lol
This project is for me to learn LSTM mostly, haven't learned how to work with someone elses model yet
grave frost
upbeat shard
This project is for me to learn LSTM mostly, haven't learned how to work with *s...
don't worry - you will get there
 dapper canopy
Hi Everyone, I have a random question here. I'm basically the only person in my team using python pandas /w ipythonsql, the rest are just using dbeaver for application support data analytics. What is the best way to containerize my envelopment so its easier to deploy on their systems, everyone has a macbook pro. My toolset is below:
- PostGres SQL
- Python Pandas
- Python3
- ipython-sql
- juyter notebook/lab
- pip
- python selenium
- firefox selenium driver
- firefox
- json
and more
Can this be done through Docker?
upbeat shard
grave frost
don't worry - you will get there
I'm happy with the progressing I'm making 🙂 I appreciate your helpful support. I see you!
 deep galleon
Hi pythoneers, could someone tell me if xarray allows to open a NetCDF dataset with write-access? Or some way to overwrite the file you called when trying to save to_netcdf()?
deep galleon
I went around by making a copy of the Dataset, closing the original and saving from the copy so that'll do, but I'd still be glad to hear if there's a way to open as write!
 tender hearth
anyone know a NLP (natural language processing) technique for converting a list of names to fixed-length vectors?
I need to retain their relative meaning so I can't just one-hot encode
 desert oar
what's the relative meaning of a name?
tender hearth
why'd you remove your message?
tender hearth
desert oar
what's the relative meaning of a name?
the network can figure that out 😆
but uh, the vector produced for a certain name should depend on the characters and order of characters in the name and not just the order in which it was input
 slow vigil
I've got a database full of historical stock market data. When I want to work with it I currently have to pull it from the database into a dataframe and then do whatever. I'm wondering does it make sense to just write the entire database to a csv so each time I run my python script I don't have to re-load the dataframe? It's a lot of data and it takes a while to build the dataframe
Or is there another way to do it that I'm not currently doing
I dislike jupyter notebooks for some reason, but I guess if that's the optimal way to do it I can do that. Any opinions are appreciated
tender hearth
slow vigil
I've got a database full of historical stock market data. When I want to work wi...
since it's historical data, that would work
it's not a lot of work to do that anyway
df.to_csv() and pd.read_csv()
slow vigil
Right, it just seems redundant since I already have all the data in the database anyway
tender hearth
@slow vigil a bit hard to provide opinions without having an idea of how big your data is
tender hearth
what's the storage size looking like?
i'll probably say save it to a local csv anyway
storage is cheap
slow vigil
It's not that much really, I don't remember the exact size of the db but I think it's around 10GB? maybe idk
Maybe more I don't remember
A jupyter notebook solves the problem though, doesn't it?
I mean I guess I'd have to re-load the data any time I ran the notebook or made a new notebook
tidal bough
...did they mix up the labels on this figure? 
https://blog.floydhub.com/content/images/2019/06/Slide26.JPG
 grave frost
tidal bough
...did they mix up the labels on this figure? <:pithink:652247559909277706>
htt...
grave frost
tidal bough
...did they mix up the labels on this figure? <:pithink:652247559909277706>
htt...
lmao
but if they are not talking about tokens, then I guess it just might be considered correct 🤔
tender hearth
slow vigil
It's not that much really, I don't remember the exact size of the db but I think...
yeah storage is cheaper than downloading all that
 slate tree
Please help me solve this error...
numpy.__version__ = '1.21.0'
tf.__version__ = '2.5.0'
NotImplementedError: Cannot convert a symbolic Tensor (lstm_6/strided_slice:0) to a numpy array. This error may indicate that you're trying to pass a Tensor to a NumPy call, which is not supported```sounds like you need to call .numpy() on some tensor before passing it to a numpy functio.
slate tree
tidal bough
sounds like you need to call `.numpy()` on some tensor before passing it to a nu...
I already do that
It's time series model which I can try to run...
 sterile rivet
Hello guys! https://www.codecademy.com/learn/paths/data-science , This course seems perfect to me, can yall pls give your feedbacks and mention any other such courses? I am looking forward to buy the codeacademy subscription and do the course mentioned above.
It will just take 5 mins to check the curriculum, Thank you!

Codecademy
Become a Data Scientist. Data Science is one of the fastest growing fields in tech. Get this dream job by mastering the skills you need to analyze data with SQL and Python. Then, go even further by building Machine Learning algorithms.
 split apex
If I have a pandas DF with two columns and a time index, how can I add a third column that is the result of a formula that includes data from one week ago? (obviously, not for the first week of it)
grave frost
sterile rivet
Hello guys! https://www.codecademy.com/learn/paths/data-science , This course se...
seems like a money grabber, but good for starters ig
 flat hollow
split apex
If I have a pandas DF with two columns and a time index, how can I add a third c...
flat hollow
split apex
If I have a pandas DF with two columns and a time index, how can I add a third c...
from datetime import date, timedelta


today = date.today()
week_prior =  today - timedelta(weeks=1)

df_last_week = df[df['date'] <= week_prior]
``` something like that? get a timedelta object and only choose dates based on itdepends on what you wanna do
flat hollow
oh, and to get time from your index I think the syntax is df.index.dt
split apex
flat hollow
```py
from datetime import date, timedelta
today = date.today()
week_prior ...
I currently do this:
    for x in df.index:
        if any(df.index.isin([x - one_week])):
            df['foo'][x] = df['bar'][x - one_week] * 42
Basically, after the first week, I just populate in foo with the result of bar from a week ago
flat hollow
that seems super inefficient with python for loop and all... might want to vectorise that
split apex
I know, which is why I asked
flat hollow
I think you would use df[df['date'] <= week_prior]["foo"] this kind of syntax to choose the appropriate rows and column and then populate that like: df[df['date'] <= week_prior]["foo"] = df[df['date'] <= week_prior]["bar"]*42, that might work I think? just need to change df['date'] to choose your index range
flat hollow
df['date'] would be something like df.index if it's already in datetime, but if that doesn't work, then perhaps df.index.dt? I'm not good at writing code blindly, I usually just try a bunch of stuff out until it works 😄
split apex
It is a timestamp already
I was confused by <= which I thought means less or equal than
split apex
flat hollow
I think you would use `df[df['date'] <= week_prior]["foo"]` this kind of syntax ...
Also, week prior is for each timestamp, not a week from today, sorry if I misspoke. How do I write that?
flat hollow
so you want to create a new column which for each day in your current df, takes the value from a week ago and assigns it to that day?
split apex
yes!
flat hollow
ah
split apex
technically, i want to adjust the value from a week ago based on another value (so df['estimate'][x] = df['readings'][x - one_week] / df['eso'][x - one_week] * df['eso'][x] is the actual code I have)
but I can figure that part out
flat hollow
there will be a mismatch in the number of entries... hopefully pandas can handle it
split apex
I can fill it with nans, probably
flat hollow
from datetime import date, timedelta


today = date.today()
week_prior = timedelta(weeks=1)

df["foo"] = df[df.index - week_prior]["bar"]*42
``` would this work? perhaps it would be better to assign the result to a standalone Series and use that in the calculation?But that's still based on a week from today
flat hollow
oh wait, I meant to use the timedelta
I wonder if you could subtract the timedelta object directly from your index
split apex
KeyError: "None of [DatetimeIndex(['2021-06-04 00:00:00+00:00', '2021-06-04 01:00:00+00:00',\n '2021-06-04 02:00:00+00:00', '2021-06-04 03:00:00+00:00',\n '2021-06-04 04:00:00+00:00', '2021-06-04 05:00:00+00:00',\n '2021-06-04 06:00:00+00:00', '2021-06-04 07:00:00+00:00',\n '2021-06-04 08:00:00+00:00', '2021-06-04 09:00:00+00:00',\n ...\n '2021-06-22 14:00:00+00:00', '2021-06-22 15:00:00+00:00',\n '2021-06-22 16:00:00+00:00', '2021-06-22 17:00:00+00:00',\n '2021-06-22 18:00:00+00:00', '2021-06-22 19:00:00+00:00',\n '2021-06-22 20:00:00+00:00', '2021-06-22 21:00:00+00:00',\n '2021-06-22 22:00:00+00:00', '2021-06-22 23:00:00+00:00'],\n dtype='datetime64[ns, UTC]', length=456, freq=None)] are in the [columns]"
I should use, hm
ah, reverse it
Heh
it's not df.index, that just puts all the values from the index
Which is exactly the bit I got stuck on 🙂
split apex
df['e2'] = df["readings"][df.index - one_week] * 42
that's what I currently have
and it tells me that (all the TSs in the index) are not in the index 🙂
I have to go, need to pick up my kid, but if you mention me, I'll read it later. Thanks for trying anyway!
flat hollow
I actually need to leave as well, damn irl 😄
 serene scaffold
flat hollow
I think you would use `df[df['date'] <= week_prior]["foo"]` this kind of syntax ...
serene scaffold
flat hollow
I think you would use `df[df['date'] <= week_prior]["foo"]` this kind of syntax ...
I believe
df.loc[df['date'] <= week_prior, 'foo'] = df.loc[df['date'] <= week_prior, 'bar'] * 42
is what you'd want to do
flat hollow
serene scaffold
I believe
```py
df.loc[df['date'] <= week_prior, 'foo'] = df.loc[df['date'] <= w...
he doesn't have a "date" column, that was from an example I found online, his datetime data is in index
serene scaffold
flat hollow
he doesn't have a "date" column, that was from an example I found online, his da...
but in general, you don't want to assign to a stacked df[...][...]. you can both select and project with .loc
flat hollow
true..
serene scaffold
if you do df[...][...], you're only assigning to the value returned by the second __getitem__ call, which might not get written back to df.
well, the value returned by the first __getitem__ call. and then you're calling __setitem__ on that 😄
flat hollow
would you mind if I asked you something else? I need to go in 8 minutes but need help with efficient plotting
serene scaffold
flat hollow
would you mind if I asked you something else? I need to go in 8 minutes but need...
you can put the question out there, I guess. I'm supposed to be working on a presentation
but I probably wouldn't be more helpful than !docs pandas.DataFrame.plot
flat hollow
I actually need help with feeding data from 1 small and 1 large dataframe into a multiprocessing function that would handle the plotting
serene scaffold
can you merge the two?
flat hollow
if the large dataframe has 6 levels of multiindex and the small df has 2 levels of multiindex, but the 2 inner-most levels are shared, can I merge the two such that the small df gets copied for each instance of where whose 2 levels appear?
serene scaffold
that's... so much indexing
flat hollow
like
big df     small df
1 a        a
1 b        b
1 c        b
2 a
2 b
2 c
``` and now merge the small on all instances of abcyou could turn those two levels of indexing into regular columns for both dataframes and then join that way
though it would be a merge rather than a join in Pandas terminology
flat hollow
yeah I know its a lot of layers, has to do with a bunch of little settings Im changing when doing the model fitting
okay so turn the inner-most into columns and then merge on columns, will give it a go!
serene scaffold
that's okay. You can set them as indices again once the merge is complete.
flat hollow
cheers, need to go now, gl with your presentation
desert oar
tender hearth
but uh, the vector produced for a certain name should depend on the characters a...
so maybe something like character n-gram vectors? then each name vector can be the centroid of all the character n-grams vectors in the name
in that model, "francis" and "frank" might be similar, but "francis" and "salt" would not
desert oar
flat hollow
like
```
big df small df
1 a a
1 b b
1 c b
2 a
2 b
2 c
...
DataFrame.join accepts level names in on=, not sure if that would work here
flat hollow
I'll see if I can do merge first
desert oar
yeah merge also accepts index level names in on=,left_on=,right_on=
!e ```python
import pandas as pd
df1 = pd.DataFrame([
[1, 1, 0, 1, 'a', 'x', 1.5],
[1, 0, 0, 1, 'b', 'y', 2.5],
[0, 1, 0, 0, 'c', 'z', 3.5],
], columns=['a', 'b', 'c', 'd', 'i', 'j', 'val1'])
df1.set_index(['a', 'b', 'c', 'd', 'i', 'j'], inplace=True)
df2 = pd.DataFrame([
['a', 'x', 3],
['a', 'x', 4],
['b', 'y', 5],
], columns=['i', 'j', 'val2'])
df2.set_index(['i', 'j'], inplace=True)
df3 = df1.join(df2, on=['i', 'j'])
print(df3)
 arctic wedgeBOT
@desert oar :white_check_mark: Your eval job has completed with return code 0.
001 |              val1  val2
002 | a b c d i j
003 | 1 1 0 1 a x   1.5   3.0
004 |           x   1.5   4.0
005 |   0 0 1 b y   2.5   5.0
006 | 0 1 0 0 c z   3.5   NaN
😮
flat hollow
that looks wild 😄
@desert oar what if df1 has x x y x x y in the j-column, would this join df2 on both instances of x x y in df1 ?
desert oar
!eval yep, it's still just a left join
import pandas as pd

df1 = pd.DataFrame([
    [1, 1, 0, 1, 'a', 'x', 1.5],
    [1, 1, 0, 0, 'a', 'x', 1.4],
    [1, 1, 0, 1, 'b', 'x', 1.6],
    [1, 0, 0, 1, 'b', 'y', 2.5],
    [0, 1, 0, 0, 'c', 'z', 3.5],
], columns=['a', 'b', 'c', 'd', 'i', 'j', 'val1'])
df1.set_index(['a', 'b', 'c', 'd', 'i', 'j'], inplace=True)

df2 = pd.DataFrame([
    ['a', 'x', 3,],
    ['a', 'x', 4],
    ['b', 'y', 5],
], columns=['i', 'j', 'val2'])
df2.set_index(['i', 'j'], inplace=True)

df3 = df1.join(df2, on=['i', 'j'])
print(df3)
@desert oar :white_check_mark: Your eval job has completed with return code 0.
001 |              val1  val2
002 | a b c d i j
003 | 1 1 0 1 a x   1.5   3.0
004 |           x   1.5   4.0
005 |       0 a x   1.4   3.0
006 |           x   1.4   4.0
007 |       1 b x   1.6   NaN
008 |   0 0 1 b y   2.5   5.0
009 | 0 1 0 0 c z   3.5   NaN
people who made pandas are actual wizards wtf
flat hollow
is that R?
desert oar
yep
flat hollow
my supervisor can code in that, but I barely managed to learn python, so it will take me a while before I get into R if at all
heard a lot of good things about it regarding data science
 umbral ferry
I'm not sure what exactly I'm asking, or if I'm on the right track, but I'm trying to create a predictive model with purely categorical inputs. Right now I'm using dummy encoding for the inputs and xgboost as my model, is that the right way to go about it?
serene scaffold
flat hollow
my supervisor can code in that, but I barely managed to learn python, so it will...
My coworker said that the advantage of R is that statisticians often provide reference implementations in R, so new developments are available in R before Python
umbral ferry
why do they provide reference implementations in R over Python?
 sleek flare
@umbral ferry dides?
umbral ferry
^ what does this mean lol
desert oar
umbral ferry
why do they provide reference implementations in R over Python?
R has a lot of nice stats and math stuff already built in, whereas in Python it's all bolted on with 3rd party libraries
desert oar
umbral ferry
I'm not sure what exactly I'm asking, or if I'm on the right track, but I'm tryi...
you usually shouldn't need dummy/one-hot encoding with xgboost. it can handle categorical features without transforming them.
that said, "high-cardinality" categorical features (i.e. features with a large number of categories) can be problematic for tree-based models
umbral ferry
I have a few features around 40 cardinality, most around 5
If I use dummy encoding will I get better/worse results?
bc I'm actually getting really good results, like the prediction data is pretty close to my testing data, and I'm hesitant to accept it
I'm very new to this
desert oar
i haven't experimented too much comparing dummy encoding vs categorical, but it might work out to similar results. how many data points do you have and how many data points (roughly) are in each category of the 40-value feature?
umbral ferry
although I should mention I started with around 20 features, dummy encoded them which expanded my feature space to around 300, did some feature selection to reduce it to 50 features
desert oar
you could also just try it both ways
ripe forge
if you're happy with the results, then you're good to go honestly
desert oar
how did you do the feature selection?
yeah i'd agree with Darr, although you should be very careful that you didn't accidentally leak any data, e.g. you accidentally put something highly correlated with your prediction target into the feature set, that you wouldn't really know "in the future"
umbral ferry
I used SelectKBest with chi2 as my scoring function
desert oar
how did you test the model?
you really should be using a train/test split at minimum, cross-validation if you have enough data
umbral ferry
yeah I split it 80/20
still researching exactly what cross validation is or how to use it
I have 12,000 data points in total
desert oar
i'd be curious to see how it performs without any dummy encoding or feature selection, just running xgboost on the 20 features
(make sure you tell xgboost that they're categorical, just in case it guesses wrong)
ripe forge
at a high level, cv is basically, do train test split, train a model. put it in a corner. then, you do a different train test split, train model , put it in a corner. you repeat. so effectively, you end up training k models, same as your number of folds.
theres a bit more finesse to it (and i've simplified the explanation somewhat), but that's the gist of it. it's great for getting a sense of how the model architecture is behaving on the data.
umbral ferry
how do I tell xgboost they're categorical?
desert oar
ah you know what
umbral ferry
and do I need to use label encoder first to get them from letters to numbers?
desert oar
im mixing up xgboost with other boosting algorithms
ripe forge
catboost?
desert oar
yes, and i think lightgbm as well
xgboost doesnt handle categorical variables specifically, i am reading the docs now
you do need to one-hot encode
in which case you did everything right, just check for data leakage
also i would be cautious if you did your feature selection using your 20% test set, you could have overfitted your model that way
if you did the feature selection on the 80% train set you should be OK
umbral ferry
I did feature selection on the entire data set, did I mix things up? lol
all feature had pretty low correlation
desert oar
makes sense for 20 categorical features all one-hot encoded
regardless, to be safe, redo it on the 80% train set. you could be overfitting and overestimating how well your model works
umbral ferry
one thing I'm a little confused on is one hot vs dummy encoding, I took my 20 original features, dummy encoded that to 300 new features (all having 1 or 0) then did feature selection on those 300
desert oar
one hot vs dummy encoding
same thing, different names
umbral ferry
okok
I know before I tried OneHotEncoder and using the array it gave me for each of my 20 features, but I couldn't quite get it
desert oar
how did you do it then? pd.get_dummies?
 desert oar
nothing wrong with that
umbral ferry
so your analysis is that I did everything right, and my final result is good? but I should look into cross validation and maybe other models besides xgboost?
desert oar
it does look like you did everything right, and my recommendation is that you spend some time very carefully evaluating the model outputs
if you put in some made-up but realistic data, do the predictions make sense?
that kind of thing
also how are you measuring prediction quality?
umbral ferry
yeah so what I'm trying to predict is a value 1 through 7
and that value represents the gross margin on that unit
I call it like relative value, because it's (revenue-cost)/cost, so higher values means we made more money
and I just printed out a list of the predictions and a list of the test data, and they are all within 1/2 "units" of each other
which is good enough for my purposes
here's a little picture, right now trying to write some code to calculate the average difference

yeah avg diff is .8
desert oar
these are two dataframe columns? you can get the average difference with (df['predicted'] - df['actual']).abs().mean()
although there are good mathematical reasons to use either rmse or median abs difference
umbral ferry
I'd rather use whichever under estimates how close they are
desert oar
rmse is more sensitive to bad predictions:
rmse = np.sqrt(np.mean((df['predicted'] - df['actual']) ** 2))
rmse = root mean squared error, i.e. the sqrt of mean squared error, i.e. the sqrt of the average of the squared differences
umbral ferry
so it's more sensitive to outliers? or more spread out data
desert oar
both
umbral ferry
oh yeah
desert oar
it's pretty common in regression problems, although it probably has weird behavior on "bounded" problems
umbral ferry
one is an array actually
desert oar
are you running this as a regression or classification problem?
umbral ferry
and the data frame has the answers stored as an string lmao
I'm not sure what regression vs. classification means, I think classification
desert oar
umbral ferry
and the data frame has the answers stored as an string lmao
...why
if the data is strings then it's classification
umbral ferry
I suppose the question I'm answering is "given a certain unit configuration, how much money will we make"
desert oar
you could try turning the target into actual numbers 1-7
then you can get predictions like 4.5 which would be "between 4 and 5", but that would only make sense if 4 and 5 are "equally spaced"
umbral ferry
i used pd.cut to turn the output into bins 1-7
yeah equally spaced bins
like percentile wise
so 15% of values are in bin 1, 15% in bin 2....
desert oar
out of curiosity why did you divide them up into quantiles?
it's not a bad idea, and it correctly encodes in the model the idea that "i don't care about accuracy beyond getting the percentile right". but i'm curious what the intention was
umbral ferry
its 7 total bins, and just to get more precise predictions, which I now realize is odd given I'm saying "yeah it's close enough whatever"
 plush jungle
can someone help me understand this? I've got a neural net like this:
  tf.keras.layers.Flatten(input_shape=(28, 28)),
  tf.keras.layers.Dense(128,activation='relu'),
  tf.keras.layers.Dense(10)
])
it's being used for 28x28 pixel mnist photos.
umbral ferry
it was a decision I made on intuition
desert oar
umbral ferry
its 7 total bins, and just to get more precise predictions, which I now realize ...
if it's good enough then it's good enough!
try making up some data and seeing if the predictions make sense
chunking the prediction target into quantiles is a perfectly valid technique if you really don't care about accuracy beyond getting the quantile right
umbral ferry
honestly I have no idea how to make up the data
bc I need to know how much the particular unit would cost to manufacture
desert oar
you could even evaluate the model as "% of records where the percentile is right" - i wouldn't do rmse on quantiles, that's kind of abstract and weird imo (or at least hard to explain to other people and not very intuitive)
so if the models predicts 7 and the actual value is 7, it's a "yes", otherwise it's a "no" - then the # of yes / # of records = accuracy
umbral ferry
the problem I see with that is it's highly dependant on how many bins I created
so I don't think it's a very good metric, given my number of bins was mostly arbitrary
desert oar
that is true, but so is RMSE between bins 🙂
you could try running the model without bins and computing RMSE and MAD on that, i.e. as a "regression" model
umbral ferry
what does regression model mean? I'm imagining y=mx+b, but what is my x if it's all categories?
desert oar
regression is just jargon for "prediction target that is a number"
classification means "prediction target is a category"
umbral ferry
the only thing I have to change in my code is keep my input as numbers, right?
er, output
not input
my target values I mean lol
desert oar
how did you train the model?
using DMatrix + xgboost.train, or xgboost.XGBClassifier?
umbral ferry
the second
desert oar
then switch to xgboost.XGBRegressor when you switch from 1-7 to the underlying numbers
 uncut barn
not sure which one is correct, is this right the 80 th percentile of this data set
{0, 1, 2, 3, 4, 5, 6, 7, 8, 9, 10} is 8 or is it with the dataset {1, 2, 3, 4, 5, 6, 7, 8, 9, 10}?
python gives the first dataset as 8 and the second as 8.2
 desert bear
Hello, does anyone know how can I present this data onto a plot? Which one should I use? Bar, chart, pie?

 exotic maple
desert bear
Hello, does anyone know how can I present this data onto a plot? Which one shoul...
exotic maple
desert bear
Hello, does anyone know how can I present this data onto a plot? Which one shoul...
If its a count your best bet is a histogram.
Histogram / bar
But depending on your problem needs you make it a cumulative chart, etc
desert bear
The thing is I would like the breweries names' to be visible
So I need 3 like dimensions, or I could use a bar plot (x_axis = count, y_axis = beer_abv) and at the top of a bar name of each brewery
Nah, I don't know how to do that
does anybody know how to sort column values in pandas dataframe, but when the values are the same, sort by other column values?
ripe forge
pandas already does that for you, sort_values can be given a list of columns.
 visual violet
is data frame a dataframe or data frame?
ripe forge
single word
umbral ferry
@desert oar something I'm noticing when analyzing my results is that the predicted result is either pretty close (within 10%) or quite off (within 75%), and more are closer than far, does that mean anything funky?
MAD is 9 and RMSE is 14
values ranging from 0 to 90
I'm interpreting it as there is some feature which is highly correlated
 ember sapphire
i have a 2d numpy array A, and i want to know the smallest i for which A[:, i] contains a 1
how do i write that?
serene scaffold
@ember sapphire can you think of how you can get a boolean vector of which columns have a 1?
serene scaffold
Look into the any method
serene scaffold
ember sapphire
i feel like i should be able to
Don't worry, you can figure this out
spice crypt
Guys which algorithms would you recommend to do real time image classification and counting the objects in the frame?
I used tensorflow before, could it somehow be merged with yolo v4 to do so?
grave frost
spice crypt
I used tensorflow before, could it somehow be merged with yolo v4 to do so?
yeah, I bet you can do that
ember sapphire
serene scaffold
Look into the any method
ok so np.argmin(A.any(axis=0))
grave frost
the counting logic can just be implemented as a post prediction step 🤷
ember sapphire
wait no
grave frost
@serene scaffold Did you graduate? congrats bro! 🥳 🍰 
serene scaffold
grave frost
<@!253696366952316929> Did you graduate? congrats bro! 🥳 🍰 <:ducky_party:63946...
thanks 😄
serene scaffold
ember sapphire
wait no
look what happens when you do A == 1
what does that give you?
spice crypt
grave frost
the counting logic can just be implemented as a post prediction step 🤷
Hmmm... I am trying to build a model to kinda make dull job of counting things in the warehouse automatized as such but ty
ember sapphire
a 2d array of booleans
serene scaffold
ember sapphire
a 2d array of booleans
so try using .any with that. Remember that you can wrap an expression in parentheses to call methods on what it returns
ember sapphire
np.argmax((A == 1).any(axis=0))
grave frost
spice crypt
Hmmm... I am trying to build a model to kinda make dull job of counting things i...
yeah, you can just sum your predictions and store+print it; should be pretty simple
serene scaffold
ember sapphire
`np.argmax((A == 1).any(axis=0))`
(arr > 1).any(axis=0).argmax() would be an alternative, if you like to chain method calls.
ember sapphire
oh i didn't know argmax could be used like that, sweet
grave frost
if the stuff in warehouse is static (only a few categories of objects) then you can fine-tune yolo or VGG
ember sapphire
what if i wanted the index of the last column with a 1? then argmax doesn't work
spice crypt
grave frost
yeah, you can just sum your predictions and store+print it; should be pretty sim...
Thank you, the only thing I am kinda worried about is items overlapping so the threshold part should be monitored closely I suppose
serene scaffold
ember sapphire
what if i wanted the index of the *last* column with a 1? then argmax doesn't wo...
you could reverse the array, get the value, and then flip it back. I guess
spice crypt
grave frost
if the stuff in warehouse is static (only a few categories of objects) then you ...
Yeah actually that might help ty
tidal bough
you could also do np.where (that'll be an array of indices of nonzero elements) and take the first or last or whichever element you want
I think where is guaranteed to be in sorted order?..
ripe forge
i think the any and argmax approach is better btw, you usually dont really "need" to use np.where
ember sapphire
like is there a way to cut out the .any part as well
ah wait i don't think that makes sense
thanks everyone 🙂
spice crypt
Hey, how does batch size affect accuracy of Neural Networks? Is there an optimal number and does it's vary based on number of training data inputed?
 pastel anvil
Can anyone help me with some Azure ML stuff it's super basic, i'm trying to use argparse to create a cli and login but im running into some really stupid errors
 bright mantle
Hey guys!! What do you think is the best way to get a job as a junior data scientist?
serene scaffold
bright mantle
Hey guys!! What do you think is the best way to get a job as a junior data scien...
where are you located and what is your level of education?
 foggy jay
Hey is there anyone familiar with the Twitter sentiment analysis? I want to know if there still limitations on the /Search Tweets API/ that even if you got the tweet ids, it can only trace back the contents by 7 days or 30 days with the premium?
 velvet thorn
spice crypt
Hey, how does batch size affect accuracy of Neural Networks? Is there an optimal...
velvet thorn
spice crypt
Hey, how does batch size affect accuracy of Neural Networks? Is there an optimal...
look up stochastic gradient descent vs batch gradient descent
spice crypt
velvet thorn
look up stochastic gradient descent vs batch gradient descent
Thank you. Do you maybe know if I used tensorflow and keras in order to create a object classification model with my own set of training images (let's say bike detection on the streets) is it mandatory for me to state that tensorflow and keras have been used if I were to integrate it to a sensor and sell the sensor to the third party?
velvet thorn
spice crypt
Thank you. Do you maybe know if I used tensorflow and keras in order to create a...
that
would be a legal issue
and you should consult a legal advisor
minimally, though, you should check the terms of the TF license
I believe it's MIT
which is quite permissive
 supple coyote
Hey Guys! Do any of you know how to do clustering with python? (k-means clustering) I have a project in which i have to see where/what time and what days do the buses in a specific city have the most speed violation..
tender hearth
supple coyote
Hey Guys! Do any of you know how to do clustering with python? (k-means clusteri...
Take a look at scikit-learn, particularly sklearn.cluster, it provides tools for clustering in Python (including k-means clustering)
spice crypt
velvet thorn
I believe it's MIT
Yeah, that's what my concerns are but ty ntl :/
supple coyote
tender hearth
Take a look at scikit-learn, particularly `sklearn.cluster`, it provides tools f...
okay thank you very much !! 🙂
 light edge
hello guys
please i need help if anyone have a report about object detection using deep learning
 late shell
Hello, I was getting started with the titanic dataset on kaggle but I wasn't able to submit my predictions. Can someone help me out?

 grave frost
late shell
Hello, I was getting started with the titanic dataset on kaggle but I wasn't abl...
grave frost
late shell
Hello, I was getting started with the titanic dataset on kaggle but I wasn't abl...
probably a space in your column name in the start or the end
 compact badge
Hello!
could you please attempt this quick survey I made in order to collect data for a simple AI project I am developing
https://forms.gle/oXriRYV7E47gicCG8

Google Docs
This is a small form in order to assess ones belief in worshipping god.
Note : This is an anonymous survey. Data will be used purely for modelling purpose
 grand thicket
Can someone help me figure this out?

I looked online for tutorials, but I can't find one around 3 hidden unit and every single video has a bais where as we dont
 chilly geyser
spice crypt
Thank you. Do you maybe know if I used tensorflow and keras in order to create a...
chilly geyser
spice crypt
Thank you. Do you maybe know if I used tensorflow and keras in order to create a...
Edit 2: not a lawyer, find a lawyer
MIT means you (just) need to state TF/Keras have been used. Easiest to attribute is to find authors and/or just copy paste a LICENSE file.
If it's a sensor, if there's memory you can put the LICENSE on it. If there's no memory I'm not sure, find a lawyer.
EDIT: actually both TF/Keras are Apache 2.0, which is MIT-like anyway (it's somewhat even more permissive) so not many issues there.
Things like android apps are a lot easier with a huge copyright/license section (check Instagram's licensing section), but I'm not too sure about embedded systems
late shell
grave frost
probably a space in your column name in the start or the end
nope, that's not the case, I checked.
grave frost
late shell
nope, that's not the case, I checked.
how's the csv looking like? paste it here
arctic wedgeBOT
Here's how to format Python code on Discord:
```py
print('Hello world!')
```
These are backticks, not quotes. Check this out if you can't find the backtick key.
 candid wraith
Hey can anyone out there lend some insight into an api error i have ran into
Currently building an api to sentiment test meta data using tweepy and the twitter api and i have hit a road block, such that i am unable to efficently scale the api for multi argument instances. I have seen some resources indicate that using df.iterrows() may be the way forward but am struglling to perseve
find(help)
 mint palm
Anyone know to download coursera Jupiter assignment so that i can reattempt is again.
serene scaffold
@candid wraith you'll need to be more specific. Share the whole error message and the relevant code.
arctic wedgeBOT
Hey @candid wraith!
It looks like you tried to attach a Python file - please use a code-pasting service such as https://paste.pythondiscord.com
candid wraith
def tweets_to_data_frame(self, tweets):
    #for row in my_rows:
    #print(row)
    df              = pd.DataFrame(data=[tweet.text for tweet in tweets], columns=['Tweets'])
    df['Handle']    = ([tweet.user.screen_name for tweet in tweets])
    df['Date']      = np.array([tweet.created_at for tweet in tweets])
    df['Tweet ID']  = np.array([tweet.id for tweet in tweets])
    df['Likes']     = np.array([tweet.favorite_count for tweet in tweets])
    #importing data for replies - proving difficult to work around this#
    #df['Replies']  = np.array([tweet.public_metrics["reply_count"]])
    df['Retweets']  = np.array([tweet.retweet_count for tweet in tweets])
    df['Followers'] = api.get_user(user).followers_count
    df['Following'] = api.get_user(user).friends_count
    #rough sentiment output 1st draft#
    df['Sentiment'] = (df.Retweets * 5) + (df.Likes*0.5)
    #my_rows = [(0, row_contents), (1, next_row_contents)]
    return df


    #df = df.sort_values(by=['9'], ascending=False)
if name == 'main':
#user = ["Charl3s", "UniHax0r", "arjunblj", "pet3rpan_", "DegenSpartan", "devops199fan", "hedgehog7", "evabeylin", "loomdart", "scupytrooples", "Fjvdb7", "CL207", "TheCryptoDog", "Arthur_0x", "FrankResearcher", "tomhschmidt", "scott_lew_is", "tarunchitra", "econoar", "gpl_94", "n2ckchong", "QwQiao", "kyled116", "zhusu","gmoneyNFT","seedphrase", "Jonwu_","Joeykrug", "DCLBlogger"]
user = ("Charl3s")
twitter_client = TwitterClient()
tweet_analyzer = TweetAnalyzer()
api = twitter_client.get_twitter_client_api()
tweets = api.user_timeline(screen_name=user, count=15)
df = tweet_analyzer.tweets_to_data_frame(tweets)
df.to_csv(r'\Users\cb162\.spyder-py3\Sentiment Analysis\SentimentAnalysis.csv')
!code
arctic wedgeBOT
Here's how to format Python code on Discord:
```py
print('Hello world!')
```
These are backticks, not quotes. Check this out if you can't find the backtick key.
Hey @late shell!
It looks like you tried to attach file type(s) that we do not allow (.xlsx). We currently allow the following file types: .gif, .jpg, .jpeg, .mov, .mp4, .mpg, .png, .mp3, .wav, .ogg, .webm, .webp, .flac, .m4a.
Feel free to ask in #community-meta if you think this is a mistake.
candid wraith
    def tweets_to_data_frame(self, tweets):

        #for row in my_rows:
        #print(row)
        df              = pd.DataFrame(data=[tweet.text for tweet in tweets], columns=['Tweets'])
        df['Handle']    = ([tweet.user.screen_name for tweet in tweets])
        df['Date']      = np.array([tweet.created_at for tweet in tweets])
        df['Tweet ID']  = np.array([tweet.id for tweet in tweets])
        df['Likes']     = np.array([tweet.favorite_count for tweet in tweets])
        #importing data for replies - proving difficult to work around this#
        #df['Replies']  = np.array([tweet.public_metrics["reply_count"]])
        df['Retweets']  = np.array([tweet.retweet_count for tweet in tweets])
        df['Followers'] = api.get_user(user).followers_count
        df['Following'] = api.get_user(user).friends_count
        #rough sentiment output 1st draft#
        df['Sentiment'] = (df.Retweets * 5) + (df.Likes*0.5)
        #my_rows = [(0, row_contents), (1, next_row_contents)]
        return df


        #df = df.sort_values(by=['9'], ascending=False)
if __name__ == '__main__':
    #user               = ["Charl3s", "UniHax0r", "arjunblj", "pet3rpan_", "DegenSpartan", "devops199fan", "hedgehog7", "evabeylin", "loomdart", "scupytrooples", "Fjvdb7", "CL207", "TheCryptoDog", "Arthur_0x", "FrankResearcher", "tomhschmidt", "scott_lew_is", "tarunchitra", "econoar", "gpl_94", "n2ckchong", "QwQiao", "kyled116", "zhusu","gmoneyNFT","seedphrase", "Jonwu_","Joeykrug", "DCLBlogger"]
    user                = ("Charl3s")
    twitter_client      = TwitterClient()
    tweet_analyzer      = TweetAnalyzer()
    api                 = twitter_client.get_twitter_client_api()
    tweets              = api.user_timeline(screen_name=user, count=15)
    df                  = tweet_analyzer.tweets_to_data_frame(tweets)

    df.to_csv(r'\Users\cb162\.spyder-py3\Sentiment Analysis\SentimentAnalysis.csv')
I tried to, but the channel doesn't allow sharing of xlsx files
serene scaffold
@late shell you can put the csv text in the paste bin
candid wraith
So my code here^ i want to output for the 30 users hashed out instead of the singular user as seen above.
Any suggestions would be greatly appreciated
serene scaffold
@candid wraith and the problem is that it's too slow?
candid wraith
The problem is i dont know how to run this for more than one argument of user
have tried setting it as an array and tried the for loop thats hashed out and still no success
lapis sequoia
candid wraith
have tried setting it as an array and tried the for loop thats hashed out and st...
had similar problem yesterday. I used multiprocessing to run all of my defs at the same time
candid wraith
define multiprocessing?
lapis sequoia
multiprocessing module/package
did your twitter dev application got approved instantly btw?
lapis sequoia
my first one did, was testing codes and they suspended my account midway lol I had to create another account to continue but its still "under review"
candid wraith
You doing something similar?
lapis sequoia
not sentiment
serene scaffold
lapis sequoia
had similar problem yesterday. I used multiprocessing to run all of my defs at t...
A matter of terminology, functions are not called "defs".
@candid wraith you can put the stuff in your main section in a for loop, and then concatenate all the dataframes at the end.
grave frost
late shell
I tried to, but the channel doesn't allow sharing of xlsx files
just put it in pastebin
and export to csv first
 thorn bobcat
yo
lapis sequoia
serene scaffold
A matter of terminology, functions are not called "defs".
i mean functions lol typo thanks!
 gleaming goblet
Anyone know any good free courses for a Full Intro & Start for machine learning & AI. I am great with python if that helps.
 short heart
Is it possible to make several fits into the model in tf? So for example I want to add data to my model so I do something like:
model.fit(bla bla)
and after a while I fit again
model.fit(bla bla2)
ripe forge
possible yes, but why not put bla bla and bla bla2 together in the same dataset? there will be consequences of breaking up the dataset like that, specifically theres a potential that the model forgets the learnings in "bla bla"
grave frost
short heart
Is it possible to make several fits into the model in tf? So for example I want ...
yep, if you wanna update with new datasets you can use SGD with a pretty low LR to ensure the weights are updated slowly and previous weights are not destroyed
short heart
grave frost
yep, if you wanna update with new datasets you can use SGD with a pretty low LR ...
Is adam with 0.01 lr ok, cause I already started it and its learning pretty slowly
grave frost
short heart
Is adam with 0.01 lr ok, cause I already started it and its learning pretty slow...
depends on your task
short heart
grave frost
depends on your task
Image classification
grave frost
short heart
Image classification
no, most prolly you would update too much and lost your previous weights
like @ripe forge said, just combine the datasets?
short heart
So then I should basically swap to sgd and it will be fine?
grave frost
just combine the datasets?
short heart
grave frost
no, most prolly you would update too much and lost your previous weights
Also, if I start decreasing the lr and Id have to fit it 10 times, then would I need to decrease learning rate by /10 everytime, or should lr stay at 0.01 every time I fit another data?
And then if it was 0.000000001 lr at the end, wouldnt it take forever to learn?
grave frost
short heart
Also, if I start decreasing the lr and Id have to fit it 10 times, then would I ...
why the hell don't you combine the datasets?
short heart
grave frost
why the hell don't you combine the datasets?
I divided the initial dataset thats the point
Cause it was so big
That Id get memory errors
grave frost
short heart
That Id get memory errors
then...just reduce the batch size?
short heart
Problem isnt even in the model itself as much tho
The arr that data is saved in takes a lot of space
short heart
I split it into pieces and feed to model, thats why I asked how to properly fit several sets
grave frost
you just load it from disk instead of putting the whole thing in memory
and split+fit on those batches
grave frost
yes, but if you are doing lazy loading how can you run out of memory?
short heart
grave frost
yes, but if you are doing lazy loading how can you run out of memory?
Dataset is 50 gb
Also now, im looking at ram usage and its actually pretty good, only 70%
short heart
grave frost
yes, but if you are doing lazy loading how can you run out of memory?
So in the end, I dont have to decrease lr at all then?
grave frost
short heart
Dataset is 50 gb
yes, so just combine and lazy load it
There is no shortage of idiots...
https://www.reddit.com/r/MachineLearning/comments/ohxnts/d_this_ai_reveals_how_much_time_politicians_stare/

reddit
1,311 votes and 78 comments so far on Reddit
 cedar sun
hey guys, does anyone have any contact in google who can ask him/her something for me?
 short jolt
 midnight stag
what could be the problem here : py fig, ax = plt.subplots(1, 1, figsize=(6, 3)) ax.plot(x, y, 'bo') ax.plot(x23, y_lr, 'b') ax.plot(x2, y_lr2, 'r') ax.set_xlim(0, 1.5) ax.set_ylim(-10, 80) ax.set_title("Linear regression") plt.xlabel("x") plt.ylabel("f(x)") plt.legend(['Data','All','First 8']) plt.grid() plt.show()
upbeat shard
I ran my letter prediction AI against the Red Dead Redemption 2 script (the whole thing) and got this:
Arthur Morgan, I hope you
and Jack are doing well.
Marvin: You want that?
Lenny: Shut up me and Charles will try
and see if we can find anything.
We're going to a party at the
wagon.
Arthur Morgan: That should do it. All right, let's go
round them up.
Arthur Morgan: Thanks.
Dutch Van Der L...: Here you all, eat up.
Jack Marston: You killed them, Pa.
John Marston: No, I'm a poser. I learned from
the best. Getting shot it. A Beauty.
Speaker : A small one.
Uncle: Oh, that's right. Boy, are you high.
is that using markov chains and ngrams or what?
upbeat shard
It's an LSTM network
 grave breach
upbeat shard
I ran my letter prediction AI against the Red Dead Redemption 2 script (the whol...
grave breach
upbeat shard
I ran my letter prediction AI against the Red Dead Redemption 2 script (the whol...
I don't suggest you using letter prediction
Use a tokenizer
The quality when using letter prediction drops dramatically
 drifting ermine
which platform is best to learn ai???
grave frost
anyone know any lib to convert audio to a list of frequency values?
writing a prog for computing fft over chunks of audio doesn't sound very appealing or bug-free for me
grave breach
grave frost
anyone know any lib to convert audio to a list of frequency values?
Use Mathematica
grave breach
drifting ermine
which platform is best to learn ai???
FastAI I think
But never used it
grave frost
grave breach
Use Mathematica
is that a lib in python lol
drifting ermine
grave breach
FastAI I think
is it paid ??
grave breach
You can call from python, yes
grave breach
drifting ermine
is it paid ??
No
grave breach
drifting ermine
is it paid ??

Making neural nets uncool again
grave frost
grave breach
You can call from python, yes
any idea what it might be called?
grave frost
grave breach
You get access to other 12k+ functions
no I mean the function that I am looking for
grave breach
Sorry, I'm back again
@grave frost
But, I had a better idea
Since wolfram is around 2GB
You can use the fourier transform via sympy
grave frost
yeah, but I would still have to compute it over n chunks, take average?
was thinking if there's already a module for that
upbeat shard
grave breach
I don't suggest you using letter prediction
You're correct I think. Though I can run all the beatles lyrics through it and it picks up rhyming schemes. It's interesting to see what the machine "thinks" in these cases :)\
uncut barn
would this be correct
# list of the 5 lowest precsom
labels = list(lowest5_p.index)
lst = []
for sent in test_data:
    # predicted labels
    sent_preds = [x[1] for x in ct.tag([s[0] for s in sent])]
    # true labels
    sent_true = [s[1] for s in sent]
    # words in the dataset
    words = [w[0] for w in sent]
    # false positive is where the label is predicted for a given word by the tagger,
    # but this is not present in the corresponding ground truth label for that word)
    # data in the form (word, true label, predicted label)
    true_pred_data = list(zip(words, sent_true, sent_preds))
    fps = [x for x in true_pred_data if x[-1] in labels]
    lst.extend(fps)
lst
Is this a way to get false positives?
grave breach
upbeat shard
You're correct I think. Though I can run all the beatles lyrics through it and i...
If you want to try something cool
Download a GPT model from huggingface and try making it generate dialogs
It won't take you more than a few lines of code
It has zero-shot capabilities, so you won't have to train it
upbeat shard
there's a free GPT model? neato
I wanted to implement that with a text based adventure game im making
grave breach
GPT2 is free
But, there are other implementation by ElutherAI
There's GPT-Neo with 1.3 B parameters, GPT-Neo with 2.7 B parameters and GPT-J with 6b parameters
They're also working on a full-sized alternative to GPT-3
But it would be too big to run on cunsumer hardware
(Gpt-Neo 2.7B alone is 10GB)
@upbeat shard
grave frost
in an audiofile, the data is amplitudes right?
grave breach
grave frost
in an audiofile, the data is amplitudes right?
Yes
grave frost
hm. then computing the fft should return a list of frequencies in that audio file?
basically, can we convert the amplitude to frequencies?
grave breach
grave frost
basically, can we convert the amplitude to frequencies?
I don't think that would be possible, because, if that would be true, there would be no difference with the speeded up (or slowed down) audio files
grave frost
grave breach
I don't think that would be possible, because, if that would be true, there woul...
but the ft gives us the frequency components?
couldn't we do, say take 5 amplitude values - compute fft and take the frequency present in max number?
grave breach
Sorry didn't read you were talking about fourier transform
grave frost
then repeat that for the whole sequence
grave breach
It does not convert aplitudes to frequencies, but
But, "wrapping" the "audio file" (not the correct words, but you got it) and changing the frequence, it finds a frequence that matches the wave
grave frost
right - it will give frequency components and in what quantity that frequency is present in an audio file?
for each component I mean
grave breach
Sorry, didn't got it at first (english isn't my mother toungue)
Fourier transform works on waves
So you have first to split the audio in different waves (I think)
But I'm not an audio expert
Still, trying to do my best to help you 🙂
grave frost
grave breach
But I'm not an audio expert
cool, appreciate your help 🍰
no worries, I will get it - I don't fully grasp all this myself
grave breach
There's a very good video from 3b1b
I think it might really help you
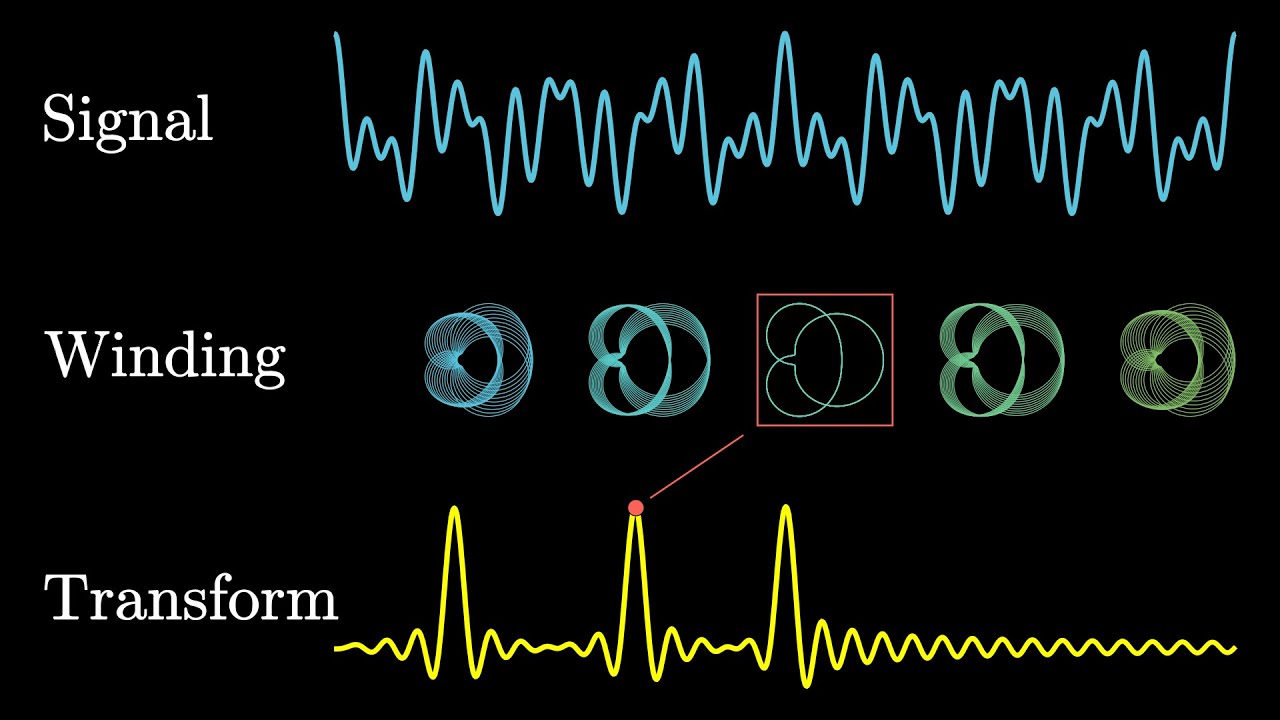
An animated introduction to the Fourier Transform.
Help fund future projects: https://www.patreon.com/3blue1brown
An equally valuable form of support is to simply share some of the videos.
Special thanks to these supporters: http://3b1b.co/fourier-thanks
Follow-on video about the uncertainty principle: https://youtu.be/MBnnXbOM5S4
Interactive ...
upbeat shard
grave breach
GPT2 is free
I've heard of GPT-J with apparently...3b parameters? But can't figure out how to actually get it lol
grave breach
It's 6B
grave breach
upbeat shard
I've heard of GPT-J with apparently...3b parameters? But can't figure out how to...
So
There's currently a PR from Stella Biderman (ElutherAI) to make this work on huggingface
If you don't want to wait
I think there's a fork that has already it implemented
But I don't sugget you to use GPT-J since it's huge
It would reguire something like 30 GB of ram just to load
And a lot of processing power
Use Gpt-Neo (1.3 B)
2.7B is big too (I don't know your specs)
@upbeat shard
upbeat shard
Ah I getchyoo. thank you so much @grave breach 🙂
I'm going from an infrastructure IT background to both programming and machine learning / AI. So a lot of this right now is finding what modules / libraries / models I need to do what I want
and just to mess around 🙂
grave breach
Awesome
upbeat shard
You've already helped a lot!
Do you have any good GAN tutorials? I borrowed one written way back in 2019 with TensorFlow v1 but, understandably, it doesn't work now
After changing the code to make it backwards compatible hahha
grave breach
upbeat shard
Do you have any good GAN tutorials? I borrowed one written way back in 2019 with...
I do, but it is in italian...
I can explain how GAN works to you if you wish
upbeat shard
Aaah thanks. Italian is a beautiful language but I don't speak any of it lol
I know there's a generator and a discriminator
The code I'm using to try to generate an image of a dog from 20,000 images of dogs just makes static
and the "generator" loss always increases. It's weird
grave breach
Check out this: https://paperswithcode.com/method/gan

A GAN, or Generative Adversarial Network, is a generative model that simultaneously trains
two models: a generative model $G$ that captures the data distribution, and a discriminative model $D$ that estimates the
probability that a sample came from the training data rather than $G$.
The training procedure for $G$ is to maximize the probability ...
upbeat shard
Oooh this is very cool 🙂
You're super helpful, I appreciate it. Also head crabs are awesome
grave breach
upbeat shard
You're super helpful, I appreciate it. Also head crabs are awesome
I wouldn't say that 😉
upbeat shard
It'd be a better form of government than the USA has now
grave breach
Technically, you're right, but this isn't a half-life channel, so I'll not get deeper into this...
upbeat shard
I get you 🙂
short heart
Are there any tips or sources on how to build a proper image classification model with layers. I found a ready model, but for me the results suck and I want to change it, but Ive got no idea what exactly to change and how to put layers after each other/what parameters are useful to tune.
grave breach
I think I can give you some indications
First, do you want to build something flexible (zero-shot), reliable or fast?
@short heart
short heart
Just good accuracy
short heart
Idc if its gonna take 9 hours to learn or even more
grave breach
Since training a classifier from scratch requires s lot of computing power
But, I mean, a lot
You can use a pre trained VGG model as base
short heart
Yea i noticed when I tried doing it
grave breach
Then, just remove the last layers
And replace with new ones
Depending on the complexity of the task
short heart
VGG model? Like effnet and such things?
short heart
Predict coronavirus by the scan
short heart
Not exactly
There are like several types of coronaviruses
Didnt really learn much about it, but there are several categories
grave breach
So
Wait
I don't think how efficient can VGG be since it is not trained on scans
But you can try
short heart
Its actually kaggle competition but I just took data and not doing the actual competition cause I have abs no knowledge in object detection and it was pain in the ass to figure it out
grave breach
Just take the model, remove the last 4 layers and replace with 2 new layers (256 could be a good size)
Then add an output layer and use softmax
short heart
So Just take a prebuilt model and replace last layers with dense?
grave breach
If you have a decent GPU the model should be done in less than an hour (depending on the quantity of data you have)
short heart
Like 256dense and then (output size) dense with softmax?
grave breach
short heart
So Just take a prebuilt model and replace last layers with dense?
Yes
This should be the trick
This technique is called transfer learning
Is very powerful
VGG will finetune and learn about how to be more efficient
short heart
Ok and what vgg models are your preferences
grave breach
But it already know a lot of things
grave breach
short heart
Ok and what vgg models are your preferences
The best are VGG-16 and VGG-19
short heart
Are the models called just like that?
grave breach
Yes
VGG-19 is just slightly more powerful than VGG-16
But VGG-16 is more fast
So you have to make the choiche depending on your hardware
short heart
Ok and is there any tutorial on how to remove last layers or is it in docs
grave breach
I don't know much about this, I use a software called Mathematica, but it is a lot different from anything in python (except you're using MXNet with Gulon, for example)
short heart
Ok I guess
And what about putting pre made models inside my own model as a layer for example, would it work?
short heart
Guess Ill have to find some tutorial for py
And of course
Cuda error fixing time!
Anyways thanks so much
grave breach
No problem
By the way, you can just ask here
I think I'm the only one that talks about Mathematica on a python server
And there are a lot of skilled python data scientists
So just ask here
grave breach
By the way, I think that keras has VGG implemented by default
You can import it like this if I don't go wrong:
from keras.applications.vgg16 import VGG16
@short heart
short heart
grave breach
from keras.applications.vgg16 import VGG16
Thanks again, I ll check it out tomorrow
grave breach
Awesome
short heart
If I import it this way then I wont need to remove anything I guess?
grave breach
I think not, but again, I don't use keras in my daily life
grave breach
No problem
short heart
grave breach
By the way, I think that keras has VGG implemented by default
Wouldnt state of the art model be better or is vgg16 a state of the art model?
grave breach
VGG is state of the art
grave frost
grave breach
VGG is state of the art
not really...
current SOTA is held by Scaled-up VIT's which is pre-trained on additional in-house dataset
and even in CNN's. its mostly efficientnetv2's that are popular
grave breach
There is not only one state of the art model
grave frost
there is only one SOTA model...? and that's number 1
kinda depends on what you consider state of the art
grave breach
You have to remember that vit splits image in chunks
grave frost
VGG is pretty old and ancient
grave breach
So it could not recognize tiny details
grave frost
in no case would I recommend it over effnet
grave breach
ViT is cool, but pretty much useless
grave frost
grave breach
So it could not recognize tiny details
what kind of reasoning is that?
grave breach
grave breach
You have to remember that vit splits image in chunks
.
It learns the to focus on the most important things
grave frost
it still has mechanisms to retain the spatial features
grave breach
For example?
grave frost
grave breach
It learns the to focus on the most important things
perhaps - but they would always outpower CNN's in multples due to their unsupervised training advantage
grave breach
As I said
Just a cool research topic
But would be too hard to implement for someone that only wants to make something work
And it is not battle-proven
grave frost
yeah, but what I am saying is that it would outperform any model with enough data
grave breach
Not in this case
grave frost
grave breach
And it is not battle-proven
I think IMagenet benchmark is pretty well proven
grave breach
The current task it detecting corona virus types
grave frost
grave breach
Not in this case
even in this case, anyone using anything other than effnetv2 is behind the times
grave breach
grave frost
I think IMagenet benchmark is pretty well proven
Transformers alone were discoveres just a few years alone
And I cannot name anyone that uses them for image detection in production
grave frost
grave breach
Transformers alone were discoveres just a few years alone
CNN's alone were scaled a few years ago
grave frost
grave breach
And I cannot name anyone that uses them for image detection in production
they are doing a competition, not deploying smthing in the industry
grave breach
grave frost
they are doing a competition, not deploying smthing in the industry
I mean, that vit is cool, but nothing more
Otherwise companies would use it
grave frost
grave breach
Otherwise companies would use it
they would; as soon as their script-kiddy practioners/engineers have the spoon fed libraries to use
grave frost
are you a googler?
grave breach
no, you?
grave frost
yes, so?
grave breach
grave frost
they would; as soon as their script-kiddy practioners/engineers have the spoon f...
.
grave frost
lol
grave breach
grave breach
google itself doesn't use it
.
grave frost
do you know what google translate uses?
grave frost
🤦 I am talking about NLP
grave breach
They use transformers
grave frost
no
grave frost
they use RNN's. why, you may think they do?
smthing so old and ancient? tried and tested?
serene scaffold
grave frost
🤦 I am talking about NLP
Why
grave frost
they have their internal version of transformer models that is on par current overfitted scaled transformers that's available only for paying/premium customers; they can't afford (ecnomically unviable) the cost of having a free translate service with a heavy transformer behind
grave breach
(recently switched)
grave frost
the inference cost on transformers is murder; so you have to pay for that
same with google lens
CNN's are less costly in terms of hardware compared to mammoth ViT
that's all
grave frost
yes
grave breach
RNN (LSTM in particular) are super hard to train
Transformers, on the other hand, are more flexible and require less power
grave frost
grave breach
Transformers, on the other hand, are more flexible and require less power
...?
alright, respectfully ending this convo before it gets heated by NLP people flaming out over your comment
see ya later 👋
grave breach
Sorry, issues with the cat
I'm back
I think was my fault, when I translate in my head to english the concepts really starts to mess up
I meant that lstm are super hard to train
So they're not convenient
@grave frost
I think that's because of recursion
(but I'm not sure)
So training a transformer is more convenient for companies
Didn't even mentioned transfer learning
 magic dune
Can someone explain this
import numpy
numpy.array([1,2,3])
numpy.std(1,2,3)
You are importing numpy, calling numpy.array and then calling numpy.std.
magic dune
iron basalt
You are importing numpy, calling numpy.array and then calling numpy.std.
what std do?
serene scaffold
magic dune
what std do?
looks like it's for standard deviation
!docs numpy.ndarray.std
arctic wedgeBOT
ndarray.std(axis=None, dtype=None, out=None, ddof=0, keepdims=False, *, where=True)```
Returns the standard deviation of the array elements along given axis.

Refer to [`numpy.std`](http://docs.scipy.org/doc/numpy/reference/generated/numpy.std.html#numpy.std "numpy.std") for full documentation.

See also

[`numpy.std`](http://docs.scipy.org/doc/numpy/reference/generated/numpy.std.html#numpy.std "numpy.std")equivalent function
Similar names: numpy.numpy.ndarray.std
 midnight bone
yo anyone has a code to read gmail through python?
serene scaffold
midnight bone
yo anyone has a code to read gmail through python?
there's a gmail API
 karmic cliff
How do you guys find reliable data sources for analysis? Is there a standard source for verifiable apis and datasets?
lapis sequoia
karmic cliff
How do you guys find reliable data sources for analysis? Is there a standard sou...
Kaggle
 plush ibex
I'm trying to plot the mean of several columns of a dataframe combined, grouped by another column. The following returns separate means for each column. How can I return the overall mean of the six columns combined, but still grouped by the column 'filename'?
all_data.iloc[:,-7:].groupby('filename').agg('mean')``` opaque stratus

 clear tangle
Hi everyone!
As part of my PhD thesis research, I would like to learn from data science professionals and understand the mistakes that companies make when implementing profitable data science projects, and discover how to avoid them.
Based on your experience, what are the most important aspects to successfully complete a data science project? Do you follow any methodology to organise the project? How well-coordinated is your data science team?
Use the brief survey below to share your insights for the upcoming study on rethinking data science project methodologies, by @Vicomtech, @Tecnun, and the Institute of Data Science and Artificial Intelligence @Universidad de Navarra.
It will take you just 3 minutes. Thank you!

Take this survey powered by surveymonkey.com.
velvet thorn
plush ibex
I'm trying to plot the mean of several columns of a dataframe combined, grouped ...
what do you mean overall mean of the six columns
got an example?
plush ibex
I mean the six columns are the same basic data type, and I'd like to average the entire matrix and get a single scalar value @velvet thorn
velvet thorn
plush ibex
I mean the six columns are the same basic data type, and I'd like to average the...
in pandas, .mean().mean()
hm but
okay so let me get this straight
just
apply .mean again
if I understand what you're saying
to the result of the first groupby mean
because the mean of means is equal to the overall mean
assuming you have no null values
plush ibex
here is what the dataframe looks like:

I'd like to calculate statistics on the 6 "Delta x" columns, but group them by the filename
so I'll eventually do something like .agg(['count', 'mean, 'std', 'min', 'max']) but I'd like to calculate the statistics for the group of "Delta" columns as a whole, not individually. I considered doing a .stack() to group the columns together, but I'm not sure what the 'filename' column would look like then
velvet thorn
yeah, so df.groupby('filename').mean().mean(axis=1)
 night sun
i'm using numpy dtypes and whenever i calculate something in any kind of int, it returns the value as a numpy.int32
for eg:
>>> import numpy as np
>>> x = np.uint8(5)
>>> type(x)
<class 'numpy.uint8'>
>>> type(x+2)
<class 'numpy.int32'>
so how can i make it return its original datatype(without converting it myself afterwards)
iron basalt
clear tangle
Hi everyone!
As part of my PhD thesis research, I would like to learn from data...
Amazon.com: Statistics Done Wrong: The Woefully Complete Guide (9781593276201): Reinhart, Alex: Books
 lethal dust
night sun
so how can i make it return its original datatype(without converting it myself a...
lethal dust
night sun
so how can i make it return its original datatype(without converting it myself a...
i dont think u can do that as python assign data type by its own so I guess u have to typecast everytime
type(np.uint8(x+2))
night sun
lethal dust
i dont think u can do that as python assign data type by its own so I guess u ha...
ok thx
iron basalt
night sun
for eg:
```py
>>> import numpy as np
>>> x = np.uint8(5)
>>> type(x)
<class 'num...
In python the 2 has type int, which if you are on 32 bit python is an 32 bit integer. Since a 32 bit integer plus an unsigned 8 bit integer could result in some value that needs 32 bits, it casts up by default.
I'm using 64 bit python here:
>>> import numpy as np
>>> x = np.uint8(5)
>>> type(x)
<class 'numpy.uint8'>
>>> type(x+np.uint8(2))
<class 'numpy.uint8'>
>>> y = np.int64(5)
>>> type(y)
<class 'numpy.int64'>
>>> type(y+2)
<class 'numpy.int64'>
>>> z = np.int32(5)
>>> type(z)
<class 'numpy.int32'>
>>> type(z+2)
<class 'numpy.int64'>
>>>
 vernal grove
 short heart
Cant google it for some reason, anyone met this error in tf vgg16?
 pearl jungle
can anyone help me here with n-queen problem, using genetic algorithm?
 tidal bronze
hello,
I would like to convert z-scors to % probabilities and preferably without an external lib. What's my best bet? storing the z-table in a file or computing it from scratch?
grave breach
short heart
``` ValueError: Input 0 of layer block1_conv1 is incompatible with the layer: ex...
Mmhh... I don't use Keras, but judging by the error you placed two layers with not compatibles dimensions
Try following a tutorial and then adapting the code
So you can understand each part correctly
https://towardsdatascience.com/step-by-step-vgg16-implementation-in-keras-for-beginners-a833c686ae6c

Medium
VGG16 is a convolution neural net (CNN ) architecture which was used to win ILSVR(Imagenet) competition in 2014. It is considered to be…
grave frost
anyone know how to interpret output of fft?
short heart
grave breach
Mmhh... I don't use Keras, but judging by the error you placed two layers with n...
solved it, dont remember how but theres another problem now
since i cant use gpu and its learning on cpu, it takes so much power for just 1 epoch
and actually i have a feeling that it somehow even skipped epochs but ive got no idea
the progress bar was just left at beginning and there were other epochs starting at the same time
 exotic marsh
Hi I was wondering, how do i implement ml5 js neural network with tradingview pinescript?
if anyone could point me to the right direction i would greatly appreciate it
been stuck for a few days to find a starting point
much appreciate
midnight stag
Can anyone of you help me in correcting the code ```py
#Import numby package as np
import numpy as np
#importing matplotlib as plt
import matplotlib.pyplot as plt
#importing scipy.stats as st
import scipy.stats as st
#importing sklearn.linear_model as lm
import sklearn.linear_model as lm
#Creating an array and setting it to y
y = np.array([394.33, 329.50, 291.00, 255.17, 229.33, 204.83, 179.00, 163.83, 150.33])
#Creating an array and setting it to x
x = np.array([0, 4, 8, 12, 16, 20, 24, 28, 32])
#Creating the regression
lr = lm.LinearRegression()
#Training model on training dataset
lr.fit(x[:, np.newaxis], y)
#Predicting points with trained model
y_lr = lr.predict(x[:, np.newaxis])
#take the first 8 elements from y
y2 = y[:8]
#take the first 8 elements from x
x2 = x[:8]
#Creating the regression for second case
lr2 = lm.LinearRegression()
#Training model on training dataset
lr2.fit(x2[:, np.newaxis], y2)
#Predicting points with trained model
y_lr2 = lr2.predict(x2[:, np.newaxis])
#Printing
print("Y values:", y_lr)
#Printing
print("Y values 2:", y_lr2)
fig, ax = plt.subplots(1, 1, figsize=(6, 3))
ax.plot(x, y, 'bo')
ax.plot(x23, y_lr, 'b')
ax.plot(x2, y_lr2, 'r')
ax.set_title("Linear regression")
plt.xlabel("x")
plt.ylabel("f(x)")
plt.legend(['Data','All','First 8'])
plt.grid()
plt.show()
 muted patio
What is the error?
midnight stag
@muted patio it is showing this error:- ```py
NameError Traceback (most recent call last)
<ipython-input-5-edfd7c14b6f0> in <module>
33 fig, ax = plt.subplots(1, 1, figsize=(6, 3))
34 ax.plot(x, y, 'bo')
---> 35 ax.plot(x23, y_lr, 'b')
36 ax.plot(x2, y_lr2, 'r')
37 ax.set_title("Linear regression")
NameError: name 'x23' is not defined
i also tried entering the solution code provided by my teacher still not working
grave breach
short heart
since i cant use gpu and its learning on cpu, it takes so much power for just 1 ...
Run it in google colab and download the model
short heart
grave breach
Run it in google colab and download the model
im running it in kaggle
prob not gonna change to google colab since adapting code to kaggle was so pain in the ass
holy crap gpu is so fast
until i set up gpu in kaggle it was learning soo slow
Question to whoever uses kaggle on daily basis, does gc.collect() help gpu clear some memory?
cedar sun
one thing
when doing image classification
imagine if it is dogs cats
is it good having images with 2 dogs for the label dog?
generally, more than 1 dog in the same img
tidal bough
short heart
Question to whoever uses kaggle on daily basis, does gc.collect() help gpu clear...
Unless you're using something other than CPython or unless you have circular references, gc.collect() is basically useless - the garbage collector in CPython is only for collecting circular references (say, two object having a reference to each other, therefore not dropping to 0 references even when no other object references them) - in all other cases, refcounting collects an object immediately after an object drops to 0 references.
So basically, unless kaggle does something really weird and bad on the inside, it shouldn't be necessary to manually call collect.
desert oar
umbral ferry
<@389497659087650836> something I'm noticing when analyzing my results is that t...
was this with your continuous/regression model? or the binned one?
short heart
tidal bough
Unless you're using something other than CPython or unless you have circular ref...
ok and assuming you understand kaggle, will my code work if I leave it overnight for example?
i read that you have to save code so it keeps working but then, will it save outputs?
grave frost
it would save cell outputs if you don't delete the trial
short heart
or could i just run the code normally and idk set up a clicker so it doesnt throw me out for idling for an hour lol
tidal bough
it's also possible to save from kaggle to, say, a google drive:
https://stackoverflow.com/questions/55149143/upload-files-from-kaggle-to-google-drive
short heart
yea but will it throw me out if i save or set up a clicker
cause it already threw me out when i just ran code
grave breach
@short heart I think you might want to save the h5 file
(the h5 file is the model)
So you can download it and use it on your own machine
short heart
grave breach
<@!452029138241323010> I think you might want to save the h5 file
yes im saving it in h5 format
i wanna make sure kaggle doesnt decide to shut down learning while im sleeping
 slim kraken
hello , i was parsing a table , so to get informations i need , i gotta clean the output from "html comments and tags" , how can i do that?
grave breach
short heart
i wanna make sure kaggle doesnt decide to shut down learning while im sleeping
Save checkpoints
umbral ferry
desert oar
was this with your continuous/regression model? or the binned one?
sorry for the pictures of my screen, don't have discord on my laptop. This is what I'm talking about, left is predicted, right is actual. (note, I manually selected this section of results looking for a particularly bad section)

it also sometimes predicts negative numbers lol
clear tangle
iron basalt
https://www.amazon.com/Statistics-Done-Wrong-Woefully-Complete/dp/1593276206/ref...
thanks!
chilly geyser
short heart
im running it in kaggle
Dunno if this advertising is not allowed (anyway, I am not paid by them), but also consider deepnote, which would provide more control over the environment of your notebook
I think kaggle not providing a lot of cloud compute is normal.
I think in general most of these don't quite allow for overnight running.
For me deepnote has persistent storage of ~5GB (which is plenty), so you can make code that expects cutoffs (the kernel essentially randomly dies - you could pay to make it not die but that means you should get a dedicated cloud compute resource) but makes progress on each run hopefully, and that will get you to your goal
Essentially as long as a single epoch is doable with free resources you can train that model through its usual training proess
 civic summit
anyone can help with plotting in python? calculated mean & +/- upper and lower, i just dont know to actually plot the data in python.
chilly geyser
civic summit
anyone can help with plotting in python? calculated mean & +/- upper and lower, ...
Have you tried matplotlib
civic summit
been searching videos, cause essentially all i am trying to do is create a plot showing means and confidence intervals. my n values is different for each observation so the guides i used became a bit useless to me. heres where i got stuck.
stde=sigma/math.sqrt(n), most videos ive watched n is 1 value, but i have 5 categories with individual ns
so i went and created a list of N's, but i dont know how to actually make it work.
so i just did the calculation by hand in excel and
now i have all of my means + upper and lower values....but i odnt now how to plot the final data in a python chart
chilly geyser
civic summit
stde=sigma/math.sqrt(n), most videos ive watched n is 1 value, but i have 5 cat...
You can do some loops/iterations
 pastel anvil
I posted a question here on Friday but was unable to stay on and get an answer, was wondering if anyone could help me out with the error message i get on my mini argparse cli
for azure
grave breach
cedar sun
like an image and its mask
open images dataset v6 by google
pastel anvil
class Az:
    def __init__(self):
        self.ibc = InteractiveBrowserCredential()
        self.ibca = self.ibc.authenticate()

    def auth(self):
        self.ibc.authenticate()
        return self.ibc

    def login(self, ibca):
        sc = SubscriptionClient(ibca)
        sl = sc.subscriptions.list()
        return sl


parser = argparse.ArgumentParser()
subparsers = parser.add_subparsers(dest='test')
azlogin = subparsers.add_parser('login', help='launch')
azlogin.set_defaults(func=Az.auth)
args = parser.parse_args()
Looks like you can just loop through each row?
 latent quest
kind of new to numpy.
So I had a doubt, let's say x is an array and when I do:
x.shape
I get (7172, 28, 28) as the output, then when I try to add another dimension to the data using
x = np.expand_dims(x, axis=1)
the new x.shape is (27455, 1, 28, 28), but I wanted (27455, 28, 28, 1)
any clue on how to fix this?
tidal bough
latent quest
kind of new to numpy.
So I had a doubt, let's say x is an array and when I do:
...
Well, don't pass axis=1 to expand_dims then - you probably want axis=3 or something. Though I usually do this via x = x[..., None] (that's a literal ... here).
grave frost
chilly geyser
I think kaggle not providing a lot of cloud compute is normal.
I think in genera...
does deepnote give GPUs/TPUs?
Im pretty sure none of these 3rd party solutions give TPUs since its proprietary
so any solution you give would always lack compute, unless its an A100
civic summit
where the dot is the mean, and the line has an upper and lower value?
i would just to create something like this. i am not sure if i need to create 3 series [] with mean,upper,lower, or a df with these as different columns. Looking for help with the actually sytax on how to create a plot like this
cedar sun
grave breach
open images dataset v6 by google
can u link it pls?
civic summit
ok values in in a df now
Race Mean Lower upper
0 AAPI 27.64 23.84 27.66
1 AIAN 23.89 1.16 14.25
2 BLACK OR AFRICAN AMERICAN 40.01 37.43 40.65
3 DECLINED 33.32 31.84 34.52
4 LATINO 47.10 45.25 48.12
5 OTHER NOT DESCRIBED 32.01 29.07 32.47
6 UNKNOWN 24.10 12.58 20.18
7 WHITE 27.68 26.75 29.16
how i plot this?
chilly geyser
grave frost
does deepnote give GPUs/TPUs?
not for free
 stuck swallow
Hello. Is there a way to generate images based on an input set?
give it some images and an AI will generate out images similar
kind of like thispersondoesnotexist.com
chilly geyser
civic summit
i would just to create something like this. i am not sure if i need to create 3 ...
tidal bough
stuck swallow
Hello. Is there a way to generate images based on an input set?
It uses a GAN - a neural network architecture that by its nature is also capable of generating examples that "look like" the input data it has seen
so that's what you want to make
grave frost
it seems everyone is introduced to GAN's by thispersondoesnotexist
tidal bough
(Is there a name for the task of "generating data similar to an input dataset"?..)
tidal bough
that's what I thought, but apparently it's more about generating totally artificial datasets to train NNs on, weirdly enough?
it'd certainly make more sense if it meant this task instead
grave frost
tidal bough
that's what I thought, but apparently it's more about generating totally artific...
it's more about generating totally artificial datasets
but that would still come under that category?
tidal bough
when I google "synthetic data generation", all I find is doing it for increasing how much training data you have, and not as a goal in itself
cedar sun
do u know any model for saliency object detection? with its weights already


 grave breach
What kind of objects would you like to get the mask of?
Like road items for autonomus driving?
grave breach
So you want it to extract cats?
cedar sun
things in general