#data-science-and-ml
1 messages · Page 323 of 1
 cerulean mauve
So you can override things you don't like in the method. Though, you'll probably end up yanking it from the library to do it. Not sure how much plumbing that will take.
 cedar sun
huh
cerulean mauve
the child inherits the method from the parent.
 twin moth
That was not actually meant to me, right?
cedar sun
so if child uses another methods on printmessage, will those methods still exist?
cerulean mauve
@twin moth sorry, I got lost.
twin moth
All good 😛
cerulean mauve
@cedar sun they child get access to parent's methods and attributes, when super is called, the init for the child class, runs super, which requires the parameters needed to instantiate the parent class as well. You can override any method and replace it with one of your own using polymorphism, which in effect is achieved by defining a method in your child class with the same name.
if parent class has printmessage method
you can change that in the child class by defining it again.
cedar sun
ok ok
cerulean mauve
That would come with some serious plumbing I bet, but if you need to override the libraries methods in your own OO workflow, that should be the way.
See, way easier than java 😄
cedar sun
can we move to help chocolate?
 visual violet
"high dimension" can mean so many things
as far i understand, one object having multiple variables is high dimension
or one object has serveral group of multiple variables
i don't think dimensionality reduction will help me much then
visual violet
so I have a matrix of the drug price of the 724 ingredients from 2016 to 2020 - tables where rows represent drug ingredients, columns represent the time, such as second quarter of 2017, and numbers in each cell characterize the price of the particular ingredient in the particular year. So basically 724*20
it seems like k-means dtw metric is clustering according to average price level
and i don't want that
since i want something interesting
 grave breach
And, what's your goal?
visual violet
here is the graph

hmm what i am trying to accomplish
it is a very good question
i am trying to see if there is other (dis)similarities among the ingredient other than the average price
grave breach
Dimensionality reduction can help you a lot with it
*this
Two similar ingredients will be close in space
So if you plot them in a 2d or 3d space you can clearly find similar ingredients
 desert oar
visual violet
it seems like k-means dtw metric is clustering according to average price level
desert oar
visual violet
it seems like k-means dtw metric is clustering according to average price level
i thought i suggested a whole bunch of things yesterday 
visual violet
i try to find a good dimensionality reduction and its implementation in python for this problem
i was looking your suggestions up
grave breach
If you have a lot of data try using an autoencoder
cedar sun
how?
 silver widget
np.sum((np.dot(X,theta) - y)*2)/2m
can someone pls tell me, what is wrong with this Cost function code?
There are 2 * 's before first 2:)
2 star m also :/
 abstract sentinel
I was wondering about data science courses if they are worth it or not.
Recently I got an application task for junior DS position, and I'm confident I can do it (in fact I already did most of it). I know what I need to do, and I can split my assignment into small tasks, and just google how to do them individually, however it's soulcrushingly annoying for me. I deeply wish I would know majority of "common things to do" and really start digging documentations/stack-overflow when it's something out of ordinary. I can't tell if it's just me or I don't like DS, because I hated this feeling of incompetence my whole life.
 kind willow
ok @primal pilot
 grave frost
abstract sentinel
I was wondering about data science courses if they are worth it or not.
Recently...
grave frost
abstract sentinel
I was wondering about data science courses if they are worth it or not.
Recently...
well, if you have any problems you can always ask it here for any pointers! 🤗
cedar sun
do u know any model pretrained for saliency object detection?
 thorn bobcat
anyone know what this rule or formula is called?

if I want to learn about it do I search minmax game, jensen shanon distribution or?
abstract sentinel
grave frost
well, if you have any problems you can always ask it here for any pointers! 🤗
Sure thing, I'm just getting devoured by impostor syndrome. 😂
 fringe igloo
I'm trying to start my first very simple neural network project, I'd like to make a number guessing AI, that works with data like this:
data = [
    {"number": 3, "result": 8},
    {"number": 1, "result": 6},
    {"number": 125, "result": 130},
    {"number": 47, "result": 52},
    {"number": 5357, "result": 5362},
]
And then tries to predict the result of 10 based on the data. How would I go about creating this? And what library should I use, TensorFlow/PyTorch?
 stable isle
is anyone in here familiar with thermodynamics ?
I have a project I'm thinking of getting into. I basically want to implement a thermoacoustic engine framework. I don't have the money to purchase the materials to build the actual engine so I want to implement it in software. Thermodynamics would apply to something like this? For emulating the physics of stuff like heat transfer....
I know nothing of thermodynamics....
 serene scaffold
fringe igloo
I'm trying to start my first very simple neural network project, I'd like to mak...
serene scaffold
fringe igloo
I'm trying to start my first very simple neural network project, I'd like to mak...
is there an actual rule?
fringe igloo
serene scaffold
is there an actual rule?
In that example it's input int + 5 so the input of 10 should have a result of 15
But obviously I don't want to "tell" the AI that
serene scaffold
fringe igloo
In that example it's input int + 5 so the input of 10 should have a result of 15
how many possible rules are there?
fringe igloo
Just that one
I want to keep is as simple as possible, this is my first time looking into neural network stuff
serene scaffold
I'm not actually sure what the best algorithm for that might be. If you want to build a neural network, it might be more interesting to download the titanic dataset from Kaggle and build one that predicts if someone lived or died.
fringe igloo
Oh that sounds interesting
serene scaffold
there are more possible inputs to work with (age, gender, crew vs non-crew, etc) and you don't have to use all of them
each "input", in that sense, is called a feature
fringe igloo
That would be a lot more complicated than my above example though?
Was looking for something super simple for my first attempt
serene scaffold
well, I can't think of an algorithm that can learn something as arbitrary as "the X value plus five"
fringe igloo
What if something like "if number is odd then result == 5, if number is even then result == 10" then?
And then work with a massive dataset that has a bunch of numbers and the 5 or 10 as result
serene scaffold
@fringe igloo I guess if your X values are arbitrary integers, and the y values are the X values plus five, you could use linear regression for that
visual violet
i am having difficulty finding a quanlitivative variable for PCA
can somebody pleae help?
thorn bobcat
thorn bobcat
anyone know what this rule or formula is called?
can someone tell me more about this?
its not a normal minmax right?
cedar sun

RGB Salient object detection is a task-based on a visual attention mechanism, in which algorithms aim to explore objects or regions more attentive than the surrounding areas on the scene or RGB images.
( Image credit: [Attentive Feedback Network for Boundary-Aware Salient Object Detection](http://openaccess.thecvf.com/content_CVPR_2019/papers/F...
which one is the best?
grave frost
fringe igloo
But obviously I don't want to "tell" the AI that
you can have a simple y = mx + c expression as a starter point, try different numbers in the variables to produce a line that matches your function (f(x) = x + 5; m=1, c=5). It can be done via just by brute-forcing, but you can also try doing by finding the minima of your loss function (kinda overkill, but a good way to learn the concepts).
the loss function would have to be custom tho - in what way the outputs of your model are far from the actual x+5 solution, so basically making |predicted - actual| --> 5 as close as possible to 5
stable isle
fringe igloo
I'm trying to start my first very simple neural network project, I'd like to mak...
are you saying that for result = 10 you (predict) want the value of number ?
 worthy linden
hi i am working on batchdataset. I am training the Resnet50 model using transfer learning. However, I cannot access the classification metrics of my model results. can you help please i need to train and i can't.
visual violet

@desert oar
after i applied PCA haha
you kinda predicted the PCA tbh
looks so much like this

the color is according to the dosage name
like tablet, solution, etc
visual violet
desert oar
Or are these on more data than prices?
on prices
log prices is simlar i will don't see apparent clusters :((

i am still thinking about how to use Multiple Factor Analysis on python
visual violet
x = ingredient_price_matrix.values
x = StandardScaler().fit_transform(x)

pca = PCA(n_components=2)
principalComponents = pca.fit_transform(x)
principalDf = pd.DataFrame(data = principalComponents
             , columns = ['principal component 1', 'principal component 2'])
finalDf = pd.concat([principalDf, label], axis = 1)

fig = plt.figure(figsize = (8,8))
ax = fig.add_subplot(1,1,1)
ax.set_xlabel('Principal Component 1', fontsize = 15)
ax.set_ylabel('Principal Component 2', fontsize = 15)
ax.set_title('2 Component PCA', fontsize = 20)

targets = label.Dosage_x.unique().tolist()

colors = []
for i in range (len(targets)):
    rgb = (random.random(), random.random(), random.random())
    colors.append(rgb)


for target, color in zip(targets,colors):
    indicesToKeep = finalDf['Dosage_x'] == target
    ax.scatter(finalDf.loc[indicesToKeep, 'principal component 1']
               , finalDf.loc[indicesToKeep, 'principal component 2']
               , c = color
               , s = 50)
ax.grid()
^code
 crude leaf
Can anyone tell my why initializing an array in numpy (ndarray, empty, zeros) all return a random array for index 0?
Well except zeros of course. That one makes sense. Not sure why I included that.
serene scaffold
crude leaf
Can anyone tell my why initializing an array in numpy (ndarray, empty, zeros) al...
can you give an example?
 silver sun
Is anyone here familiar with rapid ML prototyping?
 main fox
visual violet
i couldn't find the python codes for time-series
main fox
visual violet
i couldn't find the python codes for time-series
Try sktime. It's basically an extension of sklearn
crude leaf
serene scaffold
can you give an example?

 worn bough
crude leaf
worn bough
crude leaf
I'm guessing it has to do something with the underlying C code. Initializing this array frees up some memory to store its values. You didn't specify which values it should have, so it contains the values that already happened to be there in memory
This is not the case for zeros btw, because you specify the values need to be 0 everywhere and that's what it does
 short heart
Should I only use features with biggest value after I checked them with mutual_info_regression
 scarlet siren
Anyone knows a good AI course?
visual violet
my data doesn't show any type of clusters whatsoever
despite different techniques lol
serene scaffold
worn bough
I'm guessing it has to do something with the underlying C code. Initializing thi...
if memory is being assigned to store certain data, we would call that "allocation". And then it's "freed up" when that data is no longer needed.
serene scaffold
crude leaf
I guess arrays just get filled with arbitrary numbers if you don't specify
worn bough
serene scaffold
if memory is being assigned to store certain data, we would call that "allocatio...
Thanks, sorry for messing up the terminology
 tidal bough
serene scaffold
I guess arrays just get filled with arbitrary numbers if you don't specify
tidal bough
serene scaffold
I guess arrays just get filled with arbitrary numbers if you don't specify
Arrays should be constructed using array, zeros or empty (refer to the See Also section below). The parameters given here refer to a low-level method (ndarray(…)) for instantiating an array.
yeah, it's likely that a call with justshapeis equivalent toempty- it doesn't initialize the allocated memory.
serene scaffold
tidal bough
> Arrays should be constructed using array, zeros or empty (refer to the See Als...
so you just get whatever bits are in that block of memory that was chosen to be your array?
 undone meadow
|| this channel is awesome ||
visual violet
first time i see the thump up in the color lol
 hollow ember
@grave breach
tidal bough
serene scaffold
so you just get whatever bits are in that block of memory that was chosen to be ...
Yeah, pretty much

 wet folio
 drowsy maple
plz help
drowsy maple
plz help
try replacing fhandle in the y = re.findall part with line
 somber prism
guys i wanna know whether standardization and normalization are same ? ik standardization will convert the mean to 0 and std to 1. so is normalization a similar thing ?
tidal bough
well, it does look like it is.
it does make sense that duration and ditance are correlated positively 😛
meanwhile, it also makes sense (first pic) that the faster you run, the less time you can sustain that for
not really, no, I don't see it
feel free to test it by taking only the points with duration < 30 minutes and checking the correlation for them
not sure what you mean
strictly speaking one can't say based on this graphic, because you can't see the density of the points because they are all on top of each other
but I would expect that running for longer means you cross more distance 😅
how are you seeing it?
what correlation coeffs are you getting?
well, one is positive and the other is negative as expected
though what's weird is that both are this low in magnitude.
...though I guess that's to be expected from such noisy data
there's some way to make an effect size from this, which describes how real this correlation is, but this is beyond the statistics I know
 dense moon
hey everyone I have been through this library but I couldn't manage to run it properly I would be grateful if someone help me
Library https://github.com/pmathur5k10/Credit-Card-Recognition
Error:
 serene scaffold
dense moon
hey everyone I have been through this library but I couldn't manage to run it pr...
serene scaffold
dense moon
hey everyone I have been through this library but I couldn't manage to run it pr...
I might be able to help if you give the error as text.
dense moon
serene scaffold
I might be able to help if you give the error as text.
C:\Users\SARAC\Downloads\Credit-Card-Recognition-master\Credit-Card-Recognition-master>python ocr_template_match.py --image images/credit_card_01.png --reference ocr_a_reference.png
Traceback (most recent call last):
File "C:\Users\SARAC\Downloads\Credit-Card-Recognition-master\Credit-Card-Recognition-master\ocr_template_match.py", line 42, in <module>
refCnts = contours.sort_contours(refCnts, method="left-to-right")[0]
File "C:\Users\SARAC\AppData\Local\Packages\PythonSoftwareFoundation.Python.3.9_qbz5n2kfra8p0\LocalCache\local-packages\Python39\site-packages\imutils\contours.py", line 23, in sort_contours
boundingBoxes = [cv2.boundingRect(c) for c in cnts]
File "C:\Users\SARAC\AppData\Local\Packages\PythonSoftwareFoundation.Python.3.9_qbz5n2kfra8p0\LocalCache\local-packages\Python39\site-packages\imutils\contours.py", line 23, in <listcomp>
boundingBoxes = [cv2.boundingRect(c) for c in cnts]
cv2.error: OpenCV(4.5.2) C:\Users\runneradmin\AppData\Local\Temp\pip-req-build-ttbyx0jz\opencv\modules\imgproc\src\shapedescr.cpp:874: error: (-215:Assertion failed) npoints >= 0 && (depth == CV_32F || depth == CV_32S) in function 'cv::pointSetBoundingRect'
thank you in advance
tidal bough
Like I mentioned, small correllation doesn't necessarily mean no corellation - some effects really are just small
one is supposed (in real applications) to somehow take into account how many points this is based on, etc, to calculate if that's a real effect
serene scaffold
dense moon
C:\Users\SARAC\Downloads\Credit-Card-Recognition-master\Credit-Card-Recognition-...
Ah, I don't know anything about OpenCV, though this SO explains what that error message means: https://stackoverflow.com/questions/54734538/opencv-assertion-failed-215assertion-failed-npoints-0-depth-cv-32

Stack Overflow
I have found the following code on this website:
import os
import os.path
import cv2
import glob
import imutils
CAPTCHA_IMAGE_FOLDER = "generated_captcha_images"
OUTPUT_FOLDER = "extracted_letter_...
tidal bough
&
dense moon
serene scaffold
Ah, I don't know anything about OpenCV, though this SO explains what that error ...
thank you but I don't know which line should I change on the script
tidal bough
Yup, but you need to wrap both in parens because & has higher priority than comparisons
so bike[(bike['duration_min'] >= 30) & (bike['duration_min'] <= 120)]
serene scaffold
you put a condition in .loc
 lapis sequoia
hello everyone, I'm looking for someone who knows NLP well, please, I do need a helping hand to quickly advance my work thank you for writing to me in private message, excellent day to you!
 flint mason
anyone familiar with this error
ValueError: setting an array element with a sequence.
I am trying to train a Gaussian bayes model from scikit learn library
dense moon
serene scaffold
Ah, I don't know anything about OpenCV, though this SO explains what that error ...
thank you I have solved the issue
 vestal grotto
how do you align the text in a pandas df to the left?
visual violet
hello everybody
how do you guys now when a data is no longer useful?
like after cerain tests
serene scaffold
vestal grotto
how do you align the text in a pandas df to the left?
 hasty mountain
Hey guys, I want to use my model to make a price prediction many times using the same X_test and extract the mean of those predictions, can someone give me some help?
I'm thinking about doing something like this:
for price:
    predicted = []
    price = model.predict(X_test)
    predicted.append(price)

print(predicted.mean())```
As you may notice, I have no idea on how to make this `for` loop, but I'd like to make like 20 different predictions and print their mean.In the python ai world, models typically do predictions on batches of data given as arrays.
So if you wanted to get the average of all the predictions over X_test, model should be designed such that model.predict(X_test).mean() returns the desired value.
I assume model is something from sklearn?
hasty mountain
serene scaffold
I assume `model` is something from sklearn?
Yes, it's a decision tree.
But the X_test in this case is a DataFrame with data for a single day, so model.predict(X_test) will return an array with a single element
serene scaffold
hasty mountain
But the X_test in this case is a DataFrame with data for a single day, so `model...
How many dataframes there that have that schema?
hasty mountain
I wanted to create many values and get the mean
hasty mountain
serene scaffold
How many dataframes there that have that schema?
Just this one. The data used for training is more robust and got many values
serene scaffold
also can you do print(X_test.to_csv())?
hasty mountain
serene scaffold
also can you do `print(X_test.to_csv())`?
No need.
Here's the dataframe
 serene scaffold
hasty mountain
serene scaffold
hasty mountain
Going forward, note that I won't read any screenshots of text
If there's only one day for you to predict for, what is it that you will be taking the mean of?
hasty mountain
      Open  High   Low  Adj Close       Volume
Test  5675  5700  5605       5688  39541620736
I've fitted it to a proper data with many days and already trained it. I've just created this DataFrame to see the model in action
Like...I've used a data with the historical price through the years, now I just want to check it using the data I got for today.
serene scaffold
if you need to do predictions for more than item, the idiomatic way would be to have all the items you want to predict for in one array and reshape it according to what the model expects
hasty mountain
serene scaffold
if you need to do predictions for more than item, the idiomatic way would be to ...
No, that's not it. I want to make a prediction just for this "test" and predict the "Close" price based on that.
However, I know that every time I run a prediction for this data, it returns a different value(sometimes it returns 5672 for example sometimes 5644...), so I want it to make like 10 predictions and return the mean of those values.
That's why I was trying to create a for loop.
serene scaffold
hasty mountain
No, that's not it. I want to make a prediction just for this "test" and predict ...
You could use a list comprehension with range
hasty mountain
serene scaffold
You could use a list comprehension with range
So, would it be something like:
for price in model.predict(X_test):
    predicted = []
    predicted.append(price)
    print(np.mean(predicted))
?
hasty mountain
Hm...it kinda worked...but it only makes a single prediction
hasty mountain
serene scaffold
What is your iterable here?
I don't know how to make it make more predictions, though. It works as if I've typed print(model.predict(X_test))
serene scaffold
hasty mountain
I don't know how to make it make more predictions, though. It works as if I've t...
right. your goal is to do model.predict(X_test) ten times, right?
hasty mountain
serene scaffold
right. your goal is to do `model.predict(X_test)` ten times, right?
Yes
serene scaffold
hasty mountain
Yes
so you need to have ten iterations. How is for price in model.predict(X_test) going to do that?
hasty mountain
serene scaffold
so you need to have ten iterations. How is `for price in model.predict(X_test)` ...
I don't know
serene scaffold
hasty mountain
I don't know
you can use range to make sure you get ten iterations
 vague hatch
mean = np.mean([model.predict(X_test) for _ in range(10)])
hasty mountain
serene scaffold
you can use `range` to make sure you get ten iterations
Uh... it wouldn't be
for price in model.predict(X_test) in range(10)```
right?
I got
`TypeError: 'bool' object is not iterable`No, that doesn't really make sense, syntactically
hasty mountain
vague hatch
`mean = np.mean([model.predict(X_test) for _ in range(10)])`
This returns the same prediction 10 times
serene scaffold
Then I guess it predicts the same thing every time for that input
vague hatch
Are you using a train, test split?
hasty mountain
Yes, I've fitted the model and even made some hyperparameter tuning
crude leaf
serene scaffold
I guess arrays just get filled with arbitrary numbers if you don't specify
That’s a good point. Makes perfect sense. I guess I was just figuring it would be “empty” like a standard python list. My issue is that now when I np.append() I have arándome value at index 0. I’m not sure if I then just ignore index 0 in my programming or if I can overwrite it, or what. I’ll have to look more into the docs.
crude leaf
crude leaf
That’s a good point. Makes perfect sense. I guess I was just figuring it would b...
A random. Not arándome, whatever that is.
serene scaffold
crude leaf
That’s a good point. Makes perfect sense. I guess I was just figuring it would b...
one usually wants to avoid using append with numpy/pandas because it involves copying the entire data structure
crude leaf
Is there a better way to add items to an array?
serene scaffold
if you plan to append multiple times, you can first accumulate all of those items and then use np.concatenate
 velvet thorn
crude leaf
It would be a second array I assume?
velvet thorn
crude leaf
It would be a second array I assume?
a list
generally you don’t store nonprimitives in arrays
visual violet
hello guys
what is your go-to researech paper
when you need to cite some definition about pca
crude leaf
velvet thorn
a `list`
I was trying to avoid lists because they are slower, but good point.
thorn bobcat
anyone here worked with Restyle Encoder
this is the paper for reference
https://www.arxiv-vanity.com/papers/2104.02699/
I just want to know how do I begin using it.
there's no docs
anyone?
flint mason
Has anyone converted a dataframe with data type object to numpy array. Note: here object is not categorical columns it’s a list
grave frost
thorn bobcat
anyone here worked with Restyle Encoder
this is the paper for reference
https:...
 covert iron
Hello! I want to create voice bot. Can anyone please provide some resources for that?
velvet thorn
crude leaf
I was trying to avoid lists because they are slower, but good point.
they are slower for certain operations
that is not one of them
serene scaffold
if all you're doing is accumulating stuff and then iterating it over it once to convert it to an array, a deque would guarantee that you only have to pass over everything twice, yes?
(though it might not be worth potentially confusing people as to why you're using a deque)
velvet thorn
serene scaffold
if all you're doing is accumulating stuff and then iterating it over it once to ...
sorry I didn’t get that
serene scaffold
instead of appending to an array n times, the suggestion is to append to a list, and then concatenate all the arrays in that list, yes? since lists occasionally have an O(n) append when a larger underlying array has to be created, using a deque might be faster, since every append is O(1)
 hardy jetty
Does someone here have some plotly experience?
 hollow gull
sticx I have some python plotly experience.
Anyone ever experienced a logistic regression with a mild class imbalance that has persistent bias in the training data. Average actuals are around 80% average scores in training are about 60%. It strikes me as a big red flag that something is deeply wrong, but I was curious if anyone has experience with this or if they know of a theoretical reason it might happen.
hardy jetty
hollow gull
sticx I have some python plotly experience.
I'm trying to create a table figure with plotly, it works with the create_table method from the figure_factory. But that method has really limited options, can't even align the text in the table to the center or right side (at least, it isn't in the documentation). So I tried to make it myself with graph_objects. However, when I do that it only shows half the table when I do fig.show(), or 1/3th the table when I write it to an image.
rowOddColor = '#f1f1f2'
rowEvenColor = 'white'
layout = go.Layout(autosize=True, margin={'l': 0, 'r': 0, 't': 0, 'b': 0})

fig = go.Figure(layout=layout, data=[go.Table(
    header=dict(values=list(df_print.columns),
                fill_color='#40466e',
                align='center',
                font=dict(color='white')
    ),
    cells=dict(values=[df_print[col] for col in df_print.columns],
               fill_color=[[rowOddColor,rowEvenColor]*26],
               align='right'))
])

fig.show()
fig.write_image("imagetest.png")```it doesn't have any docs tho
hollow gull
I haven't used table figures before. Let me install plotly quickly on this computer and poke around a little bit.
thorn bobcat
look at the docs file
model = torch.jit.load('PATH_TO_MODEL.pth')
anyone have any idea what PATH_TO_MODEL.pth is supposed to mean?
hollow gull
It looks like they expect a string that represents a path to a model object.
@hardy jetty can you share the code using the create_table method?
thorn bobcat
any idea where the model object is in this repo https://github.com/PeterL1n/BackgroundMattingV2

GitHub
Real-Time High-Resolution Background Matting. Contribute to PeterL1n/BackgroundMattingV2 development by creating an account on GitHub.
hardy jetty
hollow gull
<@!255136964611670037> can you share the code using the create_table method?
from plotly.figure_factory import create_table
plotlytable = create_table(df_print)
plotlytable.show()
you could search for .pth in the repo. I am guessing that they didn't commit the model objects.
@hardy jetty the table seems to format okay for me. Do you have really big strings you are trying to print or something?
hollow gull
Also it seems like you can use latex to specify formatting and special characters. That might be another way of changing the formatting.
hardy jetty
also for the create_table method?
hollow gull
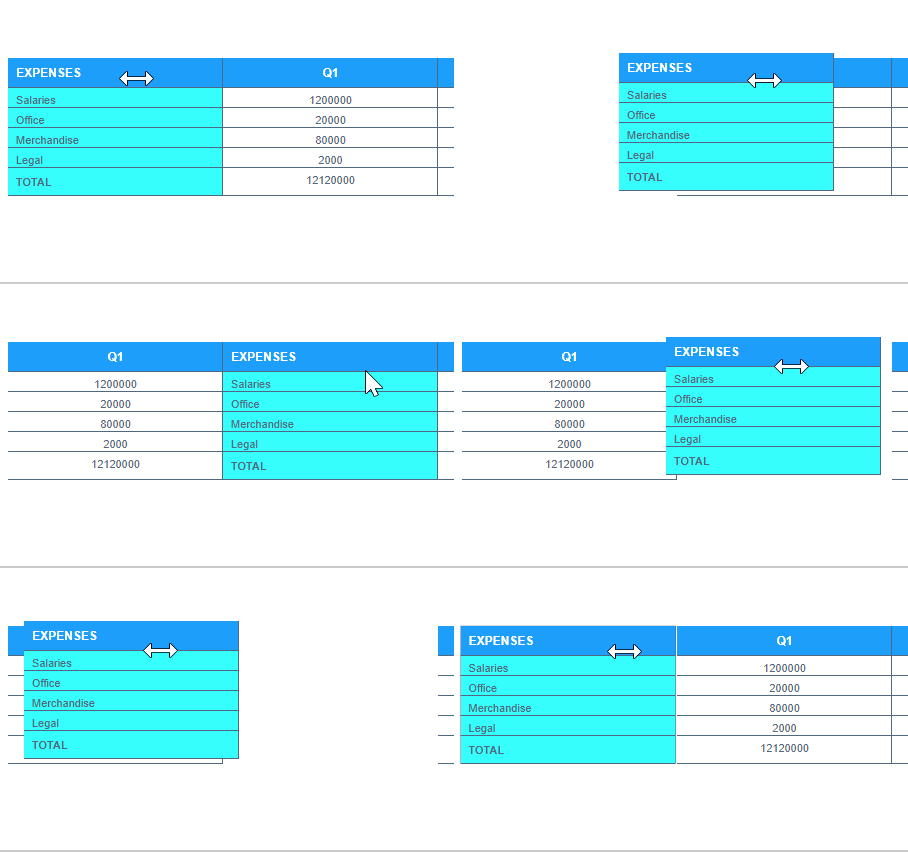
How to make tables in Python with Plotly's Figure Factory.
thorn bobcat
hollow gull
you could search for .pth in the repo. I am guessing that they didn't commit the...
yep they didn't
what would you suggest I do in this case?
hardy jetty
hollow gull
https://plotly.com/python/figure-factory-table/
In that example you can see that Q1 is centered and Expenses is aligned to the left. I can't even manage that haha
I don't need to shuffle them around I can do that with pandas
but if you look here, there are not much parameters to accomplish this: https://plotly.com/python-api-reference/generated/plotly.figure_factory.create_table.html
hollow gull
They mention that they take arguments to the heatmap object, but it does't seem to have arguments related to text alignment either.
hardy jetty
yeah :\
hardy jetty
hardy jetty
```py
rowOddColor = '#f1f1f2'
rowEvenColor = 'white'
layout = go.Layout(autosize...
This code is using the graph_objects.table
hollow gull
Yeah, it looked interesting though.
crude leaf
serene scaffold
if all you're doing is accumulating stuff and then iterating it over it once to ...
The application is to grab RGB values for pixels in a defined region each time a function is called. My thought with lists was that they were too slow, so I was initializing an empty array and then appending values to that array, which turns out to be slow as you pointed out. I tried concatenating a list to an np array and it wouldn't work. I tried the recommendation to concatenate a list to an array as well and it's not working. I'm thinking you need to have an array to concatenate.
thorn bobcat
can I get some help in #help-falafel. I just need a quick explanation
hollow gull
@hardy jetty Do you want to grab a help channel, and we can chat there?
serene scaffold
crude leaf
The application is to grab RGB values for pixels in a defined region each time a...
"I tried the recommendation to concatenate a list to an array as well and it's not working."
What code, exactly, did you run, and in what way did it not work?
hollow gull
Anyone ever experienced a logistic regression with a mild class imbalance that has persistent bias in the training data. Average actuals are around 80% average scores in training are about 60%. It strikes me as a big red flag that something is deeply wrong, but I was curious if anyone has experience with this or if they know of a theoretical reason it might happen.
crude leaf
serene scaffold
"I tried the recommendation to concatenate a list to an array as well and it's n...
Figured it out. My list had the wrong shape. Forgot to add the second set of brackets. Thanks for the help.
visual violet
how to start learning data science seriously?
serene scaffold
visual violet
how to start learning data science seriously?
what degree program are you in again?
visual violet
serene scaffold
what degree program are you in again?
i just got in college hehe, but i plan to declare a major in cs + chemistry in my second year
serene scaffold
visual violet
i just got in college hehe, but i plan to declare a major in cs + chemistry in m...
sounds like you're going to be spreading yourself thin if you want to do CS and chemistry, and orient your CS stuff towards data science
hollow gull
There is a lot of variance in how much work load students can take. You might be right, but if you worded it more weakly you might reduce how much you discourage.
serene scaffold
hollow gull
There is a lot of variance in how much work load students can take. You might be...
I gave my opinion. they shouldn't take life advice from someone on the internet without a grain of salt.
hollow gull
nice job taking ownership
sorry, probably too strong of a response, but it felt like you were saying that it is okay to give bad advice because it is the internet.
serene scaffold
hollow gull
nice job taking ownership
What am I not taking ownership of? I wouldn't recommend majoring in both CS and chemistry, and I stand by that, but they don't have to listen to me.
hollow gull
It didn't feel like you disagreed with my suggestion, instead you don't care about providing better advice because it is on the internet and they don't need to listen to you.
serene scaffold
I can't tell what the point of this discussion is, so I'm going to disengage.
hollow gull
okay, sorry for not communicating my point well.
drowsy maple
wet folio
try replacing fhandle in the `y = re.findall` part with line
yeah it striked me today morning... thanks btw
 old meteor
dataframe.style.format({'weight':'{:+.2f}'})
print(dataframe)
Any idea why this code doesn't change anything to the dataframe?
I want to format the number in the 'weight' column in the df.
There's no error but it doesn't change the format.
lapis sequoia
df= dataframe.style.format({'weight':'{:+.2f}'})
print(df)
I am also learning maybe incorrect
old meteor
Let me try this, thanks
No, it's wronger I think. It would print an object instead of the dataframe
The above only works if I don't specifiy the column. It would however change the format in the whole dataframe. If I specify the column, nothing changes anymore though. Very strange
e.g. dataframe.style.format('{:+.2f}') works.
After adding column name it doesn't
grave frost
thorn bobcat
it doesn't have any docs tho
it does
 hexed grove
has anyone ever deployed a deep learning model(face detection model to be specific) in Django app here?
lapis sequoia
Bruh! I just started programming and learned python and after seeing this i feel like im a . In this whole programming world 0-0
 pure sleet
whats the best way to learn scikit learn?
old meteor
old meteor
There's no error but it doesn't change the format.
It turns out df.style.format only changes the output format, not the real data. So print(df) will not show the change.... OMG. It took me whole day to find out this
somber prism
guys i have one dataset that have 49% NaN values for one feature , should i drop it or fill them with mean vals ?
somber prism
pure sleet
whats the best way to learn scikit learn?
youtube
 winged yew
deep learning
 ripe forge
Generally that's very high. But you have to decide based on what it means.
winged yew
anyone ?
somber prism
somber prism
guys i have one dataset that have 49% NaN values for one feature , should i drop...
can someone help me with this
lapis sequoia
can y'all suggest a nice resource to learn
not a video series
Something like real python
but not the real python course, cause thats a video series 😛
or should i even take a course
How would you suggest is the best way to get good at ML, considering im good at DSA
And link a resource
 limpid oak
after struggling lot I'm here to find some help
serene scaffold
pure sleet
whats the best way to learn scikit learn?
It's a general-purpose machine learning library. I would just try using its various features for stuff.
limpid oak
I have df with some special character in my columns, so I made a function to remove it from values
but it needs to be applied on multiple columns
  string = re.sub(r"[\n\t\•\r]*", "", str(string))
  return string
I tried this
    'general_advisory_eng','general_advisory_reg',
    'sms_eng','sms_reg','advisory_eng','advisory_reg']] = df[['weather_summary_eng','weather_summary_reg',
                                                              'general_advisory_eng','general_advisory_reg',
'sms_eng','sms_reg','advisory_eng','advisory_reg']].apply(remove_splChar)```but getting following error
---------------------------------------------------------------------------
ValueError                                Traceback (most recent call last)
<ipython-input-117-d72b8c142c56> in <module>
      3     'sms_eng','sms_reg','advisory_eng','advisory_reg']] = df[['weather_summary_eng','weather_summary_reg',
      4                                                               'general_advisory_eng','general_advisory_reg',
----> 5                                                               'sms_eng','sms_reg','advisory_eng','advisory_reg']].apply(remove_splChar)

C:\ProgramData\Anaconda3\lib\site-packages\pandas\core\frame.py in __setitem__(self, key, value)
   3365             self._setitem_frame(key, value)
   3366         elif isinstance(key, (Series, np.ndarray, list, Index)):
-> 3367             self._setitem_array(key, value)
   3368         else:
   3369             # set column

C:\ProgramData\Anaconda3\lib\site-packages\pandas\core\frame.py in _setitem_array(self, key, value)
   3393                 indexer = self.loc._convert_to_indexer(key, axis=1)
   3394                 self._check_setitem_copy()
-> 3395                 self.loc._setitem_with_indexer((slice(None), indexer), value)
   3396
   3397     def _setitem_frame(self, key, value):

C:\ProgramData\Anaconda3\lib\site-packages\pandas\core\indexing.py in _setitem_with_indexer(self, indexer, value)
    609
    610                     if len(labels) != len(value):
--> 611                         raise ValueError('Must have equal len keys and value '
    612                                          'when setting with an iterable')
    613

ValueError: Must have equal len keys and value when setting with an iterable```I also tried lambda function
serene scaffold
limpid oak
```def remove_splChar(string):
string = re.sub(r"[\n\t\•\r]*", "", str(string)...
if you wanted to apply it to each cell individually, you would use applymap
though you'll get better performance if you use the built-in string manipulation methods
limpid oak
which run ok, but only on specific column after made selection
df['general_advisory_reg'] = df.apply(lambda x:re.sub(r"[\n\t\•\r]*", "", x['general_advisory_reg']),axis=1)
how can I apply lambda function to each column
serene scaffold
limpid oak
how can I apply lambda function to each column
setting the axis to 1
each column will be a Series, and those have string manipulation methods
limpid oak
serene scaffold
setting the `axis` to `1`
as you can see I tried with setting axis =1
serene scaffold
limpid oak
as you can see I tried with setting axis =1
you tried writing the result back to one column though
limpid oak
Can you please correct me
serene scaffold
is general_advisory_reg the only column you need to correct?
limpid oak
no
    'general_advisory_eng','general_advisory_reg',
'sms_eng','sms_reg','advisory_eng','advisory_reg']]```bad_columns = ['weather_summary_eng','weather_summary_reg', 'general_advisory_eng','general_advisory_reg', 'sms_eng','sms_reg','advisory_eng','advisory_reg']
this are the columns that needs to be apply function
serene scaffold
let's have that variable so everything isn't so verbose
!docs pandas.Series.str.replace
 arctic wedgeBOT
Series.str.replace(pat, repl, n=- 1, case=None, flags=0, regex=None)```
Replace each occurrence of pattern/regex in the Series/Index.

Equivalent to [`str.replace()`](https://docs.python.org/3/library/stdtypes.html#str.replace "(in Python v3.9)") or [`re.sub()`](https://docs.python.org/3/library/re.html#re.sub "(in Python v3.9)"), depending on the regex value.consider this
limpid oak
serene scaffold
if you wanted to apply it to each cell individually, you would use `applymap`
thank you so much @serene scaffold I missed this
this worked fine
limpid oak
arctic wedge
let me try this
hollow ember
Whats the error here guys?
 serene scaffold
hollow ember
Whats the error here guys?
serene scaffold
hollow ember
Whats the error here guys?
Lin is the whole class rather than an instance
hollow ember
how do i fix it
serene scaffold
hollow ember
how do i fix it
do you know the difference between a class and an instance?
hollow ember
maybe not
serene scaffold
hollow ember
maybe not
a class is a template for a type of data, and an instance is the data
for the time being, just do lin = LinearRegression()
as a matter of style, lin should be lower case.
hollow ember
serene scaffold
for the time being, just do `lin = LinearRegression()`
that worked
serene scaffold
👍
serene scaffold
limpid oak
let me try this
did it work?
limpid oak
serene scaffold
did it work?
trying, reading doc
hollow ember
@serene scaffold Can i use Linear regression model in this dataset, right?
 serene scaffold
hollow ember
<@!253696366952316929> Can i use Linear regression model in this dataset, right?
serene scaffold
hollow ember
<@!253696366952316929> Can i use Linear regression model in this dataset, right?
you're trying to predict the outcome, right? I don't think linear regression is right for that
hollow ember
yeah , any easier models you would like to suggest
serene scaffold
hollow ember
yeah , any easier models you would like to suggest
you could try a random forest
serene scaffold
if that doesn't work, you might try support vector machines
limpid oak
serene scaffold
did it work?
so simple ,thank so much bro
               'general_advisory_eng','general_advisory_reg',
               'sms_eng','sms_reg','advisory_eng','advisory_reg']
'''
def remove_splChar(string):
  string = re.sub(r"[\n\t\•\r]*", "", str(string))
  return string
'''
# df[bad_columns] = df[bad_columns].applymap(remove_splChar)

df[splChar_columns] = df[splChar_columns].replace(r"[\n\t\•\r]*", "",regex=True)
df.head(1)```rather writing so long code, it did in one line
but can you please help me with lambda function so i can understand where i made mistake
limpid oak
limpid oak
```df['general_advisory_reg'] = df.apply(lambda x:re.sub(r"[\n\t\•\r]*", "", x['...
this one
@serene scaffold
serene scaffold
limpid oak
but can you please help me with lambda function so i can understand where i made...
I think the axis was wrong
df.apply(..., axis=1) will call the function for each column, but then you were trying to pick a specific column
limpid oak
can you suggest any practice notebook so I can polish some skills, for lambda, apply, applymap
serene scaffold
limpid oak
can you suggest any practice notebook so I can polish some skills, for lambda, a...
I don't recommend notebooks
I think they encourage bad practices and aren't actually as useful as people think they are
limpid oak
then please suggest good path for new learner like us
serene scaffold
Hmm. I'm actually still trying to find good general pandas resources
I'll put a pin in this channel or something when I figure it out
limpid oak
thank you so much bro, please be around
serene scaffold
I check this channel throughout the day
 uncut barn
is there a way for python to append many sublists to a list?
i.e.
x = []
y = [1, 2]
z = [-1, -2]

giving
x = [[1, 2], [-1, -2]]
so doing it in one go rather than saying append repeatedly
grave frost
uncut barn
is there a way for python to append many sublists to a list?
i.e.
```py
x = []
y...
not sure how to do it with lists, but if you are using tensors then torch.stack does that
*pytorch
uncut barn
yh in python, i dont think there is one
ripe forge
I mean, you just write x = [y, z] and it's done, no?
Why even bring append into the picture, it's just straightforward to write
uncut barn
yh but curious if there was a python function for this
serene scaffold
uncut barn
yh but curious if there was a python function for this
does there need to be?
if you know which lists you want to put into an outer list, then you can just write that. If you need to do it for an arbitrary number of lists that are in a container of some kind, you can just pass that container to list
serene scaffold
grave frost
not sure how to do it with lists, but if you are using tensors then `torch.stack...
more generally, there's np.stack
uncut barn
thanks
 bold timber
Hi, I have a question: Why when I change the number of 'n_components' to 3 or 4 I get an error?
FYI: I have a dataset with 14 columns with 13 independent variables and 1 dependent variable.
 tidal bough
bold timber
Hi, I have a question: Why when I change the number of 'n_components' to 3 or 4 ...
tidal bough
bold timber
Hi, I have a question: Why when I change the number of 'n_components' to 3 or 4 ...
What error do you get?
bold timber
tidal bough
What error do you get?
Like this
 tidal bough
Hmm, what's the shape of X_train?
bold timber
tidal bough
Hmm, what's the shape of `X_train`?
142, 2
tidal bough
bold timber
142, 2
well, there you go, you only have 2 columns in the training data, so it's 2-dimensional. Can't reduce 2 dimensions to 3 principal components.
if you were supposed to have 13 independent variables, you lost 11 of them somewhere
or is that the shape after you transform it?
bold timber
tidal bough
or is that the shape *after* you transform it?
yes that shape i use after using 'fit_transform'
tidal bough
What was the original shape?
bold timber
tidal bough
What was the original shape?
before fit_transform?
bold timber
tidal bough
I assume you get the error on the training line?
Before fit_transform the number of shape is 142, 13
How it's works actually?
Why when i change the number of 'n_components' to 3 and I 'restart and run all the cell' on the kernel, I can get the result with shape is 142, 3? @tidal bough
tidal bough
That's what PCA does, reduces the dimensionality of the data in such a way as to lose as little information is possible
Wait, you do get the result? Where do you get an error then? On the transform(X_test) line?
hollow ember
Anyway to fix this? @serene scaffold
 bold timber
tidal bough
Wait, you do get the result? Where do you get an error then? On the `transform(X...
bold timber
tidal bough
Wait, you do get the result? Where do you get an error then? On the `transform(X...
Yes, but why?
tidal bough
Hmm, what's the shape of X_test (before you transform it)?
bold timber
tidal bough
Hmm, what's the shape of `X_test` (before you transform it)?
36, 13 with test_size = 0.2
and the original rows is 178
tidal bough
that's strange; nothing in these shapes suggests you're feeding too low-dimensional data
are you sure you don't accidentally feed the training/test data through the PCA twice?
bold timber
tidal bough
that's strange; nothing in these shapes suggests you're feeding too low-dimensio...
god damn, you're so clever. i try to cross check again and evidently i used this twice
but, how do you know? how it's work actually?
tidal bough
Well, the error says rather directly that the issue is that you're trying to reduce the data to more dimensions than it has
so something is wrong with the input data (it's missing most of the dimensions)
and then I noted that you're doing a rather weird thing of rewriting X_train and X_test with the results of the transform, which can create such a problem if you accidentally then try running the data through the PCA again
bold timber
tidal bough
and then I noted that you're doing a rather weird thing of *rewriting* `X_train`...
I using 2 fit_transform because at the first i wanna to check how much variance can explained with 2 Principal Components with 'n_components = None'
But I have a question again, how i can to determine the number of PC?
What is parameter to decide using 2 or 3 PCA?
limpid oak
what am I missing here
    """
    Here we are going save the dataframe in memory
    and use copy_from() to copy it to the table
    """
    # save dataframe to an in memory buffer
    buffer = StringIO()
    df.to_csv(buffer, index=False, header=False)
    buffer.seek(0)

    cursor = conn.cursor()
    try:
        cursor.copy_from(buffer, table, sep=",")
        conn.commit()
    except (Exception, psycopg2.DatabaseError) as error:
        print("Error: %s" % error)
        conn.rollback()
        cursor.close()
        return 1
    print("copy_from_stringio() done")
cursor.close()```CONTEXT: COPY imd_advisory, line 1: "2021-05-13,1,Crop,93,RICE,27,Maharashtra,509,CHANDRAPUR,8,Marathi,During next five days on dated 14t..."```anybody?
 heavy bay
Hi, so I want to learn machine learning, I have made some simple projects using SK learn and I know a little bit of linear algebra, can you please link some good resources (which aren't to hard to follow) to go from ML begginer-ish to Intermediate?. Thanks
tidal bough
bold timber
I using 2 fit_transform because at the first i wanna to check how much variance ...
Ah, I see
tidal bough
bold timber
But I have a question again, how i can to determine the number of PC?
The more components, the more information is retained, but, well, the more data remains. PCA is used for dimensionality reduction, so you reduce to however many dimensions it'd be easy to work with afterwards, depending on what you're doing.
You could, say, be reducing a 1000-parameter dataset to only a few dozen dimensions.
bold timber
tidal bough
The more components, the more information is retained, but, well, the more data ...
Oh okay i see, thank u so much
 humble birch
hi new to pandas, So i have table of baseball stats, and how each player did each year. I have gotten so it only shows rows players in 2018. My question is how would i get all the rows that have playerID's that exist in 2018 if that makes sense, or if thats even a question to be ask in this channel.
serene scaffold
humble birch
hi new to pandas, So i have table of baseball stats, and how each player did eac...
This is the channel for pandas questions, yes.
You can use loc to select rows that satisfy a certain condition and then project the column(s) of interest.
!docs pandas.DataFrame.loc
arctic wedgeBOT
property DataFrame.loc: pandas.core.indexing._LocIndexer```
Access a group of rows and columns by label(s) or a boolean array.

`.loc[]` is primarily label based, but may also be used with a boolean array.

Allowed inputs are:>>> df
max_speed shield
cobra 1 2
viper 4 5
sidewinder 7 8
>>> df.loc[df['max_speed'] > 6, 'shield']
max_speed
sidewinder 7
That's an example from the docs. The select rows wehre the max speed is > 6 and project shield.
If you've gotten that far, the next step probably involves isin
!docs pandas.Series.isin
arctic wedgeBOT
Series.isin(values)```
Whether elements in Series are contained in values.

Return a boolean Series showing whether each element in the Series matches an element in the passed sequence of values exactly.can anybody correct me please
 acoustic forge
Does someone have a nice explanation/link to an explanation of Latent Dirichlet Allocation
thorn bobcat
discord needs a better way to track mentions
like it should directly go to the first instance of the mention and so on
serene scaffold
cedar sun
guys, what does actually ``fit`` method wants?
for what class?
cedar sun
for a model
serene scaffold
cedar sun
for a model
...for what class?
serene scaffold
can you show the code?
cedar sun
    history = model.fit(train_generator,
                        validation_data=valid_generator,
                        epochs=2,
                        callbacks=check_points,
                        verbose=1)
where is model created?
cedar sun
tf.keras.applications
serene scaffold
cedar sun
`` tf.keras.applications``
can you show the code where model is created?
cedar sun
ah no
serene scaffold
model = ...
serene scaffold
Great! Can you also show the line where you create model, and assign the value to the model variable?
This is the documentation for the fit method: https://www.tensorflow.org/api_docs/python/tf/keras/Model#fit
TensorFlow
Model groups layers into an object with training and inference features.
cedar sun
so when it sais
x could be
A generator or keras.utils.Sequence returning (inputs, targets) or (inputs, targets, sample_weights).
it means i can create my own generator too?
serene scaffold
Yes, as long as the values it generates are what is expected
cedar sun
huh okey, thanks
huh maybe u know a way to do this
ImageDataGenerator class has an attribute called color_mode, which basically sais if reading images as gray, rgb, or rgba
My dataset contains rgb and rgba images (and i think gray scale too lel)
the problem is, if i set color_mode to read images as rgba, it crashes when trying to read an rgb image
so i was wondering if i could somehow read all images "unchanged". Like, if an image has 4 channels, get those 4 channels, and if it has 3, then get only 3
 fluid coral
I have a pandas question
I have a dataframe derived from a spreadsheet that groups values in a manner that I don't want and causes a lot of repetition for my purposes
visual violet
what is the clustering method that uses variability as distance metric
instead of physical distance like euclidean
fluid coral
Basically
A B C D
1 1 1 "some string"
1 1 1 "another string"
1 1 1 "yet another"
2 4 5 "woah, more string"
2 4 5 "yeah, more string"
2 4 5 "string string string"
There's only variation in the D column, I don't have the proper lingo/terminology to describe my problem
but I basically just want to spread the data out horizontally by adding more columns and collapse it vertically, if that makes sense
and I unfortunately can't share the actual data itself
visual violet
what is the desired output?
fluid coral
A B C D E F G
1 1 1 "some string" "another string" "yet another"
2 4 5 "woah, more string" "yeah, more string" "string string string"
Something like this
visual violet
how many rows do you want?
fluid coral
I'm not sure, basically I have a lot of unneeded rows that are largely the same as other rows except for a few columns
visual violet
oh i see what you mean
fluid coral
so I'd like to be able to delete a few rows and collapse the values of a select few columns into a different row
kind of like a functional filter I suppose
visual violet
if a row is repeated, just delete it but keep the non repeat columns
fluid coral
Right, but how do I apply that predicate
cedar sun
if someone willing to help on #help-grapes
cedar sun
sad
lapis sequoia

ExamRadar
Data structure is the way we need to organize the data, so that it can be used effectively by the program. So you are all familiar with certain data structures, an array or a list for instance.
time to read a whole book in
1 hour
cedar sun
@serene scaffold hello, sorry for bothering. If i wanna make a fork of this repo https://github.com/keras-team/keras-preprocessing, and modify some code, can i still use the normal keras? or how do i use normal keras but this custom repo?
 slender oracle
clone it, make your changes, and then pip install it.
cedar sun
but this is just a part on keras
like
what would happen when i do import keras
this keras has its own keras.preprocessing
so i wont be using mine
@slender oracle
slender oracle
i’m on my phone rn so can’t be too helpful, sorry.
cedar sun
okey sorry
 fair nimbus
for seperate projects you can use virtual-environments or venv to keep it seperate.
Or if its the same project since your modifying the code, you could change the name of the module in setup.py
I'd guess that you can change Keras_Preprocessing to Keras_Preprocessing_fork or something
serene scaffold
cedar sun
<@!253696366952316929> hello, sorry for bothering. If i wanna make a fork of thi...
you can only have one module with a given name installed at a time. Why is it that you need to modify the source?
cedar sun
cedar sun
if someone willing to help on <#303906556754395136>
it is explained here
cedar sun
serene scaffold
you can only have one module with a given name installed at a time. Why is it th...
but basically is cuz i dont like how it loads the images
serene scaffold
cedar sun
but basically is cuz i dont like how it loads the images
does it really matter? there are a number of issues associated with changing the implementation of an external library, rather than extending it in your own module
cedar sun
i am only changing convert methods
it shouldnt affect anything tho, and if it get some problems, then i will look for another solution
like, idk if there is a fancy way to show difference between 2 repos
but i only did these changes
if grayscale is True:
        warnings.warn('grayscale is deprecated. Please use '
                      'color_mode = "grayscale"')
        color_mode = 'grayscale'
    if pil_image is None:
        raise ImportError('Could not import PIL.Image. '
                          'The use of `load_img` requires PIL.')
    if isinstance(path, io.BytesIO):
        img = pil_image.open(path)
    elif isinstance(path, (Path, bytes, str)):
        if isinstance(path, Path):
            path = str(path.resolve())
        with open(path, 'rb') as f:
            img = pil_image.open(io.BytesIO(f.read()))
    else:
        raise TypeError('path should be path-like or io.BytesIO'
                        ', not {}'.format(type(path)))

#     if color_mode == 'grayscale':
#         # if image is not already an 8-bit, 16-bit or 32-bit grayscale image
#         # convert it to an 8-bit grayscale image.
#         if img.mode not in ('L', 'I;16', 'I'):
#             img = img.convert('L')
#     elif color_mode == 'rgba':
#         if img.mode != 'RGBA':
#             img = img.convert('RGBA')
#     elif color_mode == 'rgb':
#         if img.mode != 'RGB':
#             img = img.convert('RGB')
#     else:
# raise ValueError('color_mode must be "grayscale", "rgb", or "rgba"')```i have only commented the last lines
so nothing weird should have since img is a pillow object, and the convert returns a pillow object as well
cedar sun
serene scaffold
does it really matter? there are a number of issues associated with changing the...
i did it :)
hollow ember
Help me out pls

 royal crest
have you checked out the links for documentation first?
 sleek robin
hey, i thought i could just add two matrices of sizes e.q. (5 x 10) and (5) and it would broadcast, but it causes an exception, so what's the simplest or the best way to do this?
i just want to copy the (5) array 10 times and broadcast it basically
then just add the two together
whats the most pythonic way of doing this with numpy
since it doesnt seem to auto broadcast
oh ok nvm
i just need to reshape it to a column vector i guess
and then it broadcasts
hmm i guess it makes sense, since a 1d numpy array has an implied dimension of 1xn
so you can't add 5x10 and 1x5
now that i think about it
 magic juniper
I have made a neural network, now, How do I train it? its a neural network that takes in 3 different inputs and will return 2 outputs
ripe forge
There should be a .fit method on the model if you're using some neural network library for it. Just pass it your data and run the fit method.
 umbral olive
i got an offer to further my studies in uni with data science course.. so what should i learn to give me a head start for my uni?
should i enhance my python skills or there are other things that i need to learn/explore?
 late shell
How often does a data scientist use hypothesis tests like Wald's test and likelihood ratio test. Should I invest my time studying about them?
late shell
umbral olive
i got an offer to further my studies in uni with data science course.. so what s...
I'm a beginner, but my 2 cents would be : probability and statistics.

 limber tendon
Would anyone recommend DataQuest. io for studying? I'm almost finished with Andrew Ng's ML coursera course
Open to other recommendations as well
serene scaffold
hollow ember
Guys is this correct?
It appears to be set up correctly, though it would be easier if you provided the text as text and showed us what data is in the dataframe.
 covert iron
I have removed all the NANs from the training dataset. But still Xgboost predicts Nan. Anyone know what to do?
serene scaffold
hollow ember
https://colab.research.google.com/drive/1Ly3lNPx_aovPqnlcR7uX2XV1YTiOgCkw
Can you give me editing permission?
serene scaffold
hollow ember
https://colab.research.google.com/drive/1Ly3lNPx_aovPqnlcR7uX2XV1YTiOgCkw?usp=sh...
the effect is the same
hollow ember
i dont get you
serene scaffold
anyway, when you do assignment, put a space on either side of the =
serene scaffold
hollow ember
so is there any thing u would like me to change in that project?
just style. it appears to work correctly but I can't run it.
hollow ember
do need to change smtng so u could run it?
serene scaffold
covert iron
I have removed all the NANs from the training dataset. But still Xgboost predict...
can you show the code?
serene scaffold
hollow ember
do need to change smtng so u could run it?
I don't have the csv, but it's fine
hollow ember
the only doubt i have is what does that 3 determine?
 serene scaffold
hollow ember
the only doubt i have is what does that `3` determine?
serene scaffold
hollow ember
the only doubt i have is what does that `3` determine?
please give code samples as text
hollow ember
so what would be the optimum n value for me, and how to find it?
serene scaffold
hollow ember
so what would be the optimum n value for me, and how to find it?
you could try a few different ones
if it takes too long and you have more than one CPU, you can specify n_jobs
hollow ember
@serene scaffold any way to compare 2 values in a table or like a diagram?
serene scaffold
hollow ember
<@!253696366952316929> any way to compare 2 values in a table or like a diagram?
you can pick different values of n and put metrics about the performance of each in a dataframe
hollow ember
got it , thank you
 broken warren
Hey does so have a good recourse about bptt? i just can't figure it out. i tried to do the derivative my self. It just does not work (I'm trying to build a model in pure python to predict a number simple number sequence. e.g: sin(n))
bold timber
Hi, I have a question: whether unsupervised using a past data to analysis?
 austere swift
magic juniper
I have made a neural network, now, How do I train it? its a neural network that ...
austere swift
magic juniper
I have made a neural network, now, How do I train it? its a neural network that ...
what framework did you make it in?
 balmy ice
hey can anyone tell me which model did this blog used? https://www.kaggle.com/jshih7/car-price-prediction
ARIMA, Linear regression, NRTF??

Explore and run machine learning code with Kaggle Notebooks | Using data from Car Features and MSRP
 ruby summit
Hello. Hope this is the best place to ask. I would like to learn machine learning and its engineering implementations. I have MS in geophysics so I have a fair background about math and physics. If you have any suggestions or point where to start, I greatly appreciate that.
I saw Stanford ML course and Machine Learning A-Z is pretty popular but if you have any source especially for physical problems please let me know. Thank you so much.
 keen root
Hi, I'm stumbling into a bit of a curious problem that I'm not sure what is happening: I have a set of training data that is a large bitstring like [0,1,0,0,0,1,1,1,1,0] (of course I have a gigantic number of rows). However, when I convert every 5 bits into their corresponding integer and then feed the same data to the regression, the accuracy is drastically smaller. Any idea what may be causing this?
magic juniper
austere swift
what framework did you make it in?
I used numpy and followed a tutorial, (I can post code if you like)
im new to AI sorry.
broken warren
You can try wikipedia: backorooergation. It does provide you with nowledge and formulas u can try to implement in your paython code. But it doesn't show you how they were found. So if you want to go deeper into the rabbithole Google sth. like Derivate for backpropergation. (I think ml glosary also has information)
I learnd it like that and im kinda a newbe to. ;)
thorn bobcat
sup geeks
 serene scaffold
 nova tapir
https://cdn.discordapp.com/attachments/818176579439296573/858749787007614996/unk...
nova tapir
https://cdn.discordapp.com/attachments/818176579439296573/858749787007614996/unk...
I might be able to help, but I do not read screenshots of text.
 chilly geyser
@digital nexus You can ask here
@digital nexus
For this
#help-mushroom message
I'd recommend just using scipy and reading their integrate solvers.
IIRC 2nd order is done via transformation into linear system then 'just integrate'
I'm not sure what their default is but you can find out
cedar sun
just use wolfram alpha XD
is there any other kernel for machine learning apart from google colab that can connect with google drive too?
serene scaffold
cedar sun
is there any other kernel for machine learning apart from google colab that can ...
Google drive has an API, so basically any
You can't just download the files you need?
cedar sun
no, what i want is to upload the files with train with my dataset (or download on the local kernel storage the dataset i have on the drive) and with gpu usage
basically an alternative for when colab kicks me q.q
i dont have nvidia gpu tho
amd > nvidia except for ML XD
and raytracing
serene scaffold
@cedar sun I don't know of a free alternative for GPU computation, no
chilly geyser
cedar sun
is there any other kernel for machine learning apart from google colab that can ...
You are essentially asking for free compute
austere swift
cedar sun
is there any other kernel for machine learning apart from google colab that can ...
i'm pretty sure kaggle notebooks can also connect to gdrive
covert iron
serene scaffold
can you show the code?
It got solved!
chilly geyser
cedar sun
as if that was a crime rofl
It's not, it's just that it's not provided a lot
cedar sun
austere swift
i'm pretty sure kaggle notebooks can also connect to gdrive
huh ill take a look, thanks
chilly geyser
Also with miners infiltrated every part of free online stuff, they get provided less and less
chilly geyser
serene scaffold
Google drive has an API, so basically any
Anyway this is correct you can just use the API
Gdrive API is free-ish (like really), and you shouldn't hit the rate limits (if you are something went really wrong)
lapis sequoia
Hey
M lookin for a modelisation for SIR DEterminist model
to be exact the vaccination effect with the SIR DETerminist model
cedar sun
do u know any model for saliency object detection already trained?
 old isle
Need some help with finding some tensor flow functions.
I’ve compiled my keras model, but I’m having trouble accessing which data points correlate with which results. How would I gain that information?
serene scaffold
old isle
I’ve compiled my keras model, but I’m having trouble accessing which data points...
what's the input and the output?
 long shard
bold timber
Hi, I have a question: whether unsupervised using a past data to analysis?
long shard
bold timber
Hi, I have a question: whether unsupervised using a past data to analysis?
Are you looking for Time Series Forecasting ?
dense moon
Hi guys I am confronting an another issue over there I would be appreciated if someone help me out
Library: https://github.com/JafarAkhondali/Iran-credit-card-ocr
Error
Traceback (most recent call last):
File "C:\Users\SARAC\Downloads\Iran-credit-card-ocr-master (1)\Iran-credit-card-ocr-master\main.py", line 488, in <module>
cc, bank_name = run(img_name)
File "C:\Users\SARAC\Downloads\Iran-credit-card-ocr-master (1)\Iran-credit-card-ocr-master\main.py", line 456, in run
c = try_ocr(d1)
File "C:\Users\SARAC\Downloads\Iran-credit-card-ocr-master (1)\Iran-credit-card-ocr-master\main.py", line 177, in try_ocr
classify = inputdata(img_copy)
File "C:\Users\SARAC\Downloads\Iran-credit-card-ocr-master (1)\Iran-credit-card-ocr-master\main.py", line 69, in inputdata
return predict_knn(H)
File "C:\Users\SARAC\Downloads\Iran-credit-card-ocr-master (1)\Iran-credit-card-ocr-master\main.py", line 54, in predict_knn
predict = knn.predict(df.reshape(1, -1))[0]
File "C:\Users\SARAC\AppData\Local\Packages\PythonSoftwareFoundation.Python.3.9_qbz5n2kfra8p0\LocalCache\local-packages\Python39\site-packages\sklearn\neighbors_classification.py", line 175, in predict
neigh_dist, neigh_ind = self.kneighbors(X)
File "C:\Users\SARAC\AppData\Local\Packages\PythonSoftwareFoundation.Python.3.9_qbz5n2kfra8p0\LocalCache\local-packages\Python39\site-packages\sklearn\neighbors_base.py", line 614, in kneighbors
n_samples_fit = self.n_samples_fit_
AttributeError: 'KNeighborsClassifier' object has no attribute 'n_samples_fit_'
 candid oracle
hey if anyone needs help in some open source projects i am read to help (help related to ML, DNN ,CNN)
limpid oak
need some suggestion
arctic wedgeBOT
Hey @limpid oak!
Uh-oh! It looks like your message got zapped by our spam filter. We currently don't allow .txt attachments, so here are some tips to help you travel safely:
• If you attempted to send a message longer than 2000 characters, try shortening your message to fit within the character limit or use a pasting service (see below)
• If you tried to show someone your code, you can use codeblocks
(run !code-blocks in #bot-commands for more information) or use a pasting service like:
limpid oak
I'm using pandas json_normalizer
but there is problem while reading nested loops in json file
please help
df
status    response    date       data
200    IMD Forcast for today    2021-06-28    {'4004': {'2021-06-29': {'rainfall': '0.0', 't...
i have nested values which don't have specific column name
please refer data here
serene scaffold
@limpid oak I'm trying to figure it out
  "data": {
    "3960": {
      "2021-06-29": {
What is the 3960 for?
 weary bone
Hi Guys, I am trying to install opencv on my virtual env. I can't seem to understand the error. Would really appreiciate if someone could help.
 weary bone
Hi Guys, I am trying to install opencv on my virtual env. I can't seem to unders...
weary bone
weary bone
Hi Guys, I am trying to install opencv on my virtual env. I can't seem to unders...
issue with my pip. "easy_install -U pip" worked.
serene scaffold
weary bone
Hi Guys, I am trying to install opencv on my virtual env. I can't seem to unders...
You will need to provide the error message as text, as anyone who helps you will need to Google parts of the error message.
 red hound
Currently iam trying some things, using: https://github.com/philipperemy/keras-tcn.
My settings are close to the settings provided. While the model works like awesome for imdb, for another dataset it simply randomly doesn't learn at all. One run it learns fine, the next it starts learning for one epoch and ends up in refusing to drop loss, then all metrics stay 0.0000000.
Is it most likely a problem of wrong initilization? Do you have any ideas, where the problem could be?
 slim moss
candid oracle
hey if anyone needs help in some open source projects i am read to help (help re...
slim moss
candid oracle
hey if anyone needs help in some open source projects i am read to help (help re...
Hey i am a beginner in this field, could you just suggest some ideas as to what kind of projects should i take up as a beginner?
candid oracle
slim moss
Hey i am a beginner in this field, could you just suggest some ideas as to what ...
what is your goal
 bronze skiff
pick up bishop and start chuggin
slim moss
candid oracle
what is your goal
Not any goal as such but i just want to make use of pytorch and explore more in it
bronze skiff
supplement with murphy
slim moss
candid oracle
what is your goal
I could think of making a spam filter bot on discord
slim moss
I'm doing this summer course on machine learning
candid oracle
are you in cllg?
slim moss
Just finished up linear regression
slim moss
candid oracle
are you in cllg?
Yes first year
candid oracle
slim moss
Just finished up linear regression
ohh its a long way ahead
slim moss
Yes
slim moss
So i was wondering what kind of practise project i could take up
slim moss
candid oracle
learn DNN CNN
Don't know much about it I'll see what is it
Need to explore more
candid oracle
i have done like weather app
slim moss
Oh wow, like weather predictions?
slim moss
Oh no problems 😂
candid oracle
now working on sarcasm detection
slim moss
Is that even possible !!
slim moss
Cool man
candid oracle
ahead
slim moss
You are in clg too?
candid oracle
3rd year
slim moss
Wow that's cool
candid oracle
participate in code jam
candid oracle
We're a large, friendly community focused around the Python programming language. Our community is open to those who wish to learn the language, as well as those looking to help others.
slim moss
I have no prior knowledge
slim moss
Isn't it too late to register?
candid oracle
nice talking to you
slim moss
You too 😊
bronze skiff
candid oracle
simple ML algorithms wont help much
uh, basic algos work very well
you should probably understand them better before jumping into deep learning methods
candid oracle
Neural networks are much more effective
candid oracle
bronze skiff
uh, basic algos work very well
you cant do image audio video text processing
simple ML will get simple work done
but if you are in this field its much better to learn DNN
 sly lily
_ _
bronze skiff
candid oracle
but if you are in this field its much better to learn DNN
this is not even remotely true
its better to be cognizant of the limitations of certain models, and adapt them to the use cases one is dealing with
candid oracle
bronze skiff
this is not even remotely true
lets agree to disagree
limpid oak
serene scaffold
```py
"data": {
"3960": {
"2021-06-29": {
```
What is the 3960 for?
so sorry for late reply
3960 these numbers are district codes
 opaque stratus
Hello - is anyone here familiar with the BERT model? -- please @ me if so, I have some hyperparameter questions
bronze skiff
just post the question, otherwise no one is gonna answer them
 mint palm

i know that blue marked line is wrong
but cant figure out how to write that
i figured it out
basically input_shape is one of the parameter of zeropadding2d
people who make documentation are real dumbass
red hound
bronze skiff
this is not even remotely true
Agree
 empty sluice
hi can i ask a python qn?
i have this code: print(df[(df.loc[:,"Q1":"Q8"].any(1) < -2) | (df.loc[:,"Q1":"Q8"].any(1) > 2)]) but it did not work as intended, i need it to filter the columns Q1 to Q8 and look for any values higher than 2 or lower than -2
ripe forge
Make a list of your column names you're interested in, I don't think slice on column names makes sense
Then, your indexer is (df[columns_to_choose].abs() > 2).any(1)
(untested)
lapis sequoia
Anybody know what the
super(LinearMap, self).__init__() is doing in this custom layer?

 iron basalt
lapis sequoia
Anybody know what the
```super(LinearMap, self).__init__()``` is doing in this ...
iron basalt
lapis sequoia
Anybody know what the
```super(LinearMap, self).__init__()``` is doing in this ...
Calling Layer's init
iron basalt
No there is no auto calling.
iron basalt
>>> class A:
...     def __init__(self):
...             print("A init")
...
>>> class B(A):
...     def __init__(self):
...             print("B init")
...
>>> b = B()
B init
>>>
>>> class C(A):
...     def __init__(self):
...             super().__init__()
...             print("C init")
...
>>> c = C()
A init
C init
>>>
The (LinearMap, self) is optional in python 3. It's not optional in python 2.
visual violet
all my homies hate k-means clustering
it outputs different outputs every single time man
sad life
royal crest
visual violet
it outputs different outputs every single time man
overfitting?
visual violet
Just from randomness I guess
 deft harbor
Use a different initialization method
 snow trench
Anyone know how to open excel wait 10 sec then SAVE and close it?
 astral wolf
Hey guys, quick data wrangling question, can anyone give me a hand?
I have up to 4 images per unique id in a dataset (4 rows).
I'd like use pandas to pivot those images into 4 columns, leaving me with one distinct row with 4 image columns (some could be null if there are less than 4 images).
I'm attaching my attempt

 grave frost
short heart
https://cdn.discordapp.com/attachments/702850003814580307/859365483265261598/202...
grave frost
short heart
https://cdn.discordapp.com/attachments/702850003814580307/859365483265261598/202...
the data for that stuff isn't present
and your model has awful perf anyways
short heart
doesnt matter now i figured it
wdym awful perf
thats just a chunk of data on the heatmap cause if i fit more into it, it will break
there are like 89 columns
 storm zodiac
for BERT fine-tuning does sequence length affect performance on a task, e.g. on masked language modelling performance?
so would fine-tuning on sequences of length 512 produce better validation scores than fine-tuning on sequences of length 96?
red hound
Do you guys have any ideas or guidance on how to do manual neural network optimization in the most systematic way? Especially when models train longer and the effects of hyperparameter fitting are very small, it's hard to stay on task and not lose the goal orientation. Feel free to ping me. Thanks 🙂
 worldly mauve
I was wondering whether someone could give me advice about creating ML models.
I've made a game of connect4 in pygame, and am wanting to make a bot for it so that its also singleplayer. I was wondering what would be a good way to do it (I am an ML noob btw). I am thinking of using a genetic machine learning approach but was (a) wondering if there are other approaches and (b) wanting to know if anyone knows of any good resources/tutorials for making genetic algorithms in Tensorflow (if its possible to do in Tensorflow)
 hot bramble
Do we have a data-scientist here who works with Python3-MLBox? I may need a bit help for understanding this libary
serene scaffold
hot bramble
Do we have a data-scientist here who works with Python3-MLBox? I may need a bit ...
if you unpack your question, someone who hasn't used the library might still be able to help.
hot bramble
Ok im gonna try it:
I have a test/train dataset of sensor-states in csv-format. Also the features are binary. The Classification of it is a number between 0-14
My first question is: when i read this csv-data with MLBox it get automaticly cleaned and it send me some output about the data. (Picture shows Output)
It says, that my categorical features are 0. Shouldn't they be at least 2 because of binary states? Or what does categorical features exactly mean?
 serene scaffold
hot bramble
Ok im gonna try it:
I have a test/train dataset of sensor-states in csv-format....
serene scaffold
hot bramble
Ok im gonna try it:
I have a test/train dataset of sensor-states in csv-format....
how are those binary features represented?
hot bramble
serene scaffold
how are those binary features represented?
with a columnname as topic for example "B01" and with the state "0" or "1"
serene scaffold
hot bramble
with a columnname as topic for example "B01" and with the state "0" or "1"
it might be that they're being treated as numeric, then
hot bramble
serene scaffold
it might be that they're being treated as numeric, then
so should i try "true" and "false"?
serene scaffold
For binary features, I don't believe it's an issue
True is often treated as 1 and False is often treated as 0, so the effect might be the same
hot bramble
serene scaffold
True is often treated as 1 and False is often treated as 0, so the effect might ...
but you agree that categorical features shouldn't be 0?
serene scaffold
You could make a column with a couple of arbitrary strings and see if those get treated as categorical
serene scaffold
hot bramble
but you agree that categorical features shouldn't be 0?
not necessarily
serene scaffold
hot bramble
Ok im gonna try it:
I have a test/train dataset of sensor-states in csv-format....
what code did you write that resulted in this happening? please provide it as text
!code
arctic wedgeBOT
Here's how to format Python code on Discord:
```py
print('Hello world!')
```
These are backticks, not quotes. Check this out if you can't find the backtick key.
hot bramble
serene scaffold
what code did you write that resulted in this happening? please provide it as te...
if you want i can show you all per shared discord screen (if you have some time)
serene scaffold
hot bramble
if you want i can show you all per shared discord screen (if you have some time)
No, I just want to see the code so I can look stuff up in the docs
hot bramble
wait, nvm. I understand it now. all of my sensor-datas are numerical and i have no categorical features.... ok i feel a bit dumb right now xD
But that was only my question for understanding. My biggest problem at the moment is, that i always get an accuracy = -inf.
i think it happens because MLBox reads the classification-column as float64-type and predict with the same datatype. So i get as prediction always
something like "0.0001356" instead of a "0" or "5.126732" instead of "5".
So how do i control this? Can i say my Libary he just need to predict integers from 0-14 so my accuarcy can get off -inf? 😂
I think thats a question for someone who know MLBox and maybe now this issue. x)
serene scaffold
hot bramble
But that was only my question for understanding. My biggest problem at the momen...
if you keep gatekeeping who can answer your questions, you might miss out on answers from people who can figure it out from reading the docs.
serene scaffold
Is this some kind of sick joke?
 visual violet
another day another python
bold timber
Hi, I have a question, How to know my model is overfitting or underfitting?
 midnight bone
i had a question.... there is a pcb known as arduino which is very popular for creating hard ware using C programming . i wanted to know if there was any posible way to connect the arduino to python ,i mean code arduino with python programming, anyone has answer for this?
austere swift
serene scaffold
Is this some kind of sick joke?
i've seen worse
there was a youtube video i saw that said word is the best ide

In this video, I tell you the best IDE to use for programming. No matter what kind of programming you do.
📚 Video courses from JomaClass:
🎓 New to programming? Learn Python here: https://joma.tech/35gCJTd
🎓 Learn SQL for data science and data analytics: https://joma.tech/3nteQih
🎓 Data Structures and Algorithms: https://joma.tech/2W89H33
💵 Sta...
serene scaffold
bold timber
Hi, I have a question, How to know my model is overfitting or underfitting?
you'll know it's underfit if it doesn't even do well on your evaluation data. what does the model do?
bold timber
serene scaffold
you'll know it's underfit if it doesn't even do well on your evaluation data. wh...
Whether to know data is underfitting or overfitting depends model to use?
serene scaffold
bold timber
Whether to know data is underfitting or overfitting depends model to use?
well, yes
bold timber
serene scaffold
well, yes
What's parameter to using model to know data is underfit or overfit?
candid oracle
Is the Raspberry Pi 4 capable of AI and deep learning tasks?
cedar sun
while training a model, what other way i have to train it while i see a random image i am passing to the model?
bronze skiff
austere swift
there was a youtube video i saw that said word is the best ide
he wasn't wrong
austere swift
candid oracle
Is the Raspberry Pi 4 capable of AI and deep learning tasks?
i wouldnt do training on it but it can do inference decently well
there are also things like the neural compute stick which can accelerate it
 ornate egret
Hello,
this is the first time that I use YOLOV5 with pytorch and that I make object detection, I trained my custom model and I would like to know which file I must save to share it and use it on other torch instance for example ? last.pt ?
 opal lodge
hi iam a high school student interested in data science, how would y'all suggest i start off, any specific courses?
pls ping
serene scaffold
@opal lodge what math classes have you taken?
One thing you might try is downloading a dataset from Kaggle and see what patterns exist in the data.
opal lodge
serene scaffold
<@743363142863552515> what math classes have you taken?
Algebra and calculus
opal lodge
serene scaffold
One thing you might try is downloading a dataset from Kaggle and see what patter...
Shall try
chilly geyser
austere swift
https://www.youtube.com/watch?v=X34ZmkeZDos
Do you actually take JomaTech unironically or...... .....?????
 civic summit
anyone have a sec to answer a question about using binary data with Anova? the data is not going to be distributed normally but from what i've been reading online it seems like it might be useable. need a second opinion.
serene scaffold
!warn 363690420141817856 Unapproved advertising is not allowed in this community.
arctic wedgeBOT
:incoming_envelope: :ok_hand: applied warning to @worldly sigil.
grave frost
austere swift
there was a youtube video i saw that said word is the best ide
what's wrong with word
there is virtually no difference between a jupyter notebook and word, except the color scheme
serene scaffold
@grave frost do you also hate jupyter notebooks?
 tiny flax
old pandas.Dataframe.resample had an argument how. its not there anymore in docs and raises type error invalid argument
how to do this in 2021
like how to do this rn
tidal bough
grave frost
there is virtually no difference between a jupyter notebook and word, except the...
what
austere swift
grave frost
what's wrong with word
the problem is it's not paint
paint was built specifically for programming, which is why you can draw your code
https://www.youtube.com/watch?v=JKxVEuy2d6k at least thats what this guy says (who's completely credible btw)

Merch: https://nullref.co/
Instagram: https://www.instagram.com/chicken_marsella/
Why YouTube Comment are the best IDE for programming: https://youtu.be/mIw7GFlwy4E
Every programmer has their favorite IDE for programming. Whether that's visual studio, vs code, pycharm, atom etc. But recently I watched in disbelief as Joma Tech used Microsoft wo...
grave frost
serene scaffold
<@738058085083381760> do you also hate jupyter notebooks?
Yeah, I do hate them quite a lot - but that's cuz I use them everyday
My laptop can't run anything except that
serene scaffold
grave frost
Yeah, I do hate them quite a lot - but that's cuz I use them everyday
Good. I hate them a lot!
grave frost
well, what's there in vanilla notebooks apart from bare-bones stuff? @tidal bough
but usually, I can get by with them. They are really problematic for complex stuff, but nothing to bad in ML
midnight bone
hey guys, has anyone here tried making a kinda google assistant/alexa type program, something like friday from iron man
it does as you say...
 subtle imp
I'm currenty working on my first machine learning project using python and pytorch. I've never used python/pytorch (expect as matlab replacement in jupyter) and am not familiar with project structure. As it is now, everything except the dataloader and some utility is in a single file, so all the models, all the eval/train code, 900 loc, is that how python projects are structures or did the previous caretakers of the project just don't care about it?
 cobalt sapphire
midnight bone
hey guys, has anyone here tried making a kinda google assistant/alexa type progr...
cobalt sapphire
midnight bone
hey guys, has anyone here tried making a kinda google assistant/alexa type progr...
I could guaratee that everyone has dreamed of it
midnight bone
ive made it.....
i mean not something that can bring iron man suits to you
but like a simple google assistant
 crystal harness
Guys i have problem using pandas can anyone help
I am using it from android...trying to copy a column of one dataframe to another...searched on internet but didnt understand anything
 bitter harbor
serene scaffold
Good. I hate them a lot!
bitter harbor
serene scaffold
Good. I hate them a lot!
I’ve found writing the code itself in pycharm + transferring that over to a notebook makes the experience a lot nicer
lapis sequoia
can someone direct me or explain me in layman language what does parameterising mean? example is Variational inference- because p(X) is intractable, we replace the intractable by a tractable function which is p(z|x;theta), close to p(z|x). how do i understand what this theta is? they say parameterizing by a theta.
 mossy solar
VSCode just reworked the way they integrate with jupyter notebooks, I haven't tested it yet but it might be worth it.
limpid oak
please help
I have json file which contain nested dict within it but with no fixed column name
I tried pd.json_normalize but it take column name to be flatten
but in my case i don't have fixed column name
 hoary wigeon
hello
lapis sequoia
mossy solar
VSCode just reworked the way they integrate with jupyter notebooks, I haven't te...
using notebooks in VScode is beautiful feature i feel.
arctic wedgeBOT
Hey @limpid oak!
Uh-oh! It looks like your message got zapped by our spam filter. We currently don't allow .json attachments, so here are some tips to help you travel safely:
• If you attempted to send a message longer than 2000 characters, try shortening your message to fit within the character limit or use a pasting service (see below)
• If you tried to show someone your code, you can use codeblocks
(run !code-blocks in #bot-commands for more information) or use a pasting service like:
Hey @limpid oak!
Uh-oh! It looks like your message got zapped by our spam filter. We currently don't allow .json attachments, so here are some tips to help you travel safely:
• If you attempted to send a message longer than 2000 characters, try shortening your message to fit within the character limit or use a pasting service (see below)
• If you tried to show someone your code, you can use codeblocks
(run !code-blocks in #bot-commands for more information) or use a pasting service like:
limpid oak
limpid oak
limpid oak
please help
if somebody suggest any logic to make it to df that will be very helpful
I have json file which contain nested dict within it but with no fixed column name
I tried pd.json_normalize but it take column name to be flatten
but in my case i don't have fixed column name
 sullen flicker
Im looking for books/tutorials on how to create good datasets, what type of data you can get etc. (Webscraping, Metadata etc.) Can anyone help me here? Thanks!
chilly geyser
austere swift
https://www.youtube.com/watch?v=JKxVEuy2d6k at least thats what this guy says (w...
I think cmd.exe is the best IDE at this point
limpid oak
chilly geyser
I think `cmd.exe` is the best IDE at this point
try spyder also
chilly geyser
Anyway earlier I didn't catch the sarcasm since it wasn't clear but I do now.
chilly geyser
limpid oak
try spyder also
Well, you do know that it was all sarcasm right
limpid oak
ya bro
limpid oak
limpid oak
https://paste.pythondiscord.com/zakeceyuxa.json
can anybody help me with this
lapis sequoia
Hello
Does any one had experience about neural network?
I will leave a questions here so 1.Does neural network just random a Colume in matrices? 2.row = layer and colume = neuron? 3.Is any way to look inside hidden neuron?
austere swift
- I honestly don’t understand the question
- A neural network is completely different from a table, the layers and neurons are not related to rows or columns
- Yes, but the simplicity of that depends on the framework
cedar sun
how can i load an ndarray as a pillow image?
TypeError: Cannot handle this data type: (1, 1, 3), <f4
ah cuz it was a float
nvm
thorn bobcat
could someone help me understand the torch usage part of https://github.com/PeterL1n/BackgroundMattingV2/blob/master/doc/model_usage.md
GitHub
Real-Time High-Resolution Background Matting. Contribute to PeterL1n/BackgroundMattingV2 development by creating an account on GitHub.
I've read the torch docs and their docs and I can't find where the bgr and scr go into this
thorn bobcat
..
 neon marsh
I have a .pbtxt file that has a name and its id, if I have the id is there an easy way to access the name
item { name: "bend/bow (at the waist)" id: 1 } item { name: "crouch/kneel" id: 3 } item { name: "dance" id: 4 }
cedar sun
guys, have u noticed colab gpu being slower?
magic juniper
Im making a Neural Network that takes in 25 Inputs, I was wondering if I could shrink it down into only 1, the inputs are all about the same thing (like "How many pieces of cheese there are on a sandwich")
cedar sun
Do principal component analysis
austere swift
cedar sun
guys, have u noticed colab gpu being slower?
the gpus you get are random, sometimes you may get lucky and get one of the higher end ones (like the p100) and sometimes you can get lower end stuff like K80s, you won't consistently get the same gpu (although if you get colab pro that gives you more priority for the stronger ones)
 blazing bridge
austere swift
the gpus you get are random, sometimes you may get lucky and get one of the high...
blazing bridge
austere swift
the gpus you get are random, sometimes you may get lucky and get one of the high...
do you think its worth investing in something like colab pro or buying your own gpu
austere swift
standard colab is fine in most cases
 lilac raven
When saving a 3d array and importing it into R, what would be best route since np.savetxt only allows 1d and 2d? Could I reshape in python to 2d, save txt, and then somehow reshape once in R? I know the reshaping in R works differently than in python though
blazing bridge
I have a 3070 so I was wondering how well it would handle deep learning tasks
austere swift
a 3070 is pretty good
blazing bridge
cause of the 3rd gen tensor cores
austere swift
but it can have a vram limitation if you're using larger models
blazing bridge
yeah the 8GB of vram is the one limitation of the card
so GANS would be pretty hard to train
austere swift
transformers get very very big
I've had a seq2seq model i've built run out of mem on my A6000
austere swift
blazing bridge
what would you do in that case, where do you train the model
i moved it to my training server, which has 4 rtx 6000s
austere swift
yeah but a 3070 can handle most tasks though, you should just stick with that unless you really need more
lapis sequoia
magic juniper
Im making a Neural Network that takes in 25 Inputs, I was wondering if I could s...
Shrinking Down means loosing information. See which inputs are important and which are not. PCA, or some feature engineering may be helpful here.
blazing bridge
I dont think I'll invest in a new pc for a couple years
austere swift
yeah theres no need to have to upgrade what you have unless it's not cutting it anymore, if you can run your projects fine on a 3070 then just stick with it
blazing bridge
yeah. nice talking to you
austere swift
you too
cedar sun
austere swift
the gpus you get are random, sometimes you may get lucky and get one of the high...
how much different can be between the gpus?
like, an epoch used to last 40 mins
now it lasts 1h 40 mins. I dont think that diff is due to gpus right?
it might be my code
cedar sun
yep
same dataset
i mean, no, augmentations are different
i think the problem are the augmentation
austere swift
do you mean theres more augmentations?
cedar sun
maybe u can help me to optimize it, since i am looping images instead of using a boolean matrix
cuz idk how
austere swift
if theres more augmentation then the dataset would technically be larger, since you're adding more samples
which would increase the epoch length
is the step time the same?
cedar sun
uuuuh idk yet, i am waitining for this epoch to finish to comment the new augmentations ive done
and see it thats the issue
anyway, could u help me to improve this code speed?
basically i am pasting a png image into another one. Only the non-transparent pixels
def overlay(bg, image, y, x):
    h1, w1 = bg.shape[:2]
    h2, w2 = image.shape[:2]

    if y >= h1 or x >= w1:
        return bg

    if x < 0:
        x = 0
    if y < 0:
        y = 0

    new_img = bg.copy()
    if x + w2 <= w1:
        px = w2
    else:
        px = w1 - x

    if y + h2 <= h1:
        py = h2
    else:
        py = h1 - y

    for j in range(px):
        for i in range(py):
            if image[i][j][3] > 0:
                new_img[y+i][x+j] = image[i][j][:-1]

    return new_img```
basically this. Squirtle is a png, and i paste him on a background
i thing the problem are those for loops
desert oar
@cedar sun this might work instead of looping
# img is MxN RGBA

img_mask = img[:,:,3] > 0
img_mask_i, img_mask_j = np.nonzero(img_mask)

img_new = a.copy()
img_new[img_mask_i+x, img_mask_j+y] = img[mask][:-1]
also, in general you should write image[i, j, 3], new_img[y+i, x+j], and image[i, j, :-1] instead of "chaining" []s
cedar sun
oh didnt know that was syntax from python
desert oar
it's a bit complicated. basically image[i, j, 3] is the same as image[(i, j, 3)], and numpy has internal routines to handle that
thorn bobcat
fgr: (B, 3, H, W): The foreground with RGB channels normalized to 0 ~ 1.
who else thinks this is cool
 cedar sun
desert oar
<@!534837275234795530> this might work instead of looping
```python
# img is MxN...
cedar sun
desert oar
<@!534837275234795530> this might work instead of looping
```python
# img is MxN...
huh this code should replace the for loops? cuz im getting tons of errors
desert oar
yes, you should expect tons of errors when you copy and paste untested code written by strangers on the internet without understanding it 😉
eyeballing this code:
    for j in range(px):
        for i in range(py):
            if image[i][j][3] > 0:
                new_img[y+i][x+j] = image[i][j][:-1]
i am suggesting that it might work to replace it with this:
    img_mask = img[:, :, 3] > 0
    img_mask_i, img_mask_j = np.nonzero(img_mask)
    img_new[img_mask_i+x, img_mask_j+y] = img[img_mask][:-1]
the first thing i see is that mask does not exist
:)
and u declared 3 masks
so what is mask supposed to be?
desert oar
it's supposed to be img_mask, i fixed it above
cedar sun
yeah, thats what i supposed as well
cedar sun
desert oar
also, in general you should write `image[i, j, 3]`, `new_img[y+i, x+j]`, and `im...
might this not be working?
desert oar
probably? i tested it a bit on some arrays i randomly generated and it seems to do the right thing, but i've been known to be wrong before
cedar sun
wait
u are considering background and image have the same shape
asdasdas
no?
cuz if not idk where does this come from ``ValueError: shape mismatch: value array of shape (20613,4) could not be broadcast to indexing result of shape (20614,3)
``
desert oar
Maybe your X and Y calculations are slightly off
cedar sun
oh wait, there is 1 pixel less
thorn bobcat
can someone explain to me a notebook real quick on a help channel I'll create.
I got the torch, PIL and model docs open but a few points and assumptions I need help making.
it's an image segmentation task.
cedar sun
okey so if i understood it, the first line makesa same dimensions boolean matrix with the condition values on each pixel, so far so good
second line u return what indexes are True for rows and cols
 feral fjord
Could anyone give me a hand creating a custom dataset for Pytorch, I get the idea but my data is a bit different to all the examples I can find. I can create a help channel if its better to talk there.
cedar sun
and the third line... idk
thorn bobcat
feral fjord
Could anyone give me a hand creating a custom dataset for Pytorch, I get the ide...
create it, I'll try to help out.
mine at #help-cookie
cedar sun
print(img_mask.shape, img_mask_i.shape, img_mask_j.shape)
(160, 160) (20614,) (20614,)
@desert oar x,y is height, width?
feral fjord
@thorn bobcat in help-corn
thorn bobcat
cedar sun
actually, i am not understanding something
value array of shape (20613,4) could not be broadcast to indexing result of shape (20614,3)
(x, y+1) --- (x+1, y)
o.o
thorn bobcat
model = torch.jit.load('model.pth').cuda().eval() how does this vary from standard torch.jit.load()?
candid oracle
does ram on raspberry pi 4 matter for ml projects
desert oar
cedar sun
and the third line... idk
the third line is the actual nested for loop.
img_new[img_mask_i+x, img_mask_j+y] = img[img_mask][:-1]
is equivalent to
for i in img_mask_i:
    for j in img_mask_j:
        img_new[i+x, j+y] = img[i, j][:-1]
yes i know but idk whats going wrong with shapes
desert oar
honestly, not sure
cedar sun
what is x and y for u?
desert oar
oh you need to do some clipping to prevent out of bounds errors
cedar sun
cuz what i was doing was counting how many pixels from the img are inside the background
that was px and py
a way of cropping the image
cedar sun
desert oar
oh you need to do some clipping to prevent out of bounds errors
yeah, sorry didnt read. think discord lagged
desert oar
let me see
thorn bobcat
if I wanna do Re imagination. or basically generating real life like faces from pictures, sketches, paintings.
and get a set containing the imaginary data and a set containing real faces
and do feature extraction on both the sets: can I get a set that labels the imaginary set and the real faces set into real-imaginary pairs
cedar sun
i was doing weird XD basically counting how many pixels of image before it exceed edges
desert oar
no i don't think that's weird at all
thorn bobcat
if I add a GAN then it'll start semi-reinforced learning presumably.
cedar sun
yeah cuz it only works for right bottom edges, for top and left ones doesnt, but i dont care actually, i am making it wont exceed limits
i just dont understand the value error
desert oar
!e ```python
import numpy as np
x = 3
y = 5
a = np.round(np.random.default_rng().uniform(size=(10, 10, 4)) * 255)
b = np.zeros((10, 10, 3))
source_mask = a[:, :, 3] > 128
source_i, source_j = np.nonzero(source_mask)
target_i = source_i + x
target_j = source_j + y
x_max = b.shape[0]
y_max = b.shape[1]
clip_mask = (target_i < x_max) & (target_j < y_max)
source_i = source_i[clip_mask]
source_j = source_j[clip_mask]
target_i = target_i[clip_mask]
target_j = target_j[clip_mask]
b[target_i, target_j] = a[source_i, source_j, :-1]
print(b)
@desert oar :white_check_mark: Your eval job has completed with return code 0.
001 | [[[  0.   0.   0.]
002 |   [  0.   0.   0.]
003 |   [  0.   0.   0.]
004 |   [  0.   0.   0.]
005 |   [  0.   0.   0.]
006 |   [  0.   0.   0.]
007 |   [  0.   0.   0.]
008 |   [  0.   0.   0.]
009 |   [  0.   0.   0.]
010 |   [  0.   0.   0.]]
011 |
... (truncated - too many lines)
Full output: https://paste.pythondiscord.com/lunazorupa.txt?noredirect
desert oar
@cedar sun how about that


