#data-science-and-ml
1 messages · Page 319 of 1
 toxic urchin
 serene scaffold
You don't want this for sure.
serene scaffold
You don't want this for sure.
Oh?
Yes, but actually after thinking I might want to add more cols to the row.
If I wanted to do the for loop, how could I acheive that?
serene scaffold
toxic urchin
Yes, but actually after thinking I might want to add more cols to the row.
What do you mean, "add more cols to the row"? Rows don't contain columns.
toxic urchin
  Row1 Row2 Row3 Material Price
1                ABC       NaN
2                CBD       NaN
to this
  Row1 Row2 Row3 Material  Price Small Qty Price Medium Qty
1                ABC       NaN
2                CBD       NaN
why are there two quantity and price columns? what do they mean that is different from the existing ones?
toxic urchin
serene scaffold
why are there two quantity and price columns? what do they mean that is differen...
updated
serene scaffold
toxic urchin
updated
now there's two quantity columns? each column should have a different name so you know what it represents.
toxic urchin
serene scaffold
now there's two quantity columns? each column should have a different name so yo...
Yes, for pricing should I replicate too?
Like Small Pricing, Medium Pricing, etc.?
serene scaffold
also why are three of the columns named Row1 Row2 Row3?
serene scaffold
@toxic urchin Alright. Well I would figure out what data is in the dataframe you want to work with, and if the Price column has missing data that can be calculated in terms of other data in the dataframe, I can show you how to do that.
 uncut barn
can deception detection from someone's email be regarded as a text classification?
serene scaffold
uncut barn
can deception detection from someone's email be regarded as a text classificatio...
I suppose, but I think text classification is more about finding texts that relate to a certain topic, whereas you're trying to infer things about the intent of the author.
but you're still classifying texts as containing deception or not containing deception
how do you plan to do that btw?
uncut barn
first I may use an ML algorithm with seeing the tfidf in the corpus then I may go on from there
 grave frost
uncut barn
first I may use an ML algorithm with seeing the tfidf in the corpus then I may g...
grave frost
uncut barn
first I may use an ML algorithm with seeing the tfidf in the corpus then I may g...
wdym "seeing the tf-idf" of the corpus?
 desert oar
uncut barn
can deception detection from someone's email be regarded as a text classificatio...
desert oar
uncut barn
can deception detection from someone's email be regarded as a text classificatio...
yes
 void mirage
hello, i've gone for a hard reset on the ol pc, is jupyter unequivocally the best environment for data related stuff or could it be worth learning a new one? I'm still very early in learning so i've not really got muscle memory for jupyter
grave frost
void mirage
hello, i've gone for a hard reset on the ol pc, is jupyter unequivocally the bes...
you can run notebooks in PyCharm, Vscode and Atom now. I don't see why you should prefer to use Jupyter Ntebook
void mirage
grave frost
you can run notebooks in PyCharm, Vscode and Atom now. I don't see why you shoul...
main reason is that it's what the tutorials i've used so far use, but i'll definitely have a look into the pros and cons of each of the ones you mentioned
thanks
 teal wadi
where can i learn about machine learning ?
desert oar
void mirage
hello, i've gone for a hard reset on the ol pc, is jupyter unequivocally the bes...
go with jupyterlab
grave frost
teal wadi
where can i learn about machine learning ?
see pinned resources
 narrow coral
Hey there, quick amateur question. If you trained a model using the mnist dataset (or a similar dataset), would that model be able to give a decent result if you tested it on images containing numbers instead of just single digits; say an image containing the number 11?
 thorn bobcat
yo
 dapper halo
is there a way to bound a linear activation function for the range of outputs? I've tried scaling tanh and sigmoid functions to get an approximate linear regime within my desired range, but it still allows for predictions/outputs beyond the range of possible output values.
thorn bobcat
dapper halo
is there a way to bound a linear activation function for the range of outputs? I...
relu?
wait how does sigmoid break out of your range of values?
its bound by a max of 1
iirc
grave frost
narrow coral
Hey there, quick amateur question. If you trained a model using the mnist datase...
no - you would have to re-train or split into digits
grave frost
dapper halo
is there a way to bound a linear activation function for the range of outputs? I...
you mean np.clip?
dapper halo
thorn bobcat
wait how does sigmoid break out of your range of values?
I think its because I scale it for the linear portion to exist within x=0,1 (coming from relu output of hidden)....but even with that, not sure why values would be higher than I allow
dapper halo
oh jk relu isnt bounded on the right...so yeah would make sense I'm getting higher values.
thorn bobcat
dapper halo
oh jk relu isnt bounded on the right...so yeah would make sense I'm getting high...
yea relu isn't bounded on the right
desert oar
 cedar sun
``random.uniform(0, 1) * 180`` or ``random.uniform(0, 180)``
cedar sun
``random.uniform(0, 1) * 180`` or ``random.uniform(0, 180)``
The 2nd one
cedar sun
why tho?
 velvet thorn
cedar sun
why tho?
velvet thorn
cedar sun
why tho?
it's easier to understand
cedar sun
ah
xD
i mean, i feel random uniform 0-180 does 0-1 * 180
all the random generators are at 0-1
velvet thorn
why wouldn't you do random.random() * 180 then
 atomic kiln
cedar sun
all the random generators are at 0-1
atomic kiln
cedar sun
all the random generators are at 0-1
try random.randint
cedar sun
no no, i wanted floats
 somber bane
does anyone have an idea on the technique being used on language learning apps to determine how accurate your pronunciation is. For example: compare your pronunciation of a word with the pronunciation by a native speaker, then determine if you had the right accent
cedar sun
mmm ffmpeg may have something for that
somber bane
cedar sun
mmm ffmpeg may have something for that
what is ffmpeg?
cedar sun
a library for audio manipulation
it handles video too
u can use it on python tho
I didnt used it to compare audio files, but it may have something
somber bane
Thanks a lot
desert oar
@cedar sun also floating point operations can get messy due to rounding issues. Not a problem in this case, but it's good to let a library function do its own work, which is usually written by very smart people who know how to avoid problems
desert oar
Nah, just trust that they did it right
You're only an idiot if you know you're doing something wrong and you do it anyway
cedar sun
yeah
it does what i said lel

it calls random()
which returns between 0-1
so actually, if u dont want b, u should call random() * b
velvet thorn
desert oar
<@534837275234795530> also floating point operations can get messy due to roundi...
yeah but in that specific case it shouldn’t make a difference right
because it’s floating point
no precision can be lost
like there is no other way you can do it
 median basalt
What are the prerequisites for machine learning?
I want to make a chat bot that learns from the conversation
What I mean is like
It replies to numerous people with different style
I mean when talking to an elder the bot remains polite like I do
When talking with friends it acts the way I act in my conversations etc.
 lapis sequoia
median basalt
What are the prerequisites for machine learning?
lapis sequoia
median basalt
What are the prerequisites for machine learning?
The following are the pre-requisites to learn Artificial Intelligence:
Strong knowledge of Mathematics.
Good command over programming languages.
Good Analytical Skills.
Ability to understand complex algorithms.
Basic knowledge of Statistics and modeling.
(this is what i got in the first google search result)
 austere swift
median basalt
What are the prerequisites for machine learning?
austere swift
median basalt
What are the prerequisites for machine learning?
mainly a good knowledge of calculus, statistics, and linear algebra
you also have to know python as well (assuming you wanna do it in python)
 tidal bough
finally, this agent... works
desert oar
velvet thorn
*because* it’s floating point
Idk, sometimes there's a fancy algorithm with theoretical guarantees that is better than whatever the naive version is
cedar sun
velvet thorn
like there is no other way you can do it
I mean, no, i dont care actually. I mean. Hue 0 == hue 180. Both are red. So including 180 and 0 will make red have bigger chances to appear. But you know, i dont really care lol
 sly salmon
say I wanted to standardize my data - why would I only do this on the training data and not the testing data?
if I was to standardize my test data, I understand my model would be more likely to overfit the data.
cedar sun
U should on the test aswell
I mean, is like training with cats doga and trying to predict apples
sly salmon
I read that you should avoid standardising your testing data (to prevent leaks between train and test data). I don't understand it
 jade carbon
isn't 70% rain and 30% test?
desert oar
sly salmon
say I wanted to standardize my data - why would I only do this on the training d...
you apply the same data processing to both
however, for standardization, you need the mean and std deviation
you should not recompute the mean and std dev on the test set
you should re-use the mean and std dev from the training data
 digital merlin
Hi guys, need some help. I'm using a stroke prediction dataset from kaggle, so based on the data I'll be doing smote and likely classification. I'm wondering how I could go about using the model I trained to predict new value based on the model. Someone told me that I could use anomaly detection to do it but I'm not sure how to do it
jade carbon
is this for the sequence model?
digital merlin
In a way I guess, like based on some inputs like bmi and hypertension will get the prediction
jade carbon
y think for all predictions in data
sly salmon
desert oar
you should re-use the mean and std dev from the training data
that makes sense - but when you apply standardization from sklearn's ColumnTransformer on test data, you're using the mean and std. from the test data, no?
digital merlin
jade carbon
y think for all predictions in data
?
thorn bobcat
yo
Anyone know why face detection on video sucks? I'm currently using face_recognition python library
anyone care to recommend a better library?? also would you recommend I use the hog model or cnn?
jade carbon
thorn bobcat
anyone care to recommend a better library?? also would you recommend I use the h...
do you wanna use pytorch?
that's very flexible for cnn and good env for opencv
 tawdry elk
Whats the best module for machine learning/ai
austere swift
machine learning is a broad field
what machine learning algorithm are you trying to use?
cedar sun
tawdry elk
Whats the best module for machine learning/ai
if u are starting u can go keras
i started with it, and is very intuitive
thorn bobcat
jade carbon
do you wanna use pytorch?
that's very flexible for cnn and good env for opencv
i wouldn't mind
but is it good with face detection?
tidal bough
Yay, finally a good agent
thorn bobcat
Could someone help me with a face recognition project?
I got the base code but there's a few things I'd like to add..
having someone help would be great
median basalt
I am trying to something really absurd
Can I use fourier series in turtle to make basic shapes ?
tidal bough
probably, yes
What are you thinking of, calculating the Fourier series for a parametrized curve?
median basalt
Something like this


Or this
OR this

Anything works 🙂
And I can only use python internal modules like math, random etc. etc.
median basalt
tidal bough
What are you thinking of, calculating the Fourier series for a parametrized curv...
Or a curve will also do -_-
median basalt
median basalt
And I can only use python internal modules like math, random etc. etc.
And numpy
tidal bough
numpy is a very important detail, since otherwise you'd have to implement your own FFT 😛
median basalt
tidal bough
numpy is a very important detail, since otherwise you'd have to implement your o...
FFT?
tidal bough
fast fourier transform
the algorithm for quickly evaluating fourier transforms (in O(n log n) rather than O(n^2))
median basalt
median basalt
OR this
This?
tidal bough
I'm not totally sure how you want to use fourier transforms though
like... do you just want to input the curve as its fourier transform instead of a list of points?
median basalt
Can I read points from svg image?
median basalt
tidal bough
like... do you just want to input the curve as its fourier transform instead of ...
Or???
Which is easier?
You tell me 😦
tidal bough
uhh
median basalt
I am new to this 😐
tidal bough
if you're reading the points from the image, why not, like, draw them?
based on the points' positions themselves
median basalt
tidal bough
based on the points' positions themselves
Ohhhh
Yeah that's also possible right 🤦♂️
Can you please nudge me to that direction or give a hint on how to do that?
 charred umbra
Ayo guys I've just developed an algorithm that can identify coronavirus in the lungs at a near-perfect 99.43% accuracy; it's projected to also identify tuberculosis, lung cancer, pneumonia, & flu using x-rays and CT scans from a 91-99% accuracy. Would you advise I make this into a resarch paper or nah? Is it worth it, or not?
desert oar
sly salmon
that makes sense - but when you apply standardization from sklearn's `ColumnTran...
No, fit method calculates and stores the means and standard deviations. The transformmethod applies the standardization. You should only use fit on the training data, then you use transform on both train and test
charred umbra
charred umbra
Ayo guys I've just developed an algorithm that can identify coronavirus in the l...
for context on the exact stuff, it basically takes the scans and parses them through a convolutional neural-network and multilayer-perceptron concatenated. Then it takes the prediction values, and bootstrapps them into a new training set. A fourier trainsofrm in the gaussian context is used on it, and then the data is fed into a support vector machine (1 vs all adaptation)
desert oar
charred umbra
for context on the exact stuff, it basically takes the scans and parses them thr...
If your accuracy is as good as you say it is, you should very very very carefully evaluate your model training pipeline for data leakage, and if you are damn sure there is no data leak as you should very very very carefully evaluate your training set to make sure you aren't cheating in some other way
What you have described should absolutely be a publishable result, but I would bet that the result is not reproducible or applicable in general practice
If something seems too good to be true, it probably is
And if something is beating accuracy by human experts, extra skepticism is justified
charred umbra
Yeah Im thinking of testing it on more data just to make sure
tidal bough
median basalt
Can you please nudge me to that direction or give a hint on how to do that?
I'd:
- Make a function to draw an arbitrary curve provided as a list of points. Test on simple curves like squares(4 points), circles (generate like 10000 points and you won't be able to see the angles), etc
- Figure out how to extract the points from an svg file.
- Maybe play with some spline interpolation so that instead of connecting the points with straight lines, your turtle smoothly connects them with curves
median basalt
tidal bough
I'd:
1) Make a function to draw an arbitrary curve provided as a list of points....
Thanks 🙂
 dense lotus
Can anyone pls help me how to display data from google sheet to r shiny dashboard
cedar sun
median basalt
Can I use fourier series in turtle to make basic shapes ?
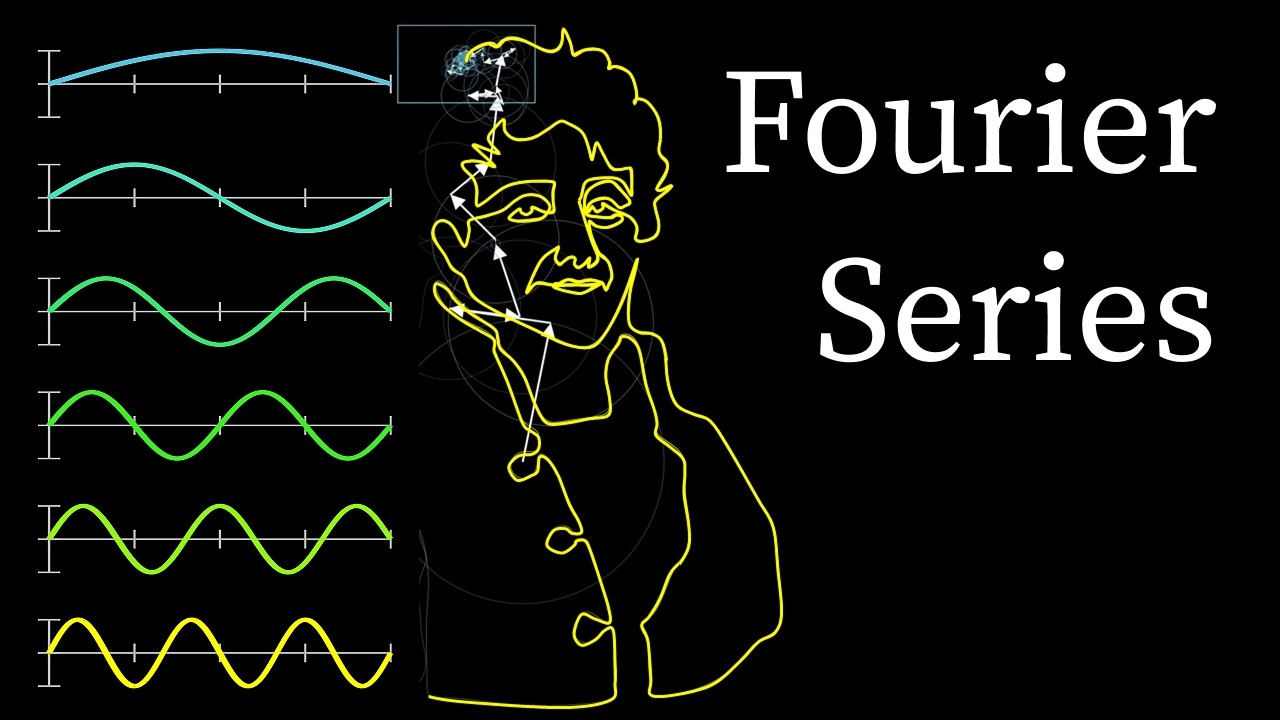
Fourier series, from the heat equation epicycles.
Help fund future projects: https://www.patreon.com/3blue1brown
An equally valuable form of support is to simply share some of the videos.
Special thanks to these supporters: http://3b1b.co/de4thanks
12 minutes of pure Fourier series animations: https://youtu.be/-qgreAUpPwM
Some viewers made apps...
median basalt
cedar sun
https://www.youtube.com/watch?v=r6sGWTCMz2k
Just finished watching that 🙃
Anyway thanks 🙃🙃
cedar sun
what efficient net doesnt crash colab due to memory usage?
charred umbra
cedar sun
what efficient net doesnt crash colab due to memory usage?
Net as in premade conovlutional neural-network architecture?
cedar sun
efficient net is the name of a model lel
 bright turret
For the first time I have code that works, but it's slowness is prohibitive. And that likely is the result of using for loops to iterate through pandas dataframes and using append. I presume this is a common issue for beginners. Does anyone happen to know common next steps?
tidal bough
Well, strictly speaking one should profile the program before deciding
but yeah, it very well might be the problem
bright turret
would you mind looking at the code?
like I saw some suggest to use iterrows or to_dict
tidal bough
sure, post it
bright turret
def chain_request(symbol):
    response = requests.get(f"https://api.tdameritrade.com{symbol}", verify=False)
    data = response.json()
    return data

start = time.time()
for i in range(0, len(tickers.index)):
    symbol = tickers['Symbol'].iloc[i]
    print(symbol)
    data = chain_request(symbol)
    calls = data['callExpDateMap']
    puts = data['putExpDateMap']

    callindex  = []
    for x in calls:
        callindex.append(x)

    putindex = []
    for x in puts:
        putindex.append(x)

    for i in range(0,len(callindex)):
        expiration = callindex[i]
        tablename = expiration[:10]

        strikes = []
        for x in calls[callindex[i]]:
            strikes.append(x)

        arr = pd.DataFrame(data=np.array(strikes))

        for i in range(0, len(arr)):
            df=pd.DataFrame(data=None,columns=c)
            strike = arr[0].iloc[i]
            values = calls[expiration][f'{strike}']
            df = df.append(pd.DataFrame(data=values,columns=c,index=[arr[0].iloc[i]]))
            df['Today'] = today
            sqlengine = create_engine()
            dbConnection = sqlengine.connect()
            frame = df.to_sql(tablename, dbConnection, if_exists='append');
            dbConnection.close()
    for i in range(0,len(putindex)):
        expiration = putindex[i]
        tablename = expiration[:10]

        strikes = []
        for x in puts[putindex[i]]:
            strikes.append(x)

        arr = pd.DataFrame(data=np.array(strikes))

        for i in range(0, len(arr)):
            df=pd.DataFrame(data=None,columns=c)
            strike = arr[0].iloc[i]
            values = puts[expiration][f'{strike}']
            df = df.append(pd.DataFrame(data=values,columns=c,index=[arr[0].iloc[i]]))
            df['Today'] = today
            sqlengine = create_engine()
            dbConnection = sqlengine.connect()
            frame = df.to_sql(tablename, dbConnection, if_exists='append');
            dbConnection.close()
end = time.time()
print("Time to fetch data: ", end-start)
I'm requesting a stock option chain from the TDA API. I receive the complex json, and I grab the various keys and use those keys to create dataframes which I write to psql.
 keen prism
https://paste.pythondiscord.com/fekijoleso.yaml
how to resolve this?
fake_useragent sklearn opencv-python types-requests qiskit
I made a new conda environment and intalled most of the dependencies with conda except for these, which I tried to install via pip.
keen prism
keen prism
https://paste.pythondiscord.com/fekijoleso.yaml
how to resolve this?
Doing stall installed the majority of what I needed but produced the error I linked to here.
bright turret
matplotlib/seaborn?
 visual violet
suppose i ahve this
from sklearn.cluster import KMeans
numberOfClusters = 5
kmeansCluster = KMeans(n_clusters=numberOfClusters)
kmeansCluster.fit(ingredientPriceArray.T)
    callindex  = []
    for x in calls:
        callindex.append(x)

    putindex = []
    for x in puts:
        putindex.append(x)
that looks to be basically callindex = list(calls) and the like.
for x in calls[callindex[i]]:
Hmm,callindex is calls itself, basically, so you're looking up a row in a column by the value of the current row of that column? So is callExpDateMap is a mapping of some kind, I suppose.
anyway,it seems to me you can do something like
    symbol = tickers['Symbol'].iloc[i]
    print(symbol)
    data = chain_request(symbol)
    calls = data['callExpDateMap']
    puts = data['putExpDateMap']

    strikes = calls[calls] # index it by itself. Maybe you'll need calls[calls.values]
    arr = strikes.apply(np.array) # make each element an array
after that, I'm not sure I get what's happenning enough to rewrite it
Note also that if you don't understand how to vectorize something (sometimes it's basically not possible), another solution is to use something like numba - it's a way to compile simple enough Python functions into C code, which massively speeds up things like iteration.
bright turret
tidal bough
Note also that if you don't understand how to vectorize something (sometimes it'...
ok these seem like promising roads to go down, I would say that my code is simple. It's just that the json object I'm working with has like 3 layers of nested dictionaries
thorn bobcat
any AI enthusiasts up for a group project?
serene scaffold
thorn bobcat
any AI enthusiasts up for a group project?
Try describing the project so people know what they're being asked to join.
thorn bobcat
Video facial recognition and reverse face search.
currently have a few obstacles but I got the core concepts and bare bones back end running.
https://colab.research.google.com/drive/1B8VjFhn-ZdvqoXHN-w95GocOT8zn5hle?usp=sharing this is the project link
 thorn bobcat
grave frost
or is in the the works?
thorn bobcat
grave frost
or is in the the works?
in the works
 mortal pendant
Hey! Anybody have any ideas what's causing this error? I've managed to get an image autoencoder to work so now I'm trying to mess around with what else I can use autoencoders for, so this is my implementation of a text autoencoder https://paste.pythondiscord.com/obekugequb.sql but I get this error https://paste.pythondiscord.com/ifogezomoz.sql
grave frost
mortal pendant
Hey! Anybody have any ideas what's causing this error? I've managed to get an im...
your model structure looks very off. try seeing some online tutorials where they implement papers, to get an idea of how the implementation is supposed to look like
mortal pendant
grave frost
your model structure looks *very* off. try seeing some online tutorials where th...
Could you clarify what you mean by it 'looking very off'? I did follow a tutorial when first doing autoencoders- that is Keras' one- then learnt exactly how it works by asking questions for support here. No, I haven't used a tutorial for my text implementation, but that's because I wanted to test my understanding of it, I don't see why it would be much different?
grave frost
mortal pendant
Could you clarify what you mean by it 'looking very off'? I did follow a tutoria...
encoded_input = Input(shape=(encoding_dim,)) -- would be a bottleneck layer from which you would obtain a tensor, not a tf.keras.model
mortal pendant
grave frost
`encoded_input = Input(shape=(encoding_dim,))` -- would be a bottleneck layer fr...
Sorry, I don't understand 🙁
median basalt
I want to parse a svg file get it's point and draw it using turtle using fourier series
Can someone point me
Like what I have to do?
Or is it possible?
desert oar
visual violet
i just wanna ask about how to visualize cluster
How many dimensions of data?
So some kind of dimension reduction, then plot colored points according to cluster membership
Also you can plot the silhouette distances within clusters
visual violet
i knew somebody would know
lol
okay so
@desert oar you know what a k-means clustering is right?
visual violet

here is what i want
i want to graph this lol
but first i need to cluster
so let me explain

i guess i have 20 dimensions
each row represents an ingredient
so one row is the price of one ingredient over time
so the graph y axis is the price
and x axis is the year
serene scaffold
I'm pretty sure we're looking at unrelated problems. Line graphs aren't clusterable, are they?
desert oar
serene scaffold
I'm pretty sure we're looking at unrelated problems. Line graphs aren't clustera...
That's a parallel coordinates plot
At least I think?
Or is that a bunch of overlaid time series
serene scaffold
I was helping them with this last night. There's a column that indicates what class each row belongs to that isn't shown here
desert oar
And it's a time series anyway you're right
visual violet
but each row is clusterable no?
serene scaffold
My advice was to melt the columns so that we have rows of (class, year/quarter, floating point value)
visual violet
like to see how similar each row is
serene scaffold
and then you can perform kmeans on (year/quarter, floating point value), once you come up with a way to represent time numerically.
but I don't really think kmeans makes any sense for this
desert oar
visual violet
like to see how similar each row is
Most clustering algorithms start with a definition of "similarity" and clustering uses that similarity
visual violet
i showed my professor your way
he seemed very focused
but then he went back to his original way lol
desert oar
So if each "data point" is a time series, you could do euclidean distance between the two time series, then do k-means on that distance matrix.
However Euclidean distance on 20 time points could be a bit messy... curse of dimensionality
 slow vigil
Hey guys I'm doing a super basic intro to deep learning tutorial and am having some sort of issue with tensorflow. Anyone in here think they can help?
desert oar
visual violet
so salt rock, what do you think i should start
Clarify your exact goals, and read this https://www.intechopen.com/books/data-mining-methods-applications-and-systems/clustering-of-time-series-data

The process of separating groups according to similarities of data is called “clustering.” There are two basic principles: (i) the similarity is the highest within a cluster and (ii) similarity between the clusters is the least. Time-series data are unlabeled data obtained from different periods of a process or from more than one process. These ...
desert oar
So you want to find ingredients with similar price trajectories over time?
Or something else?
visual violet
just like stelercus, you understand the objective immediately
damn
exactly that lol
desert oar
It was a guess, but I'm glad i know
visual violet
why do i feel like my professor doesn't know what he is talking about
i am concerned
visual violet
he doesn't show me the way. maybe he wants me to learn
btw "This type of data, that is, observing the movement of a variable over time, where the results of the observation are distributed according to time, is called time-series data."
exactly what i am looking for
serene scaffold
I think the professor is setting them up for failure as some kind of lesson.
desert oar
https://towardsdatascience.com/time-series-clustering-and-dimensionality-reduction-5b3b4e84f6a3 this blog post has a couple interesting suggestions or computing similarity between time series, for use in clustering

Medium
Cluster sensor data with Kolmogorv Smirnov Statistic and Machine Learning
visual violet
i am a he/him/his btw
serene scaffold
visual violet
i am a he/him/his btw
I was referring to you and anyone else taking the course.
visual violet
oh
desert oar
serene scaffold
I think the professor is setting them up for failure as some kind of lesson.
Yeah... or the prof doesn't know and is offloading that onto students
visual violet
that is what happen when you go to some pretty ok colleges/high school man
they assume you know shit
serene scaffold
the prof also doesn't know python
their example code had them iterating over range(len()) to modify a dataframe
I lost my composure
visual violet
ever heard of davidson?
desert oar
I believe so
serene scaffold
desert oar
Hopefully this prof is just a matlab/R person and not a hack
if they're an R person, wouldn't they at least know dataframes?
desert oar
Anyway show the TDS blog post and that book chapter to your prof
visual violet
desert oar
Hopefully this prof is just a matlab/R person and not a hack
bro you seem to know everything
how are you so smart wtf
desert oar
serene scaffold
if they're an R person, wouldn't they at least know dataframes?
True. Maybe C++ then
serene scaffold
I told you, he's the best salt rock lamp.
desert oar
I have worked with matlab people lol
visual violet
"Because, time-series data are much larger than memory size [7, 8] that increases the need for high processor power and time for the clustering process increases exponentially. In addition, the time-series data are multidimensional, which is a difficulty for many clustering algorithms to handle, and it slows down the calculation of the similarity measurement. Consequently, it is very important for time-series data to represent the data without slowing down the algorithm execution time and without a significant data loss. "
oh yes i thought it is simple as copy and paste simple codes. not really anymore :(((((
desert oar
I was a research assistant for an economics prof who did his regressions in matlab
@visual violet data science requires a huge range of skills
"Plug stuff into keras" works in a very limited subset of problems
visual violet
do you have any idea on finding codes to solve my problem?
desert oar
Find a solution first, then figure out if it's easy to implement or if there's a library for it
If neither, find an easier-to-code solution or implement it yourself
serene scaffold
@desert oar I found one. if I share it, does that ruin your teaching plan?
visual violet
hey at least i know the keyword for google search
before i don't even know :((
"time-series clustering"
serene scaffold
visual violet
i was looking for youtube tutorial lol
serene scaffold
welp
visual violet
i may get banned for sharing this lol
but ||https://sci-hub.do/|| is incredible
Part of MLTogether Milan #30
Meetup Event: https://www.meetup.com/it-IT/Machine-Learning-Together-Milan/events/277064077/
Github: https://github.com/Machine-Learning-Together-Milano
This time we will deal with Unsupervised classification in time series.
Clustering is often introduced in all ML courses but not often explored in its application...
potential?
serene scaffold
I mean when is this due?
visual violet
in 3/4 of a month
actually let make it one month
writing the actual paper is ez since i can write
visual violet
visual violet
all i need is something like this hehe
serene scaffold
visual violet
writing the actual paper is ez since i can write
CS students aren't supposed to be able to write
visual violet
i would call myself a pharmaceutical student rather lol
main reason why i am doing this actually
but cs is definitely a very good hobby
desert oar
serene scaffold
<@!389497659087650836> I found one. if I share it, does that ruin your teaching ...
I have no teaching plan here, go ahead
serene scaffold
desert oar
I have no teaching plan here, go ahead
I already sent it
desert oar
I actually didn't know about tslearn, or if i knew about it i forgot
There's no references or any algorithm description here... is this literally just euclidean distance + k-means?
serene scaffold
Idk
desert oar
Ah it looks like it at least supports DTW and other related distances
Skimming the source it does appear to be standard k-means, with k-means++ initialization
Interesting, this does seem like a good easy way to go
Nice find
serene scaffold
Thanks 
 desert oar
visual violet
can you tell me what dtw is lol
desert oar
visual violet
can you tell me what dtw is lol
dynamic time warping
desert oar
it's time to read, then!
it's also not that complicated to understand how it works, you don't have to implement it yourself
https://towardsdatascience.com/dynamic-time-warping-3933f25fcdd
https://databricks.com/blog/2019/04/30/understanding-dynamic-time-warping.html
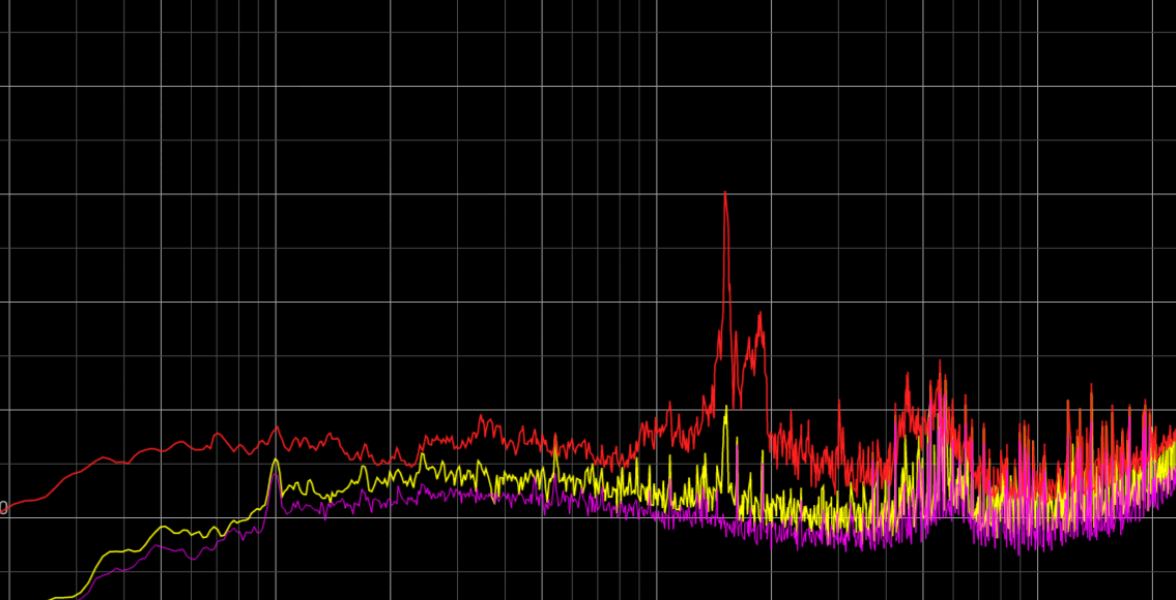
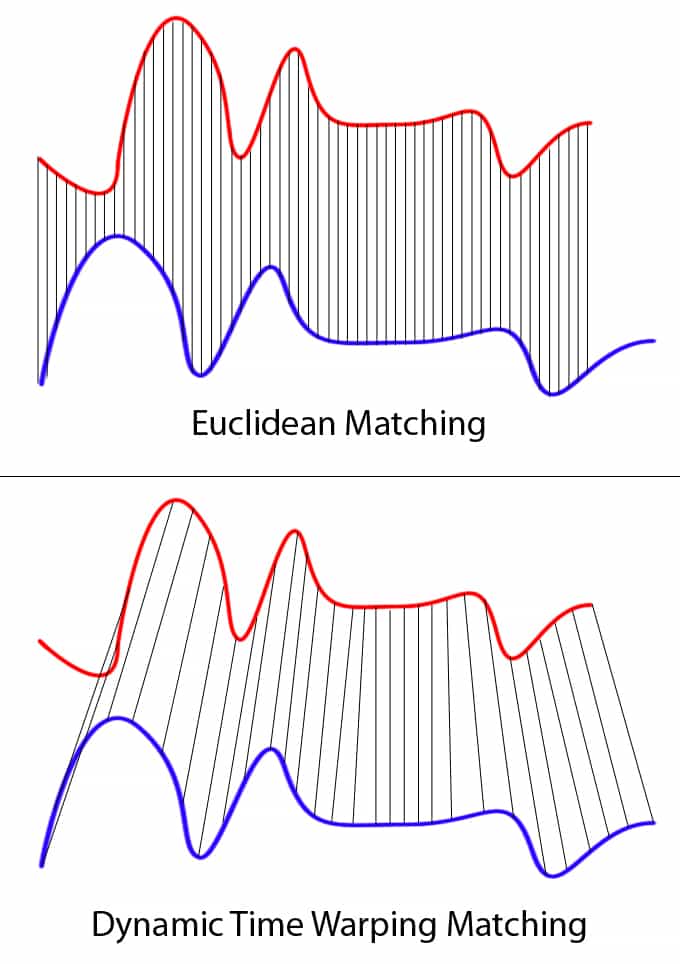
Databricks
Dynamic time warping is a technique used to dynamically compare time series data when the time indices between comparison data points do not sync up.
visual violet
you know you are giving me literature review material lol
so now i don't have to find more search paper
ty
desert oar
not sure you should cite TDS in your paper, but you can certainly use the info
 inland plaza
is Lineal Algebra, Linear Regression, Statistics, Probability enough for ML
austere swift
linear regression isnt really a math topic lol
thats a machine learning method
thats most of it but you'll also need some calc though
 plush quiver
Hi guys, I'm currently doing Andrew Ng's Deep Learning Specialization, course 2. It is a very good course and I now understand many concepts of deep networks, but I am concerned that I am sort of being spoonfed. I don't really have to do much to complete the assignments, they practically give us the solution to every challenge. I was wondering if there was any way in which I could actually either test myself or apply these concepts myself?
austere swift
find some dataset you like and try out the concepts on that dataset
 prisma sinew
What to do if sum of the three classes in prediction is less than 1%? I want to classify object at video and there is 0,003 (as highest of them) that object is good.
lapis sequoia
Machine learning road map please in detail
 river spindle
Hey I've been trying to implement TF-IDF weighted embeddings in a classification problem and I came across this:http://dsgeek.com/2018/02/19/tfidf_vectors.html
But I'm confused as to how it'll be applied to train and test data. Any help would be appreciated
 upbeat lotus
Hey, I have a pretty simple question. I know the difference between Cost and Loss, but whats the difference between Cost/Loss and Error?
If Error is just a measure of how badly our model fits the data, then what is Cost?
 winged stratus
they're all interchangable
upbeat lotus
so Error and Cost refer to the same thing?
 jolly ginkgo
ValueError: Dimensions must be equal, but are 262144 and 327680 for '{{node dice_coef_loss/mul}} = Mul[T=DT_FLOAT](dice_coef_loss/Reshape, dice_coef_loss/Reshape_1)' with input shapes: [262144], [327680].
i used unet model with 512x512x4 input shape
but i have a problem
i want solve but
i cant

my code is here
pls help me
 rich merlin
how would one go about getting access to OpenAI, specifically GPT3...
austere swift
@rich merlin https://share.hsforms.com/1Lfc7WtPLRk2ppXhPjcYY-A4sk30 :)
lapis sequoia
is it ok to ask question about excel at here?
austere swift
this channel is specifically about data science/ai in relation to python
lapis sequoia
ok thx
Hey Guys I was Making an text to speech using IBM Watson's AI I made it and its working perfectly fine, but i just want change its **pitch **and **volume ** gone trough docs i found nothing that helps 
 steel hawk
..
grave frost
lapis sequoia
Hey Guys I was Making an text to speech using IBM Watson's AI I made it and its ...
you have modify the ouput audio you get
lapis sequoia
Uhhh channel not loading
lapis sequoia
grave frost
you have modify the ouput audio you get
There is a way you can get it modified in ibm api
It's called sslg or something like this
grave frost
lapis sequoia
There is a way you can get it modified in ibm api
then use it that way 🤷
grave frost
lapis sequoia
That's the problem I can't find how to use it lol
read the docs lul. if its not there, it can't be done 🤦♂️
lapis sequoia
there is but it looks weird it sus XD, i quite dont understand whats written thre you knw not the of the best explainations 
 steel mason
I recently started an internship and the task in hand rn is to anonymize the database. What we are trying to do is that code goes through the csv/sql db and suggests user what anonymization technique could be used on what column, and then that anonymization is to be applied.
Any libraries that could be of use?
mortal pendant
mortal pendant
Hey! Anybody have any ideas what's causing this error? I've managed to get an im...
Still not found the solution tothis if anybody has any ideas
 hollow falcon
new in data science here, after learning how pandas work, cleaning, slicing etc, how to improve my analysis skill? I dont know what to do when i have a dataset
visual violet
is R better for time-series clustering?
 red hound
visual violet
is R better for time-series clustering?
red hound
visual violet
is R better for time-series clustering?
better than what? On my personal experience R is absolutely great for working with time series. Especially as there are tons of really great packages, which make it much easier to handle. I dont know if its just me, but i think R is also (if handled correctly) a bit better in performance handling large datasets, which in time series is often the case
visual violet
oh wow so you do know how to deal with time series
@red hound can you please recommend me how to cluster time series based on shape
I want to find ingredients with similar price trajectories over time
like price pattern over the years
red hound
what do you mean by "based on shape" ?
Iam not an actual expert, but i did some work on time series from time to time
visual violet

the y axis is the price and the x axis is the time
they are clustered together because they have the same shape/pattern
red hound
ah, i see. And you want to apply a similar approach to another data?
visual violet
yes
but i don't know how to do it
even if i can cluster, i want to graph it
so i can check if the clustering is good or not
red hound
can you maybe provide an example on how your data looks like? Just 2-3 lines of your dataset (including row/column names if existing)
 serene scaffold
visual violet
is R better for time-series clustering?
serene scaffold
visual violet
is R better for time-series clustering?
Did you use the library I found last night?
red hound
but wouldnt be a simple row-clustering sufficient?
After clustering you could take a look at to which cluster each ingredient belongs. After that you can simply plot them
visual violet
i can't make the colorful graph lol
red hound
so you already did the clustering? 😄
visual violet
the clustering is two lines of code lol
red hound
sure it is, but the information that you already did it not came through to me 😄
iam not that great in plotting, so i cant provide any code
but i would do something like that:
take each cluster on its own -> plot each sample of the cluster with y = time, x = price
colorize all of these "subgraphs" in the same color
repeat for the other clusters
should work with matplotlib. Maybe dont use all samples, depending on how many you got. As it gets a bit too much on the screen really quick
with ggplot2 it should also be no big deal (if using R)
visual violet
model = TimeSeriesKMeans(n_clusters=3, metric="dtw", max_iter=10)
model.fit(data)
legit two lines of codes
damn
red hound
yep
other than optimizing, applying a ml model isn't a big deal most of the time
suitable preprocessing often takes a lot more time
visual violet
red hound
but wouldnt be a simple row-clustering sufficient?
After clustering you could ta...
the professor says it will work
but i guess i want to experiment lmao
Let's analyze time-series data and assign outcome variables depending on pattern types. If you are looking to model raw time series for classification, this video is for you.
MORE:
Blog or code: http://www.viralml.com/video-content.html?fm=yt&v=zBVQvVCZPCM
Signup for my newsletter and more: http://www.viralml.com
Connect on Twitter: https://...
i think i have found the secret
hahahhaha
serene scaffold
visual violet
```python
model = TimeSeriesKMeans(n_clusters=3, metric="dtw", max_iter=10)
mode...
model = TimeSeriesKMeans(n_clusters=3, metric="dtw", max_iter=10)
predictions = model.fit_predict(data)
will tell you what clusters each row was assigned to in one swoop.
visual violet
"ModuleNotFoundError: No module named 'tslearn'"
uh oh
nvm i am dumb
i have to install
serene scaffold
Fellas, if your girl got ModuleNotFoundError, that's not your girl.
serene scaffold
a matrix of the data
lapis sequoia
Hey guys I have a question
heya i have a question. i have a specific hash, and i need to store a user's password for that specific hash. But there's a catch. the length of the user's password as well as if they press the ctrl,shift,windows or alt key all determine what hash the user's password will be stored in. Key down means the user clicks the key, key up means the user releases the key. agent_id just means the device that they log in on, so that doens' tmatter as of now. rn the hash for the first two lines is the same: 49b3b8f22b95d0c92e5f8aadf30e8e9e95e74a0a so my question is: can i store the specific password in this hash depending on what keys the user presses and the length of the password?
serene scaffold
visual violet
numpy array? dataframe?
you could probably pass a dataframe as long as you only pass the right columns.
dataframes are just dressed up arrays, after all
visual violet
very true
serene scaffold
visual violet
very true
the trap to watch out for is if you have a function where you have to pass two dataframes. If the dataframes have the same sets of columns and indices, but they're in different orders, the function you pass them to isn't going to wonder why that is.
so you'd need to use DataFrame.align
visual violet
i suppose i can sort them
serene scaffold
visual violet
i suppose i can sort them
no, just align them.
the align method also lets you pick how to handle missing data from either dataframe.
serene scaffold
an array of cluster labels, which I believe will probably be integers.
and the nth element in that array will be the predicted cluster for the nth row of the data you passed.
visual violet
predictions is an numpy array
serene scaffold
yessssss
serene scaffold
visual violet
predictions is an numpy array
is there something you find confusing about that?
visual violet
since the array is too long
it won't output every thing
but i can't to_csv it
because it does not have that function lol
serene scaffold
visual violet
since the array is too long
what do you mean, the array is too long? it should be the same length as the first dimension of the dataframe.
visual violet
if what you say is true
and my time-series do work
suppose i have a dataframe of size 10
and 3 clusters
serene scaffold
visual violet
suppose i have a dataframe of size 10
ten rows?
visual violet
let make it smaller lol 3 rows 2 columns
3 clusters
i should expect something like [1,1,1,2,2,3]
serene scaffold
then you should get an array of three elements, all integers between 0 and 2.
visual violet
oh
visual violet
so do you know how to output long array?
i am very close lol
i can smell the result coming
serene scaffold
what do you mean "output" it?
visual violet
like view the entire array
serene scaffold
why do you need to view the whole thing
visual violet
to make sure it is dvided into 3 clusters
serene scaffold
you could do pd.Series(arr).value_counts()
visual violet
you are a god
serene scaffold
where arr is the array of predictions.
visual violet
an actual god lol
red hound
Iam searching for a Text-Dataset with mostly short samples (around 20 words). Do you have any suggestions for me? The Data shouldnt be too complex.
Another questions: Iam trying to build a model for log-data. Would you rather treat log-data as text or as multivariate time series data?
My actual approach separates lines frome each other, keep the temporal dependencies through time differences between each consecutive lines, an the whole thing is word-wise tokenized and embedded. Do you have any better ideas? For example by log-data I mean linux syslog or something similar.
iam looking forward to your suggestions
serene scaffold
more time series stuff omg
visual violet
yay
serene scaffold
red hound
Iam searching for a Text-Dataset with mostly short samples (around 20 words). Do...
what kind of topic does the dataset need to be about?
you're trying to do information extraction from a log created by Linux, yes?
red hound
The Text Dataset doesnt need a specific topic, if it fits the above requirements (around 20 words length) and not too complex
red hound
serene scaffold
you're trying to do information extraction from a log created by Linux, yes?
I am doing a project which aims to synthetically generate log kinda data. I am planning on using GANs, but iam also open to use other sutiable technologies
The Linux Logs are my actual tryout-data so to speak
grave frost
red hound
The Text Dataset doesnt need a specific topic, if it fits the above requirements...
just take any dataset and remove the rest of the words
grave frost
red hound
The Linux Logs are my actual tryout-data so to speak
ahh, then I recommend you fine-tune a dataset of linux logs over already pre-trained model like BERT
and generate linux logs accordingly - with whatever seed term you would want
red hound
grave frost
just take any dataset and remove the rest of the words
can you recommend any? I literally dont know any except idmb
grave frost
red hound
can you recommend any? I literally dont know any except idmb
I have never searched for dataset of linux logs
imo you would be better off using pre-trained GPT2
red hound
BERT is a transformer thing, right? Do transformer also work for generating data?
Transformer is a technology i untill now never had to work with
grave frost
red hound
BERT is a transformer thing, right? Do transformer also work for generating data...
BERT can generate data, but its pretty complex for newbies due to its bidirectional nature. you can use pre-trained GPT2 for generating data which would be much easier
@red hound Here's a dataset off google on which you can fine-tune https://github.com/logpai/loghub

GitHub
A large collection of system log datasets for AI-powered log analytics - logpai/loghub
should be easy sailing
red hound
yeah, thats a great repo, i already took the hadoop dataset from.
So do you think Transformer will work better than GANs for example? My Data is not exactly Linux Log data, but the structure is similar (cant publish unfortunately)
i am thankful for every hint and suggestion
grave frost
GAN's aren't very mature for text datasets. you could do it as a research project, but I wouldn't think of them yielding very good results
grave frost
red hound
yeah, thats a great repo, i already took the hadoop dataset from.
So do you thi...
it doesn't matter, as long as its text
what does matter is on which data you pre-train your model on, and what you fine-tuen on
red hound
my current searches were in the areas of time-series/sequential data and also text-data (to find a combined solution which fits my problem best)
red hound
grave frost
what does matter is on which data you pre-train your model on, and what you fine...
i see
my current approach looks like that:
grave frost
transformers are not good for time-series data im afraid
red hound
i separated the log by lines, removed the timestamp (instead i added the time diff between two consecutive lines), tokenized it and trained an embedding. Could i use these embeddings?
grave frost
no
A time-series dataset with a text dataset is tricky imo
maybe the model might pick up the relationship
but maybe it might not
red hound
hmm, a first success would be to generate real looking log-lines on its own. Later we definitly need the temporal dependencies
grave frost
If you want a clean and fast approach, then try gettting your hands on GPT3
(if they allow fine-tuning on datasets)
grave frost
red hound
hmm, a first success would be to generate real looking log-lines on its own. Lat...
it honestly depends on your exact task. can't help without full information
red hound
from the sound of it you are very convinced of transformer, can you provide any good sources to start with (deep learning experience, but none with transformer)
red hound
grave frost
it honestly depends on your exact task. can't help without full information
yeah, i totally understand. Thats a bit of a problem because the data is secret, unfortunately
grave frost
Do it with pytorch. Do NOT use Huggingface in any reason or dimension, unless you want to suffer in hell
serene scaffold
some of my coworkers like huggingface 🤷🏻♂️
grave frost
serene scaffold
some of my coworkers like huggingface 🤷🏻♂️
resist the temptation brother..
serene scaffold
what don't you like about it?
red hound
Okay, i see 😂
usually i use tensorflow, but adapting to pytorch isnt a big deal (really similar, if you know what you need)
grave frost
leaving that shit library is worth millions of hours of your time
grave frost
red hound
Okay, i see 😂
usually i use tensorflow, but adapting to pytorch isnt a big dea...
ayy, TF works too
im just saying pytorch cuz its kinda flexible for new tasks, like incorporating temporal features
plus you can also use new research-level models there too
red hound
yeah, true
grave frost
serene scaffold
what don't you like about it?
what do I like about it?
their datasets is a mess, tokenization sucks. their model implementations are buggy on XLA
red hound
I will work my way in a little
grave frost
It's a shitshow there honestly if you want to customize a teeny bit
for standard cut tasks, its great ngl. but for anything else - hell
 unborn delta
anyone know if there is a way to mix data science and physics? is there a job opening for that?
serene scaffold
unborn delta
anyone know if there is a way to mix data science and physics? is there a job o...
you might look for data scientist positions with companies that deal with physics in some way, like aerospace or something
 unborn agate
guys why am i getting that datatype error, pls help
 red hound
Well, But mostly the jobs in These fields are occupied by physicists, mathematicians and so on
serene scaffold
unborn agate
guys why am i getting that datatype error, pls help
should probably just be dtype
unborn delta
@serene scaffold thanks man, but anyone with knowledge of data science can enter? Would knowing physics give me more possibilities?
serene scaffold
unborn delta
<@253696366952316929> thanks man, but anyone with knowledge of data science can ...
I don't know. You'd have to see what job listings are out there and look at the requirements.
unborn agate
serene scaffold
should probably just be `dtype`
new error
 serene scaffold
unborn agate
new error
serene scaffold
unborn agate
new error
It would be better if you shared text rather than screenshots
unborn delta
@serene scaffold thnks man🤺👨🚀👴🏻🕵️🚵♂️👨💻🔫🤵🧘🏻♂️🥶
red hound
Iam also interested to work in natural science After graduating, but if you are a physicist in Many cases you dont Need a data scientist to get the work done
unborn agate
serene scaffold
It would be better if you shared text rather than screenshots
import numpy as np

brands=["monte c","van","gucci","ralph lauren"]
sales=[2300,9900,5600,2300]
fashion=pd.Series(index=brands,data=sales*2,datatype=np.float)
print("Sales in fashion industry")
print(fashion)```Thats at least my experience
serene scaffold
unborn agate
```import pandas as pd
import numpy as np
brands=["monte c","van","gucci","ralp...
what about the error message?
unborn delta
red hound
Iam also interested to work in natural science After graduating, but if you are ...
@red hound That is a problem, I am in a mental fight between dedicating myself to data science or physics, but both use similar mathematics
unborn agate
serene scaffold
what about the error message?
ValueError: Length of passed values is 8, index implies 4.```You should always share the whole error message.
unborn delta
maybe there is a way to be both
unborn agate
serene scaffold
You should always share the whole error message.
c:/Users/#BeLikeBro/Desktop/wefgwegw.py:7: DeprecationWarning: `np.float` is a deprecated alias for the builtin `float`. To silence this warning, use `float` by itself. Doing this will not modify any behavior and is safe. If you specifically wanted the numpy scalar type, use `np.float64` here.
Deprecated in NumPy 1.20; for more details and guidance: https://numpy.org/devdocs/release/1.20.0-notes.html#deprecations
  fashion=pd.Series(index=brands,data=sales*2,dtype=np.float)
Traceback (most recent call last):
  File "c:/Users/#BeLikeBro/Desktop/wefgwegw.py", line 7, in <module>
    fashion=pd.Series(index=brands,data=sales*2,dtype=np.float)
  File "C:\Users\#BeLikeBro\AppData\Local\Programs\Python\Python38-32\lib\site-packages\pandas\core\series.py", line 350, in __init__
    raise ValueError(
ValueError: Length of passed values is 8, index implies 4.```so your index only has four values, but you passed eight, so it didn't know what index to assign the other four.
unborn agate
serene scaffold
so your index only has four values, but you passed eight, so it didn't know what...
mhmmmm, so how do i fix this?
serene scaffold
unborn agate
mhmmmm, so how do i fix this?
I can't guess what indices you want. Can you show me what sales*2 and brands are?
unborn agate
serene scaffold
I can't guess what indices you want. Can you show me what `sales*2` and `brands`...
``import pandas as pd
import numpy as np
brands=["monte c","van","gucci","ralph lauren"]
sales=[2300,9900,5600,2300]
fashion=pd.Series(index=brands,data=sales*2,dtype=np.float)
print("Sales in fashion industry")
print(fashion)``
serene scaffold
unborn agate
``import pandas as pd
import numpy as np
brands=["monte c","van","gucci","ralph...
sales is a list and is not an array.
unborn agate
serene scaffold
`sales` is a list and is not an array.
waittt i found the issuue
i just had to remove the *2
serene scaffold
!e
import numpy as np
number_list = [1, 2, 3, 4, 5]
print(number_list * 2)

number_array = np.array(number_list)
print(number_array * 2)
 arctic wedgeBOT
@serene scaffold :white_check_mark: Your eval job has completed with return code 0.
001 | [1, 2, 3, 4, 5, 1, 2, 3, 4, 5]
002 | [ 2  4  6  8 10]
now its fixed
red hound
unborn delta
<@410828324391092224> That is a problem, I am in a mental fight between dedicati...
If i had the Choice again, i would Start studying physics or mathematics instead of Computer science
serene scaffold
unborn agate
i just had to remove the *2
But now it does something other than what you wanted.
unborn agate
serene scaffold
But now it does something other than what you wanted.
wait what
serene scaffold
unborn agate
wait what<:yert:832277526809149461>
didn't you want to multiply every value in sales by two?
unborn agate
serene scaffold
`sales` is a list and is not an array.
what about it?
serene scaffold
unborn agate
what about it?
why was the * 2 there in the first place? didn't you want to multiply every value by two?
unborn agate
serene scaffold
why was the `* 2` there in the first place? didn't you want to multiply every va...
yes yes i did want to
but with *2 its giving error
unborn agate
unborn agate
```PS C:\Users\#BeLikeBro> & C:/Users/#BeLikeBro/AppData/Local/Programs/Python/P...
this error
serene scaffold
unborn agate
but with *2 its giving error
Because you need to convert the list to an array
unborn agate
serene scaffold
Because you need to convert the list to an array
oof
and how do i do it?
serene scaffold
serene scaffold
!e
```py
import numpy as np
number_list = [1, 2, 3, 4, 5]
print(number_list * 2)...
@unborn agate look at this
unborn agate
okay...
serene scaffold
Multiplying a list by two doubles the length of the list and fills it with the same values. Multiplying an array multiplies the elements.
So you need for sales to be an array.
unborn agate
okay....
so do i just copy paste what u sent?
i am kinda new to python
so yeah
@serene scaffold
serene scaffold
unborn agate
so do i just copy paste what u sent?
sales = np.array(sales)
unborn agate
serene scaffold
`sales = np.array(sales)`
Sales in fashion industry
monte c          4600.0
van             19800.0
gucci           11200.0
ralph lauren 4600.0```lezzzgooooooooo
its working
finally
thankyou so much
unborn delta
red hound
If i had the Choice again, i would Start studying physics or mathematics instead...
Got it, thanks for ur help, i'll read more about it🤙🏻
 severe plaza
Hello!
i have a question for you i'm working with a csv where some data is missing.
and i am through pandas i managed to transform data from nan to empty strings now if i would like to turn them into numbers into teri how should i do?
Thanks for your attention
 burnt prawn
Question on how to improve accuracy of a ML model (image processing based)
I have a question about different methods of improving accuracy of image processing models, say for e.g. using the training data I have a model that has a some accuracy (maybe its quite accurate) but then there is no guarantee that this model is performing well against unseen (test) data and so I wish to find a systematic way to be able to cross check this each time I have a new model built using the training data, so then I know that the test data results are reliable.
Of course we can manually check the test data to find out but it would be better to do this in an informed manner.
I have heard that when trying to find an accuracy of a model (image processing based), that a LR (linear regression) or kNN model can be used to do unsupervised learning. My understanding has been that these two types of methods would be used as reference models to check if our main model is performing well with unseen data.
Has anyone done something like this in the past or come across such a technique. I hope I'm explaining my problem statement well.
Any ideas or thoughts on how to do this reliably and better would certainly help, especially with the help of an example or a paper or a blog or some code that does this or illustrates this will also be a good start for me.
It's possible this is sort of a repeat question or it may be suited in other channel(s) - in either case please let me know
cedar sun
do u know which version of Efficient Net crashes colab due to memory?
 late shell
Hello, I'm training a a logistic regression model on a dataset that contains 2 features, Age and Salary and the target/response variable is whether the person bought the product or not (0 or 1). The model performs extremely well (with mean accuracy = 0.8735 and McFadden's R^2 = 0.400) when the data was scaled and extremely shitty (mean accuracy = 0.6 and McFadden's R^2=-0.2) when the data was not scaled (I'm using StandardScaler). But I don't understand why does scaling benefit the model. Feature scaling is for those models/algorithms which measure the distance between data points, right? But logistic regression uses Maximum Likelihood Estimation which involves probability. So, why?
desert oar
@late shell distances between points are still relevant even if you are not explicitly computing a distance matrix
Consider that covariance is just a special kind of similarity score
Moreover having substantially different numerical scales can cause serious problems for numerical optimizers
It's almost never wrong to scale, it's only for the interpretability of your results
It can also make the model substantially faster to train even if the predictions are identical
Basically, model predictions being invariant to linear transformation of the features makes some sense in theory but is not true in practice
 proven loom
I'm trying to list out all of the continuous/connected volumes in a 3D numpy array (and also find the largest volume in the array). Does anyone know how to do this?
desert oar
All numerical optimizers must "explore" the parameter space to some extent; you can and should make that space easier to explore if possible
desert oar
proven loom
I'm trying to list out all of the continuous/connected volumes in a 3D numpy arr...
Do you have a known good algorithm for this that you want to implement efficiently in numpy? Or do you need an algorithm? The latter might be better asked in #algos-and-data-structs
proven loom
I don't have any algorithm, was looking for suggestions and/or a library to do this for me
It doesn't need to be super efficient, just need it to work
tidal bough
you mean, like, the array represents cells that may be "walls" and you need to find all connected volumes of empty cells?
proven loom
So the values in the array would be either 0 or 1. Need to find all of the volumes in the array where the 1's touch eachother (using either 18 or 26 neighbors in 3D), and then "pluck" out the largest volume into a new 3D array
tidal bough
That's just finding all connected components of a graph. Solved the exact same way as it is in 2d, with DFS/BFS.
desert oar
cedar sun
btw, last layer should have softmax or sigmoind function?
Softmax is the generalization of sigmoid to multiple inputs
cedar sun
wdym with multiple inputs?
desert oar
For multilabel you probably want elementwise sigmoid
tidal bough
proven loom
So the values in the array would be either 0 or 1. Need to find all of the volum...
- Write a function like:
Pos = Tuple[int,int,int]
def dfs(array, start_from: Pos, components: Dict[Pos,int], component_index: int):
which would, starting from a cell of the array start_from, DFS on all cells connected to it, adding them to the components dict with a value of component_index
2) Run this function on all cells of the array that aren't already in a component:
components = {}
component_index = 0
for pos in itertools.product(*(range(l) for l in array.shape)):
    if array[pos] == 0:
        continue
    if pos in components:
        continue
    dfs(array, pos, components, component_index)
    component_index += 1
after that, component_index will be the number of connected components and components - a mapping from positions to components
cedar sun
is elementwise sigmoid != sigmoid?
tidal bough
you can also maintain the inverse mapping from components to all cells in that component if you need
Oh, and you can use an array for component instead of a dict, that'd be more memory-efficient. Each cell's value would be what component it belongs to
proven loom
Thanks for the help! I'll try to implement this, great suggestion
desert oar
cedar sun
is elementwise sigmoid != sigmoid?
I just mean sigmoid applied to each output individually, instead of softmax across the whole thing
Or is that what you meant?
cedar sun
idk lel, i am doing the pokmemons thingie
i was using softmax cuz i read it somewhere, but idk
    x = GlobalAveragePooling2D()(base_model.output)
predictions = Dense(len(pokemons), activation='softmax')(x)```Thats my model
              optimizer=keras.optimizers.Adam(learning_rate=0.001),
metrics=['accuracy'])```And thats the compile
Would u change anything?
thorn bobcat
Yo
 torpid scarab
Hello. Anyone knows what does it mean if validation accuracy (DL) increases and decreases alternately?
cedar sun
maybe decrease learning rate
thorn bobcat
would be sad if all this failed.

P.S I wouldn't mind help on this black box project.
 floral wedge
Can any1 suggest me some good begineer level data science projects??
thorn bobcat
can i get help with a #help-chocolate
late shell
desert oar
<@594900402634227752> distances between points are still relevant even if you ar...
I don't understand why though. Also I just got to know that logistic regression has 3 interpretations i.e geometric, probability and loss function
 desert oar
Linear separability is not required or assumed for logistic regression...
Who gave you this?
late shell
desert oar
Who gave you this?
umm, my brother, he didn't tell me the name of the book though
desert oar
This is the cursed svm zombie rising from the dead
late shell
lol
desert oar
Throw out this book
Unread this page
I guess it's good to have the geometric intuition about what a separating hyperplane is
late shell
yeah, fine lol, but the 1st line i.e logistic regression has 3 interpretations gemoetric, probabilistic and loss function. I've only studied about the probabilistic approach that maximizes the likelihood function. But ig sklearn has implemented the geometric approach, hence feature scaling helps. But why are there 3 interpretations of the same thing and all 3 are correct, like wth?
late shell
desert oar
I guess it's good to have the geometric intuition about what a separating hyperp...
yeah, I haven't read about that, ig I should study that first.
desert oar
I wouldn't say that it's a matter of implementation, because it is the exact same statement of the model and the exact same loss function, and you would use the exact same numerical optimization routines to fit it, no matter how you interpret it
It's just a question of what the parts of the model mean conceptually
late shell
desert oar
I wouldn't say that it's a matter of implementation, because it is the exact sam...
i didn't understand any of this. There was no loss function when I read about the logistic regression using the probability approach and Idk what you mean by numerical optimization routines
desert oar
If anything, the probabilistic version is just a special case of a loss function
You are using the principle of maximum likelihood estimation to obtain a loss function
You could also have just guessed and made up that loss function, or a different one
late shell
desert oar
If anything, the probabilistic version is just a special case of a loss function
So, basically I should learn about the 3 interpretations first, that would help me?
late shell
desert oar
You could also have just guessed and made up that loss function, or a different ...
woah
desert oar
I think you should pick one interpretation, then focus on understanding the math
The other interpretations will follow
Sit down with pen and paper and convince yourself that these two "different" models are mathematically identical. If you don't do that, you are just learning trivia (imo)
You don't have to write out a proof, but sometimes in math you have to at least push some equations around before you can really understand what's going on
late shell
cool, thanks for the awesome advice mate. 🙌
Btw, if you don't mind me asking, I've observed that you are the most active guy, helping everyone out in this server. You also have a helper role. But I don't really know how discord works or what a helper role actually means. So do the admins/owners pay you to help us or like how does it work?
Or are you a guy who just likes to help?
desert oar
late shell
Btw, if you don't mind me asking, I've observed that you are the most active guy...
In this server, helpers are unpaid volunteer staff, and basically yeah they are just people who like to help people
lapis sequoia
@late shell we can help people whenever we want regardless of role.
the above management can make us by selecting the person by themselves.
more details https://pythondiscord.com/pages/frequently-asked-questions/#q-how-do-i-get-the-helper-role-become-moderator-join-staff
The Python Discord FAQ.
late shell
desert oar
In this server, helpers are unpaid volunteer staff, and basically yeah they are ...
Wow, that's awesome.
late shell
lapis sequoia
<@!594900402634227752> we can help people whenever we want regardless of role.
...
cool, thanks.
cedar sun
f, google colab gave me a gpu that takes 10 more mins per epoch q.q
cedar sun
how do i calculate these values?
initial_learning_rate = 0.1
lr_schedule = tf.keras.optimizers.schedules.ExponentialDecay(
    initial_learning_rate,
    decay_steps=10000,
    decay_rate=0.96,
staircase=True)```also, what does this mean? 3200/3200 [==============================] - 2359s 737ms/step - loss: 4.7580 - accuracy: 0.1506 - val_loss: 3.6193 - val_accuracy: 0.2897 val_acc almost twice bigger than acc
uncut barn
Does anyone know where I can find the frequency (i.e. percentage) of the most common terms according to Zipfs law?
visual violet
it is already clean right?
i am finding ways to find something interesting :((
the percetange difference data gives 1 big cluster lol
serene scaffold
@visual violet sounds like you're trying to do data exploration rather than cleaning
visual violet
i feel like
the algo is trying to find very similar pattern
i may want something even remotely similar
not an almost exact match
 simple gyro
Hello!
Can anyone help me figure SVMs?
I have watched a lot of yt videos but I cant seem to get around the python code
 sour abyss
currently taking a course online called algorithms, part 1: in the "percolation" assignment we are supposed to run simulations of the percolation threshold. they provided this formula for calculating it from the simulations, but why use a sample mean here? shouldn't we use sqrt((p * (1-p)/n) for the sample SD instead?
 serene scaffold
simple gyro
Can anyone help me figure SVMs?
serene scaffold
simple gyro
Can anyone help me figure SVMs?
Did you install sklearn, or are you implementing it yourself?
 near cosmos
simple gyro
Can anyone help me figure SVMs?
near cosmos
simple gyro
Can anyone help me figure SVMs?
What is your question? In general, better to ask your question straight away then asking to ask.
serene scaffold
near cosmos
What is your question? In general, better to ask your question straight away the...
In this case I don't think that the problem is that they "asked to ask", but rather that they asked a broad question. They're probably trying to learn about SVMs in general.
If they want to use an off-the-shelf implementation, the question is a lot different than if they have to implement it.
near cosmos
Agreed, what I meant was "what specifically do you need help with about svms?"
 grand glen
I need help on installing tensorflow-cpu
I am on Ubuntu, with python 3.8.5
ERROR: No matching distribution found for tensorflow-cpu

Cross Validated
I have a data set with 16 variables, and after clustering by kmeans, I wish to plot the two groups.
What plots do you suggest to visually represent the two clusters?
what do you think?
near cosmos
grand glen
I need help on installing `tensorflow-cpu`
I am on Ubuntu, with python 3.8.5
``...
Is there a tensorflow-cpu? IIRC, in tensorflow 1, the name for cpu version is just tensorflow (and gpu version is tensorflow-gpu. For tensorflow 2, cpu and gpu support are both available via tensorflow.
grand glen
installing tensorflow has basically the same error.
and yeah it is a package https://pypi.org/project/tensorflow-cpu/
 serene scaffold
visual violet
what do you think?
serene scaffold
visual violet
what do you think?
You were wanting to visualize the clustering? I think you have to pick three dimensions and just visualize those.
austere swift
grand glen
I need help on installing `tensorflow-cpu`
I am on Ubuntu, with python 3.8.5
``...
are you on 64 bit python
python needs to be 64 bit for any tensorflow installation
austere swift
grand glen
How do I check?
type python in terminal, it should show you when you're entering repl
or python3 if its bound to that
grand glen
[GCC 9.3.0] on linux
Type "help", "copyright", "credits" or "license" for more information.
hmm
try
import sys
print(sys.maxsize > 2**32)
if its true then it should be 64 bit
if its false then its 32 bit
grand glen
says True
austere swift
are you sure the pip you're using to install tensorflow is bound to this python?
grand glen
yeah, i can use python3 -m pip same error
near cosmos
Hm, I just tried this on an Ubuntu box and it worked. Are other packages resolving correctly? e.g. pip install isort (or some other pure python package)
visual violet
i think i have quite big brain idea
i have this ingredient_cluster = pd.concat([ingredient_list, pd.DataFrame(predictions)], axis=1)
it will pair the ingredient with the cluster it belongs to
now all i have to do is graph each row in ingredient_price_matrix (each row of ingredient_price_matrix contains the price of each ingredient over quarters)
and color it according to which cluster. for example: cluster 0: red, cluster 1: blue
desert oar
@visual violet that's pretty much the right way to do it
serene scaffold
visual violet
i have this ```ingredient_cluster = pd.concat([ingredient_list, pd.DataFrame(pre...
is predictions not the same length as the number of rows in ingredient_list?
visual violet
yup
that is why i can concat them together
if they are different sizes, i cant
i don't relaly need to concat to be honest
because the ingredient_price_matrix and the predictions are also the same size
serene scaffold
you can just do ingredient_list['predictions'] = predictions
serene scaffold
the elegant way is usually the smartest one 😄
 grand glen
yeah, i can use `python3 -m pip` same error
grand glen
grand glen
yeah, i can use `python3 -m pip` same error
I just can't seem to install tensorflow for some reason... tried using pyenv, did not work.
serene scaffold
grand glen
I just can't seem to install tensorflow for some reason... tried using pyenv, di...
What error message?
grand glen
grand glen
I need help on installing `tensorflow-cpu`
I am on Ubuntu, with python 3.8.5
``...
@serene scaffold ^
serene scaffold
grand glen
<@!253696366952316929> ^
Thanks; what version of pip?
grand glen
serene scaffold
Thanks; what version of pip?
pip 21.1.2 from /usr/local/lib/python3.8/dist-packages/pip (python 3.8)
serene scaffold
grand glen
```pip 21.1.2 from /usr/local/lib/python3.8/dist-packages/pip (python 3.8)```
are you trying to install a >=2 version of tensorflow?
grand glen
I did not specify a version, i'd assume that means latest?
serene scaffold
grand glen
I did not specify a version, i'd assume that means latest?
For tensorflow 2, there's just one package for both gpu and cpu
try pip install tensorflow
grand glen
Same error
serene scaffold
can you try pip install --upgrade tensorflow?
grand glen
Same issue hmm.
ERROR: Could not find a version that satisfies the requirement tensorflow (from versions: none)
ERROR: No matching distribution found for tensorflow```otherwise try pip install https://storage.googleapis.com/tensorflow/linux/cpu/tensorflow_cpu-2.5.0-cp38-cp38-manylinux2010_x86_64.whl
grand glen
I don't know what to do at this point other than google the error message :/
grand glen
I already tried, and it did not help much. Not sure what else I can do.
near cosmos
@grand glen sanity checks: Can you install other packages via pip? Are you on an x86_64 platform?
lapis sequoia
use google data studio for visualization rather than seaborn and matplotlib
hi
how linear algebra is used in ml
 autumn lagoon
Higher dimensional matrix math
desert oar
@grand glen what OS are you using
And are you using an ARM machine like a Chromebook, Raspberry Pi, Macbook M1, etc?
 high badge
does anyone have good resources on a comprehensive guide to CNNs (like all the different conv layers, depthwise, separable, transpose, etc)
if possible, the resource could walk me through all the calculations from beginning to end 👍 thanks
 wispy sage
I was following a youtube tutorial (as you do) and one of the lines was not working for some reason. here's the code:
print('Bot: I am a bot that has learned about Half Life VR But the AI is Self-Aware. I learned my information on Wikipedia, the free online encyclopedia that anyone can edit. To exit type EXIT')
exit_list = ['exit','bye','goodbye','quit']
while(True):
user_input = input()
if user_input.lower in exit_list:
print('Bot: Goodbye.')
break
The error is in the user_input = input() line but I don't see anything wrong. I can send a link to the original project if needed. I am using google Colaboratory if that's important.
lapis sequoia
wispy sage
I was following a youtube tutorial (as you do) and one of the lines was not work...
i didnt find any error but i think you mean user_input.lower() instead of .lower
 jade carbon
is GANs used for text generation?
or just NLP technique?
lapis sequoia

In this session of Machine Learning Tech Talks, Tai-Danae Bradley, Postdoc at X, the Moonshot Factory, will share a few ideas for linear algebra that appear in the context of Machine Learning.
Chapters:
0:00 - Introduction
1:37 - Data Representations
15:02 - Vector Embeddings
31:52 - Dimensionality Reduction
37:11 - Conclusion
Resources:
Goog...
late shell
desert oar
<@594900402634227752> distances between points are still relevant even if you ar...
I just found this on stackexchange. Care to share your view on this?

 velvet fable

#Matplotlib #Python #Math
This tutorial shows how to make a simple 2048 game using Matplotlib. We use the Rectangle class of matplotlib.patches to visualize each cell, and we use the canvas' mpl_connect method to make the swipe interaction.
Code: https://github.com/anbarief/2048matplotlib
Facebook: https://www.facebook.com/Mathematical-Scienc...
 hot sky
Hi data science + AI! Does anyone know how I would implement the error lines seen in this graph in matplotlib? I've got the rolling average part down + the scatterplot... just need these error lines.
 desert oar
late shell
I just found this on stackexchange. Care to share your view on this?
desert oar
late shell
I just found this on stackexchange. Care to share your view on this?
It's correct, but in practice centering and standardizing your features can make a big difference
Numerical stability is not just for people doing high-performance computing
desert oar
hot sky
Hi data science + AI! Does anyone know how I would implement the error lines se...
You could do the vertical lines and diamonds separately
vlines for the former and scatter for the latter
Not sure how to get that specific diamond symbol
grand glen
desert oar
<@655954880812548099> what OS are you using
Sorry for the late responce, I had to go to sleep.
I am using Ubuntu Server 20.04.2 LTS (64 bit) on an Raspberry Pi 3 B.
grand glen
near cosmos
<@655954880812548099> sanity checks: Can you install other packages via pip? Are...
I am on a 64 bit os, and I am able to install other packages via pip.
grave frost
grand glen
Sorry for the late responce, I had to go to sleep.
I am using `Ubuntu Server 20...
TF2 is not for Pi, is it?
Last I remeber it was only TF1.x
grand glen
Would building it from source work?
wispy sage
lapis sequoia
i didnt find any error but i think you mean `user_input.lower()` instead of `.lo...
Thank you!
cedar sun
hey guys, ive never done a nn that returns an image as well
is it different?
like, harder?
wispy sage
unfortunately it's still not working
cedar sun
then is something else
lapis sequoia
wispy sage
Thank you!
i checked in my colab it is working. you're having some other issue.
grand glen
grave frost
TF2 is not for Pi, is it?
I'm using pyenv to use python 3.7.0 with the aarch64 wheel from here https://github.com/bitsy-ai/tensorflow-arm-bin#raspbery-pi and it seems to start to install.
desert oar
grand glen
Sorry for the late responce, I had to go to sleep.
I am using `Ubuntu Server 20...
Raspberry Pi uses a different CPU architecture ("ARM") from most desktop machines ("x86", or "x86-64" aka "amd64"). The "x86" wheels will not work on an ARM machine. There do not appear to be any ARM wheels for Tensorflow, and it's possible that TF doesn't even work on ARM.
grand glen
Ah
desert oar
Tensorflow Lite appears to support ARM, and it looks like they used to have officially supported ARM wheels, but it looks like they're gone now.
sly salmon
Does one-hot-encoding always map categorical variables into integers? If I have a softmax output layer which returns a probability vector for classification:
[0.2, 0.3, 0.3, 0.2] is this still an example of one-hot-encoding?
desert oar
sly salmon
Does one-hot-encoding always map categorical variables into *integers*? If I hav...
one-hot-encoding always map categorical variables into integers
the definition of one-hot encoding is to map categorical variables into1/0columns:
the one-hot encoding ofa, b, a, a, cis
1 0 0
0 1 0
1 0 0
1 0 0
0 0 1
this is also called "dummy variable" encoding in the social science fields
is this still an example of one-hot-encoding?
no, and you aren't "encoding" a categorical variable at all. you're just doing some math on a thing to transform it into a different thing.
sly salmon
oh - yeah. That makes sense. Thanks!
I'm doing a course on codecademy getting a model output of [5.09219170e-01 5.93296252e-02 3.95661918e-03 4.27486897e-01]... and was unsure why they said that they were one-hot-encoded labels
desert oar
because you probably performed one-hot encoding on the labels originally
can you show me the actual wording they used?
i doubt they were that lazy and sloppy about it
sly salmon
Here's the code:
https://hastebin.com/oziqisokoy.py
This is their prompt:
Using np.argmax() convert the one-hot encoded labels `y_estimate` into the index of the class each sample in the test data belongs to with the axis parameter set to 1. Assign the result to `y_estimate`.

Note: Running this in the LE will take almost a full minute!
In the code, I added a comment about what y_estimate is and by the definition of one-hot-encoding being binary (1 or 0), it doesn't look like that's one-hot-encoded, rather it just looks like a vector of probabilities.
desert oar
@sly salmon they are misusing/abusing the term "one-hot encoded labels", to your detriment
each element of this y_estimate corresponds to a one-hot encoded label
but they are not themselves one-hot encoded labels
sly salmon
I see, so one of my outputs is: (predicted label)
[5.09219170e-01, 5.93296252e-02, 3.95661918e-03, 4.27486897e-01]
This could correspond to a true label (one-hot-encoded by tensorflow.keras.utils.to_categorical) such as:
[0, 0, 0, 1]
I understand now which one is one-hot-encoded. And I think I know why this is important to have our last layer as softmax, as it will return a vector of probabilities in the same shape as our one-hot-encoded label so we can then perform cross-entropy calculations.
Is that right?
cedar sun
when doing transfer learning, which layers should i freeze?
cedar sun
sly salmon
I see, so one of my outputs is: (predicted label)
`[5.09219170e-01, 5.93296252e-...
actually it would be [1,0,0,0]
desert oar
sly salmon
Is that right?
yes! these are also sometimes called "confidence scores".
note that neural networks generally have bad properties when you try to interpret these as probabilities. this is known as "calibration" and neural networks tend to be poorly calibrated. see:
https://arxiv.org/abs/1706.04599
https://docs.aws.amazon.com/prescriptive-guidance/latest/ml-quantifying-uncertainty/temp-scaling.html
arXiv.org
Confidence calibration -- the problem of predicting probability estimates
representative of the true correctness likelihood -- is important for
classification models in many applications. We...
Introduces the temperature scaling method for estimating uncertainty in deep learning systems.
desert oar
cedar sun
actually it would be [1,0,0,0]
the true label could be anything, [1, 0, 0, 0] would be one way to turn these scores into a classification
cedar sun
[5.09219170e-01, 5.93296252e-02, 3.95661918e-03, 4.27486897e-01]
sly salmon
desert oar
yes! these are also sometimes called "confidence scores".
note that neural netw...
Thanks! I read through the topics, but I didn't really understand them. I think it's a bit too advanced for me atm.
I really appreciate the help by the way, you're so knowledgeable!
What would be the difference between confidence and probability? At the moment I don't see the difference.
desert oar
confidence is an informal concept, "more is more confident"
probability is the formal concept of probability that you use in math and stats
"calibration" means: do the model confidence scores correspond well to probabilities?
as in, if the confidence scores are [0.2 0.3 0.5], does that correspond to 0.2, 0.3, and 0.5 probability?
thorn bobcat
any recommended libraries or pathways for face recognition?
I've used a library and I am informed about the math behind it
desert oar
@sly salmon imagine that the labels are the "correct" probabilities, and the model confidence scores are your predictions. calibration is: how accurate are those predictions?
thorn bobcat
also salt have you used cv2?
cedar sun
when doing transfer learning, which layers should i freeze?
desert oar
no, i have only used cv2.imshow @thorn bobcat
desert oar
cedar sun
when doing transfer learning, which layers should i freeze?
freeze the layers that you don't want to train
thorn bobcat
so you have no idea how i can write frames to a video?
cedar sun
which ones i dont wanna train? XD
desert oar
often that means "freeze every layer except the last one"
cedar sun
desert oar
often that means "freeze every layer except the last one"
oh, rlly?
sly salmon
desert oar
<@!812098613450506351> imagine that the labels are the "correct" probabilities, ...
ah, that totally makes sense. Thanks.
thorn bobcat
anyone here worked with the face_recognition library?
cloud computing is nice.

think I can get this speed on a laptop?
ran facial recognition on 1000 images in 5 minutes.
sly salmon
desert oar
<@!812098613450506351> imagine that the labels are the "correct" probabilities, ...
sorry to go back to it, but since neural networks tend to be poorly calibrated - this means that they tend to be bad for classification?
desert oar
sly salmon
sorry to go back to it, but since neural networks tend to be poorly calibrated -...
No, it means that when you try to interpret the confidence scores as probabilities, you won't get very accurate probabilities
sly salmon
thorn bobcat
ran facial recognition on 1000 images in 5 minutes.
oh cool! I want to move onto image recognition soon - is the cv2 library required for that?
sly salmon
desert oar
No, it means that when you try to interpret the confidence scores as probabiliti...
gotcha. So I guess that applies more to unsupervised models. Thanks!
thorn bobcat
sly salmon
oh cool! I want to move onto image recognition soon - is the cv2 library require...
I'm using a library called face_recognition
but cv2 is used mostly for preparing samples and manipulating input here
desert oar
sly salmon
gotcha. So I guess that applies more to unsupervised models. Thanks!
not at all. it's often very useful and important to have estimated probabilities for predictions
let's say your model predicts insurance claims. it's almost less important to know if a claim will happen or not, you want to know the probability that a claim will happen.
cedar sun
is this how to freeze all layers except last?
base_model.trainable = False
x = GlobalAveragePooling2D()(base_model.output)
predictions = Dense(len(pokemons), activation='softmax')(x)

model = Model(inputs=base_model.input, outputs=predictions)```Trainable params: 20,490
Non-trainable params: 20,861,480```I think so, right?
im gonna test it
desert oar
that seems right to me
cedar sun
also... should i be using softmax?
desert oar
if it can only be 1 pokemon at a time, use softmax
sigmoid is for multi-label, softmax is for one label with more than 2 classes


 cedar sun
@desert oar im doing what u said, training only the last layer
and this is how it goes
39/39 [==============================] - 53s 1s/step - loss: 0.8668 - accuracy: 0.7399 - val_loss: 1.0782 - val_accuracy: 0.6304
Epoch 31/50
39/39 [==============================] - 52s 1s/step - loss: 0.8925 - accuracy: 0.7120 - val_loss: 1.0886 - val_accuracy: 0.6304
Epoch 32/50
39/39 [==============================] - 51s 1s/step - loss: 0.8486 - accuracy: 0.7237 - val_loss: 1.1080 - val_accuracy: 0.6502
Epoch 33/50
39/39 [==============================] - 52s 1s/step - loss: 0.8316 - accuracy: 0.7331 - val_loss: 1.0849 - val_accuracy: 0.6436
Epoch 34/50
39/39 [==============================] - 52s 1s/step - loss: 0.8281 - accuracy: 0.7201 - val_loss: 1.0658 - val_accuracy: 0.6601```it isnt improving mmm
desert oar
it looks like it's improving a little bit
desert oar
 unique wind
i think it's just a logarithm, no?
unique wind
desert oar
i think it's just a logarithm, no?
Yes, but what would be the function?
desert oar
i'm not sure if it has a nice closed form, but you can express it recursively
there is probably a financial math person here who knows
unique wind
If only this person could help me
desert oar
bitcoins[i+1] = bitcoins[i] * (1 + inflation[i])
it's been a while since i've had to think about stuff like this... let me do some digging. again, i'm sure someone more mathematically knowledgeable would know right away.
cedar sun
39/39 [==============================] - 55s 1s/step - loss: 0.7092 - accuracy: 0.7809 - val_loss: 1.0773 - val_accuracy: 0.6535
Epoch 50/50
39/39 [==============================] - 56s 1s/step - loss: 0.7670 - accuracy: 0.7553 - val_loss: 1.1330 - val_accuracy: 0.6205```i mean, i am training only with 10 pokemons
to see how it goes
but it seems frozen all layers except last one doesnt perform pretty well
im gonna try with more images per class
 lunar plank
hi
I wish to exchange ideas about memory mapping and other big data stuff, feel free to contact me
thorn bobcat
SystemError: <built-in function putText> returned NULL without setting an error
 native lodge
this is my statistics code which prints the success rates for my KNN code. it works great- without line 4 that is. it works in reasonable time, it prints numbers which make sense and in general it works well. However with line 4 the code still works in reasonable time but does not print anything- it doesnt give an error or anything but just doesnt print anything. I tried all my funcs (KNN, stats without normalisation and the normalisation itself) and they all work well. Any ideas why?
dfResult = normalisation(dfResult)

for k in [1, 3, 5, 7, 9, 11, 13]:
    for frac in [0.8, 0.7, 0.6, 0.5, 0.4, 0.3, 0.2, 0.1]:
        df_train = dfResult.sample(frac=frac)
        df_test = dfResult[~dfResult.isin(df_train)].dropna()
        #normalisation(df_train)
        #normalisation(df_test)
        #if this does not work check blulu and shabtai answers
        stats = get_stats(df_train, df_test, k)

        key = "k="+str(k)

        if not key in mydict:
            mydict[key] = {}
        mydict[key]["frac="+str(frac)]="{:.1%}".format(stats[True])
stats_df = pd.DataFrame.from_dict({(i): mydict[i]
                           for i in mydict.keys()},
                       orient='index')

stats_df
show the definition of normalisation @native lodge
native lodge
    for col in column_names:
        for cell in range(len(df[col])):
            df[col].iloc[cell] = ( df[col].iloc[cell] - df[col].min()) / (df[col].max()-df[col].min())
return df```i've tested it and it works good as far as I know
column_names is a list with my column names
desert oar
i don't know the source of that specific problem, but i think this implementation would be a lot faster (and you won't get the warnings anymore):
def normalise(series):
    val_min = series.min()
    val_max = series.max()
    return (series - val_min) / (val_max - val_min)

def normalisation(df):
    df[column_names] = df[column_names].apply(normalise)
in fact, i think your current normalisation() function is fundamentally broken because you are re-computing the minimum after every mutation step
not to mention that chaining assignments with .iloc could be really messy
also you shouldn't re-run normalization on the training data; this will give you incorrect (or at best, overly optimistic) results
serene scaffold
@desert oar strikes me as odd that pandas doesn't have a built-in method for squishing all the values in a column between 0 and 1.
thorn bobcat
SystemError: <built-in function putText> returned NULL without setting an error```
could i get help in [#help-mushroom](/guild/267624335836053506/channel/776184670794678303/)won't this normalize only a speciphic iloc and not every single line though?
desert oar
native lodge
won't this normalize only a speciphic iloc and not every single line though?
no, why would it?
native lodge
there's no for loop
desert oar
@native lodge pandas series implement "vectorized" operations for +, -, etc.
it does the loop internally, much faster than you can do it in python
thorn bobcat
am I using py cv2.putText(frame, match, (location[3]+10, location[2]+15), cv2.FONT_HERSHEY_SIMPLEX, 0.5, (200, 200, 200)) wrong?
where frame is the image, match is the name and location are the coordinates.
desert oar
@serene scaffold
"we have Series.normalize() at home"
Series.normalize() at home:
df.eval(
    'x_norm = (x - x_min) / (x_max - x_min)',
    local_dict={
        'x_min': df['x'].min(),
        'x_max': df['x'].max(),
    }
)
 sonic scaffold
In matplotlib i read an article about stateful and stateless approach so far i only used the stateful one so should i be knowing how to use both the approaches?
lunar plank
guys what's the fastest way you advice to access randomly the memory on disk? is memmap or mmap the best way or there's something more?
and how can i load a chunk of mapped variable in a ram variable? I tried var = memmap(blablabla) but it doesn't use ram
desert oar
@lunar plank show the actual code that you used
lunar plank
var = numpy.memmap(path, dtype = 'float64', mode = 'r', offset = 0, shape = 10000000)
desert oar
but does it work?
lunar plank
yes it does, but I wish to read a chunk directly from ram
thorn bobcat
---------------------------------------------------------------------------

SystemError                               Traceback (most recent call last)

<ipython-input-77-badda4f0d340> in <module>()
     31     bottom_right = (location[1], location[2])
     32     cv2.rectangle(frame, top_left, bottom_right, color, cv2.FILLED)
---> 33     cv2.putText(frame, match, (location[3]+10, location[2]+15), cv2.FONT_HERSHEY_SIMPLEX, 0.5, (200, 200, 200))
     34
     35 #creating output file

SystemError: <built-in function putText> returned NULL without setting an error
can i get help with this?
I can't seem to figure out what i did wrong here.
desert oar
@lunar plank
Memory-mapped files are used for accessing small segments of large files on disk, without reading the entire file into memory.
it won't allocate memory until you try to read data from it
you can trust that it is working
lunar plank
in this case I wish to load in ram a section of the file
what can I use?
because read from ram is faster as I know
I wish to try it
maybe with read() and seek() ?
lunar plank
desert oar
<@!777274112513933352>
> Memory-mapped files are used for accessing small segmen...
anyway, thank you ^-^
desert oar
i think you can use numpy [] for it
 fleet trail
Which dl framework is better tf or pytorch
lunar plank
one question: why in memmap is needed an offset if you can load directly the whole file and after it access the data by using var[x:y]?
in either way it doesn't use ram so..
charred umbra
cedar sun
```Epoch 49/50
39/39 [==============================] - 55s 1s/step - loss: 0.70...
Is there any reason youre training it for this many epochs?
cedar sun
no
@desert oar so, freezing only last layer doesnt go further than 0.7 more or less. May i unfreeze some? or what do u recommend / suggest?
 gloomy berry
idk if that's the right channel ... how can i set a rare chance to do something
like
x, y = "test", "test2"
print(random.choice([x, y]))
```i want `y` to be rarerandom.choices allows specifying weigths.
gloomy berry
!d random.choices
arctic wedgeBOT
random.choices(population, weights=None, *, cum_weights=None, k=1)```
Return a *k* sized list of elements chosen from the *population* with replacement. If the *population* is empty, raises [`IndexError`](https://docs.python.org/3/library/exceptions.html#IndexError "IndexError").

If a *weights* sequence is specified, selections are made according to the relative weights. Alternatively, if a *cum\_weights* sequence is given, the selections are made according to the cumulative weights (perhaps computed using [`itertools.accumulate()`](https://docs.python.org/3/library/itertools.html#itertools.accumulate "itertools.accumulate")). For example, the relative weights `[10, 5, 30, 5]` are equivalent to the cumulative weights `[10, 15, 45, 50]`. Internally, the relative weights are converted to cumulative weights before making selections, so supplying the cumulative weights saves work.umm
i went google i found numpy.random.choice
i think that's what i want 
thanks anyway
desert oar
cedar sun
<@!389497659087650836> so, freezing only last layer doesnt go further than 0.7 m...
what base model are you using?
it's probably not a good idea to start unfreezing additional layers, but this is not my area of expertise
cedar sun
xception
cedar sun
gloomy berry
like
```py
x, y = "test", "test2"
print(random.choice([x, y]))
```i want `y` to ...
can i make a probability function tho
def radiography(n=1):
    xk = (0, 1)
    pk = (0.625, 0.375)
    custom = stats.rv_discrete(name='custom', values=(xk, pk))
    if n == 1: return custom.rvs()
else: return custom.rvs(size=n)```something like this
u get 0 with 0.625 chances and 1 with 0.375
import scipy.stats as stats
grave frost
https://www.youtube.com/watch?v=rR5_emVeyBk
can't stop laughing 🤣
native lodge
native lodge
this is my statistics code which prints the success rates for my KNN code. it wo...
does anyone else have an idea perhaps? some other guy tried to fix my normalisation but his command did not work idk why
all commands work so idk why
lunar plank
it's normal that memmap from numpy is something like 10 times slower than normal mmap from python?
 coral kindle
What is the link between regularization and hyperparameters? I don't really get that part.
cedar sun
what is the batch size actually?
sly salmon
Binary data such as a sex of either 1 or 0 is categorical, right?
What is the point of one-hot encoding my binary features like this?
I'm doing classification, I could see why we would one-hot encode categorical labels (even if it's binary) - for cross-entropy loss. But I don't see the point of one-hot-encoding my binary features, codecademy is telling me that I should?
Also, why are they asking me to use LabelEncoder for my binary labels?
If my label can only be 0 or 1 - isn't that already sufficient?
grave frost
sly salmon
Binary data such as a `sex` of either `1` or `0` is categorical, right?
What is ...
Angry twitter noises #cancelNicky
 stone goblet
Just a question, i don’t someone knows something but is there a compatibility problem between the last version of anaconda and the seaborn library because i had to remove the py-conda-forge channel from .condarc file to upgrade seaborn at its latest version
sly salmon
grave frost
***Angry twitter noises #cancelNicky***
oh, is that because I specified that sex is binary? 
grave frost
sly salmon
Also, why are they asking me to use `LabelEncoder` for my binary labels?
If my l...
it doesn't matter - labelencoder would do the exact same. leave them as 0 and 1
sly salmon
yeah, I skipped those steps, some things that codecademy are telling me to do I don't see the reason behind.
Maybe it's just syntax practice
I have maybe 6 columns of binary features, and they want me to one-hot-encode them. I see no reason to.
grave frost
maybe smthing in SkLearn? I dunno, I used it a long time ago
 exotic maple
sly salmon
Binary data such as a `sex` of either `1` or `0` is categorical, right?
What is ...
exotic maple
sly salmon
Binary data such as a `sex` of either `1` or `0` is categorical, right?
What is ...
Twitter be like:
 exotic maple
grave frost
it doesn't matter - labelencoder would do the exact same. leave them as `0` and ...
exotic maple
grave frost
it doesn't matter - labelencoder would do the exact same. leave them as `0` and ...
the difference is that for features, some ML algos will understand that 0 & 1 not as binary features, but as ordinal in some sense. For example 1 > 0, but a Sex is not better than the other in reality
so onehotencoding gets rid of that possible bias by creating a column for each categorical option
grave frost
exotic maple
the difference is that for features, some ML algos will understand that 0 & 1 no...
but using 1 and -1 would offset this?
exotic maple
grave frost
but using `1` and `-1` would offset this?
that still has a directional relationship where there is none. 1 is still > than -1.
the average over the column is 0
but i dont you think you use the column average? perhaps some models that assume Gaussian distribution use it
sly salmon
if you one-hot encode a feature, aren't you still creating a new columns which will have the values of 0 and 1?
grave frost
that's weird - I have never heard about this kind of bias
any example which algo would do that?
exotic maple
sly salmon
if you one-hot encode a feature, aren't you still creating a new columns which w...
yes, but those are in new columns. For example, male is 0 in every column where every female is 1
grave frost
It shouldn't matter at all - if the aim is to reduce error
exotic maple
grave frost
that's weird - I have never heard about this kind of bias
I said "bias" because that's the one word that came to mind lol.
think it like this
the feature is "Sex" if its in a single column this feature will be assigned a specific weight for itself. If you have values 0 and 1, this directly modifies how the weight will be assigned because whatever category gets the 1 will be the one that influences the output.
1 and -1 do the same thing
because at the end of the day they both are assigned the same weight (inside a same feature, SeX)
sly salmon
exotic maple
yes, but those are in new columns. For example, male is 0 in every column where ...
I still don't understand that. Say we had sex column either 0 or 1.
We then one-hot-encode that, let's say making two new columns male or female.
Both the male and female columns will still have the same distribution of 0s and 1s as sex. In my eyes, it's just duplicating the column?
exotic maple
sly salmon
I still don't understand that. Say we had `sex` column either `0` or `1`.
We the...
It's not duplicating. It's separating so that each category can be treated individuall and the algorithm can find what is the relevance of being MALE (NOT SEX) for your result
You can also consider dropping one of the categories
for example, keep only females
the logical assumtipn is that NOT FEMALE = MALE. So if you learn the importance of "being female" you can easily infer the importance of "being male"

perfectly collinear in the sense is what I meant. You are either Male or Female, you can perfectly predict the other by knowing one
you can read a bit about it: https://scikit-learn.org/stable/modules/preprocessing.html#preprocessing-categorical-features
sly salmon
Ok, but if sex had 50 0s and 50 1s, one-hot-encoding making a male column, the male col would still have 50 0s and 50 1s, no?
exotic maple
sly salmon
Ok, but if `sex` had 50 `0`s and 50 `1`s, one-hot-encoding making a `male` colum...
if you keep both columns, yes
also the documnetation explains the situation better than me
@grave frost
sly salmon
So is there even a use of one-hot-encoding for binary data like this?
exotic maple
 exotic maple
sly salmon
So is there even a use of one-hot-encoding for binary data like this?
exotic maple
sly salmon
So is there even a use of one-hot-encoding for binary data like this?
yes. You can use with any amount of categorical features AFAIK
sly salmon
sure, but will it actually help me?
like that's just what I can't see
sorry about being a pain
exotic maple
sly salmon
sure, but will it actually *help* me?
I mean, that's something you have to decide as researcher lol
you could just drop the feature for all I know. 
sly salmon
hmm fair point. I think what I'll do is do my neural network without it, then go back and do it
see what happens then
but yes, thank you. I would say the moral of the story is: encoding categorical variables can introduce bias with some algorithms as they can be ordered in a certain way.
exotic maple
sly salmon
but yes, thank you. I would say the moral of the story is: encoding categorical ...
Ordinal Encoding can do that, yes
well, Ordinal / Label encoder
disclaimer: This might not apply to TEnsorflow / PyTorch encoders. I havent used those yet
 shadow ridge
Quick question: I have a variable 'official language', which is 1 if a song is in the official language of a country and 0 if not. But for some songs it was mandatory to be in the official language, and for some it was optional. I'm using this for a prediction model, I'm wondering if it makes sense to introduce a third value to differentiate between official language-mandatory and official language-voluntary? So having values 0,1,2 instead of 0,1?
I'm new to working with predictions, so I have no idea what kind of considerations are important
grave frost
exotic maple
hmmm