#data-science-and-ml
1 messages · Page 316 of 1
 autumn basin
It's useful @cedar sun, just not in the way you are thinking of. We are both right. Yay
 cedar sun
what i mean is that the confusion matrix plots the performance per class, while a 2x2 doesnt
 desert oar
Yes, but the aggregated statistics are important too
autumn basin
You're right
cedar sun
so maybe my model performs excelent for 800 classes, but for the other 98 it sucks
autumn basin
Really it will all come down to what we are using this model for.. and what the purpose of the diagnosis is
cedar sun
so with the conf matrix i could see that, and give more images of those classes
a 2x2 wont give me that info
autumn basin
Bro we have said you are right but you are still missing the point.
cedar sun
ok
autumn basin
Which salt stated. Aggregates are useful.
But they are not everything
And you are right that you lose information when you aggregate
But there is some retained and there are benefits in the simplicity
Especially if you are trying to visualize and your choices are a 2x2 or a 900x900 lol
 lapis sequoia
Hello, i have list with 332 elements
pd.DataFrame.from_records(lista[1])
I can make dataframe like that, but only for each element, how i can make dataframe that will contains all elements?
 novel elbow
try: pd.DataFrame({'your_colname': lista})
lapis sequoia

I got multiple columns
I am thinking about
pd.concat([s, pd.DataFrame.from_records(lista[2])], ignore_index=True)
``` in for loopfor i in range(1,len(lista)):
s = pd.concat([s, pd.DataFrame.from_records(lista[i])], ignore_index=True)
``` got this like that, but idk if this is proper wway serene scaffold
lapis sequoia
serene scaffold
lapis sequoia
so you're trying to unpack the dictionaries, basically?
lapis sequoia

I got json from world bank API, but there was 322 pages, so i got 322 dicts saved as elemnts on list
and based on that i was on need to make dataframe, as seen in screenshot
serene scaffold
@lapis sequoia can you run print(s.head().to_csv()) and copy/paste the result as text (no screenshot)?
lapis sequoia
,indicator,country,countryiso3code,date,value,unit,obs_status,decimal
0,"{'id': 'EN.ATM.CO2E.KT', 'value': 'CO2 emissions (kt)'}","{'id': '1A', 'value': 'Arab World'}",ARB,1970,218308.778433079,,,0
1,"{'id': 'EN.ATM.CO2E.KT', 'value': 'CO2 emissions (kt)'}","{'id': '1A', 'value': 'Arab World'}",ARB,1969,208659.203633279,,,0
2,"{'id': 'EN.ATM.CO2E.KT', 'value': 'CO2 emissions (kt)'}","{'id': '1A', 'value': 'Arab World'}",ARB,1968,167336.405004301,,,0
3,"{'id': 'EN.ATM.CO2E.KT', 'value': 'CO2 emissions (kt)'}","{'id': '1A', 'value': 'Arab World'}",ARB,1967,146829.222638667,,,0
4,"{'id': 'EN.ATM.CO2E.KT', 'value': 'CO2 emissions (kt)'}","{'id': '1A', 'value': 'Arab World'}",ARB,1966,135758.648810129,,,0
what happens when you run print(s.iloc[0, 1].__class__)?
lapis sequoia
<class 'dict'>
serene scaffold
lapis sequoia
<class 'dict'>
So the two columns that contain dicts are indicator and country, right?
lapis sequoia
Yeah, i would like to format them
{'id': '1A', 'value': 'Arab World'} - just Arab World would be better 😄
serene scaffold
lapis sequoia
Yeah, i would like to format them
>>> df['indicator'].apply(pd.Series)
               id               value
0  EN.ATM.CO2E.KT  CO2 emissions (kt)
1  EN.ATM.CO2E.KT  CO2 emissions (kt)
2  EN.ATM.CO2E.KT  CO2 emissions (kt)
3  EN.ATM.CO2E.KT  CO2 emissions (kt)
4  EN.ATM.CO2E.KT  CO2 emissions (kt)
yeah, but i also need to delet id column form that, and to show that in whole S dataframe 😄
serene scaffold
lapis sequoia
yeah, but i also need to delet id column form that, and to show that in whole S ...
so you only want to pull the value values out of each dict?
you can use apply to get that as well
 serene scaffold
lapis sequoia
serene scaffold
lapis sequoia
how did you do it?
lapis sequoia
d = s['indicator'].apply(pd.Series)
s['indicator'] = d["value"]
>>> from operator import itemgetter
>>> df.indicator.apply(itemgetter('value'))
0    CO2 emissions (kt)
1    CO2 emissions (kt)
2    CO2 emissions (kt)
3    CO2 emissions (kt)
4    CO2 emissions (kt)
That's how I did it.
lapis sequoia
show me df
serene scaffold
lapis sequoia
show me df
I don't write it back to the dataframe in this example
>>> print(df.to_csv())
,Unnamed: 0,indicator,country,countryiso3code,date,value,unit,obs_status,decimal
0,0,"{'id': 'EN.ATM.CO2E.KT', 'value': 'CO2 emissions (kt)'}","{'id': '1A', 'value': 'Arab World'}",ARB,1970,218308.778433079,,,0
1,1,"{'id': 'EN.ATM.CO2E.KT', 'value': 'CO2 emissions (kt)'}","{'id': '1A', 'value': 'Arab World'}",ARB,1969,208659.203633279,,,0
2,2,"{'id': 'EN.ATM.CO2E.KT', 'value': 'CO2 emissions (kt)'}","{'id': '1A', 'value': 'Arab World'}",ARB,1968,167336.405004301,,,0
3,3,"{'id': 'EN.ATM.CO2E.KT', 'value': 'CO2 emissions (kt)'}","{'id': '1A', 'value': 'Arab World'}",ARB,1967,146829.222638667,,,0
4,4,"{'id': 'EN.ATM.CO2E.KT', 'value': 'CO2 emissions (kt)'}","{'id': '1A', 'value': 'Arab World'}",ARB,1966,135758.648810129,,,0
so to save that it would be
 s['indicator'] = df.indicator.apply(itemgetter('value'))
``` ? ;pyeah, that would do it if you've imported itemgetter, which is in the standard library
from operator import itemgetter
also I'd usually do df['indicator'] instead of df.indicator, I'm just being lazy
 serene scaffold
I never look normal 🤷🏻♂️
serene scaffold
lapis sequoia
Who here is good at tensorflow or pytorch...
go ahead and just ask your question
lapis sequoia
Well
lapis sequoia
serene scaffold
go ahead and just ask your question
You know Googles teachable machine?
serene scaffold
lapis sequoia
You know Googles teachable machine?
No. But if you ask your question, people can read it and see if they can help.
lapis sequoia
You provide it pictures and it creates a keras file for you
I want to to do the same but I want to create a keras file using all of the pictures

Using code, not google teachable machine
autumn basin
So you want help building the model or using all of the photos as training/test data or what?
 grave frost
I am a bit hesitant so wanted to confirm 😅 If I have my input sequences heavily downsampled and modified (with a non-stochastic algo), then it doesn't matter during testing/inference as long as I keep the pre-processing function same?
I am mostly destroying the original input by my pre-processing
or can any DSP person tell me what is the best way to reduce an audio sample by like 20-40x ?
 keen prism
https://www.userbenchmark.com/System/MSI-P67A-GD65-MS-7681/1225
https://www.msi.com/Motherboard/P67AGD65/Specification
so, this is my motherboard for my windows pc (which I use more), typically with WSL
my linux server is essentially a code server, and it uses the ASRoock Z77 Extreme 4
https://www.asrock.com/mb/intel/z77 extreme4/
recently I found out these computers produce errors when I try to run some ocr-related code:
[W NNPACK.cpp:80] Could not initialize NNPACK! Reason: Unsupported hardware.
so, I could buy a new laptop and use these computers for something else, or I could find GPU's for them
not my strong suit. I don't know how to check for compatibility.

As a world leading gaming brand, MSI is the most trusted name in gaming and eSports. We stand by our principles of breakthroughs in design, and roll out the amazing gaming gear like motherboards, graphics cards, laptops and desktops.
Premium Gold Caps; Digi Power Design, 8 + 4 Power Phase Design; Supports Dual Channel DDR3 2800+(OC); 2 PCIe 3.0 x16, Supports AMD Quad CrossFireX™, CrossFireX™ and NVIDIA Quad SLI™, SLI™; PCIE Gigabit LAN; Supports Intel HD Graphics with Built-in Visuals; Graphics Output Options : DVI-D, D-Sub, HDMI; Combo Cooler Option (C.C.O.); 7.1 CH HD Audi...
 icy thorn
Hello, just had a quick pandas question, why does
df.iloc[:, 0].values
return a 1d array but
df.iloc[:,:-1].values
return a 2d array?
serene scaffold
icy thorn
Hello, just had a quick pandas question, why does
`df.iloc[:, 0].values`
retur...
0 is an int, whereas :-1 is a slice.
If you removed the colon, you should be getting a frame of the same shape as the first one.
 quasi sparrow
Has anyone had the problem where the model.fit() in Keras would not accept the training dataset built in numpy array?
I have mydataset built in numpy but the model.fit() reads it as "only 1 row"
cedar sun
Guys, are there better models for image classification? newers ones, newers than xception or resnet or vgg, etc
 exotic maple
cedar sun
Guys, are there better models for image classification? newers ones, newers than...
exotic maple
cedar sun
Guys, are there better models for image classification? newers ones, newers than...
At that point you'd have to dig tthrough papers
exotic maple
icy thorn
Hello, just had a quick pandas question, why does
`df.iloc[:, 0].values`
retur...
the first one is returning you all rows of a SINGLE column.
The 2nd one is returning all rows of all columns, from the first to the last.
 topaz grove
Anyone know how to fix
SQLITE database locked ?
exotic maple
@icy thorn your 1st slice reads like this
[First_row : last_row, Col_at_index[0]]
the 2nd one reads like this:
[ first_row : last_row , first_col : col_at_index[-1] -> this is the same as last column]
so the 2nd slice is just returning the whole thing
I'm assuming this is an .iloc. Unless you have a -1 in your index lol
 thorn bobcat
yo
grave frost
yo
cedar sun
awesome ruler. i am trying with inception, but it seems worse lel
do u know newer models?
that may perform better?
grave frost
cedar sun
do u know newer models?
why don't you google it?
cedar sun
cuz idk what to google
 velvet thorn
cedar sun
cuz idk what to google
velvet thorn
cedar sun
cuz idk what to google
“image recognition deep learning architectures” would be what I’d start with
cedar sun
okey
also, someone told me about

The current state-of-the-art on OMNIGLOT - 1-Shot, 20-way is GCR. See a full comparison of 19 papers with code.
But he dced so idk what can i get from here
 plucky spire
hey guys I have a noob question
when I compare a column against a value it gives me true or false for each value in the column right
but I'm wondering when I put that in an if statement, it's still in a list
so I need to consider each value as it's Bool

line 27
serene scaffold
plucky spire
but I'm wondering when I put that in an if statement, it's still in a list
In the future, remember to share code as text as not as a screenshot. However numpy uses comparison operators differently than the rest of Python does. If you want to use a boolean array in an if statement, use the .any() or .all() methods
It looks like this is a dataframe rather than an array, but the same methods exist.
grave frost
cedar sun
https://paperswithcode.com/sota/few-shot-image-classification-on-omniglot-1-1
don't try to use SOTA architectures just yet
cedar sun
why not? and why do u say yet?
plucky spire
@serene scaffold yeah this is a dataframe. I'm just saying when I do year2100 > 50 right, that gives me boolean values in the form of a list.
velvet thorn
plucky spire
<@!253696366952316929> yeah this is a dataframe. I'm just saying when I do year...
not a list, a Series
plucky spire
I was wondering, instead of getting a series* from that or something similar I just want to compare the value in question
velvet thorn
plucky spire
I was wondering, instead of getting a series* from that or something similar I j...
to what?
you have multiple values there
plucky spire
so I basically want every country corresponding with an average life expectancy of over 50 in the year 2100 right
and only those countries
not true false values for each
velvet thorn
plucky spire
so I basically want every country corresponding with an average life expectancy ...
use it to filter
I can't see your column names
post code as text
!code
 arctic wedgeBOT
Here's how to format Python code on Discord:
```py
print('Hello world!')
```
These are backticks, not quotes. Check this out if you can't find the backtick key.
plucky spire
the column names are "country" followed by "1800 - 2100"
velvet thorn
uh
without seeing the structure of your data
I can't give you an exact answer
but have an example
!e
import pandas as pd

s = pd.Series(['a', 'b', 'c'])
f = pd.Series([True, False, True])

print(s)
print(s[f])
@velvet thorn :white_check_mark: Your eval job has completed with return code 0.
001 | 0    a
002 | 1    b
003 | 2    c
004 | dtype: object
005 | 0    a
006 | 2    c
007 | dtype: object
okay
imagine the values lining up
   a     b    c
True False True
so you have two series
and you just remove the ones that correspond to False
velvet thorn
plucky spire
<@!253696366952316929> yeah this is a dataframe. I'm just saying when I do year...
this
gives you a boolean Series like above
you can use that
cedar sun
plucky spire
sigh I just don't really know wtf happened there tbh
he is looping through a boolean array
plucky spire
that is greater than yes
velvet thorn
cedar sun
he is looping through a boolean array
it's not looping actually
cedar sun
well, im pretty sure u are looping on a zip or something similar
plucky spire
i'm using gapminder data
looks like this https://gyazo.com/55b5e4ef1e2dd4b6a2398294d86a5edf
 velvet thorn
cedar sun
also, if u want performance, u check the numpy.where function
velvet thorn
cedar sun
also, if u want performance, u check the numpy.where function
why do you think np.where would help
grave frost
cedar sun
why not? and why do u say _yet_?
not at this stage, is what I meant
cedar sun
just saying it is faster, aka performance. Not that it will be better
cedar sun
grave frost
not at this stage, is what I meant
u mean, for my level of knownledge or for my problem?
grave frost
cedar sun
u mean, for my level of knownledge or for my problem?
both actually
plucky spire
so when you say gives you a boolean series I'm curious about the part where you take out the false values..
velvet thorn
cedar sun
just saying it is faster, aka performance. Not that it will be better
no, for what case?
like how do you plan to use np.where?
velvet thorn
plucky spire
so when you say gives you a boolean series I'm curious about the part where you...
that's how pandas indexing works
cedar sun
in general. Looping with a boolean array is the same as using np.where
velvet thorn
you have a Series of data, you index it with a boolean Series
velvet thorn
cedar sun
in general. Looping with a boolean array is the same as using np.where
like I said
that's not looping
that's straight indexing
which is a different case from np.where
you cannot replace indexing in general with np.where
plucky spire
so year2018[0] ?
velvet thorn
because np.where will always return an array with the same shape as all its arguments
plucky spire
i'd have to go through the tutorial you posted first right?
or you want straight text of like the file i'm using?
velvet thorn
plucky spire
i'd have to go through the tutorial you posted first right?
I didn't post any tutorial
plucky spire
like this?
velvet thorn
plucky spire
or you want straight text of like the file i'm using?
print a few rows of the DataFrame
!code
arctic wedgeBOT
Here's how to format Python code on Discord:
```py
print('Hello world!')
```
These are backticks, not quotes. Check this out if you can't find the backtick key.
velvet thorn
use codeblocks
cedar sun
grave frost
both actually
lets omit my knnownledge. Why for my problem it isnt good idea?
Like, ok. how would u approach my problem?
plucky spire
velvet thorn
I didn't post any tutorial
1800 1801 1802 1803 ... 2097 2098 2099 2100
Afghanistan 28.2 28.2 28.2 28.2 ... 77.3 77.4 77.5 77.7
Albania 35.4 35.4 35.4 35.4 ... 88.0 88.1 88.2 88.3
Algeria 28.8 28.8 28.8 28.8 ... 88.9 89.0 89.1 89.2
Andorra NaN NaN NaN NaN ... NaN NaN NaN NaN
Angola 27.0 27.0 27.0 27.0 ... 79.5 79.7 79.8 79.9
Antigua and Barbuda 33.5 33.5 33.5 33.5 ... 86.7 86.8 86.9 87.0
Argentina 33.2 33.2 33.2 33.2 ... 87.3 87.4 87.5 87.6
Armenia 34.0 34.0 34.0 34.0 ... 86.0 86.2 86.3 86.4
Australia 34.0 34.0 34.0 34.0 ... 91.7 91.8 91.9 92.0
Austria 34.4 34.4 34.4 34.4 ... 91.5 91.6 91.7 91.8
Azerbaijan 29.2 29.2 29.2 29.2 ... 80.5 80.6 80.7 80.9
Bahamas 35.2 35.2 35.2 35.2 ... 83.6 83.7 83.8 84.0
Bahrain 30.3 30.3 30.3 30.3 ... 89.1 89.2 89.3 89.4
Bangladesh 25.5 25.5 25.5 25.5 ... 87.3 87.4 87.5 87.6
Barbados 32.1 32.1 32.1 32.1 ... 86.4 86.5 86.6 86.7
Belarus 36.2 36.2 36.2 36.2 ... 84.5 84.6 84.7 84.8
Belgium 40.0 40.0 40.0 40.0 ... 91.1 91.2 91.3 91.4
Belize 26.5 26.5 26.5 26.5 ... 85.1 85.2 85.3 85.4
Benin 31.0 31.0 31.0 31.0 ... 78.4 78.5 78.7 78.8
Bhutan 28.8 28.8 28.8 28.8 ... 87.8 87.9 88.0 88.1
grave frost
velvet thorn
use codeblocks
haha - imagine saying that so many times as to set your nickname as that 🤣
plucky spire
yea i literally don't know how man lol
velvet thorn
plucky spire
1800 1801 1802 1803 ... 2097 2098 2099 2100
Afghanistan 28...
I literally said
use codeblocks
!code
read that
velvet thorn
Here's how to format Python code on Discord:
print('Hello world!')
sigh
```py
like this
```
grave frost
cedar sun
lets omit my knnownledge. Why for my problem it isnt good idea?
pre-trained models won't adapt to your target domain
velvet thorn
I posted it twice up there already
plucky spire
(187, 301)
                     1800  1801  1802  1803  ...  2097  2098  2099  2100
Afghanistan          28.2  28.2  28.2  28.2  ...  77.3  77.4  77.5  77.7
Albania              35.4  35.4  35.4  35.4  ...  88.0  88.1  88.2  88.3
Algeria              28.8  28.8  28.8  28.8  ...  88.9  89.0  89.1  89.2
Andorra               NaN   NaN   NaN   NaN  ...   NaN   NaN   NaN   NaN
Angola               27.0  27.0  27.0  27.0  ...  79.5  79.7  79.8  79.9
Antigua and Barbuda  33.5  33.5  33.5  33.5  ...  86.7  86.8  86.9  87.0
Argentina            33.2  33.2  33.2  33.2  ...  87.3  87.4  87.5  87.6
Armenia              34.0  34.0  34.0  34.0  ...  86.0  86.2  86.3  86.4
Australia            34.0  34.0  34.0  34.0  ...  91.7  91.8  91.9  92.0
Austria              34.4  34.4  34.4  34.4  ...  91.5  91.6  91.7  91.8
Azerbaijan           29.2  29.2  29.2  29.2  ...  80.5  80.6  80.7  80.9
Bahamas              35.2  35.2  35.2  35.2  ...  83.6  83.7  83.8  84.0
Bahrain              30.3  30.3  30.3  30.3  ...  89.1  89.2  89.3  89.4
Bangladesh           25.5  25.5  25.5  25.5  ...  87.3  87.4  87.5  87.6

Barbados             32.1  32.1  32.1  32.1  ...  86.4  86.5  86.6  86.7
Belarus              36.2  36.2  36.2  36.2  ...  84.5  84.6  84.7  84.8
Belgium              40.0  40.0  40.0  40.0  ...  91.1  91.2  91.3  91.4
Belize               26.5  26.5  26.5  26.5  ...  85.1  85.2  85.3  85.4
Benin                31.0  31.0  31.0  31.0  ...  78.4  78.5  78.7  78.8
Bhutan               28.8  28.8  28.8  28.8  ...  87.8  87.9  88.0  88.1
they're backticks.
on the left of your "1" ke
cedar sun
why do u say i dont have enough data? what will be enough ?
velvet thorn
y
grave frost
plucky spire
```py
(187, 301)
1800 1801 1802 1803 ... 2097 2098 2...
this symbol ` copy and paste
plucky spire
there we go 😄
velvet thorn
top left of your keyboard
plucky spire
first column is country it didn't catch it
grave frost
cedar sun
I actually have 100+ images per class
a fuckton of images, to be precise
cedar sun
huh
grave frost
cedar sun
huh
atleast like half a mil
velvet thorn
instead of a column
cedar sun
grave frost
a fuckton of images, to be precise
okey, i will download more images
cedar sun
why? XD
grave frost
not at that scale lol
cedar sun
not but using google api
velvet thorn
anyway
grave frost
plus your task is very small
and basic
and weak
better to use a simple model like VGG
plucky spire
there i fixed the code
plucky spire
or the datafram ei mean
cedar sun
ive read resnet is the one with best results on imagenet
grave frost
yeah, and efficientnet, inception etc.
velvet thorn
@plucky spire try df[df[2018] > 50].index
grave frost
whatever works
cedar sun
grave frost
yeah, and efficientnet, inception etc.
inception is big (?)
grave frost
but not the whole NET
cedar sun
And where are lite versions of them?
grave frost
or better, make your own CNN
grave frost
cedar sun
And where are lite versions of them?
just make your own
plucky spire
err that doesn't work @velvet thorn
cedar sun
i will try with inception and resnet and vgg, and see which of them gets better, and then i will remove
velvet thorn
ALSO as codeblock please
cedar sun
cuz tbh, idk what to remove
plucky spire
oh woops it should be year2018 not 2018
velvet thorn
change it
plucky spire
okay it gives uh key error
velvet thorn
then your column name is wrong
plucky spire
kk
velvet thorn
which, above, appeared to be 2018
velvet thorn
plucky spire
```py
(187, 301)
1800 1801 1802 1803 ... 2097 2098 2...
here
plucky spire
yeah it is now i get
keyerror(key) from err
le[le[2018] > 50].index
i dno even if it were to work
that solution seems beyoind the scope of where i'm at in this course
or maybe not lol
velvet thorn
plucky spire
yeah it is now i get
print(le.columns)
plucky spire
mhm that works
plucky spire
Index(['1800', '1801', '1802', '1803', '1804', '1805', '1806', '1807', '1808',
       '1809',
       ...
       '2091', '2092', '2093', '2094', '2095', '2096', '2097', '2098', '2099',
       '2100'],
gm, just make your name capital so everyone always pays attention
velvet thorn
plucky spire
```py
Index(['1800', '1801', '1802', '1803', '1804', '1805', '1806', '1807', '18...
they're strings
use '2018' instead of 2018
velvet thorn
grave frost
gm, just make your name capital so everyone always pays attention
I will try that
plucky spire
ah it works
             1800  1801  1802  1803  1804  ...  2096  2097  2098  2099  2100
country                                    ...
Afghanistan  28.2  28.2  28.2  28.2  28.2  ...  77.1  77.3  77.4  77.5  77.7
Albania      35.4  35.4  35.4  35.4  35.4  ...  87.9  88.0  88.1  88.2  88.3
Algeria      28.8  28.8  28.8  28.8  28.8  ...  88.8  88.9  89.0  89.1  89.2
Andorra       NaN   NaN   NaN   NaN   NaN  ...   NaN   NaN   NaN   NaN   NaN
Angola       27.0  27.0  27.0  27.0  27.0  ...  79.4  79.5  79.7  79.8  79.9
@late valley to answer your question about what version of Python you should learn, the answer is (almost) always "Python 3".
plucky spire
so this has isolated onlly countries with average age > 50?
then gave all their info about it
velvet thorn
plucky spire
so this has isolated onlly countries with average age > 50?
huh?
serene scaffold
You should only learn Python 2 to maintain legacy code. And if you want to be a data scientist, it's unlikely that any legacy code will even be in python 2.
 late valley
serene scaffold
<@!487003988525580299> to answer your question about what version of Python you ...
late valley
serene scaffold
<@!487003988525580299> to answer your question about what version of Python you ...
oh 
grave frost
velvet thorn
I will try that
looking better 👌
velvet thorn
where does average age come from
late valley
m
velvet thorn
is that what the value in each column is?
late valley
ok thanks stelercus
 bleak pier
Guys, sorry me disturb you... but if someone can help me with this...
My objective is create a new column evaluating these conditions... What was my wrong?
 serene scaffold
bleak pier
Guys, sorry me disturb you... but if someone can help me with this...
My object...
serene scaffold
bleak pier
Guys, sorry me disturb you... but if someone can help me with this...
My object...
I'm already helping you with this in #help-croissant
bleak pier
ok
plucky spire
sry i received a phone call @velvet thorn I meant to ask were these countries only ones which have a value of greater than 50 in year 2018?
serene scaffold
Is there a better alternative to data.iloc[5:9, [1, 2, *range(10, 50)]] if you wanted to select non-contiguous columns?
exotic maple
serene scaffold
Is there a better alternative to `data.iloc[5:9, [1, 2, *range(10, 50)]]` if you...
depends
You could always use step size
velvet thorn
serene scaffold
Is there a better alternative to `data.iloc[5:9, [1, 2, *range(10, 50)]]` if you...
I don't think so?
but the question would also be
why do you want to do that?
in general I feel like accessing columns by position is weird
exotic maple
velvet thorn
in general I feel like accessing columns by position is weird
data is weird. specially if it comes from crap sources with no schema lol
serene scaffold
velvet thorn
in general I feel like accessing columns by position is weird
Someone else asked in a help channel and I wanted to make sure I was steering them right.
velvet thorn
serene scaffold
Someone else asked in a help channel and I wanted to make sure I was steering th...
there's no better way AFAIK, but it's also not a pattern that should be common IMO
imagine the same thing in SQL
 slate fox
Anyone worked with RNN?
 narrow dagger
slate fox
Anyone worked with RNN?
narrow dagger
slate fox
Anyone worked with RNN?
DM me for help
 sudden canyon
@narrow dagger, we prefer that help sessions occur on this server, and not in private. That way, more people can contribute to a conversation
 fervent zenith
how do i concat nested dataframe like this into single one

 tidal bronze
guys with no formal education, how did you land your first job?
What kind of project impressed your employer?
 ripe forge
fervent zenith
how do i concat nested dataframe like this into single one
ripe forge
fervent zenith
how do i concat nested dataframe like this into single one
Unnest into a flat list, then use pd.concat (I'm assuming the column headers all match and so on)
 broken eagle
big noob here
need help with understand numpy vectorize documentation
specifically 'excluded'
def g(x,p):
return p[0]+xp[1]+x * xp[2]
print(g(5,[0,0,1]))
vg = np.vectorize(g, excluded=['p'])
print(vg(x=[0,1,2,3,4,5],p=[0,0,1])) # p will not be iterated
what does it mean that p is excluded and will not be iterated? does it just mean to tell the ide to iterate g only? and not bother trying to iterate p?
 sly salmon
how do libraries differentiate the cost function? is it hard-coded?
slate fox
narrow dagger
DM me for help
@narrow dagger Thank you for your help today. You are a great guy
narrow dagger
@slate fox You are welcome 🙂
lapis sequoia
Anyone has a clue why micro isn't present on classification_report?

using sklearn's digits dataset
pred = LogisticRegression()
narrow dagger
The micro-averaged precision, recall, and F1-score are all the same, and are all equal to the overall accuracy when including all the classes. try this: print(classification_report(y_test, y_pred, labels=[1,2,3,4,5,6,8,9,10]))
lapis sequoia
yeah just read about it
lapis sequoia
narrow dagger
The micro-averaged precision, recall, and F1-score are all the same, and are all...
btw how come this doesn't work? print(classification_report(y_test, pred, labels=list(range(0, 10))))
would be so weird
cedar sun
how can i plot with seaborn something that looks like label1 = 50, label2=80, label3=10, ...?
narrow dagger
@cedar sun
label1=50
label2=80
label3=10
labels = ['label1', 'label2', 'label3']
values = [50, 80, 10]
plt.bar(labels,values)
plt.show()
narrow dagger
using seaborn:
label1=50
label2=80
label3=10
labels = ['label1', 'label2', 'label3']
values = [50, 80, 10]
sns.barplot(labels,values)
narrow dagger
cedar sun
and if i have 1000 labels? i dont want all the labels to be displayed
each value must have its label
cedar sun
mmm am i forced to display the labels name?
narrow dagger
they are the x axis of the plot
bleak pier
Guys, good morning, sorry me disturb you! There is another way to stratify the train and test dataset following this pattern?
Train (40,40,40)
Test(10,10,10)
I've been searching for a way but I don't find it...
 cedar sun
narrow dagger
they are the x axis of the plot
cedar sun
narrow dagger
they are the x axis of the plot
but can i not include them on the plot?
narrow dagger
cedar sun
but can i not include them on the plot?
I don't think so
grave frost
sly salmon
how do libraries differentiate the cost function? is it hard-coded?
yea, they have in-built autodiff engine if I am not wrong
sly salmon
i see. that would make sense, thanks
searching about it on youtube, i was recommended a lot of automatic differentiation videos
 uncut monolith
hey guys i have some problems using complex numbers in python
no matter what calculation i do
i get
TypeError: 'complex' object is not callable
my code

if someone help i will be totally grateful
is for a college project
serene scaffold
uncut monolith
my code
In regular math notation, having two values next to each other is implicit multiplication. However Python does not have this. So you have to have the star operator to multiply.
uncut monolith
serene scaffold
In regular math notation, having two values next to each other is implicit multi...
but when i do this, the J keyword not work, because the numpy library indicats to use the complex number next to each other
if i do what u said
 serene scaffold
uncut monolith
but when i do this, the J keyword not work, because the numpy library indicats t...
serene scaffold
uncut monolith
but when i do this, the J keyword not work, because the numpy library indicats t...
The star should go after the j.
1j * (160 * 2 * math.pi * 60)
In the future, please share code as text (no screenshots)
uncut monolith
serene scaffold
`1j * (160 * 2 * math.pi * 60)`
yeah was exactly this
sorry for my high level noobie on this one kkkkkkk
serene scaffold
uncut monolith
yeah was exactly this
did you put a space after the 1?
serene scaffold
!e
import math

print(1j*(160 * 2 * math.pi * 60))
@serene scaffold :white_check_mark: Your eval job has completed with return code 0.
60318.57894892403j
Is this what was wanted?
 coral kindle
Hello everyone. Can pandoc farm informations from a pdf to be readable for a Python program?
serene scaffold
Remember not to do star imports, as they make it hard to tell where items are coming from. it's a standard to do import numpy as np @uncut monolith
serene scaffold
coral kindle
Hello everyone. Can pandoc farm informations from a pdf to be readable for a Pyt...
doesn't pandoc convert latex to txt?
coral kindle
serene scaffold
doesn't pandoc convert latex to txt?
Yeah but I was wondering if it can do the opposite. Because I'm trying to extract text, images, equations and tables from a document
serene scaffold
coral kindle
Yeah but I was wondering if it can do the opposite. Because I'm trying to extrac...
What kind of text are you trying to extract?
coral kindle
Something like that
I'd like to convert the whole thing in an HTML document using only Python
Because most journals don't have easy HTML access
serene scaffold
@coral kindle this paper was probably composed in latex. But what kind of text are you trying to extract?
just, all of it?
coral kindle
All of it so I can identify the topics
serene scaffold
coral kindle
All of it so I can identify the topics
if you just want the text whole content, your guess as to what library to use is as good as mine. I might be able to help if you're trying to do nlp on it, though.
coral kindle
And doing it from scratch is even more tiresome. Whenever I'm trying to extract informations, sometimes the trailer isn't here, sometimes it's here but with \x00 like characters, I'm not sure what they are for or how to translate them.
I assumed it's hexadecimal, but some are formulated like that \x08bc
 heavy mica
Hello there. I'm trying to send a request to https://www.sahibinden.com/ using the requests library, but no results. When I use another link instead of this link, the result comes. What could be the reason.
cedar sun
do u know any paper with different architecture models for image classification?
cedar sun
grave frost
just make your own
what layers should i have?
btw, i have increased my dataset from 100~ to 300~
will it help?
 flint mason
randperm() received an invalid combination of arguments - got (float, generator=torch._C.Generator), but expected one of:
 * (int n, *, torch.Generator generator, Tensor out, torch.dtype dtype, torch.layout layout, torch.device device, bool pin_memory, bool requires_grad)
 * (int n, *, Tensor out, torch.dtype dtype, torch.layout layout, torch.device device, bool pin_memory, bool requires_grad)
Anyone know how to resolve this error
I am using pytorch
autumn basin
Well It looks like it's saying you fed it a float and it was looking for an int?
 dim swift
Hi...I need a help..I need to Detect particles of size less than 5mm and get a single (x,y) coordinate of each particle.That is if there are 14 particles then I need 14 coordinates using python
autumn basin
What does your data look like?
grave frost
cedar sun
what layers should i have?
are you new to DL?
I recommend you learn the basics first before diving into projects
cedar sun
No, but idk the layers i should use :)
cedar sun
grave frost
I recommend you learn the basics first before diving into projects
The basics like the h5 format u told me the other day? Stop being rude :)
 bold timber
Hi everyone, I have a question, what is model selection?
bold timber
Why I get the problem like this when I want to save file?
 grave frost
bold timber
Why I get the problem like this when I want to save file?
grave frost
bold timber
Why I get the problem like this when I want to save file?
most prob you ran out of disk space
bold timber
grave frost
most prob you ran out of disk space
My ram is 16gb and i has remaining memory until 600gb
autumn basin
Can you manually save the notebook?
bold timber
what's actually happened?
bold timber
autumn basin
Can you manually save the notebook?
No
autumn basin
And that's the error you get?
grave frost
bold timber
My ram is 16gb and i has remaining memory until 600gb
that's what my problem was 🤔
bold timber
autumn basin
And that's the error you get?
yes
grave frost
oh, I meant disk space - check where jupyter is stored
bold timber
when i work with my notebook that statement appears
bold timber
grave frost
oh, I meant disk space - check where jupyter is stored
my notebook stored in disk D
drive D
grave frost
is it empty?
grave frost
bold timber
remaining 600gb
could you save it before?
bold timber
grave frost
could you save it before?
yes, but when I continue to working on notebook, that statement still appears
grave frost
bold timber
my notebook stored in disk D
cool, as long as any other partition doesn't have less space
grave frost
bold timber
yes, but when I continue to working on notebook, that statement still appears
and you can't manually save, right?
bold timber
when i close my notebook it's doesn't save my file
grave frost
when I had the same problem, I discoverd I accidentally deleted an important file
bold timber
grave frost
and you can't manually save, right?
been several times
grave frost
dunno what's the problem with yours tho. try making a new NB somewhere else and see if it saves
bold timber
this happens is often
When I try to create a new file this is happened

What should I do?
I no have idea
grave frost
NO such file or directory
you prob made the same mistake as me - either deleted some folder, or changed the name of the root folder or smthing like that
happens to all of us buddy
bold timber
grave frost
you prob made the same mistake as me - either deleted some folder, or changed th...
I had try like this and still happening
I create a name so short name
and it's work
but, when I try change to long name, it's doesn't work. why?
 ornate gate
Hey! I do some project now (with pandas and matplotlib) and it's a bit harder to anaylise the dataset without tasks.. and i'm thinking after i will get a job as data analysis, the manager will give me the tasks to analise a dataset or do i need to ask myself some good questions to analyse the data? Thanks!
fervent zenith
how do i add year i.e.[02-Jul-2000] in something like this
it contains month from 2000-2020
 desert oar
Modular arithmetic
Split on the dash, map month to 1-12, "roll over" when you get past next January
I don't recommend doing it in Excel
desert oar
not sure if there's an efficient way to do it in pandas though
velvet thorn
desert oar
not sure if there's an efficient way to do it in pandas though
that looks like a formatting issue tbh
like the date is actually already stored
 velvet thorn
post code as codeblocks
desert oar
you never know with excel, it might have been a formatting issue which was then copied and pasted to be the wrong format
velvet thorn
pictures are hard to read @fervent zenith
desert oar
but yeah if the data is from an API it's probably just excel making it look like it's missing data
fervent zenith
for k in range(2000,2021):
get_tables.append(pd.read_html(f'https://en.wikipedia.org/wiki/List_of_terrorist_incidents_in_{k}',attrs={'class':'wikitable'}))```https://support.microsoft.com/en-us/office/format-a-date-the-way-you-want-8e10019e-d5d8-47a1-ba95-db95123d273e#ID0EAACAAA=Windows @fervent zenith

If you don’t like the default date format, you can pick a different one in Excel, like February 2, 2012 or 2/2/12. You can also create your own custom format in Excel.
velvet thorn
well
in that case
you already know the year for sure
I'm not sure how smart read_html is (I'd assume Wiki uses semantic HTML with the time element), but in any case you'd be able to add the year to the date before combining everything
fervent zenith
in excel editing the data somehow gives weird value
velvet thorn
a quick inspection reveals that it does not, in fact, use <time>
cedar sun
hi salt, i increased my data to 300~ per pokemon. Will this help?
cedar sun
okey
one last thing
if i have a model
how can i remove its last layer
and add mine?
lets say
from tf.keras.models import load_model

model = load_model('my_model.h5')```hey i manage to join date and year
df['NewDate'] = df.Year.astype(str).str.cat(df.Date.astype(str),sep='-')
the result is like this
 serene scaffold
fervent zenith
hey i manage to join date and year
serene scaffold
fervent zenith
hey i manage to join date and year
Can you run print(df.head().to_csv()) for me and copy/paste the result here?
cedar sun
can i somehow start training a model with big learning rate and reduce it gradually?
desert oar
yes, i think that's a known technique
https://www.pyimagesearch.com/2019/07/22/keras-learning-rate-schedules-and-decay/ found this example
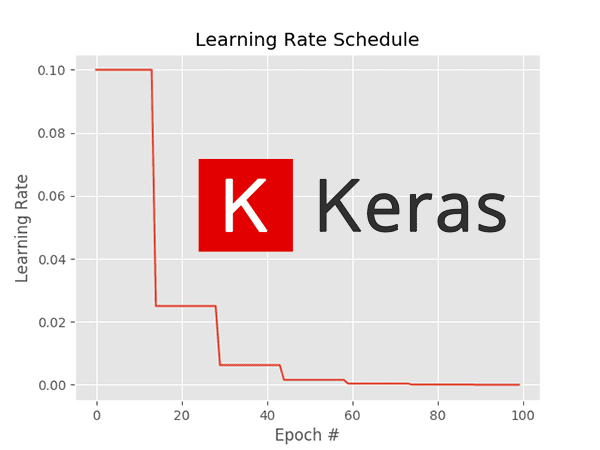
In this tutorial, you will learn about learning rate schedules and decay using Keras. You’ll learn how to use Keras’ standard learning rate decay along with step-based, linear, and polynomial learning rate schedules.
https://keras.io/api/optimizers/learning_rate_schedules/exponential_decay/ there are existing learning rate schedules you can use
 cedar sun
and what are steps?
epochs?
also... if i preload a model, what will be its optimizer?
do i have to compile a model after loading it?
load_model automatically compiles the model with the optimizer that was saved along with the model)
huh
from this

what are steps?
the 3200?
exotic maple
cedar sun
epochs?
epochs is how many times you are training the model, so to speak. Fine-tuning it internally, etc
cedar sun
yeah, but
initial_learning_rate = 0.1
lr_schedule = tf.keras.optimizers.schedules.ExponentialDecay(
    initial_learning_rate,
    decay_steps=100000,
    decay_rate=0.96,
    staircase=True)

model.compile(optimizer=tf.keras.optimizers.SGD(learning_rate=lr_schedule),loss='sparse_categorical_crossentropy', metrics='accuracy'])```what are steps here?
why 100k?
 tidal bough
I'd assume it's using something like stochastic- oh, it literally says SGD in your snippet, so yes - and counting batches
 granite arch
Hey guys, I am looking to create a data set for a simple sequential model that converts a 1,4 array to output - 0, 1. All the data sets are pre-loaded and manufactured sets. I just want to create like 30 arrays example: [1,1,1,4] [1], [1,0,0,1][0], etc -> 30 examples. There are no resources for creating custom training and test sets and what format to use. Do you have any suggestions? For images I know I can just create train and test folders. Sorry this is for keras, tensor flow
cedar sun
tidal bough
I'd assume it's using something like stochastic- oh, it literally says SGD in yo...
sorry idk what u mean :c
 zenith sun
Hello, I have a question does anyone know if there is any library or tool that automates punctuation placement in python? I found some stuff but it theoretical so any suggestions or ideas?
tidal bough
cedar sun
sorry idk what u mean :c
The idea of SGD is that instead of calculating the gradient properly (averaging over all example in the dataset), you split the dataset in many batches and for each batch, do a gradient descent step.
that's way faster and in practice not that inaccurate
granite arch
granite arch
Hey guys, I am looking to create a data set for a simple sequential model that c...
If I just have raw array values how can I convert them to a readable train/test data format for kera/tensorflow is my question I suppose. \
tidal bough
so that's the "steps" it's counting each epoch, probably
tidal bough
granite arch
If I just have raw array values how can I convert them to a readable train/test ...
The input for a TF model is just a single array of inputs and a single array of target outputs, Keras can probably work about the same
so you just need to concatenate all of your examples
granite arch
Can I use a csv where one line reads as [1,1,1,4][0]
[0] being the desired training output
I find this to be harder than setting the model up and training it
@tidal bough
cedar sun
tidal bough
that's way faster and in practice not that inaccurate
wow. I am using adam
tidal bough
granite arch
Can I use a csv where one line reads as [1,1,1,4][0]
[0] being the desired trai...
Well, what you wrote isn't a CSV 😛
CSV means comma-separated values; each line must be a bunch of values separated by commas, like 1,1,1,4,0
but yeah, it's a valid format to use.
granite arch
Ah but how will it know the 0 is the training output
cedar sun
so, first of all, may i use SGD too if i have many images and classes?
cedar sun
and if not, if i should stay with adam, how many decay_steps may i use?
granite arch
I am creating intuitive examples to test the model then will get data at a later time
I think I can follow this @tidal bough

TensorFlow
Thank you for your help
tidal bough
cedar sun
and if not, if i should stay with adam, how many decay_steps may i use?
I don't know what good parameters for it would be, but generally Adam is a way more advanced optimizer than SGD. Like, according to https://medium.com/mdr-inc/from-sgd-to-adam-c9fce513c4bb, it took 3 big steps to develop Adam from SGD.
tidal bough
granite arch
I am creating intuitive examples to test the model then will get data at a later...
if you're creating them manually, why not write them straight in code?
granite arch
Well I am just not sure how to write them and what format
tidal bough
like, just as a numpy array for example:
dataset = np.array([
  [1,1,1,4,1],
  [1,0,0,1,0],
  #...
])
inputs = dataset[:,:-1] #all columns except the last one
outputs = dateset[:,-1] #last column
Thank you, that is very helpful. So the last value is the desired output?
So helpful thank you
cedar sun
@tidal bough can u pls write how would u remove last layer from a model?
tidal bough
I don't know myself, but googling remove layer from sequential gave me https://stackoverflow.com/questions/41668813/how-to-add-and-remove-new-layers-in-keras-after-loading-weights
 steel hill
Hey, would anyone know of a good method of creating a normal curve with data from a csv file? Many of the methods I have found online feature deprecated methods, thanks in advanced!
exotic maple
steel hill
Hey, would anyone know of a good method of creating a normal curve with data fro...
you mean fit your data yo a standard normal curve?
exotic maple
you can always use standard scaler from sklearn
be aware, it does NOT apply any fix to data with outliers thou
so if your data has outliers or is heavily skewed...you need other transformations first
tidal bough
doesn't fitting a normal distribution to a dataset just consist of calculating the mean and std?
exotic maple
tidal bough
doesn't fitting a normal distribution to a dataset just consist of calculating t...
yup
x - miu / std
tidal bough
that can be done manually, or with statistics, or with numpy's mean and std
exotic maple
I assumed he didnt want to do it by hand lol
but it should be kinda trivial
df["column"].mean() df["column"].std()
and then df["new_col"] = ((df["col"] - mean) / std)
now i'm wondering if that would be a vectorized operation or if you'd have to go the apply route...mmm
desert oar
@exotic maple - and / are vectorized, that would work as-written (you can drop the outer ()s too)
granite arch
Why is my model returning a [4,] array when I am setting last layer activation for [0,1]? I am passing [4,] array to return 0 or 1 value for the whole array passed in:
`
norm_abalone_model = tf.keras.Sequential([
normalize,
layers.Dense(64),
layers.Dense(1, activation='sigmoid'),
])
norm_abalone_model.summary()`
exotic maple
desert oar
<@!263491859173736449> `-` and `/` are vectorized, that would work as-written (y...
but but...dont you like seeing unnecessary parenthesis just in case 😦
granite arch
It is taking each number in the array and return activation from 0 to 1
I am trying to do binary classification
desert oar
@granite arch show how you defined normalize
granite arch
normalize = preprocessing.Normalization()
do I need to use binary_crossentropyloss as the loss function
desert oar
what's the size of the input?
can you just show more of your code? don't make people guess
granite arch
Yes thank you
abalone_features = np.array(abalone_features)
abalone_features
array([[20, 1, 1, 1],
[23, 1, 1, 1],
[15, 1, 1, 1],
[ 5, 0, 0, 0],
[22, 1, 1, 1],
[12, 0, 0, 0],
[15, 0, 0, 0],
[12, 1, 1, 1],
[ 5, 1, 1, 0],
abalone_model = tf.keras.Sequential([
layers.Dense(64),
layers.Dense(1)
])
abalone_model.compile(loss = tf.losses.MeanSquaredError(),
optimizer = tf.optimizers.Adam())
abalone_model.fit(abalone_features, abalone_labels, epochs=6)
Epoch 1/6
2/2 [==============================] - 0s 1ms/step - loss: 5.8034
Epoch 2/6
2/2 [==============================] - 0s 1ms/step - loss: 2.4094
Epoch 3/6
2/2 [==============================] - 0s 1ms/step - loss: 0.7737
Epoch 4/6
2/2 [==============================] - 0s 2ms/step - loss: 0.2398
Epoch 5/6
2/2 [==============================] - 0s 1ms/step - loss: 0.5344
Epoch 6/6
2/2 [==============================] - 0s 890us/step - loss: 0.9541
<tensorflow.python.keras.callbacks.History at 0x7f1d7079c460>
normalize = preprocessing.Normalization()
normalize.adapt(abalone_features)
norm_abalone_model = tf.keras.Sequential([
normalize,
layers.Dense(64),
layers.Dense(1, activation='sigmoid'),
])
norm_abalone_model.summary()
Model: "sequential_23"
Layer (type) Output Shape Param #
normalization_2 (Normalizati (None, 4) 9
dense_27 (Dense) (None, 64) 320
dense_28 (Dense) (None, 1) 65
Total params: 394
Trainable params: 385
Non-trainable params: 9
norm_abalone_model.compile(loss = tf.losses.MeanSquaredError(),
optimizer = tf.optimizers.Adam())
norm_abalone_model.fit(abalone_features, abalone_labels, epochs=10)
Epoch 1/10
2/2 [==============================] - 0s 888us/step - loss: 0.3959
Epoch 2/10
2/2 [==============================] - 0s 1ms/step - loss: 0.3742
Epoch 3/10
2/2 [==============================] - 0s 1ms/step - loss: 0.3533
Epoch 4/10
2/2 [==============================] - 0s 1ms/step - loss: 0.3337
Epoch 5/10
2/2 [==============================] - 0s 1ms/step - loss: 0.3167
Epoch 6/10
2/2 [==============================] - 0s 1ms/step - loss: 0.2998
Epoch 7/10
2/2 [==============================] - 0s 1ms/step - loss: 0.2841
Epoch 8/10
2/2 [==============================] - 0s 1ms/step - loss: 0.2694
Epoch 9/10
2/2 [==============================] - 0s 1ms/step - loss: 0.2554
Epoch 10/10
2/2 [==============================] - 0s 1ms/step - loss: 0.2430
<tensorflow.python.keras.callbacks.History at 0x7f1d8c0ef0d0>
try_this = np.array([33,1,1,0])
print(np.shape(try_this))
array([[1. ],
[0.544],
[0.544],
[0.118]], dtype=float32)
I am trying to return a 1 or 0 based on the [4,] array passed in
abalone_labels = 0 or 1 popped from dataframe
But instead its sigmoiding values in [4,] array
@desert oar
velvet thorn
tidal bough
doesn't fitting a normal distribution to a dataset just consist of calculating t...
no…
that is not true
…if I understand what you’re saying correctly, of course
 opaque estuary
I have an assignment that I need to submit within 12 hrs..
Have a small data set (around 1400 rows).
Need to find missing values as well fix as well as find incorrect data.
I can come on screenshare. Just need an idea on how to approach the problem.
Please lemme know if someone is willing to spend an hour or so. Shouldn't take longer then that
narrow dagger
Hello @opaque estuary, I can help you with your assignment
opaque estuary
@narrow dagger I have pm'ed you, pls see to it whenever you have time.
 dire echo
im gonna try to make a infection simulation it will work like this
A = normal people
B = infected People
C = doctor/people who cure
(A - B) + C =
AB + C =
ABC
↑ result
But the number of C cure is limited as much as early A amount and only have 50% change of cured skmeone
tidal bronze
how can you generate all possible row combination based on keys columns in pandas
with the twist that some column will have pre-assigned values while others will be just 0
more details at #help-bread
 azure locust
Does anyone about possibility of applying few-shot learning on BERT for sentence similarity?
 hard hound
azure locust
Does anyone about possibility of applying few-shot learning on BERT for sentence...
hard hound
azure locust
Does anyone about possibility of applying few-shot learning on BERT for sentence...
hey i just started with BERT wanna give any tip?
Anyone working on Natural Language Processing here?
serene scaffold
hard hound
Anyone working on Natural Language Processing here?
Yes.
 crisp wing
Anyone know how to perform dask svd on large matrices here? I do,
# import dask.array as dar
X_da = dar.from_array(X_no_missing, chunks=(chunk_size_t, N_spat))
U, s, V = dar.linalg.svd(X_da)
# .compute() operations would follow
I thought truncating U and V after .svd() could fix the issue.
But when I try to compute them I get an memory error, which seems to stem from the svd operation itself.
...
File "...\Python37\lib\site-packages\numpy\linalg\linalg.py", line 1660, in svd
    u, s, vh = gufunc(a, signature=signature, extobj=extobj)
numpy.core._exceptions._ArrayMemoryError: Unable to allocate 217. GiB for an array with shape (170586, 170586) and data type float64
hey @serene scaffold any tips ?
serene scaffold
hard hound
hey <@!253696366952316929> any tips ?
what are you trying to do?
hard hound
I just participated in the kaggle challenge So i am just reading paper and blogs about it right now
I am new to NLP
serene scaffold
hard hound
I am new to NLP
I'm not sure what this stands for. If you have a specific problem you'd like to solve, let me know and I'll see if I can contribute.
hard hound
grave frost
kaggle = Cancer
why??
grave frost
hard hound
why??
eh, it's just personal opinion that most top kagglers have a fuckton of GPUs that gets them the top prize, rather than their skill - in some comps, we do see what kind of amazing ideas they have but most times I just see then using models that we can't run on kaggle kernels
hard hound
@grave frost i felt that to for computer vision datasets which are just huge but Its good for learning some new stuff Have you tried aws free tier?
grave frost
hard hound
<@!738058085083381760> i felt that to for computer vision datasets which are ju...
I don't have a credit card, nor the money
hard hound
oh i was just asking cause I was going to try it
they give about 3.2 million processing seconds for free
each month
hard hound
its in their ml section
grave frost
link?
hard hound
wait a sec

Amazon Web Services, Inc.
Amazon Web Services offers reliable, scalable, and inexpensive cloud computing services. Free to join, pay only for what you use.
That ec2 stuff is for virtul machines
 tiny venture
is there any chance that someone could help me about my statistics homework with normal distributions on python? 😊
there are some stuff that I don't understand
coral kindle
ANybody tried to scrap Google Scholar?
I got that annoying captcha after a few attempts
 trail ledge
Trying to speed this code up: https://codeshare.io/5QPxyw
It's basically cutting out a region of interest in originally a mss screenshot and appending these slices together into a new image. But it's too slow, and I'm too much of a beginner to understand exactly why. Maybe there's something with how numpy appends arrays and grows them larger.
hard hound
tiny venture
there are some stuff that I don't understand
ask it away we will try
tiny venture
hard hound
ask it away we will try
but there is a dataset file that I should share
arctic wedgeBOT
Hey @tiny venture!
It looks like you tried to attach file type(s) that we do not allow (.csv). We currently allow the following file types: .gif, .jpg, .jpeg, .mov, .mp4, .mpg, .png, .mp3, .wav, .ogg, .webm, .webp, .flac, .m4a.
Feel free to ask in #community-meta if you think this is a mistake.
desert oar
@granite arch thanks for sharing. in the future, it's better to share the code in a format that's easier to read, e.g. https://paste.pythondiscord.org. generally, the best thing to do is a "minimal reproducible example" - something that a helper can copy and paste and then run from top to bottom, in order to see the same incorrect output that you saw.

Stack Overflow
Stack Overflow | The World’s Largest Online Community for Developers
granite arch
Thank you @desert oar I will upload later
desert oar
if you're using google colab, it's also easy to share the colab notebook as read-only
granite arch
Just trying to turn 4,1 array into 2,1 output [0,1]
Or [1,0]
Maybe I need to change my final layer
grave frost
hard hound
That ec2 stuff is for virtul machines
how else would you train models?
cedar sun
ofc u do
cedar sun
granite arch
Maybe I need to change my final layer
ur input layer should be of shape 4
and output layer shape 2
 uncut wharf
guys i had a project idea i wonder if it would work
a program that can read graffiti
tidal bronze
if you are a true pandas samourai you can try to help me over at #help-lemon
but only if tyou feel you are up to the challenge
tidal bronze
join what?
hard hound
The help section
tidal bronze
of course ahah why would you ask
lapis sequoia
Hello, could somebody help me and tell what is the best way to create a model to selecting units for treatment/campaign? I have results from experimental treatment, but no idea how to separate persuadable units from this data. Every unit has important independent features of different types (categorical, numerical). An additional assumption is that the model should be based on sklearn library.
tidal bronze
tidal bronze
if you are a true pandas samourai you can try to help me over at <#7761846619024...
but I totally understand if you feel scared about it, no judgement from my side 🙂
not everyone is up for this 🙂
then I would kindly ask you to let the real coders help :p
this is not for everyone afterall 🙂
 serene plume
If anyone's played with spaCy v3, please take a look at this question https://github.com/explosion/spaCy/discussions/8270 (please ping me if you reply)
 cobalt hearth
i'm making a dataset for my chatbot model soo to make it look natural i would want to have it a chat with someone anybody have some time to have a quick convo on my dms then i will convert the messages and use them for the model tia
serene scaffold
I have two dataframes like this
                 precision  recall     f1
fold tag
0    CellLine        0.900   0.529  0.667
     GroupName       0.781   0.717  0.748
     GroupSize       0.908   0.736  0.813
     SampleSize      0.000   0.000  0.000
     Sex             0.891   0.864  0.877
     Species         0.874   0.941  0.906
     Strain          0.964   0.783  0.864
1    CellLine        0.733   0.688  0.710
     GroupName       0.849   0.730  0.785
     GroupSize       0.793   0.768  0.781
     SampleSize      1.000   0.056  0.105
     Sex             0.971   0.904  0.936
     Species         0.884   0.970  0.925
     Strain          0.877   0.682  0.767
with ten folds. And I want to convert them to arrays and reshape them such that I can pass them to scipy.stats.ttest_ind. I think the resulting arrays should have a shape of (3, 7, 10), but when I do that for this frame, the first inner vector is [0.9 , 0.529, 0.667, 0.781, 0.717, 0.748, 0.908, 0.736, 0.813, 0. ] and not [0.9, .733, ...]. I'm not sure what the right transformation is.
grave frost
hard hound
<@738058085083381760> there's a dedicated section for ml
what section?
desert oar
@serene scaffold ```python
folds = [
fold_data.to_numpy()[:, :, None]
for _, fold_data
in df.groupby(level='fold')
]
np.concatenate(folds, axis=2)
does this work?np.concatenate([fold_data.to_numpy()[:, :, None] for _, fold_data in a.groupby(level='fold')], axis=2)
need it to be one statement for the repl. one sec.
serene scaffold
desert oar
<@!253696366952316929> ```python
folds = [
fold_data.to_numpy()[:, :, None]
...
I think we're on the right track--is this the shape you expected? https://paste.pythondiscord.com/oyawusicah.yaml
desert oar
is that (3, 7, 10)?
serene scaffold
this is what I thought (7, 3, 10) would look like
serene scaffold
interesting as this is, I've decided to be more verbose to make sure I trust the results
desert oar
folds = [
    fold_data.to_numpy().T[:, :, None]
    for _, fold_data
    in df.groupby(level='fold')
]

np.concatenate(folds, axis=2)
fold_data.to_numpy().T is (3,7). fold_data.to_numpy().T[:, :, None] is (3, 7, 1)
then you concatenate on axis=2 i.e. the 3rd axis
to get (3,7,10)
 graceful elk
I have a tensorflow model created like this: ```py
X = trainDf.iloc[:, 0:13].values
y = trainDf.iloc[:, 13].values
X_train, X_test, y_train, y_test = train_test_split(X, y, test_size=0.2, random_state=0)
sc = StandardScaler()
X_train = sc.fit_transform(X_train)
X_test = sc.transform(X_test)
input_layer = Input(shape=(X.shape[1],))
dense_layer_1 = Dense(100, activation='relu')(input_layer)
dense_layer_2 = Dense(50, activation='relu')(dense_layer_1)
dense_layer_3 = Dense(25, activation='relu')(dense_layer_2)
output = Dense(1)(dense_layer_3)
model = Model(inputs=input_layer, outputs=output)
model.compile(loss="mean_squared_error" , optimizer="adam", metrics=["mean_squared_error"])
 left burrow
Hey guys is anyone working on https://ironhacks.com ? I have a question about the cohorts.. I can't view other people's notebooks? I've been querying from BigQuery and haven't made any progress since Idk what my teammates are doing? Just want that prize money lol all help appreciated

Hack for innovation to solve global challenges
 late shell
Hello, I'm studying about logistic regression, I studied about the maths that goes on behind, maximum likelihood estimation, logit etc .and just when I thought I had studied enough and moved on to the implementation, I was overwhelmed by the arguments of sklearn.linear_model.LogisticRegression class. These arguments such as penalty, dual, tol, C, class_weight, solver, max_iter, multi_class, warm_start, etc. were never mentioned in the the videos and articles I studied from. I read the documentation and it doesn't make any sense to me at all. I've been studying the simple plain old vanilla Logistic Regression, but ig sklearn has implemented some regularized logistic regression. I'm a beginner at ML and I don't know what regularization means/works. Can someone please help me understand these arguments so that I can implement a basic logistic regression model for the time being?
grave frost
Can someone please help me understand these arguments so that I can implement a basic logistic regression model for the time being?
their defaults are fine for most use cases
 misty torrent
@late shell just use default settings kek
desert oar
@late shell most of these are configurations for the solver. they aren't related to the model itself for the most part
grave frost
Anyone have any ideas where I might store 40Gb+ datasets
desert oar
@grave frost amazon s3, backblaze b2, azure blob store
grave frost
desert oar
<@!738058085083381760> amazon s3, backblaze b2, azure blob store
I mean unpaid
desert oar
nobody is going to give you 40 gb of free storage
unless you have an external hard drive 🤷♂️
grave frost
desert oar
nobody is going to give you 40 gb of free storage
ikr - that's why I was asking
grave frost
desert oar
unless you have an external hard drive 🤷♂️
I do- but I cant upload to colab daily
desert oar
i think it's safe to assume that what you are asking for doesn't exist
grave frost
aight - does anyone know any fast way to read an audio file and downsample at the same time (like librosa)?
scipy wavefile is one - but the downsampling op would add quite a lot of overhead
better than librosa ig - but maybe smthing more faster?
late shell
desert oar
<@!594900402634227752> most of these are configurations for the solver. they are...
what does a solver do?
I just read that a solver 'tries to find the parameter weights that minimize a cost function', but aren't the parameters found by maximum likelihood estimation?
 short heart
Would it not matter if I set high LR for model with LR reduce on plateau?
desert oar
late shell
I just read that a solver 'tries to find the parameter weights that minimize a c...
maximum likelihood is what we use to set up the optimization problem. that is, we set up min f(x) where f(x) is the negative log-likelihood of the model. but then we typically need a numerical solver to actually solve the optimization problem, which doesn't necessarily have a closed-form solution.
examples of numerical solvers: newton's method aka newton-raphson (sometimes called "iteratively reweighted least squares" when applied to generalized linear models), batch/stochastic gradient descent, coordinate descent, l-bfgs, et alia
late shell
hmmm, the amount of information to understand something in Data Science is over whelming. I spent a week understanding logistic regresssion, and there's so much I still don't know about 😞 . How long have you been investing your time in ML/Data Science @desert oar ? Do you mind sharing with me how and where do you study from. Thanks.
desert oar
my undergrad degree was in economics, math, and statistics, and i have a masters degree in a related field. i also was a professional data scientist for 5 years, and spent many hundreds of hours and many late nights studying, reading, experimenting, etc.
it's a long journey, and i still feel like i don't know as much as i should or could
no rush, one thing at a time
but this is why i highly recommend structured, academic education if you are serious about data science
there's so much to know, it'd be a truly massive effort trying to guide yourself through all this
i am a big proponent of the idea that not everyone needs to go to college, but a good university curriculum is hard to replace with something else
you can get pretty far on your own, of course. but it might take longer, and it might be harder work.
if you're the kind of person who has the discipline and focus to work up to this level from nothing, i envy you immensely
 iron basalt
The non-university route is like trying to become a business owner while the university route is like being an employee. The fundamental difference is that with the former, nothing happens unless you make it happen, while with the latter the path sort of ticks on forward with or without you (someone else is the driver). Many people are not prepared for that realization of needing to be the driving force.
It's a different mindset. You need to be the one that structures, rather than following someone else's structure (you can base your structure on someone else's, but you still need to implement it yourself).
desert oar
that's an interesting analogy
iron basalt
Its open-ended nature (Which structure do I choose? What do I do?) can make it very scary and anxiety inducing on its own. There is no diploma at the end, or some other guaranteed thing (it can (and often does) end in failure).
cedar sun
do u know any video explaining what the different layers do?
grave frost
kind of an open-ended question - is it possible at all for a minor to research/collaborate with an academic insititution for pusblishing any paper?
iron basalt
cedar sun
do u know any video explaining what the different layers do?
All of them? Idk, but https://www.youtube.com/watch?v=oJNHXPs0XDk

This video describes the variety of neural network architectures available to solve various problems in science ad engineering. Examples include convolutional neural networks (CNNs), recurrent neural networks (RNNs), and autoencoders.
Book website: http://databookuw.com/
Steve Brunton's website: eigensteve.com
Follow updates on Twitter @eig...
grave frost
and is it possible with a private research group or corporate division (like Google Brain)?
iron basalt
grave frost
and is it possible with a private research group or corporate division (like Goo...
Yes, see deep mind.
grave frost
no, is it possible at all for a minor to research/collaborate with such an organization?
iron basalt
Internship?
grave frost
iron basalt
Internship?
no, like colloboration on a research paper
iron basalt
Probably not.
If one tries hard enough it could happen, I could imagine a minor being really into ML and some company stumbling upon their reddit posts and such.
And citing them.
grave frost
hmm.....
iron basalt
But companies are often missing citations when they are reinventing something some did years ago and those people are adults, so idk.
Basically if you are not citing people like Schmidhuber, you are probably missing a citation (this is only partially a joke).
grave frost
what's with schmidhuber and people saying he "did something similar 30 years ago"
iron basalt
Well, he often did...
grave frost
like any new idea is attributed to him researching it before
iron basalt
The meme is that he is under-cited.
 soft plover
Anyone familiar with using keras with tf.data.Datasets to train/evaluate models?
grave frost
iron basalt
The meme is that he is under-cited.
what did he do lol?
iron basalt
What did he not do (XD)?
grave frost
wait, did he make RNN's?
iron basalt
Umm I need to check again, but def LSTM
grave frost
I thought karpathy was the pioneer in RNN's
soft plover
grave frost
what did he do lol?
I've only heard of him in that presentation by the guy who made GANs and them arguing lol
iron basalt
Schmidhuber is not the earliest (in ANNs), but a very important inventor in the stuff shortly after / more recent-ish.
iron basalt
Yeah it's a lot, even stuff like world models and all that
grave frost
god damn, even music generation
iron basalt
some reinforcement learning stuff
grave frost
da fuk can someone have so many ideas https://scholar.google.com/citations?user=gLnCTgIAAAAJ&hl=en

The Swiss AI Lab IDSIA / USI & SUPSI - Cited by 129,946 - computer science - artificial intelligence - reinforcement learning - neural networks - physics
iron basalt
A lot of my work is very connected to his (even if I don't know it yet)
iron basalt
Formal papers are for people with time, don't got that kind of time when you are making inventions left and right.
grave frost
figures. he seems like a kind of genius
iron basalt
If you follow his history and what he is saying, you can kind of predict his next thing, it's just a constant process of seeing what the current problem with the current idea is and fixing it (by allowing yourself to try something very different rather than just tweaking a bunch like others papers do).
Typically adding an entire other dimension to the solution (I don't mean like making the NN bigger, more like having ANNs that can't handle sequences, vs creating one that can).
It's like a binary upgrade, either it can do it or, or it can't.
grave frost
wow. from what I hear of academia in ML, this guy seems to be in the few that make actual progress
except deepmind/google that is
soft plover
What do people here do with ML? mostly just for fun or work/studying?
grave frost
most people jump into ML for the job market
soft plover
true I ended up doing it to avoid the job market lmao
grave frost
I wouldn't think of it as the best approach to learn anythin tho - ML is not some eden where you will get a job immediately, or be secure in the future
seeing that automation is a strong by-product of AI research anyways
cedar sun
:)
Stack Overflow
When I start training a model, there is no model saved previously. I can use model.compile() safely. I have now saved the model in a h5 file for further training using checkpoint.
Say, I want to t...
Compile defines the loss function, the optimizer and the metrics. That's all.

It has nothing to do with the weights and you can compile a model as many times as you want without causing any problem to pretrained weights. ```if u think
it makes sense lol
imagine u train a model for 5 hours. and u shut down pc
after loading the model, u have to compile it again if u wanna keep training
cedar sun
imagine if weights are set to 0 again lol. 5 hours wasted
misty torrent
Okay I have a question regarding non-machine parseable information / data that is used to define the weight of a value inside a feature
grave frost
velvet thorn
probably
no bro, if you shut down your PC, your weights are lost lol
oopsie, wrong ping
velvet thorn
I'm too sleepy to think straight
grave frost
unless you store it in a file
velvet thorn
y'all sort it out 😪
grave frost
velvet thorn
y'all sort it out 😪
I didn't mean to ping you 🙂
grave frost
misty torrent
Okay I have a question regarding non-machine parseable information / data that i...
non-machine parseable?
I am surprised data like that even exists
serene scaffold
misty torrent
METADATA
that's so meta
misty torrent
but as in, like information we know about the data, but isn't recorded anywhere and is not numerical, god this word is bothering me
not abstract
grave frost
misty torrent
but as in, like information we know about the data, but isn't recorded anywhere ...
metadata on lower levels is fully machine-parseable
grave frost
its when you keep up with the hierarchy, then you need an actual AI
but even we as humans store everything abstractedly
cedar sun
say it on ur language
grave frost
can't expect a machine to do better ¯_(ツ)_/¯
misty torrent
Okay, how do we break down things logically or scientifically, that aren't stored in a format that readily benefits being categorized
cedar sun
encrypted? xD
misty torrent
God damn it
grave frost
misty torrent
Okay, how do we break down things logically or scientifically, that aren't store...
we can - a simple concept via how our brain does it 🙂
misty torrent
Give me 10 minutes to google fu my way to explaining what I mean by first understanding what I'm trying to say and how to say it
grave frost
truth is, our brain processes reference frames. it doesn't have any notion of things work abstractedly. every representation is relative to some pre-existing information
grave frost
like say, what is a banana?
you might first say something of a particular shape
that shape is relative to a set of curved shapes
then yellow is a relative sensation meaning something that's not red,green,blue - basically every color
and so on
misty torrent
No no no no, I'm asking is there a STANDARD of how to break down qualitative data into quantitative data.
misty torrent
I understand how to break it down with monkey head, but did bunch of monkeys decide one way to break it down, and to call it the boogie
misty torrent
what's a standard
grave frost
something followed by a majority...?
misty torrent
so is there a standard on how to break qualitative data into quantitative data
grave frost
misty torrent
so is there a standard on how to break qualitative data into quantitative data
an example of qualitative data?
mostly, we break them down into discrete quantities/categories under a common metric - which becomes a standard
misty torrent
Quantitative data can be counted, measured, and expressed using numbers. Qualitative data is descriptive and conceptual. Qualitative data can be categorized based on traits and characteristics.
grave frost
grave frost
mostly, we break them down into discrete quantities/categories under a common me...
.
lapis sequoia
Pytorch v Tensorflow
Which one do you think is better and why
 sick furnace
forecast = result.forecast
fig = forecast.plot()
fig.update(layout={"title_font_size": 30})
fig.show()
plotly.io.show(fig)result = forecaster.forecast_result
forecast = result.forecast
fig = forecast.plot()
fig.update(layout={"title_font_size": 30})
fig.show()
plotly.io.show(fig)```
I keep trying to run my model and produce the visuals but instead of producing the visuals it produces this:
'layout': {'annotations': [{'arrowhead': 0, 'ax': -60, 'ay': 0, 'showarrow': True, 'text': 'Train End Date', 'x': '2021-05-22', 'xref': 'x', 'y': 0.97, 'yref': 'paper'}], 'legend': {'traceorder': 'reversed'}, 'shapes': [{'line': {'color': 'rgba(100, 100, 100, 0.9)', 'width': 1.0}, 'type': 'line', 'x0': '2021-05-22', 'x1': '2021-05-22', 'xref': 'x', 'y0': 0, 'y1': 1, 'yref': 'paper'}], 'showlegend': True, 'title': {'font': {'size': 30}, 'text': 'Forecast vs Actual'}, 'xaxis': {'title': {'text': 'ts'}}, 'yaxis': {'title': {'text': 'y'}}}}}
(edited)
This is for a greykite model and I thought everything I've added would produce the plot.. Feels like I'm overlooking something simple here noble drum
misty torrent
so is there a standard on how to break qualitative data into quantitative data
noble drum
misty torrent
so is there a standard on how to break qualitative data into quantitative data
There are entire fields of research on how to analyze qualitative data, but one feature of qualitative data is arguably that it can't be broken into quantitative data. 
 devout summit
would this be the right channel to ask an object detection / yolov4 question
When annotating images I'm wondering if anything about the training pictures matter besides the subject that im trying to detect
 worn lynx
What is the best resource to learn about evaluating a ML model? Tutorials seems pretty bad at teaching this part of machine learning. In scikitlearn I can get R2 scores (.score for a regression model) of anywhere from .35 to .75 depending on the random_state I pick. Specifically in this line of code. The 'i' variable is from a loop going from 0 to 42.
x_train, x_test, y_train, y_test = model_selection.train_test_split(X, y, test_size = .20, random_state=i)
Just seems very inconsistent. Here is an example of my output from my testing of which model to use.
"
Random State is 6
0.6283942731257126 Ridge()
0.6387452916868253 LinearRegression(n_jobs=-1)
0.44389242072520474 Lasso()
0.5561862203613057 RandomForestRegressor(n_estimators=120, n_jobs=-1)
Random State is 7
0.3766611593530248 Ridge()
0.35886981688920294 LinearRegression(n_jobs=-1)
0.35288013731838386 Lasso()
0.31158237444240644 RandomForestRegressor(n_estimators=120, n_jobs=-1)
"
hard hound
@worn lynx try using Roc and AUC curves it might help
narrow dagger
@worn lynx also try using confusion matrix
 mint palm
can installing cuda affect my fps in game.....i noticed significant decrease in performance ....nothing change other then just cuda and cdnn
narrow dagger
@mint palm it should not if you are not running a code that takes lots of RAM to run, such as training a DNN on lots of data
 green linden
hey guys, i have a dataframe like this in the attached screenshot. I'm looking to clean it up it up in a way such that i'll only have something like:
town    flat_type    month    min    max     mean
ashford 2 room       2018     0      1000    500
Basically instead of having multiple rows for 2018 for '2 ROOM', I only intend to have one row.
 velvet thorn
green linden
hey guys, i have a dataframe like this in the attached screenshot. I'm looking t...
velvet thorn
green linden
hey guys, i have a dataframe like this in the attached screenshot. I'm looking t...
look into groupby
that would be a good start
green linden
i probably groupbyed the wrong headers 🤔 which is why ive been chasing circles
ill experiment again. thanks
 uncut barn
Just wondering how does python label which data points are outliers?

is its using this?
 lapis sequoia
is there any great library which works nicely with sets?
I have a lot of operations related to union, intersections and all and i need to make lattices and all. So can anyone suggest nice libraries which make these things easier?
Or should i just start with making my own classes and methods?
(I do know that python does have nice methods like union, intersection, issuperset, issubset and etc) but again if there are prebuild classes for lattices in which i can pass on set and my own binary operation it will help a lot.
(please ping me in case you answer, thanks a lot in advance)
short heart
Would it not matter if I set high LR for model with LR reduce on plateau?
 jade carbon
high LR?
better standard LR and best optimizer choice
jade carbon
mint palm
can installing cuda affect my fps in game.....i noticed significant decrease in ...
Does it really affect FPS rate?
y never face this before
tidal bough
uncut barn
Just wondering how does python label which data points are outliers?
"python" doesn't do such a thing. What library are you using?
uncut barn
@tidal bough matplotlib
late shell
desert oar
there's so much to know, it'd be a truly massive effort trying to guide yourself...
Exactly, that is why I think it'd be nice if I had a personal mentor in Data Science, but I guess there are no such mentors available. You're on your own. I'm a sophomore and my major is Electrical and Electronics engineering. As you said, I have no other option than to learn whatever I can in an unordered fashion. I hope I make it after college. Thank you very much for sharing @desert oar
late shell
iron basalt
It's a different mindset. You need to be the one that structures, rather than fo...
True 💯
tidal bough
uncut barn
<@!266216750876459008> matplotlib
https://matplotlib.org/stable/api/_as_gen/matplotlib.pyplot.boxplot.html
whis:float or (float, float), default: 1.5
The position of the whiskers.

If a float, the lower whisker is at the lowest datum above `Q1 - whis*(Q3-Q1)`, and the upper whisker at the highest datum below `Q3 + whis*(Q3-Q1)`, where Q1 and Q3 are the first and third quartiles. The default value of whis = 1.5 corresponds to Tukey's original definition of boxplots.

If a pair of floats, they indicate the percentiles at which to draw the whiskers (e.g., (5, 95)). In particular, setting this to (0, 100) results in whiskers covering the whole range of the data.

In the edge case where Q1 == Q3, whis is automatically set to (0, 100) (cover the whole range of the data) if autorange is True.

Beyond the whiskers, data are considered outliers and are plotted as individual points.
that seems to be what you're asking
uncut barn
yh was wondering if it used this condition and if the value of the whis was 1.5
lapis sequoia
anybody has experience with folium?
I am trying to create an animation. I plot a GPS point on folium map and then I try to convert it to a png file and save it. My idea is to plot and immediately convert the map to a png file. Later, I can just combine the png files to get a video
        loc_json = json.load(open(os.path.join(args['imgs_loc'], 'location_data', loc_file), 'r+'))
        folium.CircleMarker((float(loc_json['latitude']), float(loc_json['longitude'])), radius=4,
                            color='#0000FF', fill_color='#0080bb').add_to(my_map)
        img_data = my_map._to_png(5)
        img = Image.open(io.BytesIO(img_data))
        img_name = loc_file.split('.')[0] + '.png'
        img.save(os.path.join(args['imgs_loc'], 'gps_point_imgs', img_name))
print("CREATED " + img_name)```that's the code I am using right now
but it only shows the first point plotted on all the images!!!
 austere swift
lapis sequoia
Pytorch v Tensorflow
Which one do you think is better and why
austere swift
lapis sequoia
Pytorch v Tensorflow
Which one do you think is better and why
its mostly based on use case and pure preference
tensorflow performs better in some applications, pytorch performs better in others
lapis sequoia
No way
cedar sun
how can i get the brightest pixel on an img?
first i think i have to convert image to HSL format
But how can i loop through the img to see what pixels has the highest L?
uncut barn
is there a way to find the largest value in a dataframe?
serene scaffold
@uncut barn in a specific column or what?
uncut barn
no a specific column but for example like this

I just need to find the largest value in the df, it doesnt need to be from a specific row/column
serene scaffold
uncut barn
no a specific column but for example like this
I'm not sure why you'd want to do that when the numbers in each column represent different things, but df.fillna(0.).to_numpy().max() should do it.
uncut barn
so what this is is a correlation matrix and what I want to do is find the pair which has the highest correlation
@serene scaffold by the way I changed the diagonals to NaN
serene scaffold
uncut barn
<@!253696366952316929> by the way I changed the diagonals to NaN
yeah, calling max() when there's a nan might just propagate the nan.
grave frost
I would say TF is good for just implementing mature stuff, while PT is better for more research-oriented models and techniques
PT Is much more easily debuggable than TF, but you would have to write a lot of code
lapis sequoia
import cv2

cap = cv2.VideoCapture()

faceXML = cv2.CascadeClassifier("haarcascade_frontalface_default.xml")

while True:
  ret, frame = cap.read()

  detect = faceXML.detectMultiScale(frame, 1.1, 4)

  for (x, y, w, h) in detect:
    frame = cv2.rectangle(frame, (x, y) , (x+w, y+h), (1, 254, 0), 2)
    cv2.imshow("VID", frame)

    if cv2.waitKey(1) & 0xFF == ord("q"):
      break
guys my code aint working (not showing window)
misty torrent
how do you decide when to consolidate features into one big feature regarding ML
narrow dagger
@misty torrent you mean using an algorithm such as principal component analysis?
if so, you can use PCA for plotting the dataframe that you have, for example, you can convert a 10 dimensional dataframe to 2 dimensional, so you can understand the plot.
or you can use it to speed up the learning process for the ML algorithm
misty torrent
oh, I forgot about PCA
interesting, thanks
also while you're a here assuming you're a math head
I want to take a data set that's been normalized from 0 - 1 using >>> from sklearn.preprocessing import StandardScaler - and normalize it based on a curve
I know the math behind my idea, but how write code
narrow dagger
the only case I know that you should consolidate features into one feature, is if you are using the PySpark API, it require all the features to be in one column
misty torrent
No, I'm sorry was asking seperate question
I'm talking now about a dataset I'm pre processing for my algo
narrow dagger
if you want to make the data ranges from 0 to 1, I recommended using MinMaxScaler
narrow dagger
StandardScaler changes the mean of the data to 0 and the standard deviation to 1
misty torrent
but how do I then make that data normalized based on a custom exponential curve?
where for example "->" represents the result I want - [0.1, 0.2, 0.5, 1] -> [0.01, 0.1, 0.7, 1]
narrow dagger
if you can't find a build in function that does such thing, then I guess you need to right the code from scratch
of course if you know the math behind it
lapis sequoia
!rule 8
arctic wedgeBOT
8. Do not help with ongoing exams. When helping with homework, help people learn how to do the assignment without doing it for them.
lapis sequoia
lol
 peak ridge
misty torrent
peak ridge
misty torrent
???
who we talking about homework?
I'm writing an algorithm for work and am trying to figure out how to do this grrr.
FOUND IT:
scipy.optimize.curve_fit
numpy.polyfit also works
jade carbon
lapis sequoia
Pytorch v Tensorflow
Which one do you think is better and why
the answer is based your technique when u wanna use it
better use pytorch when you want to do some research, and tensorflow for production.
my viewpoint
lapis sequoia
How should I start learning ml and AI? What prerequisites do I need? What platform is good?
lapis sequoia
jade carbon
better use pytorch when you want to do some research, and tensorflow for product...
Thanks for your galaxy brain input
I just wanna pick one to learn ML with
jade carbon
lapis sequoia
How should I start learning ml and AI? What prerequisites do I need? What platfo...
better learn about simple algorithms first. next is step by step
lapis sequoia
jade carbon
better learn about simple algorithms first. next is step by step
You sound someone with a lot of reputations in stackoverflow sir
 shut tapir
Greeting guys, please help me on this!
I'm trying to find a way to match a list of candidate skills with a list of job skills and return a similarity score.
So for example, if candidate skills = ["ML", "PyTorch", "Deep Learning"] and required job skills = ["Machine Learning", "Data Science", "Pytorch framework","Effective communicator"]
Now, it should match 'ML' to 'machine learning' and 'pytorch' to 'pytorch framework' and give a score somehow. How do I do this without having to explicitly map ML to Machine learning, pytorch to pytorch framework,etc...
Please help me with any information you might have!
grave frost
newbie to pytorch here, had this block:
loss = trainer(data)    #trainer for model
loss.backward()    #backprop
opt.step()       #update
opt.zero_grad()
it was my understanding that zero_grad() would reset the gradients to 0 - which is something done for initalization (https://stackoverflow.com/questions/48001598/why-do-we-need-to-call-zero-grad-in-pytorch)
why do we call it in the end here, because wouldnt't it then reset all the weights? im kinda confused
desert oar
@grave frost it sets the gradient to zero, because the gradient gets re-built at each backward call
Stack Overflow
The method zero_grad() needs to be called during training. But the documentation is not very helpful
| zero_grad(self)
| Sets gradients of all model parameters to zero.
Why do we need to call
https://pytorch.org/docs/stable/optim.html#taking-an-optimization-step
for data, target in dataset:
    # reset our gradient computation
    optimizer.zero_grad()

    # compute the output and loss for current weights
    output = model(data)
    loss = loss_fn(output, target)

    # compute the gradient for our current weights, using backpropagation
    loss.backward()

    # use the gradient to step forward, e.g. with gradient descent
    optimizer.step()
 somber prism
can someone explain me precision - recall in a simple way
desert oar
if you didn't call zero_grad, the "gradient" at step N would be the cumsum of gradients at step N
desert oar
somber prism
can someone explain me precision - recall in a simple way

In pattern recognition, information retrieval and classification (machine learning), precision (also called positive predictive value) is the fraction of relevant instances among the retrieved instances, while recall (also known as sensitivity) is the fraction of relevant instances that were retrieved. Both precision and recall are therefore bas...
that chart is really good
somber prism
i did see that
but i want it to be explain in a simple terms , precision means percentage of correct prediction and recall is ?
desert oar
precision: # actual & predicted "yes" / # predicted "yes"
recall: # actual & predicted "yes" / # actual "yes"
            model
          yes   no
data  yes  A     B
      no   C     D
precision = A / (A+C)
recall = A / (A+B)
A is called "True Positive", TP
B is called "False Negative", FN
C is called "False Positive", FP
D is called "True Negative", TN
lots of related topics in that confusion matrix chart on wikipedia
especially interesting are type 1 and type 2 errors, which are very relevant in statistical hypothesis testing
cedar sun
salt
i am facing something... weird
with xception i was able to train for a bit. I move to other models and acc is 0.001. it isnt increasing
desert oar
if accuracy is nonsensically bad, you have a bug in your code
if accuracy is just kind of bad, your model is probably just bad
(this could include your data processing pipeline and not just the neural network part)
plucky spire
just wondering if like working with apis or doing pandas felt really awkward for anyone
at first?
desert oar
working with apis
no, python has pretty good libraries for making HTTP requests and handling the data that comes back.
pandas
yes, i started with R and pandas felt like a cheap imitation of R dataframes at the time. it's much better now, but it is a big complicated library and it takes time to get used to it. also the "user guide" documentation is really bad.
grave frost
desert oar
if you didn't call `zero_grad`, the "gradient" at step N would be the cumsum of ...
ooh, I get it know. thanks a ton @desert oar 🚀
hmm...is this trainer some pytorch thing?
ahh, so it just represents the class for using the model for some task 🤔
quite different than TF - in pytorch, things seem very flexible and replaceable
tidal bronze
I am taking Andrew Ng course on machine learning
do I really need all the math behind?
it's kinda interesting but also time consuming and I am pretty sure I'll just use sklearn or other libraries
desert oar
the less math you know, the less you will understand about what scikit-learn is actually doing
it's helpful to at least know calculus and matrix/vector math, as well as basic probability
otherwise you're going to be kind of guessing at everything
tidal bronze
on the other hand I am also pretty sure I'll forget it pretty soon too
quasi sparrow
Yeah, that's true. Sometime I would literally draw the dataframe on paper and start doing the math for the first 2 or 3 iterations.
desert oar
and if you know the math, you know the "why" and not just the "how" which makes it harder to forget
grave frost
correct me if I am wrong, but we have to write our own dataset loader in pytorch right?
quasi sparrow
Make sure you know at least some vector analysis and probability
grave frost
and wrap it with torch's Dataset?
quasi sparrow
This book helped me a lot "bayesian statistics the fun way"
and "statistics done wrong""
this is an awesome website to help you visualize vectors and spaces
Visualizing machine learning one concept at a time.
quasi sparrow
tidal bronze
it's kinda interesting but also time consuming and I am pretty sure I'll just us...
You need to understand the math for hyperparameter optimization and feature engineering
quasi sparrow
But in the future, I don't think people will need to know the math behind machine learning. SaaS companies will offer software where you just dump the data and the system trains the model.
You can find some of these services already available in Amazon Web Services.
tidal bronze
yeah but I'd like to get to work in the field
quasi sparrow
Companies like Palantir offer SaaS like these
tidal bronze
what kind of project could I do to build-up my portfolio?
quasi sparrow
Some companies are even trying to build chips specifically designed for every machine/deep learning model.
Yeah, I'm on the same boat, I'm trying to get on the ML/DL industry.
Have you thought about taking a data science bootcamp?
quasi sparrow
Oh man, that s***s
I plan taking a software engineering immersive bootcamp and 2 cloud computing certifications and hope for the best
I've been working on ML projects for my portfolio on the side but I can only do so many coding hours per week.
Which bootcamp were you planning on taking?
What school, I mean?
tidal bronze
it's some kind of program for unemployed people
and best of all it was free and included an internship
quasi sparrow
Oh wow, that sounds great!
I would say, just keep reading and enjoy the process!
In my personal experience, when I focus too much in just building projects for my Git, I start to rush things and that's when I stop learning because I'm just aimlessly reading and just copying code.
tidal bronze
thanks for the tips beaverboi
 azure condor
hey anyone know how well raspberry pi's can handle loading trained models and executing them.
i am trying to load a model and use it for inference on my pi but I end up with "Backend terminated or disconnected. Use 'Stop/Restart' to restart."
quasi sparrow
Sounds more like a problem with your interpreter.
If you want faster inference in a rapsberry PI, you can use a intel neural compute stick.
azure condor
alright thanks ill look at that
grave frost
azure condor
hey anyone know how well raspberry pi's can handle loading trained models and ex...
pi's can - but you would have to apply some techniques like quantization, distillation, making it sparse, etc.
azure condor
thanks but i think i might as well just buy a jetson nano
 blissful nymph
im trying to install pytorch with pip:
pip3 install torch==1.8.1+cpu torchvision==0.9.1+cpu torchaudio===0.8.1 -f https://download.pytorch.org/whl/torch_stable.html
I got the cmd from https://pytorch.org/get-started/locally/
but it dosen't work.

It says
ERROR: Could not find a version that satisfies the requirement torch==1.8.1+cpu
ERROR: No matching distribution found for torch==1.8.1+cpu
 sick swan
