#data-science-and-ml
1 messages · Page 312 of 1
 dusky granite
rest is correct
also before it was 6 frames and adding steps_per_epoch made it 5
@serene scaffold you there?
 serene scaffold
dusky granite
<@!253696366952316929> you there?
serene scaffold
dusky granite
<@!253696366952316929> you there?
yes. one moment
dusky granite
ok cool
serene scaffold
dusky granite
ok cool
what is train_ds?
dusky granite
training dataset
serene scaffold
what class does it belong to?
serene scaffold
what type of object is train_ds?
serene scaffold
yes. that function returns an instance of tf.data.Dataset
dusky granite
and that should work right?
dusky granite
which one is import - creation of model,compile or fit?
serene scaffold
rephrase: what type is image_learner?
dusky granite
Sequential
serene scaffold
okay, and what is the import statement for Sequential?
dusky granite
i am not very sure i understood this but i think this is what you are asking for
image_learner = Sequential([
  data_augmentation,
  layers.experimental.preprocessing.Rescaling(1./255, input_shape=(img_height, img_width, 3)),
  layers.Conv2D(16, 3, padding='same', activation='relu'),
  layers.MaxPooling2D(),
  layers.Conv2D(32, 3, padding='same', activation='relu'),
  layers.MaxPooling2D(),
  layers.Conv2D(64, 3, padding='same', activation='relu'),
  layers.MaxPooling2D(),
  layers.Dropout(0.2),
  layers.Flatten(),
  layers.Dense(128, activation='relu'),
  layers.Dense(num_classes)
])```!code
 arctic wedgeBOT
Here's how to format Python code on Discord:
```py
print('Hello world!')
```
These are backticks, not quotes. Check this out if you can't find the backtick key.
dusky granite
here
 lunar zenith
I got it already, thanks for your help!

 dusky granite
serene scaffold
!code
dusky granite
serene scaffold
!code
the edited one is ok right?
 mint palm
The table used in ques 7 is above it
serene scaffold
@dusky granite I noticed that you don't pass a y argument
dusky granite
well i don't have a y argument
dusky granite
serene scaffold
<@!463380179260276736> I noticed that you don't pass a `y` argument
does it not work without one?
serene scaffold
Looks like you don't need one when x is a tf.data instance of some kind
hmmmmmmmmm
dusky granite
also it worked as a gpu model
serene scaffold
btw I'm pretty sure you didn't share the whole error message
dusky granite
what should be the steps_per_epoch?
serene scaffold
InvalidArgumentError: Unable to parse tensor proto appears to be cut off
dusky granite
serene scaffold
btw I'm pretty sure you didn't share the whole error message
no that is the full thing
i can send an ss if you want
serene scaffold
Did you look into what "InvalidArgumentError: Unable to parse tensor proto" might mean?
dusky granite
serene scaffold
Did you look into what "InvalidArgumentError: Unable to parse tensor proto" migh...
it can mean a lot of things
like wrong input something missing


the screenshots
it was 6 frames earlier
adding the steps_per_epoch made it 5
i believe these 5 are based on the first one
serene scaffold
I don't think I have any ideas other than to check out how you're interacting with the GPU
dusky granite
it is able to connect to a tpu
here
Pastebin
Pastebin.com is the number one paste tool since 2002. Pastebin is a website where you can store text online for a set period of time.
dusky granite
serene scaffold
I don't think I have any ideas other than to check out how you're interacting wi...
is there a different way to use TPU?
serene scaffold
dusky granite
is there a different way to use TPU?
I'm not sure.
dusky granite
do you know what is currently wrong?
serene scaffold
No
mint palm


Why am i wrong in question 7
I think my friend is right💯
The given answer is option a
 grave frost
did you try readin the TF docs?
grave frost
the model isn't supposed to be in the strategy.scope
dusky granite
I tried to where there were no other guides
grave frost
take out an hour, read about TPU and solve accordingly
go through the whole guide, even if it's not for your case
dusky granite
grave frost
use this ^^
Even that says this
  model = create_model()
  model.compile(optimizer='adam',
                loss=tf.keras.losses.SparseCategoricalCrossentropy(from_logits=True),
                metrics=['sparse_categorical_accuracy'])
Ok will do tonight
grave frost
dusky granite
Even that says this
I mean, can you see any other line in there except create and compile???
dusky granite
grave frost
I mean, can you see any other line in there except create and compile???
Mine is also the same just that. I don't have create_model() and it is all there
grave frost
dusky granite
Mine is also the same just that. I don't have create_model() and it is all there
you place your layers there too
 upper lily
mint palm
upper lily
mint palm
Practically, I think your choice is a reasonable conclusion, but here are some other things to consider: there's pretty much always a higher error in validation/test splits (is 5% acceptable?). There's also a large gap between train error and human-level performance, which could indicate that the model itself may be a poor choice. Finally, a high discrepancy in train/val error doesn't necessarily mean validation samples are harder; they could simply belong to a separate distribution
dusky granite
grave frost
you place your layers there too
I will read the docs once and understand what I am doing wrong and then ask any remaining questions if I have. Currently I am just confused
grave frost
dusky granite
I will read the docs once and understand what I am doing wrong and then ask any ...
cool
 somber prism
can someone explain me about dummy variable trap , it is defined as the variables are highly correlated to each other but how , i mean arent the features are independent and the output variable dependent ?
upper lily
somber prism
can someone explain me about dummy variable trap , it is defined as the variable...
I'm not sure about the trap, but often the statement "features are independent" is an assumption rather than a reality 🙂
upper lily
somber prism
can someone explain me about dummy variable trap , it is defined as the variable...
I took a quick look at this page (https://www.algosome.com/articles/dummy-variable-trap-regression.html) which seems helpful. The gender example makes it clear in my opinion
Algosome Software Design.
 echo orbit
Hey, can someone enlighten me regarding the parameters that can help me know if a sample of a dataframe is fair representative of the original dataframe please ? I'm thinking about bayesian inference but i don't really know how i could make it work (as my datas are hashtags (and not values), i don't think i can work with mean values & std)
To sum up : i have multiple dataframes of different sizes (from 5m rows to 67m rows) and i, for example, took only 500K rows of each dataframe. Are there ways to verify if such samples' properties can be applied to the original dataframes ?
 lapis sequoia
Hi guys. I don't know how relevant this is for Python but I am using Python to do this so I might as well just ask it here. My plan is to use images of a well-known object (a painting in a museum for example) and then use those to query some online database to retrieve the correct name for that painting.
I know this will involve AI but I was hoping someone here can point me in the right direction. Is there already some Python library to do this?
that online database could be a wikidatabase
grave frost
lapis sequoia
Hi guys. I don't know how relevant this is for Python but I am using Python to d...
google reverse image search
dusky granite
@grave frost i figured most of the stuff out
just one thing
how can i put my own dataset here?
as_supervised=True, try_gcs=True)```i currently use this for my datasets
tf.keras.preprocessing.image_dataset_from_director
 near cosmos
echo orbit
To sum up : i have multiple dataframes of different sizes (from 5m rows to 67m r...
near cosmos
echo orbit
To sum up : i have multiple dataframes of different sizes (from 5m rows to 67m r...
Compare distributions of sample and population over parameters you care about. Do sensitivity analysis by resampling and measuring variance in your procedure.
echo orbit
Hmmm
I think my issue is that i don't really understand what comparing distributions of sample and populations over parameters mean when my "values" are strings
If i had numerical values i could probably understand how to do it (with mean, std, etc...) but i really can't see how to make a distribution of strings
near cosmos
echo orbit
If i had numerical values i could probably understand how to do it (with mean, s...
What type of analysis are you planning to do? At some point the strings get turned into numbers.
echo orbit
I think i'll go with a statistical analysis
though i wouldn't mind going with a bayesian analysis if that can help me verify if the sample's properties represent the original dataframe's properties as well
near cosmos
echo orbit
though i wouldn't mind going with a bayesian analysis if that can help me verify...
But like simple frequency of each hashtag? Or an embedding like bag of words? What is the question about the data you are trying to answer
echo orbit
Yeah it seems i forgot to give the context :
-My main objective is to study how the COVID-19 crisis has been lived by Twitter users using hashtags more or less related with COVID-19.
-To do that, i downloaded a dataset on github containing CSV files of tweet/thread IDs with the hashtags (https://github.com/lopezbec/COVID19_Tweets_Dataset/tree/master/Summary_Hashtag)
-As these are hourly datas, i concatenated them so they become monthly datas & applied some edits (lowercap, delete NaN, etc...)
-Since there is an enormous amount of data, i decided to sample the dataframes so it becomes easier to study them
-My final objective is to use networkx to plot networks of the hashtags & to observe how they are linked to each others (2 hashtags mentioned in the same tweet/thread means they are linked).
However there is not a single analysis there : i need to figure out what would be the best parameters to sample the dataframes so i can tell if any property/result found in the samples would still be accurately found on the original dataframes.
Sorry if my english is kinda bad, please tell me if anything isn't clear
@near cosmos

GitHub
COVID-19 Tweets Dataset. Contribute to lopezbec/COVID19_Tweets_Dataset development by creating an account on GitHub.
The dataframes look like this (that was for ex after taking 500K rows) :
           Index             Tweet_ID            Hashtag
5              5  1219774023246192640               #cdc
15            15  1219775789270351873       #coronavirus
21            21  1219778666877448192       #coronavirus
30            30  1219781023023685633            #cancer
32            32  1219781023023685633         #ourmoment
43            43  1219784288687792128    #chinapneumonia
57            57  1219788195799302144       #coronavirus
60            60  1219789360725483520       #coronavirus
67            67  1219794180274151424               #cdc
73            73  1219794987451158528        #wuhanvirus
79            79  1219797876127215616            #corona
127          127  1219807844599336961       #coronavirus
132          132  1219808345713868800       #coronavirus
146          146  1219811459200249856             #sb276
153          153  1219811598845349888                #us
154          154  1219811697176612867  #wuhancoronavirus
156          156  1219811935765483520    #wuhanpneumonia
176          176  1219815212607594506       #coronavirus
193          193  1219817193241751553        #jesussaves
197          197  1219817448083464192          #breaking
205          205  1219818433165946880             #china
209          209  1219818516473270273  #wuhancoronavirus
210          210  1219818516473270273    #wuhanpneumonia
229          229  1219821014735118337      #publichealth
236          236  1219821518718406658  #wuhancoronavirus
238          238  1219821744724369408       #coronavirus
242          242  1219822045367656449             #wuhan
249          249  1219823148998119425       #coronavirus
256          256  1219823683092566016       #coronavirus
257 257 1219824203454529536 #chinapneumonia```So a simple first check then is to calculate your network over several resamples and see if it varies too much for your purposes
echo orbit
In that case is there a parameter i can look at to verify if my networks are sufficiently accurate ?
near cosmos
You can also look at cross-validation techniques, which are essentially aimed at the same question (is my sample good)
echo orbit
Also is there another parameter that can evolve with the sample size so i can see at what exact/approximative value my sample size starts to be good enough ?
near cosmos
I'd say the parameter you care about and what is "good enough" is specific to your question/domain. That is, there isn't one right technical answer: You have to think about what you care about and what matters to your problem. But what I would tend to look at is, say, variance in the linkage strengths
echo orbit
I see
There is still something i don't understand : iirc cross-validation needs an estimator, however i don't think i have any estimator to use (as i'm not trying to make predictions on the datas)
In that case how should i define my cross-validation method ?
near cosmos
I'd say it this way: you are calculating some statistic (edge strengths in a network) and you want to estimate the variance. Resampling, bootstrapping, cross-validation, etc all give techniques for creating new samples so that you can measure variance.
echo orbit
Then i can just make new samples using the DataFrame.sample function
near cosmos
(Or in Bayes world, you are estimating the posterior distribution for linkage strength)
echo orbit
In that case what would be the objective ? Get the variance as low as possible ?
near cosmos
Yes, if your goal is to show that your sample doesn't alter your conclusions
echo orbit
I may be dumb but i don't see how i can establish a link between the sample size & the accuracy of the network
Like even if i get a pretty low variance (which will tell me i get similar results regardless of the samples (of the same size ?)), how does that tell me that my sample is sufficiently large to correctly represent the original dataset without being too large so i can work on it with satisfying execution times ?
mint palm
upper lily
Practically, I think your choice is a reasonable conclusion, but here are some o...
I accept the fact that they can belong to different distribution but i choose last option cuz it says "probably" lower than dev/test set
upper lily
Oh totally, it's a bunk question 😛
mint palm
Is it just to be ignored or
Ya
I am just asking cuz instructor specified 30 times to go through questions in detail
I hv one more mind f question

I got this wrong too
 crude fable
Does anyone have an idea of how many GCN layers shoule be stacked when using GCNs?
 near cosmos
echo orbit
Like even if i get a pretty low variance (which will tell me i get similar resul...
near cosmos
echo orbit
Like even if i get a pretty low variance (which will tell me i get similar resul...
I think we are just talking basic sampling theory now. How do you know your sample is a good representation of the population you care about? In this case, you are treating your original dataset as the population (it is also a sample), and then subsampling and trying to show that the subsample accurately captures the features you care about
echo orbit
That's right
near cosmos
If you increase your subsample size, your uncertainty about the actual value of the sample will go down. You can demonstrate that by subsampling a bunch of times, perhaps sweeping the sample size and showing you converge
If I did 1000 repeat experiments on the real world and showed that my uncertainty on my stats were very small, wouldn't you say that was good evidence I am appropriately sampling reality?
We are using the same logic here to show that your subsampling is appropriate
echo orbit
So i should, let's say take multiple subsamples (10%,20%,30%, etc...), plot the network for each subsample then notice a convergence in the network constitution (similar links, same nodes, same nodes size, etc...) & conclude my model is accurate at whatever sampling coefficient i notice the convergence ?
Where would the bayesian analysis interfere then ?
near cosmos
echo orbit
So i should, let's say take multiple subsamples (10%,20%,30%, etc...), plot the ...
Yes, but also you do many subsamples at each subsamole size. That gives you a distribution
echo orbit
Then i plot the variance as function of the sample size (in % for ex)
And take the sample size at which the variance is minimal ?
near cosmos
Well, it's going to always be smaller as your sample gets bigger, so look at it first like you are characterizing the behavior and demonstrating that your choice is reasonable
But yeah, you've got the basic idea. Give it a go
echo orbit
Alright
Just in case : where would the bayesian inference/analysis come in please ? Like where in the advices you gave me can i see a bayesian reasoning please ?
near cosmos
echo orbit
Just in case : where would the bayesian inference/analysis come in please ? Like...
A gentle nudge to the Bayesian way to think through the problem is to think in distributions. Every parameter and outcome is a distribution and you are trying to characterize it.
echo orbit
That's a bit hard to imagine ngl
near cosmos
Frequentist: there is one true linkage strength + error in my ability to measure it. Bayesian: there is a family of linkage strengths, some more likely than others
echo orbit
From what i understand, i have a distribution of sample size correlated with a distribution of results & i want to find what sample size maximize the probability to get the correct result
near cosmos
(With apologies for discussing complex topics over chat)
echo orbit
I think i start to understand what is the difference between both
 warped pebble
hello can someone help me involving finding the Exponential Moving Average from a list of prices
grave frost
Signal Processing people - what is the technical term for the specific frequency of an audio file that occurs most of the time? (for ex. say I have a bass song and a lot of frequencies are near 2khz - what would be the technical term for it?)
 timid halo
grave frost
Signal Processing people - what is the technical term for the specific frequency...
timid halo
grave frost
Signal Processing people - what is the technical term for the specific frequency...
Are you thinking about normalized (relative) frequency?

 olive willow
whats this app called?
 tranquil wadi
import pandas as pd
from sklearn import linear_model

app = Flask(__name__, template_folder='template')

@app.route("/")
@app.route("/home")
def home():

     dataset = pd.read_csv("diabetes.csv")

     df = pd.DataFrame(dataset, columns=['Gender', 'AGE', 'Urea', 'Chol', "BMI"])

     X = df[['Gender', 'AGE', 'Urea', 'Chol', 'BMI']]
     Y = df['CLASS']

     regr = linear_model.LinearRegression(n_jobs=-1)
     regr.fit(X, Y)

     X_TEST = [['F', 24, 4.5, 4.2, 21]]

     predicted_val = regr.predict(X=X_TEST)

     return render_template('index.html', data = predicted_val)


if __name__ == '__main__':
app.run(debug=True)```this giving me indent error : X = df[['Gender', 'AGE', 'Urea', 'Chol', 'BMI']]
^
IndentationError: unindent does not match any outer indentation level
tranquil wadi
it worked
 kindred blade
Can someone tell me how to start learning machine learning Im beginner at AI field I love this field so much so I wanted to get into but im not beginner at data analysis and visualization field so i believe that will help
 desert oar
mint palm
desert oar
mint palm
because that's not how overfitting works. you can still overfit within one class even if you are reasonably confident that you have a representative sample of other classes
 flint mason
have a look at its graph its quite straight forward
near cosmos
The range of cosine function is [0, 1]
near cosmos
Defintion: cosine(theta) is the x coordinate of the point on a unit circle at angle theta.
 tidal bough
It depends, actually - https://docs.scipy.org/doc/scipy/reference/generated/scipy.spatial.distance.cosine.html uses a definition by which it's from 0 to 2.
As for why, well: dot product of two vectors divided by the product of their norms is the cosine of the angle between vectors. That's from -1 to 1. Then you take 1 minus that, and get a value from 0 to 2.
With 0 achieved by collinear vectors, and 2 by antiparallel ones.
kindred blade
kindred blade
Can someone tell me how to start learning machine learning Im beginner at AI fie...
why isnt anyone answering my simple question
and not only this question , another question since days and not answered
 iron basalt
kindred blade
why isnt anyone answering my simple question
iron basalt
kindred blade
why isnt anyone answering my simple question
Reads the pins
Ask in #web-development
kindred blade
iron basalt
Ask in <#366673702533988363>
isnt matplotlib and ChartJs data science related ?
iron basalt
kindred blade
isnt matplotlib and ChartJs data science related ?
They are related to data science in the same way that knowing how to open a window is related to game development. Data science is also a buzz term and therefor related to everything. The question is like asking if math is related to physics. Also the previous question was web stuff so it's better suited for the web dev channel.
grave frost
tidal bough
As for why, well: dot product of two vectors divided by the product of their nor...
why remove it from the negative range tho?
I don't think it makes sense computationally - and we have a mathematical foundation for the negative range
near cosmos
tidal bough
As for why, well: dot product of two vectors divided by the product of their nor...
ah, right oops. range is [-1, 1] not [0, 1]
near cosmos
kindred blade
Can someone tell me how to start learning machine learning Im beginner at AI fie...
what do you want to do with ML?
tidal bough
grave frost
why remove it from the negative range tho?
Because it is intended to be used as a distance function.
distance functions with negative values are kinda bad. Though even the 0-2 cosine distance isn't positively determined (or whatever that property is called) - cosine(a,b)==0 means a || b, but not necessarily a==b, so it's not a metric unless your vectors are normalized.
iron basalt
tidal bough
distance functions with negative values are kinda bad. Though even the 0-2 cosin...
There are signed distance functions that have great use, but in this case (assumption) you don't care about the sign (and very often don't).
kindred blade
near cosmos
what do you want to do with ML?
I want to learn it for a lot of things like chat bot using machine learning , I wanna learn a lot of it
there are unlimited projects to do with ML
near cosmos
kindred blade
I want to learn it for a lot of things like chat bot using machine learning , I ...
grave frost
tidal bough
distance functions with negative values are kinda bad. Though even the 0-2 cosin...
hmmm..alright, that does make sense
iron basalt
grave frost
hmmm..alright, that does make sense
Basically, you need to ask yourself: "What does the sign mean?" and "Do I want/need it to be taken into account (or be invariant to it)?"
 maiden saddle
how long should is the learning curve from beginner to coding ai
grave frost
maiden saddle
how long should is the learning curve from beginner to coding ai
depends on factors - efforts, time, consistency, IQ
 oak laurel
Hi people! I'm an undergrad that wants to make the best of his summer, and I'm looking for good courses to learn skills in Data Science/ML/AI. I'm not really sure where to start, but I've been suggested to look at PyTorch as a starting point (since I'm already decently fluent in Python), and then make my way up to SQL. Can somebody suggest any good online courses/bootcamps/online resources to use over the summer? Thanks.
lapis sequoia
Why are neural networks not used for everything?
Like, why would you choose to use a statistical model like a Random Forest over a neural network?
 velvet thorn
lapis sequoia
Like, why would you choose to use a statistical model like a Random Forest over ...
velvet thorn
lapis sequoia
Like, why would you choose to use a statistical model like a Random Forest over ...
possibly lower variance
lower computational complexity
higher interpretability
access to software
lapis sequoia
so generally just for computation?
would big tech companies generally always use NNs then?
since they have the resources
velvet thorn
lapis sequoia
would big tech companies generally always use NNs then?
no
interpretability and variance matter
NNs aren't better @ solving all problems
example
Amazon SageMaker Random Cut Forest (RCF) is an unsupervised algorithm for detecting anomalous data points within a data set. These are observations which diverge from otherwise well-structured or patterned data. Anomalies can manifest as unexpected spikes in time series data, breaks in periodicity, or unclassifiable data points. They are easy to...
velvet thorn
lapis sequoia
since they have the resources
also
with high enough time complexity and dataset size, nobody has enough resources
lapis sequoia
Makes sense, thanks
 fast dune
@velvet thorn
You helped me 2 days ago on Numpy array broadcasting. I've been studying array broadcasting, but I'm still stuck. I rewrote my code snippet (https://paste.pythondiscord.com/inoyecifax.py) and I've included the necessary utility functions to convert image files to integer matrix for testing purposes.
There's a useful tutorial on calculating 'pairwise distances' which is close to what I'm doing... https://www.pythonlikeyoumeanit.com/Module3_IntroducingNumpy/Broadcasting.html#Pairwise-Distances-Using-Broadcasting-(Unoptimized)
Topic: Numpy array broadcasting, Difficulty: Medium, Category: Section
lapis sequoia
Does anybody use MatLab anymore
mint palm
olive willow
whats this app called?
Its coursera
mint palm
desert oar
because that's not how overfitting works. you can still overfit within one class...
I heard in video, instructor specifically mentioned that when synthesizing new sample from something if one set in very small as compared to another then algo may overfit to repeated pattern of that set cuz small set will have to be repeated multiple times to synthesize with big set
If we take fog example:
If we Use 1000 fog sample on 100,000
One fogs texture would be repeated 100 times
 tiny flax
qq decision trees use binary trees as a structure/support?
 uncut barn
what type of regularisation is used for linear classifiers?
tranquil wadi
@app.route("/home", methods=['GET', 'POST'])
def home():

     form= DataForm()
     if form.validate_on_submit():
        gender = float(form.gender.data)
        age = float(form.age.data)
        urea = float(form.urea.data)
        cr = float(form.cr.data)
        hba1c = float(form.hba1c.data)
        chol = float(form.chol.data)
        tg = float(form.tg.data)
        hdl = float(form.hdl.data)
        ldl = float(form.ldl.data)
        vldl = float(form.vldl.data)
        bmi = float(form.bmi.data)
     else:
        pass

DATA = [[gender, age, urea, cr, hba1c, chol, tg, hdl, ldl, vldl, bmi]]```Error: gender = float(form.gender.data) TabError: inconsistent use of tabs and spaces in indentation
 unique birch
you have some indents with tabs and some with spaces
tranquil wadi
what shall i do?
unique birch
Redo your indents, check your whitespace if your text editor has that
tranquil wadi
that worked, but now it is giving the error DATA = [[gender, age, urea, cr, hba1c, chol, tg, hdl, ldl, vldl, bmi]] UnboundLocalError: local variable 'gender' referenced before assignment
lapis sequoia
Hi, I'm looking for help with seaborn/matplotlib - How can I put many stripplots on same figure, with (categorical) axis common for all plots?
I tried to do it like this:
sns.stripplot(y="Project", x="DUT_result", data=df[df['Test_result']=='Pass'], hue='Country', marker = 'o')
sns.stripplot(y="Project", x="DUT_result", data=df[df['Test_result']=='Fail'], hue='Country', marker = 'X')
but the second plot changes the y axis, as the rows with Test_result==Pass contain different Project names than ones with Fail.
 south crag

 digital merlin
Hi, I would like to know if let's say I'm going to train a machine learning model based on a stroke dataset from kaggle, is it possible if I create a form asking for some stuff using a form or data from another file and it can predict if the patient has a stroke? I'm not too sure if it's possible, googling doesn't give me any info if it is
 ripe forge
Sure, possible. Why wouldn't it be. As long as the data from the form can be converted (which, yes it can. You're the programmer you're in control) then that model can make a prediction on it
digital merlin
And is the conversion via hot encoding?
ripe forge
That depends entirely on how the train data was prepared.
You follow the same steps you took
digital merlin
@ripe forge but would it be possible if let's say I'm doing it on an application, and I've already prepared the trained data and have already did the application? Because what I'm doing is basically the user entering the data from the form and afterwards there'll be a result of whether the patient has a stroke or not
sorry for ping
lapis sequoia
are there any libraries which can implement OCR on a screen that is being scrolled live?
like for example if i want to make a program which constantly watches my screen and keeps converting text on the screen to like a dictionary and if a certain word pops up on the screen, it needs tro detect it and then shut the program off
its kinda like u have a screen recorder(like obs) and u are implementing ocr at the same time
 teal nova
off topic question here, but are there any university professors specializing in mathematical modelling/statistics or economics here?
 mossy stratus
I'm making a discord bot to play card games and was wondering if the best way to make an AI for this would be to have it "cheat".
If you know of a better way, please tell me.
grave frost
Noob Question: why can't the attention mask have values between 0 and 1 (rather than only 0 and 1)? Kind of thinking them as weights for instance, then if I want the model to have partial attention to a token, can't I use something like [0, 0.5, 0.8, 1, 1]??
ripe forge
digital merlin
<@!107790568251236352> but would it be possible if let's say I'm doing it on an ...
aye. a model would be pretty useless if you couldn't use it after training it. Your ask is literally the bread and butter of what makes a model useful - the ability to run it on new data. you do need to have a record of the actual steps you took to prepare the data. run the same steps on the new data, and there should be a .predict method of some sorts on your model.
So, you need to save the steps, and the model. and then re-do the dataprep steps on the new data, and load the model, and run a predict on the data
grave frost
then re-do the dataprep steps on the new data
That's kinda discouraged now. it's recommended you keep pre-processing as custom layers in the model itself to keep it simple and quick
dusky granite
figured some more stuff out
i need help creating this type of dataset
as_supervised=True, try_gcs=True)```i generally do this type
```tf.keras.preprocessing.image_dataset_from_directory``` vocal bay
I have a use case where I will have a central model which needs to be trained and will deliver predictions. My data is harvested in real time from multiple clients across the internet. I originally thought of making a system where each time a client collects a data point, it sends it to the server with an API and is added to a queue which will contain data which will be batched and trained on. However, this data is sensitive and as far as possible, I would like to avoid it traversing the internet.
Then I came across PySyft which would allow me to train on data remotely. However, can PySyft be used in a way where there is one model and innumerable data sources, instead of multiple models sharing one data source? Also, my use case requires that data clients can come online and offline randomly so it should be possible to add and remove data sources while training.
I appreciate that this is probably a niche use case but would greatly appreciate any guide on the matter.
Please tag in responses
grave frost
data is sensitive and as far as possible, I would like to avoid it traversing the internet.
what?
 tall zinc
I have a binary image with some features in it, but sometimes they touch and I want to get individual contours for each. Is there a "more proper" way to go about this than just using cv2.drawContours() to draw a black outline around each directly onto the binary image, thereby shrinking them, and then contour it again?
It feels like such a hack but like ... it does work perfectly
near cosmos
tall zinc
I have a binary image with some features in it, but sometimes they touch and I w...
Try morphological open https://docs.opencv.org/master/d9/d61/tutorial_py_morphological_ops.html
tall zinc
I don't need noise got rid of, so I don't need the dilate afterwards, and if anything the dilating would just put me right back where I started. I guess it would just be erosion that I want on reflection
tall zinc
near cosmos
Try morphological open https://docs.opencv.org/master/d9/d61/tutorial_py_morphol...
Also I need the inside of the contours not to be eroded, there are pretty erosion-sensitive contours inside of those boxes that I need to remain untouched. I guess I could erode it, find those outer contours, then look inside the region of each on the original mask to find those details but at that point it's so much more work than just shrinking with a drawContours()
near cosmos
tall zinc
I don't need noise got rid of, so I don't need the dilate afterwards, and if any...
It's useful for splitting features also, especially if you define the kernel in a way that favors the shape you care about.
tall zinc
Yeah erosion and opening are both handy tools but it's just a bit too destructive for this purpose, sadly. I'm fine with my hacky solution I just wasn't sure if there was a "proper" one. Though I guess erosion is that proper solution, I'd just need to also retain the un-eroded mask so I could use that for getting the contours within these other ones
near cosmos
tall zinc
Yeah erosion and opening are both handy tools but it's just a bit too destructiv...
Seems pretty normal to me to do those different things (get the inner contours, define outlines) in different steps. In any case, it sounds like you are doing contouring twice as a way to erode then contour. You could also try adding a watershed like step if you can find centers https://docs.opencv.org/master/d3/db4/tutorial_py_watershed.html .
 tall zinc
 nova tapir
By providing the positional argument "units"
Dense() apparently needs to be given units, either by name or by position ahead of the named arguments
tall zinc
near cosmos
Seems pretty normal to me to do those different things (get the inner contours, ...
But when I redo the contouring I want to be able to maintain the parent/child relationship between the contours in the hierarchy because it's useful, so having a second step where I take a small section of the image and then contour it means I lose that / have to define it manually.
Appreciate all the thoughts though :)
nova tapir
 tall zinc
Sounds like you provided 6 logits and only 1 label, rather than one for each
 green owl
does anyone here have experience making a webcrawler
 limpid saddle
My data seems to be overfitting, how can I do regularisation?


 heavy tree
At the bottom of the error message it says what the problem is. You are trying to convert Florida directly into a number... Not sure if that's possible.
 tall zinc
Florida doesn't float? Better hope those sea levels don't rise
 remote flume
hello, somebody know if it is possible speech-to-text conversion with speech recognition but in the output audio?
desert oar
mint palm
I heard in video, instructor specifically mentioned that when synthesizing new s...
right. the question said little risk of overfitting, which would be wrong
 jade carbon
btw, what are differences in algorithm between object detection and grad cam?
upper lily
limpid saddle
My data seems to be overfitting, how can I do regularisation?
Hey @limpid saddle , that's quite a broad question. There are many regularization techniques available, but your choice of which technique to use will depend on the data modality (e.g. tabular, imagery, text, etc) and modeling approach. Folks might be able to help more if you could describe the problem, data, and model :)
For example, @uncut barn asked this morning about regularization with linear classifiers. In that case, L1 and/or L2 regularization are typically used
But if you're working with a neural network and imagery, it's typical to use Dropout layers, batch normalization, and data augmentation
 jolly nest
!e what should I add? ```py
#LVL 0
mean=avg=lambdaa,n=1,sigma=0,_:sum(a)/len(a or[()])if a else sigma/(n or 1)
sqrt= lambda n:n0.5
_p_m= lambda a,b:(min([a+b,a-b]),max([a+b,a-b]))
c = lambdaa:a
def sd(*a,**k):
mean = k.get('mean',avg(a,n=k.get('n',len(a))))
return sqrt(avg([abs(i-mean)**2 for i in a]))
#LVL 2
def SE(*a,**k):
s = k.get('s',sd(*a))
n = k.get('n',len(a))
return s/sqrt(n)
def z(x, *a, k):
mean = k.get('mean',avg(*a))
s = k.get('s',sd(*a,({'mean':mean}|k)))
return (x-mean)/s
def raw_score(z, *a, **k):
k['mean'] = k.get('mean',avg(a))
s = k.get('s',sd(a,**k))
return zs + k['mean']
#LVL 3
s2=lambdaa,**k:k.get('s',sd(*a,**k))**2
def t_stat(*a,mu0=0,**k):
mean = k.get('mean',avg(*a))
se = k.get('SE',SE(*a,**k))
return (mean-mu0)/se
def conf_int(*a,T,**k):
se = k.get('SE',SE(*a,**k))
return _p_m(k.get('mean',avg(a)),Tse)
#LVL 4
def summary(*a,**k):
k['mean']=k.get('mean',avg(*a,**k))
k['s']=k.get('s',sd(*a,**k))
k['SE']=k.get('SE',SE(*a,**k))
k['t']=t_stat(a,**k)
if'T'in k:
k['confidence_interval']=conf_int(a,**k)
_01 = [k['t'] <- k['T'], k['t'] >+ k['T']]
k |= {'H0':'reject'if any(_01)else'accept','Ha':['mu < mu0'](_01[0])+['mu > mu0'](_01[1])+['mu != mu0']if any(_01)else'reject'}
k['Z-score']=z(k.get('mu0',0),*a,**k)
for n,v in k.items():print(n,'=',v)
data = {'n':40,'mean':172.55,'s':26.33}
summary(**data)
data |= {'mu0':166.3,'T':2.021}
print(summary(**data))
@jolly nest :white_check_mark: Your eval job has completed with return code 0.
001 | n = 40
002 | mean = 172.55
003 | s = 26.33
004 | SE = 4.163138539611671
005 | t = 41.44709534842795
006 | Z-score = -6.5533611849601225
007 | None
008 | n = 40
009 | mean = 172.55
010 | s = 26.33
011 | mu0 = 166.3
... (truncated - too many lines)
Full output: https://paste.pythondiscord.com/sufijoxodi.txt?noredirect
jolly nest
actually, how do you get p-value?
I see it everywhere, but no clear way to get it algorithmically
just modules and ambiguous formulae
lapis sequoia
hello
am interested in machine learning and ai
i just figuered web development wasnt for me
i hope you dont need any form of html/css or js for machine learning and ai 😞
ripe forge
Not really, no. Though those are useful things to know if you ever need to deploy stuff yourself
Even basic knowledge is enough
 winged stratus
anyone know how to do early stopping in pytorch?
ripe forge
Pytorch you write the model in a loop yeah? Just add a logic for checking validation data in the loop and keeping track of last validation
If the score becomes worse, break


 limpid oak
hello every one
I have one python code which generates .csv as output,but I want to share as link where, when user hit url csv should be downloaded at user side
please help
lapis sequoia
how advanced math do i need for ai
mint palm
desert oar
right. the question said _little_ risk of overfitting, which would be wrong
this week assignment sure is nasty
dusky granite
nova tapir
the library is not installed properly
nova tapir
I have a code from about 3 years ago, and i don't know how can i fix it
I guess it's code for older versions of keras and tensorflow, and there are some bugs inside
can someone fix this for me? it's a CNN code
if you guys want to help, text me, I can send the code and data set
 cedar finch
Anyone have any recommended texts for data science and ai?
serene scaffold
cedar finch
Anyone have any recommended texts for data science and ai?
You could try "Data Science from Scratch". It's an O'Riley book.
 blissful dragon
I want to make a Gantt chart for different phases of a space mission. I'm using matplotlib atm (not adverse to using bokeh). Trying to add more entries along the y-axis and it's not displaying for whatever reason. The timeframe I want to do it over would be over years.
nvm
 acoustic forge
Does it make sense to do cross validation on undersampled data?
cedar finch
serene scaffold
You could try "Data Science from Scratch". It's an O'Riley book.
Thanks @serene scaffold, I'll check it out 🙂
 dusty parcel
and any recommendations on a data analytics book? I've heard of 'python for data analysis' from Wes McKinney but I think it's kind of outdated as for today
 torn pollen
Is it correct that with the right training, I can setup a tensorflow AI with python that will solve captchas with 90%+ accuracy?
 hushed hatch
Hi Anyone know if we have anything to figure out difference between figures and text? Something that would mark figures and text seperatly in an Image?
 upper stirrup
Hi everyone! Can someone help me "Natural Language Processing"(nlp) in "word level tokenization"?
 mystic orchid
Hi everyone! What you can recommend to learn for noob, who want to learn ml. Have knowledge of python.
arctic wedgeBOT
Hey @lapis sequoia!
Uh-oh! It looks like your message got zapped by our spam filter. We currently don't allow .txt attachments, so here are some tips to help you travel safely:
• If you attempted to send a message longer than 2000 characters, try shortening your message to fit within the character limit or use a pasting service (see below)
• If you tried to show someone your code, you can use codeblocks
(run !code-blocks in #bot-commands for more information) or use a pasting service like:
 kindred radish
Ok this is driving me crazy, can someone confirm something about neural networks:

These neurons/nodes... do they ALL have summation and activation functions in them?
This is how i thought a single layer perception looked:

Where the circle and box are the summation and activation functions respectively
But this confuses the "input layer" and "output" layer terminology.
(please ping me!)
 fading thunder
kindred radish
These neurons/nodes... do they ALL have summation and activation functions in th...
fading thunder
kindred radish
These neurons/nodes... do they ALL have summation and activation functions in th...
yes. Break down the whole diagram and try doing it layer by layer.
fading thunder
torn pollen
Is it correct that with the right training, I can setup a tensorflow AI with pyt...
Yep, you can try something like an image captioning model to start with.
 late shell
Hello, I'm learning about regression algorithms, and I'm having trouble understanding the Support Vector Regression. I don't understand why we want to minimize the coefficients vector w? Also how does C play a role in affecting the model? I read this explanation of C on youtube : How much should an SVM/SVR care about getting everything right vs getting the things that it gets right very right. But I don't really get it. Can someone please explain it in noob language. Thanks
 desert oar
@kindred radish the terminology is indeed confusing, for the reason you mention: the idea of a "layer" doesn't make sense when you think of a neural network as a sequence of data transformations
fading thunder
upper stirrup
Hi everyone!<:lemon_pleased:754441880263196742> Can someone help me "Natural La...
Hi, there are many ways to do it, if you use tensorflow, you can take a look at tokenizer().
desert oar
@kindred radish maybe it's best to think of a "layer" as "the data resulting from a transformation", if that helps at all. Also, not all "layers" are neatly divisible into "linear component" and "elementwise activation", cf. convolutional layers, attention units, softmax output layer, etc.
fading thunder
late shell
Hello, I'm learning about regression algorithms, and I'm having trouble understa...
C is basically inverse of alpha/lambda(in logistic regression) it does the opposite here in SVMs.
late shell
I'm sorry, I've not yet read about logistic regression. I'm a beginner.
The course I'm following instructs us to study about SVR before SVM, that doesn't make sense to me though.
fading thunder
late shell
I'm sorry, I've not yet read about logistic regression. I'm a beginner.
Oh, I recommend you start with logistic regression before moving on to SVMs.
SVMs are tricky compared to Logistic regression.
late shell
fading thunder
Oh, I recommend you start with logistic regression before moving on to SVMs.
SVM...
oh
okay
alright, thanks @fading thunder
fading thunder
late shell
alright, thanks <@!644189026420654090>
You can check for Andrew Ng's Machine learning playlist in youtube or coursera.
And follow it until you reach SVMs
desert oar
late shell
Hello, I'm learning about regression algorithms, and I'm having trouble understa...
This is a technique called "regularization". The very general idea is that if the weights are "small", then our estimates are closer to a common "baseline" estimate, and we aren't making wildly strong predictions and/or making wildly large changes in predictions for small changes in the input data.
This helps prevent overfitting, at the cost of "shrinking" our predictions towards a baseline and potentially reducing the sensitivity of the model to variation in the inputs. In the extreme case, an over-regularized model might predict the same output for every input.
By adding the total size of the weights into the objective function, we are telling our optimization process penalize bigger weights and prefer smaller weights. We control the strength of the penalty by adjusting C.
On the math side of things, this technique is an application of something called "Lagrange multipliers" that you will learn about in university-level calculus courses.
The technique of regularization by penalizing the "size" of the weights is quite general and you will see it appear in different types of machine learning models.
Edit: specifically in the context of an SVM, the optimization problem is not possible to solve without this weight penalization thing... there are other mathematical interpretations for what is happening here.
lapis sequoia
somebody here can help me get all plugins i need in pycharm for an own voice asisstented i cannot download them and i dont know why
kindred radish
desert oar
<@!248911149767065610> maybe it's best to think of a "layer" as "the data result...
Thank you for this, I think the second diagram that I made is correct then according to what you're talking about?
The "input layer" are nodes that provide data
The middle layer (or hidden layers in the case of MLPs) are nodes that contain AFs
The "output layer" are nodes that contain the output layer?
Actually, this means this line from: https://scikit-learn.org/stable/modules/neural_networks_supervised.html#regression
Class MLPRegressor implements a multi-layer perceptron (MLP) that trains using backpropagation with no activation function in the output layer, which can also be seen as using the identity function as activation function.
Doesn't make sense?
Like, i guess the "output layer" is the "outer-most hidden layer"?
according to that diagram i made?
desert oar
I'd rephrase it as, the output layer is just the last layer. And the input layer is a special case where the data flows in from "outside", rather than resulting from a computation.
kindred radish
Right I think that clears that up nicely? Lemme sketch something quick
desert oar
A "layer" itself is a computation with inputs and outputs. The idea of a layer as "a bunch of nodes" kind of breaks down once you get away from fully-connected multilayer perceptron models.
late shell
desert oar
This is a technique called "regularization". The very general idea is that if th...
Wow, that was so informative, thank you very much sir. 🙌
grave frost
Noob Question: why can't the attention mask have values between 0 and 1 (rather than only 0 and 1)? Kind of thinking them as weights for instance, then if I want the model to have partial attention to a token, can't I use something like [0, 0.5, 0.8, 1, 1]??
kindred radish

Would this be right?
each circle represents a node that contains AFs and the like
 wild dome
I'm trying to detect the circle of the wheel and draw its shape on the image

this is what I have but it's not working
img = cv2.medianBlur(img, 7)
circles = cv2.HoughCircles(img, cv2.HOUGH_GRADIENT, 1, 300, param1=30, param2=45, minRadius=0, maxRadius=0)
for c in np.uint16(np.around(circles))[0, :]:
    a, b, r = c[0], c[1], c[2]
    cv2.circle(img, (a, b), r, (0, 255, 0), 2)
plt.imshow(img, 'gray');
how can I adjust the parameters?
timid halo
wild dome
how can I adjust the parameters?
try maxRadious something else than 0
 timid halo
wild dome
timid halo
wild dome
well, it's a progress, better more than none, amirite? apparently it's seeing everything else but the one circle in the middle 😂
wild dome
timid halo
well, it's a progress, better more than none, amirite? apparently it's seeing ev...
exactly hahaha
do I have to apply more filters? reduce more noise?
timid halo
that would be the next step, yea
 tawdry hamlet
With Wasserstein GANs, how easily comparable are Critic outputs as metrics? I understand that the Critic doesnt output a 0-1 probability of the data being fake/real and instead is more of an abstract score reflective of 'real-ness', but I am not sure if a battery of Critic outputs are 'comparable' between runs?
I have a WGAN model that at the end of training runs the original dataset through the Critic and records the output for every datapoint and im trying to see whether or not by repeating this many times to produce many runs I can take the mean of each run for each datapoint as a means of aproximating a score of normality for the purposes of outlier detection
Anyone know anything about that sort of thing?
mint palm
wild dome
its actually so funny to see nn mistakes for the first time in vision
this gets me excited for upcoming computer vision lectures
😆
desert oar
kindred radish
Honestly... I think you are overthinking the whole nodes and layers things
But yes, that diagram looks fine
desert oar
Oh? What's the topic?
iron basalt
kindred radish
I'm writing a dissertation about it so I have to be specific hahaha

Home page: https://www.3blue1brown.com/
Help fund future projects: https://www.patreon.com/3blue1brown
Additional funding for this project provided by Amplify Partners
An equally valuable form of support is to simply share some of the videos.
Special thanks to these supporters: http://3b1b.co/nn1-thanks
Full playlist: http://3b1b.co/neural-netw...
A neural network diagram is just a computation graph, but specific to processes which very loosely mimic neural networks.
green owl
Hi all I currently trying to write program to scrape numerical data from a website, but I am having a hard time finding any tutorials on finding some reference material or code to extract the: Date, Volume & Short Volume from a table


Can anyone help or point me in the right direction? can't seem to figure out how to get the table
 median ember
Hello, I have a numpy question ( likely a matrix operation )
I have 2 arrays, A and B, with sizes 2,3 and 3,3
I want to subtract A - B in a way that I would have a result with the shape 3,2,3 or 2,3,3 with all the results
is this possible?
@tidal bough is it better?
tidal bough
median ember
Hello, I have a numpy question ( likely a matrix operation )
I have 2 arrays, A ...
Hmm, not quite clear what your result should be. Like, if C is the result, what would be the formula for C[i,j,k]?
(like how, for example, for elementwise multiplication C[i,j] = A[i,j] * B[i,j])
you might be looking for np.subtract.outer, but that would be an array of shape 2,3,3,3 with formula C[i,j,k,l] = A[i,j] - B[k,l].
median ember
tidal bough
you *might* be looking for `np.subtract.outer`, but that would be an array of sh...
will look into that, thanks!
but basically I want every element of A iterate through every element of B and return the results
when the arrays have same size, I use a for and np.roll
like this:
A = [...]
for i in range(A.shape[0]):
    B_shifted = np.roll(B, i, axis=0)
    C = A - B_shifted
but since they don´t have same size, I can´t do that
median ember
tidal bough
you *might* be looking for `np.subtract.outer`, but that would be an array of sh...
this outer thing is really cool, I think it will work! thanks
desert oar
@serene scaffold i think i forgot to share this the other day, this was that pd.concat thing we were doing, but in hy:
(require [hy.contrib.walk [let]])
(import [pandas :as pd])

(setv df1
  (pd.DataFrame {"x" [1 2 3]
                 "y" [4 5 6]}
                :index ["a" "b" "c"]))

(setv df2
  (pd.DataFrame {"x" [11 22 33]
                 "y" [44 55 66]}
                :index ["c" "b" "a"]))

(defn myfunc [v1 v2]
  "Silly function for demo purposes"
  (/ (+ (get v1 "x")
        (get v2 "y"))
     2))

(setv result
  (let [myfunc2 (fn [row] (myfunc (get row "x")
                                  (get row "x")))]
    (doto
      (pd.concat {"x" df1 "y" df2} :axis 1)
      (.apply myfunc2 :axis 1))))

(print result)
scheme-like language that compiles to python 🙂
ah, i seem to be using doto wrong, but this works:
(require [hy.contrib.walk [let]])
(import [pandas :as pd])

(setv df1
  (pd.DataFrame {"x" [1 2 3]
                 "y" [4 5 6]}
                :index ["a" "b" "c"]))

(setv df2
  (pd.DataFrame {"x" [11 22 33]
                 "y" [44 55 66]}
                :index ["c" "b" "a"]))

(defn myfunc [v1 v2]
  "Silly function for demo purposes"
  (/ (+ (get v1 "x")
        (get v2 "y"))
     2))

(setv result
  (let [myfunc2 (fn [row] (myfunc (get row "x")
                                  (get row "x")))
        df (pd.concat {"x" df1 "y" df2} :axis 1)]
    (.apply df myfunc2 :axis 1)))

(print result)
Why have you done this
velvet thorn
^
desert oar
why not?
in fact, why wouldnt everyone do this
ive actually written datascience code like this, its not that bad
although i think lisp is better left as an application dev language style, too verbose to comfortably express "math" in lisp
I would definitely write ETL code this way though
run it on pypy for extra zoom
it even supports type annotations
serene scaffold
but do you get an optimization if you use them?
 exotic maple
a quick question folks, jus to make sure I have to idea right.
In general, cross_validation is performed to estimate the classifier / regressor performance on the training set (and skips the need for a validation split). Cross_val doesn't train a model, but only provide a estimation of performance.
Grid_search is used for hyperparameter tuning the selected model; grid search finds and remembers the "best" parameters for the scoring selected. A grid CAN be used for predictions.
Is this correct?
desert oar
serene scaffold
but do you get an optimization if you use them?
Not as of this version but theoretically they could add tail call elimination, peephole optimizations, etc
But sometimes it's better to let the runtime do its own optimization. Although TCO would be really cool
It's probably better that the generated python easy to reason about and mostly 1:1 with the hy code
 dapper swan
Sorry to bother... It might be a dumb question but...
Does anyone know why I got different Coefficient with sklearns's LinearRegression and statsmodel's OLS ?
This is sklearn's result

while OLS's result like this...
only Year's coef same
 desert oar
@dapper swan what's the .intercept_ of the sklearn model?
dapper swan
desert oar
<@!460421454392066048> what's the `.intercept_` of the sklearn model?
-88254.65075453684
desert oar
maybe something is different in how the categorical State feature is expanded. can you show your code for both?
iron basalt
desert oar
why not?
Cost benefit analysis of a new programming language: Benefits: a syntax that you prefer | Costs: More code = more problems, you need to now learn a new language, everyone else that you work with needs to learn a new language, the language needs to be maintained, new programmers at the company need to learn this language making the hiring process a nightmare. Overall, more technical debt with no gain other than "I like it".
Not to misunderstand though, I like the idea of trying new programming languages and making them, but one must always be honest with oneself about the costs and benefits. Making a language worth adopting is hard since it requires some extreme benefits.
dapper swan
desert oar
maybe something is different in how the categorical `State` feature is expanded....
This is sklearn's code (I just made a little modify)
 iron basalt
(The benefits for many actually comes through the standard library, not the language itself (it's why a language tends to take off (see ruby on rails, jquery, etc)).
dapper swan
And here is statemodel's
 iron basalt
(Or in the case of something like python, a giant distributed globally accessible library pool via pip)
desert oar
iron basalt
Cost benefit analysis of a new programming language: Benefits: a syntax that you...
To be clear, Hy is entirely a "because i like it" project
iron basalt
desert oar
To be clear, Hy is entirely a "because i like it" project
Yeah, that's totally alright. I just want to clarify why some programmers might be like "why?". They are typically expecting some killer feature (or library).
Or some more subtle "restrained" approach, like Rust in which the goal is to make things more safe or stable, etc.
desert oar
I have snuck into into a couple script at work but
iron basalt
The main advantage that something like Lisp has is that it's easy to implement, so back in the day when you were stuck in assembly and you wanted to quickly get out of assembly, you could quickly make Lisp.
desert oar
I do think that lisp like languages can express certain kinda of ideas and programs very elegantly
"Real" lispers seem to treat lisp as a kind of smalltalk style all-encompassing environment
I don't feel that way about it
But i do think there are some advantages to lisp and it certainly has its joys, although I don't believe any lisp will ever gain adoption at the level of python
@dapper swan do you mind sharing your code as text and not as a screenshot?
!code-block
arctic wedgeBOT
Here's how to format Python code on Discord:
```py
print('Hello world!')
```
These are backticks, not quotes. Check this out if you can't find the backtick key.
iron basalt
(Also back then, Lisp's macros and meta-programming ideas were new-ish (in terms of popularity), but these days there is nothing stopping someone from making something like python or C but with Lisp-like macros or even cleaner).
desert oar
iron basalt
(Also back then, Lisp's macros and meta-programming ideas were new-ish (in terms...
ahem Julia
iron basalt
desert oar
*ahem* Julia
+1
desert oar
(Crystal and Nim also have strong syntactic macros, OCaml has its macro PPX thing, Idris has elaborator reflection, et al)
iron basalt
I am currently awaiting a bunch of C++ replacements to have such strong macros, Rust has some pretty ok ones.
desert oar
Does D have good macros?
iron basalt
IDR, but D has kind of fallen off in favor of Rust, Zig, etc in the systems software space. Garbage collection has no place there.
desert oar
Anyway the pandas and numpy apis do not work that well with Hy and you'd want to work up some nice macro DSL for it
desert oar
exotic maple
a quick question folks, jus to make sure I have to idea right.
In general, cros...
Kinda, but i think maybe focus on the concepts rather than the sklearn implementation thereof. Cross validation is a technique for estimating out of sample performance by slicing up your data and training the model on different slices of the data. Grid search means defining a grid of model parameters and fitting the model at each point on the grid, picking the best performing model. The standard "intro to ML" approach is to use grid search with cross validation at each point in the grid
The scikit learn implementation of grid search does give you the convenience of keeping the best-performing model for you and letting you make predictions from it
exotic maple
to use them together I can use the CV parameter of sklearn?

if im not mistaken the "folds" would CV -1, no?
desert oar
exotic maple
if im not mistaken the "folds" would CV -1, no?
I'm not sure what you mean by that
exotic maple
thanks! 🙂 I feel like i've gotten most of these things but im still missing some important bits of the basics >.<
exotic maple
desert oar
I'm not sure what you mean by that
ignore that i was reading something else and it got mixed on my head lol
 inland zephyr
I have problem when try to extract face with MTCNN library. I put my mtcnn as function:
     face_detector = MTCNN()
     detected = face_detector.detect_faces(img)
     return detected```
and run it with this:
from skimage import io as ios
from mtcnn.mtcnn import MTCNN
...
img = ios.imread(images)
detected_faces = face_detector(img)
if len(detected_faces) > 0:
k = detected_faces[0]
...
it raise error: ```ValueError: Input 0 of layer conv2d_3444 is incompatible with the layer: expected axis -1 of input shape to have value 3 but received input with shape [None, 272, 507, 4]``` which I know something wrong with the model. frosty hamlet
Hello guys so I have a pretrained Pix2Pix GAN (pytorch) model that takes an input edge drawing and from one folder and output the drawing colored in essentially. Im currently trying to build a web application that would allow for users to upload there own drawings and receive the generated results.
What would be some technical solution to implement this?
median ember
frosty hamlet
Hello guys so I have a pretrained Pix2Pix GAN (pytorch) model that takes an inpu...
use flask to build the api that receives the file and returns the generated image
 potent badge
How do the depth and width of a deep neural network play into the mean and variance
 winged yew
do i need external GPU or i can run with my intel UHD 620 graphics card to learn deep learning ?
median ember
winged yew
do i need external GPU or i can run with my intel UHD 620 graphics card to learn...
the better the GPU, faster the training... and I´m not sure you can use intel´s gpu to train
I know tensorflow only supports nvidia ( AFAIK )
edit: tensorflow supports AMD too https://medium.com/analytics-vidhya/install-tensorflow-2-for-amd-gpus-87e8d7aeb812

Medium
AMD has released ROCm, a Deep Learning driver to run Tensorflow-written scripts on AMD GPUs. However, many owners and I have encountered…

TensorFlow
exotic maple
frosty hamlet
Hello guys so I have a pretrained Pix2Pix GAN (pytorch) model that takes an inpu...
You can use streamlit

Streamlit is an open-source app framework for Machine Learning and Data Science teams. Create beautiful data apps in hours, not weeks. All in pure Python. All for free.


 old grove
 bold timber
You need to transform all values to numerics via standard scaling or whatver fits so... and then train... Strings aren't interpteted by models, we need convert and transform them into numerics 😃... Normalize them from what i think
inland zephyr
 slate hollow
wait nvm
slate hollow
wait nvm
do you use early stopper... it seems you have achieve 0.98 acc but still retrain again
 frank acorn
Apache Hadoop or Spark which one should i preffer. I'm a junior in college and i'm interested in data analytics.
 carmine finch
Hello has anyone worked with databases before please someone DM or anything i need help 🙂 thanks hope someone helps me
lapis sequoia
Hi guys I scraped some e-commerce dataset and posted it in kaggle. There's product, shop, and text data. I would like to see how an experienced data analyst/scientist would approach the dataset and its shortcomings etc. I would really appreciate it if someone can give a minute or two to see this dataset.. https://www.kaggle.com/jaepin/shopeeph-koreantop-clothing thanks

E-commerce Dataset, Sales & Reviews
kindred radish
desert oar
Oh? What's the topic?
It's about using machine learning to improve industrial practice. I'm a physics student so this whole paper is going to go over my supervisor's head lmao. So if i can explain everything as concisely and clearly as everything I should hopefully do well
 modern swift
lapis sequoia
Hi guys I scraped some e-commerce dataset and posted it in kaggle. There's produ...
modern swift
lapis sequoia
Hi guys I scraped some e-commerce dataset and posted it in kaggle. There's produ...
Obvious first steps would be to impute missing data, like in the "Brand" col of shopee_ktops_main.csv.
You could try to find/come up with some questions you would like answer, then try to answer them (in this order). For example: does Brand influence average likes, prices, etc
Another question would be the interaction of comments and ratings. You could try some sentiment analysis, but I think your translations would need some love for that first 🙂
lapis sequoia
modern swift
Obvious first steps would be to impute missing data, like in the "Brand" col of ...
Thanks for your reply. I'm actually working the translations, rather than trying to feed it to nltk with no language support for tagalog.
 red hound
Recently i'm doing a lot of work on sequential data like for example log-files. I would like to maken a comparison of LSTM vs. CNN on generating and separately classifying those samples. Can you recommend a setup, an architecture or anything to compare both types of networks to get meaningful results? Would be awesome to let me know your thoughts
modern swift
lapis sequoia
Thanks for your reply. I'm actually working the translations, rather than trying...
am I missing something or why arent you using something like google translate?
lapis sequoia
I actually did. The googletrans package was really unstable. It wouldn't detect the source language, and got buggy along the process. I translated it via deep-translator module. It was more stable, but still had some issues.
 tough cosmos
Can anyone recommend a startup related to data science ?
lapis sequoia
modern swift
am I missing something or why arent you using something like google translate?
Do you have any recommendation?. I was planning on using spacey because it has language support. I would probably remove the translated column and just go ahead with the native language.
bold timber
Hi, I have a question: what of condition to build a training set and test set in Decision Tree Regression?
inland zephyr
bold timber
Hi, I have a question: what of condition to build a training set and test set in...
For regression things there's no something specific dataset structure for what's in your dataset, the different is the target is something that you want to predict is not a class.
its also same as how to built the dataset for the classifier task too
oh anyway... i have specific question about storing preprocessed datasets. I have let say a 2*n array of feature and 1 class of data which will i used for classification in CNN. The feature taken from a quantized soundwave (so it must be array) with two channel (that's why the dimension is 2 times n when n is the length of the signal). Since pandas are not design to store this kind of data structure , is there the alternative to store the data? so it will have structure like this:
record|min|data                                   |class
--------------------------------------------------------
0001  |1  |[[0.011,...,0.01],[-0.1010,...,-0.001]]|1
since as far my experience Pandas cannot store data like this so i looking for other alternatives.
desert oar
inland zephyr
oh anyway... i have specific question about storing preprocessed datasets. I hav...
You can put arrays as values in a DataFrame or Series. And the parquet file format supports array valued columns, although not multidimensional arrays. Unsure if pandas can store and recover array dimensions for you in parquet, you might have to flatten the array and store the shape in a separate column
Another option is a nested list of lists https://stackoverflow.com/a/56288696

Stack Overflow
I'm trying to save a pandas dataframe to a parquet file using pd.to_parquet(df).df is a dataframe with multiple columns and one of the columns is filled with 2d arrays in each row. As I do this, I
Or write your own routine with pyarrow https://mungingdata.com/pyarrow/parquet-metadata-min-max-statistics/
This post explains how to create a Parquet file with PyArrow and how to read Parquet footer metadata like the compression algorithm and min / max column statistics.
 gleaming oyster
Hey, how do I know if each value in a Series is a number and, if so, divisible by 10?
I've tried (df[1].str.isnumeric() & df[1].astype(int).mod(10) == 0) but it will stop at any non-numeric value as it can't convert it.
(Don't know if I can ask this here or it has to be on the help channels)
tidal bough
gleaming oyster
Hey, how do I know if each value in a Series is a number and, if so, divisible b...
Yeah, it's fine in this channel.
I'd do:
inds = df[1].str.isnumeric()
inds2 = df[1][inds].astype(int).mod(10) == 0 # check only the numerical ones
# and then combine them, which I think would be
inds = inds[inds2]
inds = inds[inds2] does not work (IndexingError), but inds = inds & inds2 does the job. Thanks!
gleaming oyster
tidal bough
Yeah, it's fine in this channel.
I'd do:
```py
inds = df[1].str.isnumeric()
inds...
If I were to get multiple conditions out of a Series is that approach acceptable? Say there was an inds3 or inds4
potent badge
How would the depth and width of a deep neural network play into the mean and variance?
tidal bough
gleaming oyster
`inds = inds[inds2]` does not work (IndexingError), but `inds = inds & inds2` do...
not sure the latter does the right thing, hmm
because I think inds2 would be shifted compared to inds
gleaming oyster
tidal bough
because I think `inds2` would be shifted compared to `inds`
true, just noticed
tidal bough
like, say inds is [1,3,5], and df[1][3] is the only one that's 0 mod 10. Then inds2 would be [1], I think, meaning that only the second element of inds fullfills it
maybe inds = np.array(inds)[inds2] or something
gleaming oyster
tidal bough
like, say `inds` is `[1,3,5]`, and `df[1][3]` is the only one that's 0 mod 10. T...
I just tested, it skips over indexes so while it has less elements it's still the same indexes
x = pd.Series(['1', 'data', '3', '5'])
inds = x.str.isnumeric()
inds2 = x[inds].astype(int).mod(5) == 0
inds = inds & inds2
works and outputs False, False, False, True
bold timber
Anyone can tell me what the meaning of first line in that cell?
 tidal bough
bold timber
Anyone can tell me what the meaning of first line in that cell?
tidal bough
bold timber
Anyone can tell me what the meaning of first line in that cell?
This creates X_grid.
as for how it works, well:
!docs numpy.arange
arctic wedgeBOT
numpy.arange([start, ]stop, [step, ]dtype=None, *, like=None)```
Return evenly spaced values within a given interval.

Values are generated within the half-open interval `[start, stop)` (in other words, the interval including *start* but excluding *stop*). For integer arguments the function is equivalent to the Python built-in *range* function, but returns an ndarray rather than a list.

When using a non-integer step, such as 0.1, the results will often not be consistent. It is better to use [`numpy.linspace`](https://docs.scipy.org/doc/numpy/reference/generated/numpy.linspace.html#numpy.linspace "numpy.linspace") for these cases.I mean what is correlation on plot in graph? Can you explain to me how the first line in that cell can visualizing the plot?
tidal bough
it doesn't; it create a bunch of evenly spaced points
they are later used as the X values for the plot
huh?
bold timber
tidal bough
huh?
What?
tidal bough
I don't really get what you're asking
bold timber
I mean if i count a grid for X --> len(X_grid) I get 900
And my question is, Why in that plot has only 10 dots?
wait...
Oh I know
900 for Position level, right?
that is for drawn of scale on axis, right?
tidal bough
X_grid is for drawing the blue line
the red points are placed separately
there's 900 points in the blue line (but they are too close to see where the line passes through them)
bold timber
tidal bough
there's 900 points in the blue line (but they are too close to see where the lin...
Yeah I understand now. Thank you!
bold timber
tidal bough
X_grid is for drawing the blue line
But, can u explain me what the meaning of 1 in that cell? What is impact to visualization of Decision Tree Regression?
 tidal bough
This reshapes the input from (900,) to (900,1) - from 1d to 2d
that's required for the input to the model
basically, the input needs to be 2d, even if each sample is just 1 number.
bold timber
tidal bough
This reshapes the input from `(900,)` to `(900,1)` - from 1d to 2d
Can u explain to me how the logic can be visualizing from 1d to 2d?
Sorry, I still don't understand about that
Because I'm beginner in Machine Learning
tidal bough
no real visualization here, it's just that 1d arrays are considered different from 2d arrays with a second shape of 1
even though they are laid out the same way
bold timber
tidal bough
even though they are laid out the same way
Why if I change a number of 1 to 2 the result is error?
tidal bough
Why'd that array be reshapable into len(X_grid),2? It'd imply that len(X_grid) == len(X_grid)*2, not really possible 🙂
bold timber
tidal bough
Why'd that array be reshapable into `len(X_grid),2`? It'd imply that `len(X_grid...
Whether that's mean an array to be vertical sequence?
 molten hamlet
Can someone help me find module that helps calculation of variogram 2D?
 sharp vale
grave frost
kindred radish
It's about using machine learning to improve industrial practice. I'm a physics ...
sharp vale
grave frost
kindred radish
It's about using machine learning to improve industrial practice. I'm a physics ...
If you formalize it, and your professor did not skip his maths classes - I don't see why it would go over his head as long as the models are relatively simple (which to me seems MLP you are using)
he won't be an expert, but atleast he would have a decent idea
tidal bough
that's pretty optimistic
professional scientists in hard fields absolutely can be totally ignorant about computers, sadly
 brittle turtle
hi I'm supposed to find a model for the data provided and plot it, can someone help me take a look and see if its alright

 grave frost
tidal bough
professional scientists in hard fields absolutely can be totally ignorant about ...
grave frost
tidal bough
professional scientists in hard fields absolutely can be totally ignorant about ...
not mathematics surely 😮
grave frost
if a physician doesn't know maths/calc/lin algebra how do they do physics?
Im pretty convinced they can get atleast a basic and rough idea of how MLP works from the formalization
 kind cedar
Hi, i'm working with pandas, I was wondering if there was a way to group data and count according to column value? Here is an example of my dataframe and what I would want.

 noble nimbus
Hi everyone.
I'm currently working on a news aggregator and I want to group same-topic news. As my dataset will be continuously increasing, so I want to use Incremental Clustering.
Q 1: Is "Incremental Clustering" a name of some algorithm or is it a way of clustering?
Q 2: If "Incremental Clustering" is not an algorithm but an approach, then tell me what specific algorithms will help me.
Request: Please suggest some good tutorials (Python preferred).
wild dome
I'm using 'gray' as argument when plotting because the image is in grayscale but I need the circle to be displayed in color, how can I do that
img = cv2.medianBlur(img, 5)
img = cv2.GaussianBlur(img, (5, 5), 0)
img = cv2.medianBlur(img, 5)
circles = cv2.HoughCircles(img, cv2.HOUGH_GRADIENT, 2, 1000, param1=10, param2=10, minRadius=0, maxRadius=0)
for c in np.uint16(np.around(circles))[0, :]:
a, b, r = c[0], c[1], c[2]
cv2.circle(img, (a, b), r, (0, 0, 255), 2)
plt.imshow(img, 'gray');``` kindred radish
grave frost
If you formalize it, and your professor did not skip his maths classes - I don't...
kindred radish
grave frost
If you formalize it, and your professor did not skip his maths classes - I don't...
Stochastic gradient descent is pretty simple for a physicist so it's not that which will go over his head. I've spoken about spectral clustering which uses node networks which definitely could.
Part of it as well is I don't want to bore them
Because they might not be interested in
desert oar
wild dome
I'm using `'gray'` as argument when plotting because the image is in grayscale b...
Stack Overflow
I have a simple image that I'm showing with imshow in matplotlib. I'd like to apply a custom colormap so that values between 0-5 are white, 5-10 are red (very simple colors), etc. I've tried follo...
ah... you are actually adding the circle to the image
 old hatch
in pyspark, what's the best way to run some function over each row of a dataframe and map them to a new row with a different schema?
im a data science noob
 lilac raven
Why is extend replacing the previous array with the new one, instead of adding the new array to a list of arrays? ```if file.endswith("_MID-R1-ECG.1D_hrv.txt"):
full_name = pathlib.Path(root) / file
try:
read_fname = full_name
data = np.loadtxt(read_fname)
                    data_list = data.tolist()

                    data_list.extend(data_list)

                    c = np.array(data_list) ```
it seems to be just one single [x,x,x,x,x,x,x,x] array instead of [[x,x,x,x,x,x,x,x],[x,x,x,x,x,x,x]] which is what I would want
currently it replaces the first array with the second, as I just have two files in the folder to test it out
i thought extend would combine the separate arrays into a list of arrays
exotic maple
lilac raven
Why is extend replacing the previous array with the new one, instead of adding t...
you should be using append not extend
extend (merges) the two lists and creates a single longer list
append would "add" the 2nd list to the first one
what you should do is create a 3rd, upper lñevel list
and then append your data to it
lilac raven
so initialize a new list for them all?
exotic maple
no...
something like this
list_of_arrays = [] # master list to store the lists/arrays

if file.endswith("_MID-R1-ECG.1D_hrv.txt"):
                    full_name = pathlib.Path(root) / file
                    try:
                        read_fname = full_name
                        data = np.loadtxt(read_fname) # im assuming you're creating an array from text here

                        data_list = data.tolist()

                        list_of_arrays.append(data_list) #this will append the list-like array to the end of the master list
if for some reason you want to set those lists back to array you can do some list comprehension
list_of_arrays2 = [np.array(element) for element in list_of_arrays]
ah ok, that is working
and setting it back to arrays would allow to me to np.mean them im guessing
exotic maple
that depends on whatever you want to do
I'm not sure why you're converting them to list after reading them thou
but i'll leave your logic to you :p
lilac raven
originally thought I had to as I thought combining lists was easier than arrays
exotic maple
You can append any kind of object to a list.
 errant crown
I want to do the following:
If a user misspells a command or input or whatever my programm gives an output with relevant commands (based on the input and the using history) that are available
how would i do that?
 gloomy berry
errant crown
I want to do the following:
If a user misspells a command or input or whatever m...
gloomy berry
errant crown
I want to do the following:
If a user misspells a command or input or whatever m...
can u dm me if u know how?
errant crown
gloomy berry
can u dm me if u know how?
yup
maybe we have to research it on google or somthin because the ppl on this server dont seem to know how this works
gloomy berry
already went there
lilac raven
hmm I tried np.mean on the both versions, the list and array and I get the error ''function' object is not subscriptable'
errant crown
gloomy berry
already went there
maybe also look up the keyword fuzzy python package
seems to have something todo with this subject
errant crown
gloomy berry
this
yep
exotic maple
lilac raven
hmm I tried np.mean on the both versions, the list and array and I get the error...
first think exactly of what you want to do and then shape your data in accordance to it. You want to store the mean of each array in the list, NOT the arrays?
lilac raven
I want the mean of [x1,x2,x3,x4,x5] and [y1,y2,y3,y4,y5] like [x1+y1/n,x2+y2/n,etc]
np.mean with axis= 1 i thought would do that
exotic maple
lilac raven
np.mean with axis= 1 i thought would do that
yes, but they would need to be in a single array for that to work
I think @serene scaffold once showed me a way to compute the mean of a row/axis across many np.arrays, but I can't quite remember which function it was
serene scaffold
exotic maple
I think <@!253696366952316929> once showed me a way to compute the mean of a row...
!docs numpy.mean
arctic wedgeBOT
numpy.mean(a, axis=None, dtype=None, out=None, keepdims=<no value>, *, where=<no value>)```
Compute the arithmetic mean along the specified axis.

Returns the average of the array elements. The average is taken over the flattened array by default, otherwise over the specified axis. [`float64`](https://docs.scipy.org/doc/numpy/reference/arrays.scalars.html#numpy.float64 "numpy.float64") intermediate and return values are used for integer inputs.so I just need to make [[47.634249643827026, 48.707791774949484, 44.958609806628594, 46.17740725913995, 38.02733794748916, 38.1356384904845, 35.35533905932738, 35.68120160740313, 38.23956264058725, 40.523534677334084, 36.66523725058259, 31.91423692521127, 39.82019774119848, 40.08918628686366, 33.96831102433787, 59.219460014799566, 43.164887897106965, 44.69394835554186, 40.131993759056165, 75.0, 72.50760609188853, 28.4045450908509, 22.941573387056174, 26.28287415189234, 30.525697073419664, 37.17810563304078, 32.21390769615825, 23.27373340628157]] [[356.22258666457407, 349.47877856411634, 256.22921201710994, 251.57835094989127, 393.43572113709587, 204.17516989095418, 108.25317547305482, 109.66546927595373, 156.7907310185565, 215.62248388226018, 76.82953714410739, 131.98240351921797, 107.11309110334874, 100.0, 155.02932273957373, 267.6284738214527, 342.3813663153998, 289.35272592460575, 319.09348500700077, 277.6278189993808, 261.0439415001608, 229.46949688357273, 313.3243843228943, 250.97033910625996, 194.7798480058684, 326.25957840345467, 235.80044921893565, 140.24663149986463]] into one [.........] then?
serene scaffold
lilac raven
so I just need to make ```[[47.634249643827026, 48.707791774949484, 44.958609806...
you're trying to get the average of all the elements, regardless of the shape?
lilac raven
average of 47.6+356/n (for now n=2), 48.7+349.5/n, etc
they should all be the same shape
serene scaffold
lilac raven
average of 47.6+356/n (for now n=2), 48.7+349.5/n, etc
so given [[a, b, c], [d, e, f]], you want [(a+d) / n, (b+e) / n, (c+f)/n]?
lilac raven
yeah
 sly salmon
for linear regression, is the "weight" of a feature the same as the variance between our outcome and our feature?
lilac raven
but it will be much larger, x+y+z+..etc./n
just testing it out with these two files for now
serene scaffold
np.sum(arr, axis=0) / n will take the "vertical sum" (I just made that up) of your array
and then divide each element by n
lilac raven
seems to almost do it but it summing strangely
[47.63424964 48.70779177 44.95860981 46.17740726 38.02733795 38.13563849
 35.35533906 35.68120161 38.23956264 40.52353468 36.66523725 31.91423693
 39.82019774 40.08918629 33.96831102 59.21946001 43.1648879  44.69394836
 40.13199376 75.         72.50760609 28.40454509 22.94157339 26.28287415
 30.52569707 37.17810563 32.2139077  23.27373341]
[[356.22258666457407, 349.47877856411634, 256.22921201710994, 251.57835094989127, 393.43572113709587, 204.17516989095418, 108.25317547305482, 109.66546927595373, 156.7907310185565, 215.62248388226018, 76.82953714410739, 131.98240351921797, 107.11309110334874, 100.0, 155.02932273957373, 267.6284738214527, 342.3813663153998, 289.35272592460575, 319.09348500700077, 277.6278189993808, 261.0439415001608, 229.46949688357273, 313.3243843228943, 250.97033910625996, 194.7798480058684, 326.25957840345467, 235.80044921893565, 140.24663149986463]]
[356.22258666 349.47877856 256.22921202 251.57835095 393.43572114
 204.17516989 108.25317547 109.66546928 156.79073102 215.62248388
  76.82953714 131.98240352 107.1130911  100.         155.02932274
 267.62847382 342.38136632 289.35272592 319.09348501 277.627819
 261.0439415  229.46949688 313.32438432 250.97033911 194.77984801
326.2595784 235.80044922 140.2466315 ]```[47.63424964 48.70779177 44.95860981 46.17740726 38.02733795 38.13563849
35.35533906 35.68120161 38.23956264 40.52353468 36.66523725 31.91423693
39.82019774 40.08918629 33.96831102 59.21946001 43.1648879 44.69394836
40.13199376 75. 72.50760609 28.40454509 22.94157339 26.28287415
30.52569707 37.17810563 32.2139077 23.27373341]
[[356.22258666457407, 349.47877856411634, 256.22921201710994, 251.57835094989127, 393.43572113709587, 204.17516989095418, 108.25317547305482, 109.66546927595373, 156.7907310185565, 215.62248388226018, 76.82953714410739, 131.98240351921797, 107.11309110334874, 100.0, 155.02932273957373, 267.6284738214527, 342.3813663153998, 289.35272592460575, 319.09348500700077, 277.6278189993808, 261.0439415001608, 229.46949688357273, 313.3243843228943, 250.97033910625996, 194.7798480058684, 326.25957840345467, 235.80044921893565, 140.24663149986463]]
[356.22258666 349.47877856 256.22921202 251.57835095 393.43572114
204.17516989 108.25317547 109.66546928 156.79073102 215.62248388
76.82953714 131.98240352 107.1130911 100. 155.02932274
267.62847382 342.38136632 289.35272592 319.09348501 277.627819
261.0439415 229.46949688 313.32438432 250.97033911 194.77984801
326.2595784 235.80044922 140.2466315 ]```after converting back to element to array
serene scaffold
lilac raven
seems to almost do it but it summing strangely
there's too many numbers for me to ascertain what the problem is.
what is the shape of the array you're passing to np.sum?
lilac raven
hmm says list object has no attribute shape
data has a shape of 28 which is what I Want, but once I list_of_arrays.append(data) it has no shape
              if file.endswith("_MID-R1-ECG.1D_hrv.txt"):
                    full_name = pathlib.Path(root) / file
                    try:
                        read_fname = full_name
                        data = np.loadtxt(read_fname) # im assuming you're creating an array from text here

                        data_list = data.tolist()

                        list_of_arrays.append(data) #this will append the list-like array to the end of the master list
                        list_of_arrays2 = [np.array(element) for element in list_of_arrays]

                        print(list_of_arrays)
                        n = len(list_of_arrays)
                        s =  np.sum(list_of_arrays, axis=0) / n
print(s)```and getting [array([47.63424964, 48.70779177, 44.95860981, 46.17740726, 38.02733795, 38.13563849, 35.35533906, 35.68120161, 38.23956264, 40.52353468, 36.66523725, 31.91423693, 39.82019774, 40.08918629, 33.96831102, 59.21946001, 43.1648879 , 44.69394836, 40.13199376, 75. , 72.50760609, 28.40454509, 22.94157339, 26.28287415, 30.52569707, 37.17810563, 32.2139077 , 23.27373341])] [47.63424964 48.70779177 44.95860981 46.17740726 38.02733795 38.13563849 35.35533906 35.68120161 38.23956264 40.52353468 36.66523725 31.91423693 39.82019774 40.08918629 33.96831102 59.21946001 43.1648879 44.69394836 40.13199376 75. 72.50760609 28.40454509 22.94157339 26.28287415 30.52569707 37.17810563 32.2139077 23.27373341] [array([356.22258666, 349.47877856, 256.22921202, 251.57835095, 393.43572114, 204.17516989, 108.25317547, 109.66546928, 156.79073102, 215.62248388, 76.82953714, 131.98240352, 107.1130911 , 100. , 155.02932274, 267.62847382, 342.38136632, 289.35272592, 319.09348501, 277.627819 , 261.0439415 , 229.46949688, 313.32438432, 250.97033911, 194.77984801, 326.2595784 , 235.80044922, 140.2466315 ])] [356.22258666 349.47877856 256.22921202 251.57835095 393.43572114 204.17516989 108.25317547 109.66546928 156.79073102 215.62248388 76.82953714 131.98240352 107.1130911 100. 155.02932274 267.62847382 342.38136632 289.35272592 319.09348501 277.627819 261.0439415 229.46949688 313.32438432 250.97033911 194.77984801 326.2595784 235.80044922 140.2466315 ]
oops, also replacing list_of_arrays in the final few lines with list_of_arrays2 gives same output
lilac raven
Traceback (most recent call last):

  File "<ipython-input-333-83ca99a6c7b8>", line 1, in <module>
    list_of_arrays2.shape

AttributeError: 'list' object has no attribute 'shape'```list_of_arrays.shape
Traceback (most recent call last):
File "<ipython-input-334-637c734ee8f5>", line 1, in <module>
list_of_arrays.shape
AttributeError: 'list' object has no attribute 'shape'```no...I mean the actual arrays inside
how much Python do you know?
because it seems your struggles come a bit more from the fundamentals
try this:
for array in list_of_arrays:
array.shape
lilac raven
for array in list_of_arrays:
array.shape
array.shape
Traceback (most recent call last):
File "<ipython-input-336-270abd9e5a99>", line 1, in <module>
array.shape
AttributeError: type object 'array.array' has no attribute 'shape
im still learning definitely
lilac raven
(list_of_arrays[0])
Traceback (most recent call last):
File "<ipython-input-337-c9ed6307f273>", line 1, in <module>
(list_of_arrays[0])
IndexError: list index out of range
exotic maple
ok this is a bit frustrating
lilac raven
(list_of_arrays2[0])
Out[340]:
array([356.22258666, 349.47877856, 256.22921202, 251.57835095,
393.43572114, 204.17516989, 108.25317547, 109.66546928,
156.79073102, 215.62248388, 76.82953714, 131.98240352,
107.1130911 , 100. , 155.02932274, 267.62847382,
342.38136632, 289.35272592, 319.09348501, 277.627819 ,
261.0439415 , 229.46949688, 313.32438432, 250.97033911,
194.77984801, 326.2595784 , 235.80044922, 140.2466315 ])
exotic maple
lilac raven
(list_of_arrays2[0])
Out[340]:
array([356.22258666, 349.47877856, 256.22921202,...
ok this is an array. So do the following now
for array in list_of_arrays2:
array.shape
lilac raven
for array in list_of_arrays2:
array.shape
array.shape
Out[344]: (28,)
28 is good for each individual, but I wanted to combine the two individual files (arrays out of those files) into one so I can find the mean easily
late shell
hello, noob question : I was training a Support vector regression model when I realized that scaling the target variable significantly boosted the accuracy as opposed to where I only scaled the predictors. Can someone please explain the reason behind this? Why should scaling the target variable help in training the model in any way?
exotic maple
lilac raven
for array in list_of_arrays2:
array.shape
array.shape
Out[344]: (28,...
What I would do is:
Create individual arrays fo each file or whatever you're reading.
concatenate those arrays across an axis
calculate your resulting array across the desired axis
 inner estuary
Someone knows a good article explaining about facial recognition with python and could share with me please?
near cosmos
lapis sequoia
What do people actually use R for over Python?
I think data exploration, plotting, and anything from the statistics (vs comp sci) wing of modeling and analysis is better in R
assuming use of tidyverse
IME, a lot of research is still done in MATLAB. My sense is this is partly because of legacy/familiarity and lower incentives to learn new tools vs get work done, and partly because there really is good support and documentation for things like data acquisition and optimization. That's kind of mind-reading though--I'm not a fan of MATLAB
desert oar
near cosmos
I think data exploration, plotting, and anything from the statistics (vs comp sc...
I used to use R as my main language for work, pretty much this
I was blown away the first time i saw someone doing regression in matlab while they also had university access to stata
As silly as stata is, there is zero reason to use matlab over stata for just doing basic regression analysis
People are really weird when it comes to the tools they like
near cosmos
For a lot of users, the work of learning enough to be productive in one environment was tremendous. So they'll go through incredible pain to keep using that environment.
Also, "the last postdoc wrote it in matlab and gave me the script"
jade carbon
which we use for time series prediciton?
sparse categorical crossentropy or categorical crossentropy
 dusty turret
Any sample code for reading training data set of pdf containing scan image of restaurant invoice, and using nlp based model to extract total amount from receipt?
slate hollow
hey i'm trying to learn RNNs
and they say you define one in keras like so?
*:
keras.layers.SimpleRNN(1, input_shape=[None, 1])
the thing is, where do we specifify the number of times it's passed through?
exotic maple
jade carbon
which we use for time series prediciton?
**sparse categorical crossentropy** or ...
uh....none? I can't see how you can predict categories in a time series
But I can be extremely wrong as well
jade carbon
almost in every predictions, they use Dense(1) without any activation.
what should y choose for?
exotic maple
jade carbon
almost in every predictions, they use Dense(1) without any activation.
I'm assuming you mean some kind of binary classification problem?
I'm surprised...I've used sigmoid activation at the last layer for that kind of problem (kill me)
for cost function you may use...binary cross entropy i think its called
winged stratus
jade carbon
almost in every predictions, they use Dense(1) without any activation.
a single neuron layer can also be used as the output layer if you are doing regression, especially when they don't use any activation after it
exotic maple
winged stratus
a single neuron layer can also be used as the output layer if you are doing regr...
oooh ive never done regression thats why
slate hollow
hey i'm trying to learn RNNs
and they say you define one in keras like so:
keras.layers.SimpleRNN(1, input_shape=[None, 1])
the thing is, where do we specifify the number of times it's passed through?
jade carbon
winged stratus
a single neuron layer can also be used as the output layer if you are doing regr...
better not use activation?
winged stratus
jade carbon
better not use activation?
if you are doing regression, don't use a activation at the end
 worn hinge
So I've been thinking about learning how to do object detecting and stuff with opencv... However, I have no clue where I might start with that. Are there any resources for this type of stuff? (or maybe even just a list of relevant concepts that I can use to piece something together)
winged stratus
worn hinge
So I've been thinking about learning how to do object detecting and stuff with o...
im not an expert, but learning about filters and region of interest is generally useful
and on the model side, you could learn some R-CNNs or yolo models
worn hinge
I should maybe mention that I've got almost no prior knowledge about any of this
winged stratus
yeah, so learn about filters in image processing
and when you get an idea about that, you can move on to the other stuff
lapis sequoia
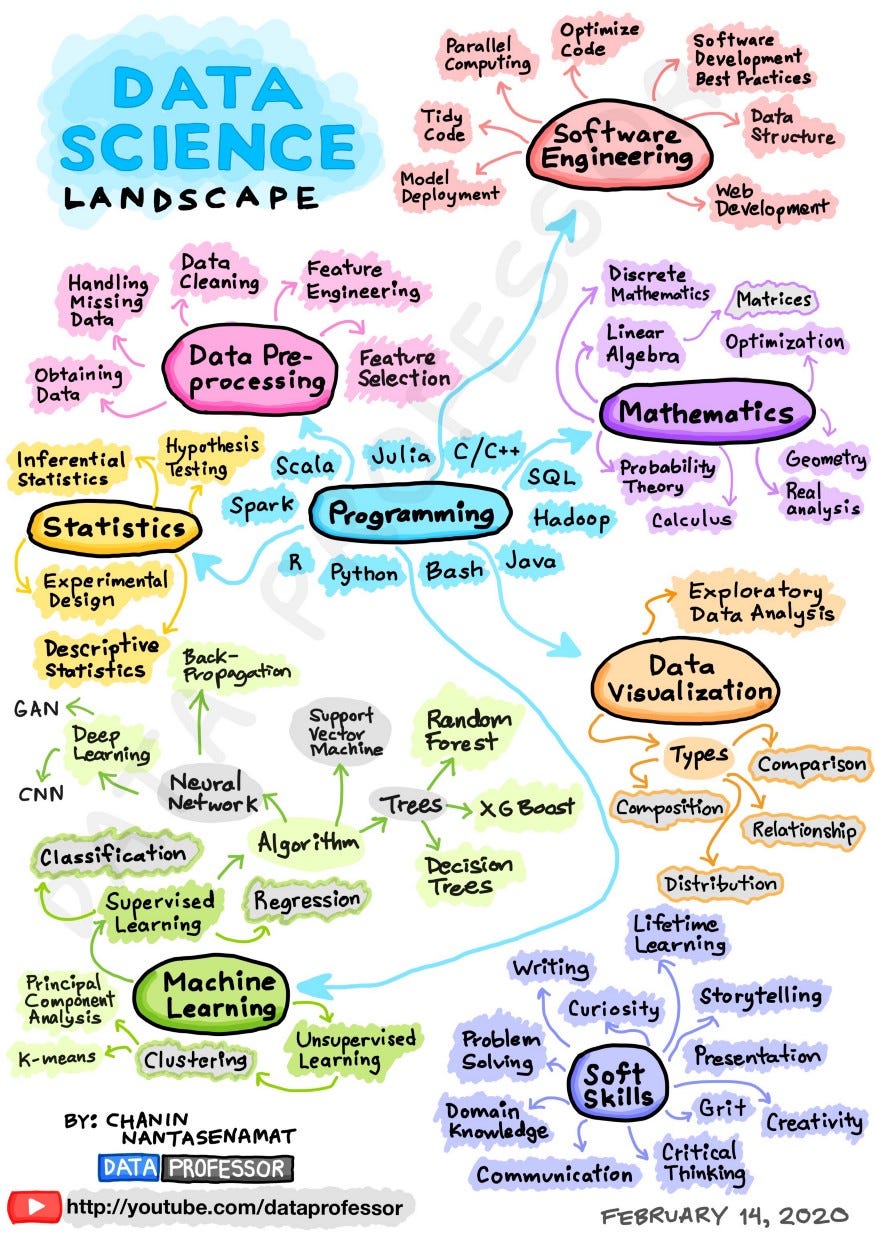
Hello Guys, I have written my first article on @Medium "A Guide On How To Become A Data Scientist - (Step By Step Approach)" for people who are either ... 10 comments on LinkedIn
near cosmos
worn hinge
So I've been thinking about learning how to do object detecting and stuff with o...
Maybe try pyimagesearch
 cyan lantern
anyone know if there is a way to reduce memory usage from scipy sparse matrices? trying to run a classification model with a pretty big dataset and it is way to expensive to run in terms of memory
kindred radish
Just a check about the precision and recall metrics
if i were to get a precision and recall of 50%, that implies the classifier is as good as a coin flip in making predictions?
(would reallllly appreciate an answer my dissertation is due soon!!)
cyan lantern
kindred radish
Just a check about the precision and recall metrics
that depends how you are computing them because there are multiple ways
cyan lantern
macro or micro?
kindred radish
uhhhhhhhh wdym
cyan lantern
you are using precision_score() function right?
kindred radish
aye and recall_score()
cyan lantern
so in these functions you can implement different ways of calculation
kindred radish
ohhh yeah i see them
cyan lantern
 kindred radish
I've been using 'binary'
as i'm using a binary classifier
ie. the output is either 1 or 0
cyan lantern
maybe try out different ones to see the difference
cyan lantern
kindred radish
I've been using 'binary'
oh in that case maybe it doesnt make a difference
but in general if you have an equal number of samples in each class then it will result in the same score (i think)
kindred radish
wait really, wouldn't that make them bad metrics then?
cyan lantern
sorry i mean macro and micro will result in same score
kindred radish
oh jesus that scared me hahahahaha
Otherwise my entire conclusion for my dissertation would have been fucked lmao
cyan lantern
so yeah it really depends on what the distribution is
jade carbon
winged stratus
if you are doing regression, don't use a activation at the end
okay, y see.
so how about loss?
winged stratus
jade carbon
okay, y see.
so how about loss?
probably mean squared error since its regression
jade carbon
even to non linear regression in time series prediction?
winged stratus
yeah, since the neural net itself is non linear
jade carbon
okay y see.
thx for helps!
 tacit palm
Hi was wondering if it was possible to do a linear regression
with multiple categorical variables
noble nimbus
Can anyone help me out with Incremental Clustering?
I want to group same-topic news but I seem to find either too advanced stuff, or just theoretical resources.
inland zephyr
I want to ask about Siamese NN implementation. According to the behavior of the model, it need 2 image to compare if both are similiar. In real world case, let said i have 1000 person in db and I need to compare a probably same person.
Is the better way to loop 1000 times and summarize the result (the minimum distance is the similar person), or is there way to parallelized the process?
jade carbon
should compare the images 1 by 1
inland zephyr
but i need loop rights? it will cost much if we talk about time and money cost, especially if i using API such AWS Rekognition or similar one
inland zephyr
i have read and examine this git https://github.com/tensorfreitas/Siamese-Networks-for-One-Shot-Learning and it said the evaluation using N-Way one shot task to evaluate the class. Could i can use it to predict the class or which image has nearest similarity to the inserted person?

GitHub
Implementation of Siamese Neural Networks for One-shot Image Recognition - tensorfreitas/Siamese-Networks-for-One-Shot-Learning
or should i use usual classification tasks for my case?
jade carbon
just siamese, count the limit classification
grave frost
🤣 🤣

Autocompletion, where an application predicts the next item in a text input, has become a convenient and widely used tool in contemporary messaging and other writing tasks. It is also one of the most important features of an integrated development environment (IDE) for computer programming. Recent research has shown that autocompletion can be po...
the research is that pre-training code on large models works better? how is that research???
if nobody has actually tried pre-training LM on code before, I am going to go and hang myself
 jade chasm
Hey guys, does anyone have any idea how to use monte carlo simulation for a continuous variable in python?

I've been breaking my head over this. This should be insanely easy
np.random usually deals with discrete probability density functions
I could calculate the CFD, but that wouldn't really help here, would it?
obviously, the CFD is just a straight line from 0 to 2.
my previous monte carlo esimates were among the lines of:
M = (3*(math.e**4))/103
p = lambda k: M * (((4 ** k) * (math.e**-4)) / math.factorial(k))
probs = [p(k) for k in range(5)]
print(probs)
sample_space = [k for k in range(5)]
# samples = np.random.choice(sample_space, size = 1000000, replace = True, p = probs)
# print((np.mean(samples)))

solution = {}
N=0
cumsum = 0
while N < 100000:
    N += 100
    counts = 0
    samples = np.random.choice(sample_space, size = 100, replace = True, p = probs)
    cumsum += sum(samples)
    solution[N]= cumsum/N
``` for different parts.If you have an idea, please @ me as I'll be alt-tabbing in a bit. You're a god if you give me the tip which helps me solve it, because I'm all out of idea's.
 harsh horizon
bold timber
But, can u explain me what the meaning of 1 in that cell? What is impact to visu...
harsh horizon
bold timber
But, can u explain me what the meaning of 1 in that cell? What is impact to visu...
Can you pass me your database and for me to study it please
bold timber
harsh horizon
Can you pass me your database and for me to study it please
You can find in google with keyword: Position_Salaries.csv
uncut barn
can anyone tell me what went wrong here?

 idle summit
missing ) for imshow function
uncut barn
ah thanks
idle summit
should be view(18, 28))
 silver widget
is there good source to study transformation of non-normally distributed data? I'd like to understand when to chose standarscaler, log transform, or boxcox etc.
 bronze skiff
jade chasm
Hey guys, does anyone have any idea how to use monte carlo simulation for a cont...
bronze skiff
jade chasm
Hey guys, does anyone have any idea how to use monte carlo simulation for a cont...
I think you already said it-- the CDF is a straight line from 0 to 2... conversely, it's hence easy to compute the inverse CDF, so now you just sample from a uniform distribution (np.random.rand) and pass those values through the inverse cdf and you have samples from your desired distribution
 wicked sierra
Any Natural language processing expert who can help me?
bronze skiff
@jade chasm take a look at https://en.wikipedia.org/wiki/Inverse_transform_sampling
jade chasm
bronze skiff
I think you already said it-- the CDF is a straight line from 0 to 2... converse...
I'm not sure how that would work, I'll take a look at your link
thanks for your insight by the way
 uncut monolith
i need some help with dash from plotly
does anyone have experience with this library here?
im using for a school project
 jaunty idol
upper stirrup
jaunty idol
upper stirrup
Hi. Required for word level tokenization to use Train / Val / Test splits?
serene scaffold
upper stirrup
Hi. Required for word level tokenization to use Train / Val / Test splits?
what are you trying to do?
upper stirrup
now I just try discover word level tokenization
 dapper halo
dummy question...how can you reset a dataframe index without dropping out any duplicates.
Trying to append data to end of a dataframe and at the end would just like to reset index so its sequential. But it always removes the additional rows I've added onto it
I guess reset is supposed to take it back to the original indexing....doesn't seem any of the commands lets you just overwrite the ordering
serene scaffold
upper stirrup
now I just try discover word level tokenization
you need to tokenize for any NLP task where work boundaries are important, but that's a separate consideration from splitting your data for training and evaluation. I don't see the connection.
mystic orchid
Hi everyone! What you can recommend to learn for noob, who want to learn ml. Have knowledge of python.
 gritty socket
anybody knows how can i search for a specific face on opencv like when i will show my face it will say jack when i show any other person it will say human
i want to make my own haarcascade file
serene scaffold
mystic orchid
Hi everyone! What you can recommend to learn for noob, who want to learn ml. Hav...
you should learn the basics of linear algebra and how to manipulate data with pandas.
there's also a lot of possible directions with ML, so you should look into what those are and pick one.
desert oar
- linear algebra: vector/matrix math and how to interpret matrices as systems of equations
- calculus: derivatives, convex optimization, at least conceptually know what an integral is (riemann sums)
- probability: random variables, mean / expected value, variance / std dev, conditional probability (bayes' theorem & law of total probability), law of large numbers, central limit theorem, bernoulli/binomial and gaussian distributions
- statistics: sample vs population, bias-variance tradeoff, cross validation, classical null hypothesis testing, linear regression, logistic regression
off the top of my head, those are probably the fundamental tools that you will use on a regular basis in machine learning
you don't have to learn all of it at once
imo the best place to start is basic data analysis (estimating mean and median, data visualization basics) and play around with real datasets using pandas and matplotlib.
you will build intuition and experience working with real world data
you'll start learning some of the core statistics vocabulary, and you'll gradually start to encounter things you don't understand from probability and stats
when you have a bit of comfort in that area, you can move on to more advanced problems. basically, start by getting hands-on with real data, while gradually expanding your sphere of understanding
but you absolutely need to be comfortable working with, visualizing, talking about, and thinking about data
flint mason
how to insert a dataframe in an sql database\
desert oar
flint mason
how to insert a dataframe in an sql database\
!d g pandas.DataFrame.to_sql
arctic wedgeBOT
DataFrame.to_sql(name, con, schema=None, if_exists='fail', index=True, index_label=None, chunksize=None, dtype=None, method=None)```
Write records stored in a DataFrame to a SQL database.

Databases supported by SQLAlchemy [[1]](https://pandas.pydata.org/pandas-docs/stable/reference/api/pandas.DataFrame.to_sql.html#r689dfd12abe5-1) are supported. Tables can be newly created, appended to, or overwritten.
Why filter has -1
Arent rgb for 0 to 255
And even if we only use grey scale ...isnt it 0 to up
desert oar
@mint palm often in machine learning we like to normalize data to the -1,1 or 0,1 range when we know it is bounded
here they normalized 255->1 and 0->-1
mint palm
While plotting will we have to take extra care for affects of normalization
desert oar
all closed intervals of real numbers are isomorphic 🙂 meaning you can always rescale an interval without losing any data
mint palm
Forming image i mean
desert oar
in matplotlib you should probably set the Z range manually
mint palm
Ok thank you
desert oar
https://matplotlib.org/stable/api/_as_gen/matplotlib.pyplot.imshow.html use the norm= parameter
default is 0,1 so if your data is -1,1 use norm=Normalize(-1, 1) https://matplotlib.org/stable/api/_as_gen/matplotlib.colors.Normalize.html#matplotlib.colors.Normalize
mint palm
Currently theory ...will see practical in weekend thank you though
desert oar
 flint mason
desert oar
!d g pandas.DataFrame.to_sql
flint mason
desert oar
!d g pandas.DataFrame.to_sql
that does not help in saving the data frame. I dont just want to operate on it
desert oar
flint mason
that does not help in saving the data frame. I dont just want to operate on it
that method does nothing but write a dataframe to a table
you can also manually iterate over rows with .itertuples and run an INSERT for each row
flint mason
desert oar
that method does nothing but write a dataframe to a table
yes but I am automating a script of datamining, so I need it to store it too
flint mason
desert oar
then use `.to_sql`
I tried this but where does it store data. The only path given to engine is SQLite
sorry I am automating for the first time
desert oar
did you read the docs?
flint mason
desert oar
did you read the docs?
yeah
desert oar
it says that you need to use the sqlalchemy library to create an "engine" object
then you pass the engine
flint mason
yes, I got that working.
desert oar
if you use sqlite you can use the sqlite connection object directly, as a special convenience case
flint mason
can I retrieve the data later when my complier has stopped working or reset?
mint palm
I requested permission @desert oar
mint palm
desert oar
<@!408337360548528138> https://colab.research.google.com/drive/1BpXNHef8puZyoSFg...
.
desert oar
oh i didnt know you needed permission
desert oar
flint mason
can I retrieve the data later when my complier has stopped working or reset?
of course, that's what saving to the database does
it's stored in the database
try again @mint palm i unrestricted it
flint mason
desert oar
it's stored in the database
exactly where, on SQLlite as its not stored locally
mint palm
Ok
desert oar
flint mason
exactly where, on SQLlite as its not stored locally
i dont understand. do you have a database that you are connecting to?
are you using sqlite?
its possible that you need to commit after saving if you are using the sqlite3 library
flint mason
no I m using
create_engine('sqlite://', echo = False)
df.to_sql('table_name', con= engine, if_exists='append')
you don't need to create an engine if you're using sqlite
mint palm
Got it so we normalize it setting max 1 and min -1
flint mason
desert oar
you don't need to create an engine if you're using sqlite
no check the path of create engine
desert oar
also it looks like that won't save to a file since you didn't provide a filename. so this database might be in-memory only
mint palm
Thank you
desert oar
i am saying that pandas specifically lets you use a plain sqlite connection without sqlalchemy
this is a specific case for sqlite, for convenience
flint mason
desert oar
also it looks like that won't save to a file since you didn't provide a filename...
I think I missed something in documentation. I will go over it again
mint palm
You may restrict it again if you want
desert oar
@mint palm i will try to make it read only but i dont care if its publicly viewable
i believe it already is read-only actually
mint palm
I was editable i guess it felt so
desert oar
are you sure?
can you try to add and run a new cell?
@flint mason sqlite has the ability to save the database "in memory", which means it doesn't create a database file, and the database disappears when the python process exits
tiny flax
So I did a course of a kinda sketchy website. (sketchy in terms that the course did not even mention tensorflow, only sklearn) and I got a certificate of completition. So I wanted to know if the certificate was hot garbage or is it worth something?? the website is https://www.sololearn.com
and on a side note, after doing another course on ML from freecodecamp I see tf.estimators.LinearClassifier() ans sklearn LinearClassifier(), what are the key differences
between them?

Join Now to learn the basics or advance your existing skills
velvet thorn
tiny flax
So I did a course of a kinda sketchy website. (sketchy in terms that the course ...
certificates generally aren't worth much
p sure
there's no sklearn LinearClassifier?
show me
the TensorFlow one is a logistic regression I believe
tiny flax
I meant sklearns's Linear classifier
don't exactly remember the module its imported from
yeah sklearn.linear_model.LinearClassifier
@velvet thorn
grave frost
@tiny flax where did you write your code? on their IDE or your own computer
tiny flax
grave frost
<@!667698491237072906> where did you write your code? on their IDE or your own c...
somewhat on their IDE and some on my computer
grave frost
tiny flax
its linear regression I got confused
ahhh
velvet thorn
tiny flax
its linear regression I got confused
are you sure?
because LinearRegression is a regression model
the LinearClassifier from TF is a classifier
so my next question is
why are you comparing the two?
velvet thorn
okay so assuming
tiny flax
thats why I was repeatedly going on about sklearn's LinearClassifier
velvet thorn
you meant
LogisticRegression
they may differ in terms of implementation?
possibly TF's uses the GPU
tiny flax
velvet thorn
they may differ in terms of implementation?
yeah like if one's better than other
in terms of implementation or something
velvet thorn
tiny flax
yeah like if one's better than other
I doubt it matters that much
I'd suggest looking @ the source
tiny flax
I found sklearn is a bit simpler atleast as much thats covered in the course and tensorflow seems to be a bit more complicated
syntax and usage wise
grave frost
that's because Sklearn is supposed to be simple and light, while TF is a part of a bigger framework for heavy DL computation on multiple devices.
tiny flax
I mean I couldn't initially download the tensorflow package using pip over wifi( 456 MB ) It took long enough for the mirror to close the connection,
I thought it was a problem with Jupyter
My wifi is kinda slow
sklearn is comparatively lightweight
upper stirrup
hello, what is the Pre-processing Data?
serene scaffold
upper stirrup
hello, what is the Pre-processing Data?
depends on the task in question
upper stirrup
I don't want to print the "ali", but also that "0",how can i do this? Shortly: string --> decimal literal

 autumn veldt
Hello everyone i have a question, currently im creating a program for classification and prediction disease using diagnosed dataset.
500 datasamples (imbalanced)
9 predictor class
1 Target class (450 class a, and 50 class b)

On predictor attribute, mostly data samples is in categorical type, "Yes" or "No"
I tried to balanced the dataset using SMOTE, and the result of my program is always on 100% accuracy. The question is, how can my accuracy always on 100%? Even tho I'm using SMOTE to balanced the dataset.
 main kernel
autumn veldt
Hello everyone i have a question, currently im creating a program for classifica...
main kernel
autumn veldt
Hello everyone i have a question, currently im creating a program for classifica...
maybe you have some columns high correlated to your y class label
serene scaffold
upper stirrup
I don't want to print the "ali", but also that "0",how can i do this? Shortly: ...
you have to know what types of data are in a given dataframe to understand what the operations with it are doing.
main kernel
guys, how do i train a time series model(scikit or other), with chucks of data(all dataset = 20 GB) how i make it free space, and advance in traing/fiting, like model.fit(df1) than model.fit(df2)... and in the end i have only one model fited
i have only 8GB of ram to use
serene scaffold
main kernel
i have only 8GB of ram to use
have you looked into collab?
main kernel
its not a option, there is a way to do this in chunks or parts?
serene scaffold
in either case, what library are you using to train?
winged stratus
i hope this will help you: https://docs.dask.org/en/latest/array-chunks.html

dask is a common library, so if you don't mind having it as a dependency
main kernel
i thonth to use just scikit LinearRegression
ok, i have chunks of data, but can i fit with chunks?
winged stratus
main kernel
i thonth to use just scikit LinearRegression
you can use partial_fit instead of fit for each chunk
main kernel
nice, partial_fit is like = fit df1 , than fit df2 ... ?
winged stratus
you use partial_fit normally as you would fit, but on each minibatch
for x_chunk, y_chunk in chunks:
   model.partial_fit(x_chunk, y_chunk)
like dis
main kernel
nice, thank, i think this solve my problem!
winged stratus
cool
do look into dask, it was made for handling large datasets
and it has some lazy evalution features
main kernel
i try usin vaex, but it has so many bugs 😦
exotic maple
winged stratus
dask is a common library, so if you don't mind having it as a dependency
i've heard MODIN is better as it can implement more pandas operations

GitHub
Modin: Speed up your Pandas workflows by changing a single line of code - modin-project/modin
It seems to work as a wrapper around Dask
and simplifies a lot of its operations
jolly nest
statistics: how to do chi squared thingy in python without imports.
main kernel
https://medium.com/analytics-vidhya/pearsons-chi-squared-test-from-scratch-with-python-ba9e14d336c
scratch is the word you need to use on google

Medium
After having discussed Fisher‘s exact test and its implementation with Python in my last article, I now want to dedicate myself to another…
if you dont want to use np, good luck, but i think you will find some guides
main kernel
jolly nest
statistics: how to do chi squared thingy in python without imports.
just marking
jolly nest
ah thank you
We start by importing some Python libraries:
XD
they abstract away what im trying to learn!
main kernel
he build with numpy, he just use scikit to compare

 silk prawn
Anybody got any good resources to learn computer vision?
mint palm
silk prawn
Anybody got any good resources to learn computer vision?
Coursera seems fine
Deep learning. Ai course 4 of specialization
mint palm
Also i have been doing this.....
https://www.unschool.in/courses/deep-learning/
This gives pretty basic intro to CNN
silk prawn
Ohh thanks
mint palm
And intro to Tensorflow and RNN too
mint palm
silk prawn
Ohh thanks
If you think of choosing unschool course then DM me, i may have something awesome for you.
 upper spade
guys
when should i learn data science
i just finished the basics
what should i read
to go down data science and ai road
 fading wave
@upper spade Finishing basic python is enough to continue with data science
upper spade
fading wave
<@424867508722597889> Finishing basic python is enough to continue with data sci...
really???????????
damn
okay man
ill go on the hunt for my first book
fading wave
you will learn advanced stuff along the way of learning data science anyways
fading wave
Many people recommend to start with Machine Learning course on Coursera (even I did) ... It's in Octave but the concepts are very useful ... also a lot of syntax is similar like slicing and stuff
upper spade
fading wave
Many people recommend to start with Machine Learning course on Coursera (even I...
free?
fading wave
upper spade
free?
The content is entirely free ... but the certificate isn't
fading wave
You can try for financial aid though if you want certificate ... it is usually quite easy to get
upper spade
fading wave
You can try for financial aid though if you want certificate ... it is usually q...
it would be nice if i can get some financial aid
okay man
thanks so much for your help
really appreciate it man
fading wave
After that you can do two specializations on Coursera "Applied Data Science with python by UMich" and "Deep Learning by deeplearning.ai"
upper spade
this is what you took?
fading wave
upper spade
this is what you took?
Yeah I did
upper spade
okay me too then
fading wave
After doing that you will have enough knowledge to participate in kaggle contests and boost your skills
fading wave
upper spade
what kaggle
kaggle is like codeforces for data scientists ... there are various data science contests, expert notebooks to learn from, and datasets to experiment on
fading wave
Also, do follow some medium sites like Towards Data Science, Analytics Vidhya, etc.
 sage swan
upper spade
it would be nice if i can get some financial aid
sage swan
upper spade
it would be nice if i can get some financial aid
all the answers of quizzes of coursera are available in gihub . cerificate can be obtained within week of free trial .
so no money has to be spent for it
just focus on skills . Certificate means nothing
mint palm
sage swan
all the answers of quizzes of coursera are available in gihub . cerificate can b...
They updated the course and certificate....atleast for deeplearning.ai u cant get cetification in just trials now
Haha hard way is the only way left
Github answer key is useless now
sage swan
ohh
 paper gorge
can anybody teach me python
 pine bluff
paper gorge
can anybody teach me python
pine bluff
paper gorge
can anybody teach me python
Buy a book 🙂
gritty socket
does anyone know how i can teach objects to opencv
like it comes with face eyes car plates
but i want to add other things too
how can i train it
sly salmon
how can I visualize numpy arrays? I'm having a hard time understanding the concept of 1D, 2D, 3D arrays.
gritty socket
sly salmon
how can I visualize numpy arrays? I'm having a hard time understanding the conce...
 sly salmon
gritty socket
sly salmon
gritty socket
that doesn't do it for me, to be honest
paper gorge
pine bluff
Buy a book 🙂
ok
velvet thorn
sly salmon
how can I visualize numpy arrays? I'm having a hard time understanding the conce...
uh
line, square, cube?
gritty socket
yeah
velvet thorn
it gets complicated after 3D
sly salmon
yeah I can wrap my head around the 1D and 2D arrays, but building and visualizing 3D or higher with numpy is a bit of a headache
technically I could have a 2D array with many different features, which represent coordinates to make a n dimensional graph - that makes sense
but it's just a minor hiccup
velvet thorn
sly salmon
yeah I can wrap my head around the 1D and 2D arrays, but building and visualizin...
hopefully it’ll come with experience