#data-science-and-ml
1 messages · Page 297 of 1
 serene scaffold
 plucky loom
Somebody deleted text channel help-apple, where were my question placed.
serene scaffold
plucky loom
Somebody deleted text channel help-apple, where were my question placed.
your question is right here: #help-apple message
plucky loom
Guys, i need help with sympy. Here is my equasion: y^2 - sin(y') * y + x^2 * (1+x) * (1+y)
Here is my code:
y = Function("y")

yFunction = y(x)**2 - sin(y(x).diff(x)) * y(x) + x**2 * (1 + x) * (1 + y(x))

eq = Eq(yFunction, 0)

print(dsolve(eq, y(x)))```And here is my error: TypeError: Invalid NaN comparison. It says something wrong with print(dsolve(eq)).
What did i do wrong?
 iron basalt
Because functions have more than one possible input value (and in the case of python, also different input types).
It could be argued that it's bad design since it violates KISS. That is, each function should do one thing and one thing only. But a function that does many things is convenient at the trade-off of being hard to understand since you are trying to understand multiple functions at the same time. Edit: hard to learn. A well designed multiple purpose function can be learned through a few specific cases and then extrapolated from that (predictable behavior).
(A lot of things in math are like this because they are general on purpose so that connections can be made between seemingly unrelated things)
(For programmers it's more for not having to memorize a ton of different functions, but rather just one that has a simple to predict behavior (if transform was really hard to predict based on the given input, it would be useless))
 exotic maple
@iron basalt master squiggly. in this example. You can do:
df["group_total"] = df.groupby("account").transform(sum)
and that would do all the otlined steps, correct?
 woven ibex
Hi, I'm new to ML and trying to understand how the logic is built in scikit-learn .. e.g. lets say Linear Regression. What is the best way to learn the logic that is built.
is taking scikit into debug mode locally?
exotic maple
you mean the math behind linear regression?
 hollow sentinel
well the logic comes from the math
exotic maple
or the algorithm?
the math is pretty straightforward (most of the time) but you're better off looking for that explanation somewhere else
woven ibex
The algorithm. e.g using linear eq and Least squared method we can come up with best fit line.. I wanted to see how the logic or the function does it to get the best fit line..
i tried to learn sckit-learn code, too complex for me to understand . just thought any other way to know the code
exotic maple
if im not mistaken it starts "random" values for each X (feature) weight, calculates error, and then iterates through many variations until finding a minimum value
woven ibex
right, likewise wanted to see how thats been done as a code for all models lets say
exotic maple
yeah you need to go and check the source code lol
iron basalt
exotic maple
<@!119925597395877889> master squiggly. in this example. You can do:
```py
df["g...
If you group by account, it will give you back a table with more than 1 column, just grouped by account.
In the link you can see df.groupby('order')["ext price"].sum(). The idea is to group by order, but then sum up all of the ext price's.
woven ibex
yeah saw the code 🙂 going on top of my head.. more than math logic, unable to understand all the nuts and bolts
exotic maple
@iron basalt but the normalization (each account number has the sum) is done with transform right=
I gotta use that function more... sounds really handy
iron basalt
Transform is when you want to spread out those sums back into the original table.
Without transform you would have to manually do a merge.

 iron basalt
But then redistributing back to all of the original rows
exotic maple
dude Pandas documentation is the sexiest thing ever
also thanks @iron basalt you're one of the most helpful guys here 🙂
iron basalt
So every item in a group would be assigned the same sum
Note it depends on what function you are transforming / applying
sum returns 1 result
 grave frost
iron basalt
Because functions have more than one possible input value (and in the case of py...
grave frost
iron basalt
Because functions have more than one possible input value (and in the case of py...
lol I meant it as a joke 🙂 And I was referring to CS in general, not functions/programmin 😁
iron basalt
if your function returns multiple it will do elementwise stuff
iron basalt
woven ibex
yeah saw the code 🙂 going on top of my head.. more than math logic, unable to u...
Are you reading scikit-learn's source code?
grave frost
!code
 arctic wedgeBOT
Here's how to format Python code on Discord:
```py
print('Hello world!')
```
These are backticks, not quotes. Check this out if you can't find the backtick key.
woven ibex
iron basalt
Are you reading scikit-learn's source code?
Yes, trying tor read and understanding 🙂
iron basalt
woven ibex
Yes, trying tor read and understanding 🙂
That will be very difficult since most of the code is for doing a bunch of checks on the inputs and conversions that are unrelated to the actual algorithm logic. It will be difficult to pin down where the actual algorithm happens (it's also often distributed across multiple files).
If you want to learn how to code linear regression you are better off searching for linear regression code specifically.
One annoying thing is that with python, search engines will often just give you scikit-learn or other libraries as the answer rather than just plain python implementations.
You can however, if you understand enough coding in general, lookup a solution in a different language, it may give better results.
woven ibex
That make sense @iron basalt i hear you. i was complicating things for myself. Thanks
 bitter fiber
Does anyone know resources to learn pyspark?
The resources i've googled has been pretty unintelligable.
iron basalt
If I search linear regression in c, I instantly get a simple answer without any libraries: https://www.codesansar.com/numerical-methods/linear-regression-method-using-c-programming.htm
woven ibex
phew!
iron basalt
(This is due to the different programming cultures, in python one always looks for a library first, then implements it manually if missing)
woven ibex
hmm i see. i think this will help me to understand the logic. Thanks ..
 misty flint
iron basalt
(This is due to the different programming cultures, in python one always looks f...
misty flint
iron basalt
(This is due to the different programming cultures, in python one always looks f...
sounds like R 
 shy kraken
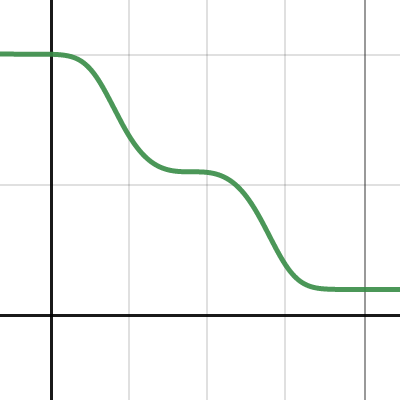
I'm trying to plot a graph in matplotlib, but I don't know how to make a function like this: It's sigmoidish on the ends, bounded by 10 and 1... but cubic in the middle. Is there a function I could write like this?

that drawing is clearly not matplotlib lmao
 tidal bough
shy kraken
I'm trying to plot a graph in matplotlib, but I don't know how to make a functio...
tidal bough
shy kraken
I'm trying to plot a graph in matplotlib, but I don't know how to make a functio...
I'd start by just trying to wrap a cubic function in a sigmoid (and shift+scale it, obviously). This seems to produce what you want:
 tidal bough
yes
misty flint

iron basalt
tidal bough
yes
desmos has a link sharing feature
misty flint
shy kraken
tidal bough
I'd start by just trying to wrap a cubic function in a sigmoid (and shift+scale ...
Wow that looks nice and I've never tried desmos... I'm trying to do it in matplotlib and struggling at the moment lol
tidal bough
The generating the points part or the plotting part?
misty flint
its probs better to figure out the function in desmos first, then you can plot it later in matplotlib
shy kraken
Like I got the cubic function and the sigmoid function and placed them on top of each other nicely...so now I'm trying to get it so it's like between two x values use the cubic function and elsewhere use the sigmoid
iron basalt
shy kraken
Wow that looks nice and I've never tried desmos... I'm trying to do it in matplo...
You can also ofc shift the input to make it close to 10 at x=0: https://www.desmos.com/calculator/3hubbcatrx

Desmos
tidal bough
shy kraken
Like I got the cubic function and the sigmoid function and placed them on top of...
If that's specifically what you want, you can do that too, but is there a reason you don't use a non-piecewise function like above?
It'd be roughly
import numpy as np
import matplotlib.pyplot as plt

def sigmoid(X):
    return 1/(1+np.exp(-X))

def my_func(X):
    return 10-9*sigmoid(X**3)

X = np.linspace(-5,5,10000)
Y = my_func(X)

plt.figure()
plt.plot(X,Y)
plt.show()
 misty flint
havent had the chance to work with scipy as much. will def have to try instead of writing these formulas by hand every time
tidal bough
scipy is pretty insane, it seems to have everything and that everything is extremely optimized
 astral path
^^
shy kraken
tidal bough
It'd be roughly
```py
import numpy as np
import matplotlib.pyplot as plt
def si...
honestly I'm not sure what you did in desmos so I'm having a hard time interpreting non-piecewise...I'm thinking through your python code now!
tidal bough
shoutout to scipy.spatial.distance.pdist, for example
misty flint

shy kraken
This is what I wrote in matplotlib lol
 misty flint
tidal bough
shoutout to `scipy.spatial.distance.pdist`, for example
misty flint
tidal bough
shoutout to `scipy.spatial.distance.pdist`, for example
dude. absolutely insane
this is actually very useful in machine learning
shy kraken
tidal bough
It'd be roughly
```py
import numpy as np
import matplotlib.pyplot as plt
def si...
wow this works nice! I just need to stretch it out a little bit. And also think through what you did. Thanks!
iron basalt
shy kraken
wow this works nice! I just need to stretch it out a little bit. And also thin...
Desmos
shy kraken
iron basalt
https://www.desmos.com/calculator/ewohnqlxtl
wow, more magic...that looks sexy af too
tidal bough
shy kraken
wow this works nice! I just need to stretch it out a little bit. And also thin...
Generally speaking, stretching a function out horizontally is always just replacing X with k*X, say.
iron basalt
Crafting functions in desmos is so much fun, very useful for writing VFX shaders.
tidal bough
https://www.desmos.com/calculator/4dq8rsmv3q version with variable shift and scale
shy kraken
tidal bough
<https://www.desmos.com/calculator/4dq8rsmv3q> version with variable shift and s...
lmao what is this magic program this is cool
iron basalt
Unnecessary animation added: https://www.desmos.com/calculator/vljnzyfn9e

Desmos
shy kraken
iron basalt
Unnecessary animation added: https://www.desmos.com/calculator/vljnzyfn9e
bro wtf you're just showing off now
lol
misty flint
iron basalt
Unnecessary animation added: https://www.desmos.com/calculator/vljnzyfn9e
matches your username

iron basalt
yea idk
shy kraken
can you have scarlett Johannson slide down the graph too
iron basalt
yes actually, many people have made portraits and animations with desmos in their competitions
astral path
oh my god
@misty flint you remember when i was asking about the situation when i was asking about scraping with a URL that's different from the dataset

GitHub
Kaggle Competition for Predicting NCAA Basketball Tourney Games - adeshpande3/March-Madness-2017
someone literally already did this with the EXACT same dataset and website to scrape from that I was using
misty flint
astral path
someone literally already did this with the EXACT same dataset and website to sc...

also p sure ken jee was doing it too
i cant remember
hollow sentinel
Yeah Ken jee does all the sports data stuff
hollow sentinel
perhaps
misty flint
thats the same thing people say about reading
astral path
lmao new issue
hollow sentinel
I have listened to podcasts before
but it has nothing to do w data science so I won’t talk about it
 astral path
wait nvm
deleting to unclog
it was returning the columns because it was a dataframe
 inner folio
in NLP does it make more sense to vectorize the data (bag of words, tf-idf) using only the training data after splitting the dataset intro train/test rather than vectorize using the entire dataset before splitting? im thinking there would be information leakage if using the latter approach which could overestimate model results and so the first approach is more appropriate?
astral path
basic ML question:
if I have a dataset where the features are the difference in stats between two teams in games (i.e. wins, points per game, assists) denoted as t1 - t2, and the label is who won (1 if t1 won, 0 if t2 won), does it matter if t1 always wins and so the label is always 1?
here is an example dataframe where each row is the difference between t1 and t2:

and here are the labels for which team won the game (label col corresponding to features row)

 rain delta
hi, does anyone know about naka rushton's equation for a neural network project
tidal bough
astral path
if I have a dataset where the features are the difference in stats between two t...
Well, it would be very hard to teach a model to predict which team wins if one team wins always 😅
your model would learn to predict team1 always, and you'll hardly be able to blame it for that
astral path
hehe well it's not just one single team! it's more along the lines of this:

I have a winner and a loser and i'm always doing winner_stats - loser_stats, and since team1 is always winner, the label is always 1
should i do it a different way?
tidal bough
ah, I see
I feel like it might be a problem. Suppose in all of your test samples the first team leads by a score of 5 or above. Now you give your model a case where first_team_score - second_team_score is -5. Obviously, this just means that it's the second team that will win, but your model has never seen a negative difference in scores before.
exotic maple
misty flint
time to make another data science podcast
Can you list a ds podcast in your portfolio? 
exotic maple
@astral path rtry keeping your distance in absolute value
you are not necessarily interested in the direction of the distance
you can probably cast abs(difference)
astral path
i'm not there yet, haven't tried any models yet
tidal bough
You could just shuffle the data such that in half of the cases, the first team wins
astral path
i'm trying to accoutn for any errors first
exotic maple
after all, by definition, whoever has a higher score is going to win
tidal bough
like, for 50% of the points, swap the teams.
astral path
hmm ok i'll try that
tidal bough
exotic maple
after all, by definition, whoever has a higher score is going to win
I meant score as in the metrics the model predicts the winning team by
like, number of previous wins, whatever
exotic maple
tidal bough
I meant score as in the metrics the model predicts the winning team by
yeah, i got that now
astral path
tidal bough
like, for 50% of the points, swap the teams.
how would i actually do this?
tidal bough
astral path
how would i actually do this?
If all of your columns are just the differences between the corresponding metrics of the teams, you just need to multiply 50% of the rows by -1.
misty flint

 lapis sequoia
What exactly are the differences between Tensorflow and Pytorch?
Do they compete or compliment each other
serene scaffold
My understanding is that they're similar
serene scaffold
I have also heard this
iron basalt
I suppose pytorch and tensorflow are competitors, but not really, they have very similar things, but do things differently. Pytorch is my preference. There was chainer, which I used for a bit, but then this happened: "As announced today, Preferred Networks, the company behind Chainer, is changing its primary framework to PyTorch. We expect that Chainer v7 will be the last major release for Chainer, and further development will be limited to bug-fixes and maintenance. "
IIRC, pytorch was a fork of chainer but idr (at least, they were extremely similar)
 eternal narwhal
I have tried both libraries, and both have the exact same capabilities. Although there are a lot more tensorflow tutorials and books to learn with.
You can also use the easy to use tool google colab
with free access to gpus in a jupyter notebook style environment
astral path
if i'm using the command [compareTwoTeams(row['win_url'], row['los_url']) for i, row in tourney_games.iterrows()] and it's throwing an error because los_url isn't what it should be, how do I debug to see what row it's on?
 late schooner
good books?
tidal bough
astral path
if i'm using the command `[compareTwoTeams(row['win_url'], row['los_url']) for i...
I think a debugger can break on an exception even inside a listcomp (PSA: use debuggers, they are awesome, don't just put prints everywhere). More generally, though, you'd need to not use a listcomp.
astral path
what would i use here instead
late schooner
NumPy- best library for Data Science?
astral path
late schooner
NumPy- best library for Data Science?
uh well theres not really a best library...
its whatever tool fits the specific task at hand
numpy for linear algebra, scipy for statistics, pandas for data manipulation, sci-learn for some ML
etc...
late schooner
astral path
numpy for linear algebra, scipy for statistics, pandas for data manipulation, sc...
THANKS
tidal bough
astral path
what would i use here instead
Like, just a normal loop, so that you can put error-handling code in there too
astral path
tidal bough
Like, just a normal loop, so that you can put error-handling code in there too
oh yea ig that makes sense
astral path
 wind bobcat
Hi can i ask a R programming question here?>
wind bobcat
Hi can i ask a R programming question here?>
i mean idk if that's exactly on topic? there are servers for R programming.
i guess you could cus this is on scientific python, matplotlib, statistics, machine learning and related topics, so it could fit under related topics
astral path
oh yeah if it's more the theory then yeah it def fits
wind bobcat
Oh yeah i have to solve this and I am lost which parts i have to study for.
 tidal bough
what's u_i?
astral path
 carmine finch
CAN SOMEONE PLZZ HELP ME WITH PYTHON
carmine finch
CAN SOMEONE PLZZ HELP ME WITH PYTHON
- maybe you'd get a better response in a help channel
- https://dontasktoask.com/
 iron basalt
tidal bough
what's `u_i`?
iron basalt
tidal bough
what's `u_i`?
The residual u_i = y_i - E(y_i | x_i). The problems can be solved with simple substitution (at least I am assuming that is what u_i is, econometrics people seem to use u_i).
tidal bough
iron basalt
The residual `u_i = y_i - E(y_i | x_i)`. The problems can be solved with simple ...
Ah, nice
E[y_i|di=0] = E[b0 + u1|di=0] = b0 + E[ui|di=0] = b0
so yeah, you need to use the fact that the residual is zero on average.
astral path
tidal bough
If *all* of your columns are just the differences between the corresponding metr...
i have a list of 50% 1s and 50% 0s, but how do I make it so the feature list is negated for the feature corresponding to the 0s in the labels list??
tidal bough
astral path
i have a list of 50% 1s and 50% 0s, but how do I make it so the feature list is ...
You're using a DataFrame, right?
Or already a numpy array?
astral path
no i have a list of lists rn
tidal bough
Is there a reason you're not converting it to a numpy array?
tidal bough
with a numpy array, it's as simple as (assuming the entire array is just features (no labels, which needs to stay untouched), and assuming each row is a single datapoint):
features[inds,:] = -features[inds,:]
where inds is a numpy array that can be used as an index (for example, a list of True/Falses)
tidal bough
What haven't you seen exactly? Being able to provide two indexes, or being able to use an array of booleans as an index?
(both are numpy features, not something you can do with a normal list)
astral path
ohhhh damn nvm
the booleans as index
ive seen that
sorry its been a while since i slept im a lil groggy 😆
huh so no matter what, features ends up the same
it's -features no matter what labels looks like
this is display(features) before doing anything to it

heres labels and features after
 tidal bough
It sure looks like they get changed correctly, though.
first 2 get flipped, the third doesn't
uhh, nevermind, I can't see enough to see whether it's right or not
is the third row flipped? The one beginning by 6. Is it now starting by -6?
astral path
no its not flipped
it stays starting at 6
but
heres another version of labels

features is the same

even though this is 1 0 0 for these labels instead of 1 1 0 like before
tidal bough
Are you sure? features gets changed in place, so are you looking at the right version of it?
hmm
astral path
yeah i updated each cell
tidal bough
strange
try another way perhaps:
labels = labels*2-1 # 0 -> -1, 1 -> 1
features *= labels
aight i'll try that
ValueError: operands could not be broadcast together with shapes (567,20) (567,) (567,20)
on features*=labels
got it to work with features = features * labels[:, None]
tidal bough
hmm, it shouldn't be so hard
try features = features * labels
567 and (567,20) should really be broadcastable
astral path
it's a 2d array * 1d array, it worked with the code i just pasted
thanks!
appreciate the help
tidal bough
ooh, I see
import numpy as np
a = np.zeros((5,10))
b1 = np.ones((10,))
b2 = np.ones((5,))
a*b1 # OK - multiplying (5,10) * (10,)
a*b2 # ERROR: multiplying (5,10)*(5,)
which is... weird, TBH
astral path
agreed...
misty flint
numpy broadcasting magic

im glad they added that. even tho im sure it upset the mathematicians
iron basalt
tidal bough
which is... weird, TBH
numpy matches dimensions right to left
misty flint
ah just like regular math
i think
at least i think thats how it is in linear alg
iron basalt
not exactly
>>> a = np.ones((5, 10))
>>> b = np.ones((10,))
>>> a
array([[1., 1., 1., 1., 1., 1., 1., 1., 1., 1.],
       [1., 1., 1., 1., 1., 1., 1., 1., 1., 1.],
       [1., 1., 1., 1., 1., 1., 1., 1., 1., 1.],
       [1., 1., 1., 1., 1., 1., 1., 1., 1., 1.],
       [1., 1., 1., 1., 1., 1., 1., 1., 1., 1.]])
>>> b
array([1., 1., 1., 1., 1., 1., 1., 1., 1., 1.])
>>> a+b
array([[2., 2., 2., 2., 2., 2., 2., 2., 2., 2.],
       [2., 2., 2., 2., 2., 2., 2., 2., 2., 2.],
       [2., 2., 2., 2., 2., 2., 2., 2., 2., 2.],
       [2., 2., 2., 2., 2., 2., 2., 2., 2., 2.],
       [2., 2., 2., 2., 2., 2., 2., 2., 2., 2.]])
>>>
matches the 10 to the other 10, then applies the add along the first dimension.
iron basalt
>>> a = np.ones((5, 10))
>>> b = np.ones((10,1))
>>> a
array([[1., 1., 1., 1., 1., 1., 1., 1., 1., 1.],
       [1., 1., 1., 1., 1., 1., 1., 1., 1., 1.],
       [1., 1., 1., 1., 1., 1., 1., 1., 1., 1.],
       [1., 1., 1., 1., 1., 1., 1., 1., 1., 1.],
       [1., 1., 1., 1., 1., 1., 1., 1., 1., 1.]])
>>> b
array([[1.],
       [1.],
       [1.],
       [1.],
       [1.],
       [1.],
       [1.],
       [1.],
       [1.],
       [1.]])
>>> a + b
Traceback (most recent call last):
  File "<stdin>", line 1, in <module>
ValueError: operands could not be broadcast together with shapes (5,10) (10,1)
>>>
ah yes i know this too bc of broadcasting rules
tidal bough
misty flint
ah just like regular math
For matrix multiplication that's required for it to be defined, but it could have been smarter than this for operations that are broadcastable along both axes
misty flint
maybe in the next version
also maybe i need to keep learning linear alg
ive barely started
astral path
lol imma need some serious help with my ML tommorow
accuracies are WAY off

should look more like htis
 misty flint
astral path
accuracies are WAY off
misty flint
astral path
accuracies are WAY off
we did a random forest and a decision tree today
and they were both 0.53
 lusty iron
astral path
accuracies are WAY off
lusty iron
astral path
accuracies are WAY off
do you do any feature selection? bad features can f-up the signal in the data
 rich reef
Does one of you have a good explanation of pandas.Grouper arguments label and closed? They don't behave intuitively for me but the docs contain no examples.
https://pandas.pydata.org/pandas-docs/stable/reference/api/pandas.Grouper.html
 obtuse sable
how do I link neurons in a layer to a specific set of neurons (not all) in the next layer using PyTorch? totally new to this
 lean ledge
Either don't do matrix multiplication like you usually do with the thing and only do the specific multiplications you want to do, or do matrix multiplication but set the weights to 0 and to not change
obtuse sable
which is faster to train? and I can use torch.nn.Linear still for the latter?
obtuse sable
can I do torch.split on my input data and feed half my data into one torch.nn.Linear, and do the same for the other half for a separate "Linear" hidden layer, then at the end concat them and feed to another Linear layer to get the final output. I only have 1 output neuron bc it's a binary classifier
 uncut barn
Does anoyone have an idea of how to construct the 2nd part (i.e. the decoder)? for the neural network

 paper lake
iron basalt
numpy matches dimensions right to left
paper lake
iron basalt
numpy matches dimensions right to left
||switch over to julia||
 limpid oak
I have column daily rain and in each row ['0', '0', '0', '0', '14'] values are like this
now i want to access each index value as int and save it to new column
any logic
?
like col1 col2 ...
['0', '0', '0', '0', '14']
['0', '0', '0', '0', '38.5']
['3.5', '0', '0', '0', '17.5']
 ashen lintel
hey everyone :) not sure if this belongs here but oh well
i have a json file in the format of
{'ua': {'0': 'ua1', '1': 'ua2'}, 'ip': {'0': 'ip1', '1': 'ip2'}, 'timestamp': {'0': 'timestamp1', '1': 'timestamp2'}}
how the do i extract data one at a time from this in such way so that i end up with a json string of
{'ua': 'ua1', 'ip': 'ip1', 'timestamp': 'timestamp1'}
serene scaffold
@limpid oak is this in a dataframe, or what?
@ashen lintel this sounds like a general Python question. Look into dict comps.
It's also worth noting that that can't be a json because it's using single-quoted strings. however if you want to do it with pandas, there is a method for opening json files into a dataframe
ashen lintel
it's just me poorly formatting it, ignore the single quotes
and i don't really need to involve a df here, just trying to split it into singular message strings to be send via cloud pubsub
serene scaffold
ashen lintel
it's just me poorly formatting it, ignore the single quotes
!docs pandas.read_json
arctic wedgeBOT
pandas.read_json(path_or_buf=None, orient=None, typ='frame', dtype=None, convert_axes=None, convert_dates=True, keep_default_dates=True, numpy=False, precise_float=False, date_unit=None, encoding=None, lines=False, chunksize=None, compression='infer', nrows=None, storage_options=None)```
Convert a JSON string to pandas object.

Parameters  **path\_or\_buf**a valid JSON str, path object or file-like objectAny valid string path is acceptable. The string could be a URL. Valid URL schemes include http, ftp, s3, and file. For file URLs, a host is expected. A local file could be: `file://localhost/path/to/table.json`.

If you want to pass in a path object, pandas accepts any `os.PathLike`.

By file-like object, we refer to objects with a `read()` method, such as a file handle (e.g. via builtin `open` function) or `StringIO`.

**orient**strIndication of expected JSON string format. Compatible JSON strings can be produced by `to_json()` with a corresponding orient value. The set of possible orients is:

• `'split'` : dict like `{index -> [index], columns -> [columns], data -> [values]}`

• `'records'` : list like `[{column -> value}, ... , {column -> value}]`

• `'index'` : dict like `{index -> {column -> value}}`
... [read more](https://pandas.pydata.org/pandas-docs/stable/reference/api/pandas.read_json.html#pandas.read_json)this is the data science/ai channel, so we typically try to solve data manipulation questions with pandas 😛
ashen lintel
i did kinda solve it with pandas, but its very ugly xd
thanks anyway, wasn't quiet the right channel to ask this question then!
serene scaffold
ashen lintel
i did kinda solve it with pandas, but its very ugly xd
thanks anyway, wasn't qu...
aren't you basically just picking a row of a dataframe...?
it shouldn't be ugly at all
ashen lintel
thing is, i need it to be a json string
serene scaffold
so it's not really a json then, either 😛
ashen lintel
well, not at the final state but the og file is json xd
serene scaffold
did you look into io.StringIO?
import pandas as pd
import io
df = pd.read_json(io.StringIO(some_string))
i'll take a look, thanks for a suggestion
 hardy agate
hello i need a stock market api which allows me to trade using python no machine learning
misty flint
hardy agate
hello i need a stock market api which allows me to trade using python no machine...
no machine learning
then this is the wrong channel for you
hardy agate
:c
grave frost
hardy agate
hello i need a stock market api which allows me to trade using python no machine...
that's just a stock trading bot then. There are plenty of those if you google or browse github
arctic wedgeBOT
Hey @dry spoke!
Uh-oh! It looks like your message got zapped by our spam filter. We currently don't allow .txt attachments, so here are some tips to help you travel safely:
• If you attempted to send a message longer than 2000 characters, try shortening your message to fit within the character limit or use a pasting service (see below)
• If you tried to show someone your code, you can use codeblocks
(run !code-blocks in #bot-commands for more information) or use a pasting service like:
hardy agate
:c
grave frost
I personally always wanted to do a stock trading project using multiple models scraping, scanning news tweets and articles.
Probably would do in uni (if I get there) cuz maybe then I might have more resources
 dry spoke
Can anyone help with text mining/preprocessing? I'm working on a project for a class and I've got an error that I can't seem to figure out. I have a bunch of documents that I need to iterate over to extract the one that starts with "Subject:" and another that starts with "Lines: <number>". The chunk of code that is throwing the error is here https://paste.pythondiscord.com/ayodakecuf.apache . The error message is "invalid literal for int() with base 10: 'dog'"
grave frost
you are trying to convert string to integer. In this case, converting dog to a number - which is not possible
dry spoke
So should I have that be str instead of int?
grave frost
it depends
can you post the whole error here
and your whole code as a reproducible example?
dry spoke
I can toss the whole code on the link. I'm not sure it will be reproducible. I can screen shot the whole error. One sec
whole error

Part of my issue is that I'm working with code my professor helped me with and I'm not sure I understand the entirity
grave frost
yeah, your line.split(' ',2)[1] does not return a number, rather it returns a string. I suggest your try printing it out and see what it shows
dry spoke
Huh, this is weird, the vast majority of times, it is giving me a number. There must be a document somewhere that has the word 'dog' instead of a number in that location
I'll dig more. Thank you
eternal narwhal
Does anyone have any tips to improve the accuracy of Vision Transformers for Cifar-100?
astral path
lusty iron
do you do any feature selection? bad features can f-up the signal in the data
no but the features I expect to be important aren't, and vice versa
it's running right now so I can't show mine, but this is what it should look like

and instead, like two different variables of mine are WAY more "important"
 merry fern
How can I consolidate my code to combine a list of dataframes?
dfs = [btc, eth, ltc, djia, dxy, ndq, spx, vix]
master = master.apply(lambda x: x.append([x for x in dfs]))``` elfin spruce
master = master.apply(lambda x: x.append([x for x in [btc, eth, ltc, djia, dxy, ndq, spx, vix]]))
did you try that
if you use pandas
you could do df = pd.concat(dfs)
or
df = pd.concats(btc, eth, ltc, djia, dxy, ndq, spx, vix)
 hasty mountain
Hey guys, I'm trying to format some data I got to put into practice what I learned about machine learning, but I'm having a problem with some strings that I wish to transform into floats. I want to remove those "%" from the strings so then I can try to transform the numbers into floats. Is it possible to do so through regular expressions?

(PS: That data is from a DataFrame I made using an excel file)
tidal bough
Are they all percentages?
if so, you could just remove that, cast to float and multiply by 100
hasty mountain
Yes, all numbers are percentages, but I don't know how to remove the "%" from them.
tidal bough
rstrip, for example, or just string slicing to remove the last character.
hasty mountain
AttributeError: 'Series' object has no attribute 'rstrip'
I'm trying to use df.loc[3:42, 'Unnamed: 3]).rstrip("%"), but I'm getting that error
 ripe forge
on a df, if you want to use string methods, they;re usually provided behind a string accessor
so, my_df.str.string_method()
hasty mountain
ripe forge
so, `my_df.str.string_method()`
So, would it be df.loc[2:42,'Unnamed: 3'].str.rstrip("%") ?
 odd lion
Is rstrip much more efficient than .replace("%","")?
hasty mountain
odd lion
Is rstrip much more efficient than .replace("%","")?
I've tried that, but it didn't work and I didn't get any error.
 echo orbit
Hey guys, do you perhaps know how to centerize random positions around specific values please ? I'm trying to make a random walk using a Markov chain Monte-Carlo method with emcee, however my walkers "explore" way too much and i think it's because i didn't centerize the random positions around the said values
 whole mural
need some help on fastai
I am trying to use the train_cats method, but I think it was removed after 0.7.0
any ideas ?
misty flint
this is pretty cool if youre into Reinforcement Learning https://aws.amazon.com/deepracer/

Amazon Web Services, Inc.
AWS DeepRacer is the fastest way to get rolling with machine learning, literally. Get hands-on with a fully autonomous 1/18th scale race car driven by reinforcement learning, 3D racing simulator, and global racing league.
echo orbit
In other words, i'd like something like this (won't work since random.randn returns a different array) :
print("Maximum likelihood estimates:")
print(f"m = {m_ml:.3f}")
print(f"b = {b_ml:.3f}")
OUTPUT : Maximum likelihood estimates: m = 2.240, b = 34.048

ndim = 2
nwalkers = 50
nburnin = 200
nsteps = 1000
x=data.x
y_obs=data.y
y_std=np.std(y_obs)

L1=m_ml*np.random.rand(nwalkers,1)
L2=b_ml*np.random.rand(nwalkers,1)
starting_guesses=np.array([L1,L2]

sampler = emcee.EnsembleSampler(nwalkers, ndim, log_probability, args=(x,y_obs,y_std))

pos, prob, state = sampler.run_mcmc(starting_guesses, nburnin, progress=True)```Any idea please ?
whole mural
misty flint
this is pretty cool if youre into Reinforcement Learning https://aws.amazon.com/...
Me ?
tidal bough
echo orbit
In other words, i'd like something like this (won't work since `random.randn` re...
So do you want, like, a normally distributed random variable with a specific mean and variance?
tidal bough
I don't get what you mean by "centerize" otherwise.
echo orbit
That's right
Thing is random.randn doesn't have a scale arg
So idk how i should make it
Also each column of the array has a different mean
tidal bough
There's arguments to np.random.randn for it I'm pretty sure, but if not, it's as simple as generating a standard one (mean 0, std 1), multiplying by the required std, and adding the required mean.
echo orbit
Didn't find any on the documentation sadly
 proud pond
hello
I saved a model, can I keep training it? or do I need checkpoints in order to do that?
(TensorFlow)
eternal narwhal
use the function tf.keras.models.load_model('filepath') if it is a Sequential model or Functional model, and use model.load_weights('filepath') if the model is a Model Subclassed model.
misty flint
astral path
FUCK
MY ML MODEL WORKSSSSS

grave frost
misty flint
this is pretty cool if youre into Reinforcement Learning https://aws.amazon.com/...
Haha, this is one the questions if your scroll down:-
Q> Is there a chance the track could bend?

A> Do not try and bend the track - that's impossible. Instead, only try to realize the truth. There is no track.
By SW
 marsh gale
Hey all!
I just recently started coding and even more recently started python because I'm very interested in AI/machine learning/reinforced learning
So..Im pretty aware that AI/ML is a pretty advanced topic for a beginner to dive into, however I have the experience that its better for me to learn something i'm interested in than some basic tutorials..
Any chance I can get some wise words to get into this? x)
hollow sentinel
hmmm
AI/ML requires some hefty math skills
Mathematics for Machine Learning
Companion webpage to the book “Mathematics for Machine Learning”. Copyright 2020 by Marc Peter Deisenroth, A. Aldo Faisal, and Cheng Soon Ong. Published by Cambridge University Press.
astral path
marsh gale
Hey all!
I just recently started coding and even more recently started python b...
tbh the coding isn't really that hard, it can be fairly simple if you're using libraries (but fs not if you're building models from scratch). If you want to take a deep dive into ML then it's the Math you really need to understand, not the python
astral path
Andrew Ng has a fantastic course
https://www.coursera.org/learn/machine-learning

Coursera
Offered by Stanford University. Machine learning is the science of getting computers to act without being explicitly programmed. In the past ... Enroll for free.
hollow sentinel
he has some excellent math videos
hollow sentinel
astral path
Andrew Ng has a fantastic course
https://www.coursera.org/learn/machine-learning
this requires a lot of math lmao
astral path
he's a famous professor of ML at Stanford and he's watered down most of the concepts in this course
marsh gale
hollow sentinel
there's also that guy 3blue 1 brown
Yeah I know that guy (well fro watching)
And I got a Master in mechanical engineering that could help x)
astral path
ehh i mean its a little bit of basic calculus, stats, and linear algebra
it's his actual lectures for CS229 that get hairy
hollow sentinel
well
there are people who don't know much of calculus, statistics, and linear algebra
that just try to jump into the course
it doesn't go well
astral path
(me 3 years ago)
astral path
it did not go well
hollow sentinel
lmao
astral path
i finished it last summer after learning some basic stuff
hollow sentinel
yeah that's what I'm trying to stress
the basics are important
I'm so done with these udemy people who are like oh you don't need to know math
astral path
^^^^^
marsh gale
Well my Math is def not the best, but I think i'll get my head back into it if necessary I not too worried about the maths (for now)
astral path
yeah so @marsh gale unless you just want to learn some black box models, you really need to know the math and at least the basic theory. and also there's some best practices you should know as well as some data wrangling
marsh gale
Uhm, honsetly I'd be fine for now with black boxes to start with (if they can do what I want them to do lol) otherwise really happy to dig my head inside it 🙂
astral path
do you want to learn it for like a single project or do you want to learn it for a lasting knowledge you'll use in multiple projects?
 versed glen
Hello, my friend's a little bit shy. She is a PhD student in Data Science, and she has a quite simple project to show her professor - but she'd like to build something more interesting on Keras - ResNet. She's not terribly advanced and she has about 15 days. Do you guys have any idea on what would be interesting to show? Any project or resource that you find intellectually worth?
I don't have much grasp on what this is all about, but she doesn't feel comfortable with English, so I'm kinda asking for her.
marsh gale
Well kinda both, I wanna learn it because im very interested in, also because it's prolly nice to have some advanced knowledge as an mechanical engineer..
Ive set myself a little project that I wanna accomplish but I'm just very interested in the whole idea
astral path
i mean you could try building a black box project just to get your feet wet but I would strongly suggest learning the boring theory before using it regularly
hollow sentinel
the math behind ML book is a good refresher course
astral path
I've read that
its good
ok lol anyways so i actually personally have some weird issue with my ML model
echo orbit
tidal bough
So do you want, like, a normally distributed random variable with a specific mea...
Sorry for the ping, but i think i found a better way to explain what i want : to initialize the walkers around a preferred position defined by 2 variables named m & b (here it's m_ml & b_ml)
astral path
the model works, but the feature importance is very, very off. I'm using the following categories categories = ['wins','seed','ppg', 'height', 'skew_pts', 'skew_minutes', 'skew_3pa', '2pt att', '2pt pct', '3pt att', '3pt pct', 'ft', 'oreb', 'dreb','astpg', 'stl', 'blk', 'turnovers', 'sos', 'momentum', 'experience'], and there's a similar project which I am basing mine off of which uses some similar statistics. here is the plot of their feature importances:


there's mine
if you look at the common features, they are very different even though I use the exact same data and model
from sklearn.ensemble import GradientBoostingRegressor
model = GradientBoostingRegressor(n_estimators=100, max_depth=5)
def showFeatureImportance(my_categories):
    fx_imp = pd.Series(model.feature_importances_, index=my_categories)
    fx_imp /= fx_imp.max()
    fx_imp.sort_values()
    fx_imp.plot(kind='barh')
``` here is the function for feature importanceas well as the model
 deft ruin
I wonder if you have a multicollinearity problem
maybe momentum is highly correlated with wins?
astral path
yeah momentum is the % of games won over the last 8 games, wins is the total games won
i was hoping to use this function to determine if there's any multicollinearity and fix it later
versed glen
versed glen
Hello, my friend's a little bit shy. She is a PhD student in Data Science, and s...
anyone?
deft ruin
@versed glen maybe something using a GAN to generate some images? It’s cool when you can see the output
@astral path you might be able to see it better with a correlation matrix
 slender hollow
versed glen
Hello, my friend's a little bit shy. She is a PhD student in Data Science, and s...
slender hollow
versed glen
Hello, my friend's a little bit shy. She is a PhD student in Data Science, and s...
i suggest some kind of a.i that detects song's genres or a generative algorithm that creates new songs of a certain genre
versed glen
Uh, I'm having a look
astral path
deft ruin
<@478676609914765322> you might be able to see it better with a correlation matr...
correlation between each feature?
deft ruin
yeah
astral path
aight i'll try it
deft ruin
df.corr() should do it
astral path
it's a numpy 2d array
ik it should use pandas but numpy array what the project i'm basing it on is using for features
astral path
aight will do that
wow uh
it outputs a 700 x 700 matrix for some reason
nvm it was shaped wrong
deft ruin
yeah should be the number of columns not rows
versed glen
thank you 😄 ✌️
astral path
aight here's the correllogram

 sage hornet
versed glen
Hello, my friend's a little bit shy. She is a PhD student in Data Science, and s...
sage hornet
versed glen
Hello, my friend's a little bit shy. She is a PhD student in Data Science, and s...
Frist of all you could teach her how algorithms work and what actually programming is. Then after knowing the math part, introduce her to a programming language. You also can start from learning batch, since it uses a lot the if - else statements and it is a good start! Hope this helps
astral path
how should i interpret it?
deft ruin
looks like there are a few that are highly correlated -- any chance the original model selected a subset of features? I noticed that your feature importance plot has more variables than the original
astral path
no, in both cases they are manually chosen. I just decided to choose some more
i was planning on reducing them after checking the feature importance
whole mural
sage hornet
Frist of all you could teach her how algorithms work and what actually programmi...
can I ask you a couple of questions ?
deft ruin
oh I see -- the different results are likely due to having different vars in the model
sage hornet
yeah but i will respond later
tell me
better to tell me in dm bc ill be offline in some mins
astral path
deft ruin
oh I see -- the different results are likely due to having different vars in the...
what should my next step be then?
deft ruin
depends on your goal -- are you trying to improve on the original model?
astral path
i'm just trying to build my own
so i actually started building mine before i disovered the other guy's project which happened to be almost the exact same as mine except in features used
he has the same dataset, models, everything
deft ruin
gotcha
you could running your model with the same variables included to check that you get the same result
astral path
i just decided to compare mine with his
deft ruin
but I wouldn't expect the feature importances to look the same unless the models are equivalent
astral path
i haven't scraped some of his variables tho
we both scraped from a certain website
if I was just going off my my own model, what would I do with the results of the correlogram?
deft ruin
if you have highly correlated vars in your data (dark colors in the graph), one of them can dominate in the feature importances or it can dilute how important they both are
you can try removing one of a pair of correlated vars and see how the model performance changes
or if the two are related you can try combining them to create a composite score
astral path
ah ok, i'll try that
deft ruin
mostly to help give you a clearer picture of how important that info is to the model
you could also try doing L1 penalized regression and see what vars come out
you'd have to normalize but it's one method for doing feature selection
astral path
partly what this model should do is predict if teams are outliers
i.e. because wins and seed are correlated features, if a team has a low seed but a high wins, it might have a higher probability of winning
astral path
deft ruin
you'd have to normalize but it's one method for doing feature selection
im already normalizing btw
deft ruin
if you expect interactions like that you'd have to explicitly include them in a liner model
otherwise you could stick with gradient boosting and use backward selection
what is the model predicting at the moment?
astral path
you mean accuracy?
deft ruin
I mean what's the dependent variable?
astral path
which team will win
features was built by taking the features of team1 and subtracting the features of team2
and labels is if team1 won or not
deft ruin
makes sense
astral path
it's currently at ~80% accuracy
which is very surprising tbh
given that the other guy's model was 76% at this same stage in development
deft ruin
nice job!
astral path
thanks!
idk what he ended up getting it to in terms of win prediction
but he got 64% accuracy for the bracket prediction and i'm not at that stage yet
that's good enough for winning most small pools
deft ruin
the only thing to consider is that asumming you have to make the bracket at the outset, you'll have less information about the teams than you do in the model data
deft ruin
i see - if you can make new predictions before each round then it's the same as the model
astral path
i'm trying to predict the entire bracket before the entire tourny starts
deft ruin
otherwise you'd have to predict multiple rounds ahead
deft ruin
oh nice I see
astral path
i'm hoping mine is higher because my model is currently more accurate
deft ruin
good luck!
deft ruin
np
astral path
how would I use boolean indexing on a 2d numpy array?
I have an array r of arrays a and want to filter out all arrays a which do not correspond to a value of True in an array of booleans
tidal bough
That sounds like you just want selection = r[booleans]
maybe selection = r[booleans,:]
astral path
oh shit i forgot to mention
i already tried those, but got
TypeError: only integer scalar arrays can be converted to a scalar index
tidal bough
what's booleans.dtype and booleans.shape?
astral path
dtype('bool') and (21,)
astral path
it's a list
ok so the problem is different than i thought
it's still the same error
ok i fixed it
had to call np.array(r)
thanks!
astral path
deft ruin
you could also try doing L1 penalized regression and see what vars come out
i took it down to 5 features and accuracy is boosted to 82%
using lasso
grave frost
what is your task? did you try MLP?
deft ruin
@astral path nice!
astral path
ye its getting close!
grave frost
also, how are you calculating accuracy?
astral path
accuracy=[]
for i in range(1):
    xTrain2, X_test, yTrain, Y_test = train_test_split(xTrain2, yTrain)
    results = model.fit(xTrain2, yTrain)
    preds = model.predict(X_test)

    preds[preds < .5] = 0
    preds[preds >= .5] = 1
    accuracy.append(np.mean(preds == Y_test))
    #accuracy.append(np.mean(predictions == Y_test))
    print("Finished iteration:", i)
    time.sleep(1.5)
print("The accuracy is", sum(accuracy)/len(accuracy))
this is what the other guy's project used for accuracy
tidal bough
ehh
grave frost
yeah, there are inbuilt functions for that 🤷 but anyways, I recommend CV
tidal bough
model.score(X_test,Y_test), IIRC
grave frost
MLP + CV + RandomSearch = 💸
grave frost
scikit's fine for most beginners
astral path
i'm predicting the outcome of games based on the two teams stats
grave frost
astral path
why MLP?
they can get pretty good accuracy given that there is plenty of datya
astral path
currently using gradient boosted trees
grave frost
astral path
i'm predicting the outcome of games based on the two teams stats
classification or regression?
grave frost
tried xgboost?
astral path
no i havent
grave frost
astral path
was more accurate than classification
what?
astral path
the accuracy for using gradient boosted trees was faster for regression than for classification
at least with that accuracy
im trying CV now
grave frost
umm...how can you convert a classification task to regression?
assuming the predictions would only be 1 or 2corresponding to the teams
astral path
it should be predicting the probability that team 1 wins
i guess i misworded the problem at hand earlier
astral path
the data is classified, the project i'm going on says that it should be predicting the probability
grave frost
hmm...and do you have to get SOTA or is any accuracy good?
astral path
what's SOTA?
grave frost
State of the art (or near it anyways)
grave frost
you can use TPOT if you like. let it run for a day, and it would give you the best model to use.
astral path
i dont have the time unfortunately
grave frost
though it would be run only on CPU
astral path
it has to be done by 10:00am tommorow, which is when march madness brackets are due
grave frost
astral path
it has to be done by 10:00am tommorow, which is when march madness brackets are ...
alright then. your current selection of algos looks good. Just try xgboost and MLP
then You can just leave it, becuase I doubt you can get better accuracy without more complex methods then
astral path
ok, i'll try that
how should i interpret sklearn's cross_val_score?
it returned array([-0.02697141, 0.2742972 , 0.38460552, 0.41426787, 0.19931307])
grave frost
astral path
how should i interpret sklearn's `cross_val_score`?
well, the CV score would be the most accurate one and you can identify your model performance as well as its ability to generalize
grave frost
astral path
it returned `array([-0.02697141, 0.2742972 , 0.38460552, 0.41426787, 0.19931...
probably something in your implementation. I dont use Sklearn much 🤷
deft ruin
that's probably the mean squared error
tidal bough
Negative MSE?
deft ruin
oh actually negative wouldnt make sense
astral path
docs say it's Array of scores of the estimator for each run of the cross validation.
i mean the example from the docs has [0.33150734 0.08022311 0.03531764] as an example return
grave frost
I think there is prob something wrong you are doing. Because scores cant be negative
astral path
it's always the first score too
array([-0.03259814, 0.25771527, 0.39029545, 0.41231937, 0.20144599]) is another iteration
tidal bough
if it's a regression model, it defaults to explained_variance I guess
though that's positive too I think lol
deft ruin
i think it's R^2 by default
which can go negative
that's assuming you are using GradientBoostingRegressor
astral path
yea thats what im using
deft ruin
if you use GradientBoostingClassifier it will give you the mean accurary
otherwise you can specify the score function in cross_val_score
to clarify -- if you call cross_val_score on a GBC object it will give you mean accuracy by default
since the classifier is specialized for this kind of task
astral path
from sklearn.model_selection import train_test_split
from sklearn.model_selection import cross_val_predict
from sklearn import metrics

scores = cross_val_predict(model, xTrain2, yTrain, cv=6)

accuracy = metrics.r2_score(yTrain, scores)
print("Cross-Predicted Accuracy:", accuracy)
tried this and got Cross-Predicted Accuracy: 0.2599471623450441
deft ruin
looks roughly like a mean of the vector you posted before so that part makes sense -- still r^2 and accuracy are not the same so I wouldn't use them interchangeably
astral path
i got this from TowardsDataScience
deft ruin
it probably makes more sense in a regression context since r^2 measures how much variance is explained by the model
astral path
changing the features got Cross-Predicted Accuracy: 0.4835680064756881
should i just change it to r^2 then in text
deft ruin
oh come to think of it guess it's the same since the residuals will always be one or zero
hah that's a bit of a hack
I think it'd be a lot clearer using something like classification_report
astral path
i'll try that
also setting up MLP and xgboost
MLP got classification_report: 0.29802955665024644
model = MLPClassifier(solver='lbfgs', alpha=1e-5, hidden_layer_sizes=(5, 2), random_state=1)
merry fern
elfin spruce
master = master.apply(lambda x: x.append([x for x in [btc, eth, ltc, djia, dxy,...
TypeError: to_append should be a Series or list/tuple of Series, got DataFrame
astral path
ohh
i just renamed it to classification report
mb
i thought you meant as a name not like change the metric hehe
deft ruin
you give it y_pred and y_true (from cross_val_predict) and it gives you a table with precision, recall, accuracy, etc.
lol my bad not clear at all
sorry I have y_pred and y_true backwards there
astral path
              precision    recall  f1-score   support

           0       0.81      0.83      0.82        84
           1       0.84      0.82      0.83        87

    accuracy                           0.82       171
   macro avg       0.82      0.82      0.82       171
weighted avg       0.82      0.82      0.82       171
``` for MLPnice looks like you're getting similar performance as with the gbtrees
astral path
          precision    recall  f1-score   support

           0       0.70      0.66      0.68        47
           1       0.69      0.73      0.71        49

    accuracy                           0.70        96
   macro avg       0.70      0.70      0.70        96
weighted avg       0.70      0.70      0.70        96
``` gbtreesso it's less accurate
             precision    recall  f1-score   support

           0       0.74      0.72      0.73        36
           1       0.73      0.75      0.74        36

    accuracy                           0.74        72
   macro avg       0.74      0.74      0.74        72
weighted avg       0.74      0.74      0.74        72
``` XGBoostkudos to @grave frost looks like that performed better
deft ruin
np!
astral path
oh damn wow
            precision    recall  f1-score   support

           0       0.85      0.85      0.85        20
           1       0.70      0.70      0.70        10

    accuracy                           0.80        30
   macro avg       0.77      0.77      0.77        30
weighted avg       0.80      0.80      0.80        30
he wasnt kidding, MLP + CV + RandomSearch is money
misty flint
nice
astral path
@grave frost so I've got the model working and optimized and everything, but I need it to output probability of team 1 winning rather than if team 1 will win, and the accuracy of MLP Regression is about .6 as compared to MLP Classification which is about .8
is this to be expected? Or should I be doing something else
merry fern
elfin spruce
df = pd.concats(btc, eth, ltc, djia, dxy, ndq, spx, vix)
got me some errors but thx for trying
grave frost
astral path
<@!738058085083381760> so I've got the model working and optimized and everythin...
There are a lot of factors in ML, but I for one have never tried to convert classification tasks to regression and vice-versa. technically, classification is hidden regression but again, you usually do not change anything like that.
Next up, is the fact that in regression - you have one discrete output (a float). that has a range of [0,1]. but in classification, it just has to output either of the 2 values, so that would naturally make more performance as the margin of error becomes much lower.
Even then, I wouldn't have expected a score difference of 20 percent ¯_(ツ)_/¯ but for regression, I would put it down to feature engineering. So, I recommend you stick to classification
astral path
Ok, that helps. I think for my purposes I can just ignore needing probability
thanks!
grave frost
cool, no worries 👍
astral path
i'm creating a new array of features and labels by doing this:
team_features = []
team_labels = []
for i, row in tourney_games.iterrows():
    team_features.append(get_stats(row['win_url']).iloc[0])
    team_features.append(get_stats(row['los_url']).iloc[0])
    team_labels.append(tourney_wins(row['win_url']))
    team_labels.append(tourney_wins(row['los_url']))
however, len(team_features) is 1552 and len(team_labels) is 1390, and I have no clue why that would possibly happen
because i add to each of them the same # of times
any help?
thanks and cheers!
astral path
how do you mean?
just look at the two lists?
just looking at them i dont see anything
misty flint
like which rows are being added vs which ones arent
astral path
how would I check that?
(also note that the for loop is very slow)
team_features should look like
 wins            27.000000
 seed             2.000000
 WAS              2.000000
 WAS_seed_avg    -0.062500
 ppg             80.600000
 height          77.600000
 skew_pts         0.156292
 skew_minutes    -0.345443
 skew_3pa         0.801353
 2pt att         32.200000
 2pt pct          0.574000
 3pt att         24.000000
 3pt pct          0.362000
 ft              15.000000
 oreb             8.800000
 dreb            25.900000
 astpg            7.100000
 stl              3.400000
 blk             11.000000
 turnovers       17.000000
 sos             24.080000
 momentum         1.000000
experience 1.700000```team_labels should be a single integer from 0-6 (i verified all results are ints in this range)
deft ruin
By the way MLPClassifier (and GradientBoostingClassifer) has a method called predict_proba that will give you the probabilities
astral path
oh yeah i saw that
it was basically always almost exactly 1 and 0
for win and loss probability
deft ruin
Yeah that’s pretty common
Not sure on your other question — you might want to just save your scraped data in a file if get_stats is actively scraping each time it’s called — then you can manipulate the data more easily
astral path
hmm yeah i'll do that
 astral path
and read_csv!
 astral path

here is a plot of the correlation between each feature and the label in my training set
i'm filtering by importance
should I keep the ones with a strong negative correlation along with the strong positive ones?
thank you! (i need help rather quickly too)
 pure gull
@astral path negative correlations are also important so I would keep them - but not knowing anything at all about your problem.
grave frost
pretty great article that outlines the basics of the HTM theory:- https://towardsdatascience.com/towards-the-end-of-deep-learning-and-the-beginning-of-agi-d214d222c4cb
Medium
How recent research points the way towards defeating adversarial examples and achieving a more resilient, consistent and flexible A.I
(ignore any idiots in the comments)
hardy agate
how can make a real world life simulation in python but with ai's bessically i want to see a real life world with ai's smart as hell
 dark haven
Maybe you should start with something easier lol
hardy agate
it's cool lol could you help me out with this ? @dark haven
dark haven
I would if I knew how to
hardy agate
i see
dark haven
This is some really complex stuff
 light merlin
Is it possible to get ml/ai jobs with only a BS?
serene scaffold
@light merlin yes
Though your degree will probably have to be very geared towards those kinds of jobs
grave frost
hardy agate
how can make a real world life simulation in python but with ai's bessically i w...
lol if only it were that simple
you would need so many components just to get it to work on a basic level (not to mention the resources required). it is not like downloading the exe of a game and executing it.
grave frost
serene scaffold
Though your degree will probably have to be very geared towards those kinds of j...
any idea for corporate research?
serene scaffold
grave frost
any idea for corporate research?
Like, what classes to take if you want to get a corporate research position?
grave frost
serene scaffold
Like, what classes to take if you want to get a corporate research position?
no, like do we really need to do PhD, or is master with Bach. good enough?
serene scaffold
grave frost
no, like do we really need to do PhD, or is master with Bach. good enough?
Idk honestly
 static island
What's data science?
lean ledge
grave frost
no, like do we really need to do PhD, or is master with Bach. good enough?
Realistically you won't ever get a research position with just a bachelor's unless you're crazy genius. You won't get it with a master's unless it's the "did my bachelor's + master's at MIT and also published multiple Neurips papers" type of master's person
Rules loosen at less nice companies, but so does what it means to do "research"
Although it's probably more likely if you were already a data scientist doing good level ML work at the big company and transferred to a research part, but even then the people I know who've done that are doing research engineering not science
 polar charm
Hello, i'm trying to scrape sp500 stock data from yahoo. I have
start = datetime(2005, 1, 1)
end = datetime(2021, 3, 18)
df = web.DataReader('^GSPC', 'yahoo' , start, end)
and it get the data fine when I'm doing print(df.head()) or df.tail
but I can't remember how to use panda to write the data to a csv fine (preferably with adj. close as a columns)
ping me if you have a answer 🙂
serene scaffold
@polar charm did you verify that you're allowed to scrape from that website?
polar charm
I get the data, and there's multiple people if guides and vids on how to do it
serene scaffold
right, but that doesn't guarantee that the terms of service for that website actually permits scraping
polar charm
there's just a limit on how many request you can do a day
serene scaffold
alright
polar charm
okay.
serene scaffold
if you have the dataframe that you want, you just have to use the to_csv method
!docs pandas.DataFrame.to_csv
arctic wedgeBOT
DataFrame.to_csv(path_or_buf=None, sep=',', na_rep='', float_format=None, columns=None, header=True, index=True, index_label=None, mode='w', encoding=None, compression='infer', quoting=None, quotechar='"', line_terminator=None, chunksize=None, date_format=None, doublequote=True, escapechar=None, decimal='.', errors='strict', storage_options=None)```
Write object to a comma-separated values (csv) file.

Changed in version 0.24.0: The order of arguments for Series was changed.

Parameters  **path\_or\_buf**str or file handle, default NoneFile path or object, if None is provided the result is returned as a string. If a non-binary file object is passed, it should be opened with newline=’’, disabling universal newlines. If a binary file object is passed, mode might need to contain a ‘b’.

Changed in version 0.24.0: Was previously named “path” for Series.

Changed in version 1.2.0: Support for binary file objects was introduced.

**sep**str, default ‘,’String of length 1. Field delimiter for the output file.

**na\_rep**str, default ‘’Missing data representation.

**float\_format**str, default NoneFormat string for floating point numbers.

**columns**sequence, optionalColumns to write.... [read more](https://pandas.pydata.org/pandas-docs/stable/reference/api/pandas.DataFrame.to_csv.html#pandas.DataFrame.to_csv)are you familiar with how to use methods?
polar charm
I don't think so
serene scaffold
it sounds like you should spend more time on Python fundamentals
polar charm
might be. but do you have an answer?
serene scaffold
if you have the dataframe that you want and it's name is df, then df.to_csv('some/file/path.csv'), that will save the data to csv
polar charm
ohh I forgot to name the file.
ty
it worked! Now I just need to remove most of the columns, so I'm left wirth adj. close
serene scaffold
polar charm
it worked! Now I just need to remove most of the columns, so I'm left wirth adj....
adj. close is the exact name of the column?
you can select columns
df[['adj. close']].to_csv(...)
polar charm
also you sounded like a teacher with the "learn the fundamentals" he said I should learn HTML before python, when I asked him about some python thing
yas
serene scaffold
polar charm
also you sounded like a teacher with the "learn the fundamentals" he said I shou...
don't learn HTML unless you want to do web development
it won't help you learn python at all
polar charm
he said he would
serene scaffold
I disagree
polar charm
okay
serene scaffold
however you can't skimp on the basics of the language that you're using. you don't need to know Python's entire data model, though methods are pretty critical to how the language works.
polar charm
I think that if you want to code a deep learning network, and you have never touched python before, you should just jump in and fiquire it out on the way
I did that
serene scaffold
I agree with learn by doing, though neural networks aren't the thing I'd do to learn the language basics
One of our staff members (to understate his qualifications) curates a list of project ideas
!projects
arctic wedgeBOT
Kindling Projects
The Kindling projects page on Ned Batchelder's website contains a list of projects and ideas programmers can tackle to build their skills and knowledge.
polar charm
but tank a lot. I got my csv file with only adj close
 native lark
serene scaffold
One of our staff members (to understate his qualifications) curates a list of pr...
native lark
serene scaffold
One of our staff members (to understate his qualifications) curates a list of pr...
i mean you're technically correct.....
serene scaffold
native lark
i mean you're technically correct.....
about what?
polar charm
who's the unnamed person?
serene scaffold
nedbat
polar charm
does he have a programming degree?
serene scaffold
if he doesn't have a programming degree, then programming degrees are meaningless
polar charm
oh okay. so he really good?
serene scaffold
ye
polar charm
nice
serene scaffold
however having a computer science degree doesn't make you good
you have to make yourself good. the degree just gives you some cred
polar charm
yup. I have heard chefs saying (I have been a trained chef for 25 years!) yes, but that doesn't mean you are good at cooking
I have dis: model.fit(X=df, y=df, batch_size=10, epochs=30, verbose=2)
But get this error: TypeError: fit() got an unexpected keyword argument 'X'
df is df = pd.read_csv('^GSPC.csv')
do I need a second set of data?
serene scaffold
@polar charm you'll need to check the method signature for model.fit
evidently, X is not a valid argument
polar charm
I changed it to a x and got Failed to convert a NumPy array to a Tensor (Unsupported object type float).
serene scaffold
polar charm
I changed it to a x and got Failed to convert a NumPy array to a Tensor (Unsuppo...
so x is a numpy array?
hmm
!docs numpy.ndarray.astype
arctic wedgeBOT
ndarray.astype(dtype, order='K', casting='unsafe', subok=True, copy=True)```
Copy of the array, cast to a specified type.

Parameters  **dtype**str or dtypeTypecode or data-type to which the array is cast.

**order**{‘C’, ‘F’, ‘A’, ‘K’}, optionalControls the memory layout order of the result. ‘C’ means C order, ‘F’ means Fortran order, ‘A’ means ‘F’ order if all the arrays are Fortran contiguous, ‘C’ order otherwise, and ‘K’ means as close to the order the array elements appear in memory as possible. Default is ‘K’.

**casting**{‘no’, ‘equiv’, ‘safe’, ‘same\_kind’, ‘unsafe’}, optionalControls what kind of data casting may occur. Defaults to ‘unsafe’ for backwards compatibility.... [read more](https://docs.scipy.org/doc/numpy/reference/generated/numpy.ndarray.astype.html#numpy.ndarray.astype)x is point to X which is the csv fine
serene scaffold
polar charm
x is point to X which is the csv fine
is it a csv file or a dataframe?
polar charm
a csv file
grave frost
lean ledge
Realistically you won't ever get a research position with just a bachelor's unle...
hmm...so PhD is basically a requirement?
serene scaffold
you shouldn't be passing a file to model.fit
polar charm
the one I asked help to create
serene scaffold
you probably need to pass a tensor
serene scaffold
@polar charm I'd need to know what the data looks like to say
lean ledge
grave frost
hmm...so PhD is basically a requirement?
For research? It basically always is
polar charm
 grave frost
lean ledge
For research? It basically always is
grave frost
lean ledge
For research? It basically always is
hmm...
polar charm
start your own research team
serene scaffold
@polar charm your x data should probably be the data in the Date column, though I'm not sure how you'd represent that data numerically
grave frost
lean ledge
For research? It basically always is
and how long do ML PhD's are (on average)?
lean ledge
5-6 years in the US (no masters needed)
3-4 years in most of the rest of the world (with a requirement of 1-2 years on masters/honours)
polar charm
serene scaffold
<@!238271740302589952> your `x` data should probably be the data in the `Date` c...
I can't save only the date column for some reason
serene scaffold
polar charm
I can't save only the date column for some reason
why are you trying to save it?
polar charm
so I can feed x the date data (which makes no sense now I think about it)
 candid sable
Is there a way of seeing what parts of the array formatted images my classifier is using in order to make a decision? I have it as a retrained InceptionV3
polar charm
do I run df.to_numpy() with the name of the csv in the ()?
 opal jackal
hey
anyone working on pose detection?
or maybe just face detection?
any help would be great
polar charm
sentdex on yt has some vids about face reg
misty flint
@astral path thought of you https://www.youtube.com/watch?v=pPfw2fzwNiM&ab_channel=KenJee

Will my machine learning model dominate all other March Madness Brackets, or will my friend Bobby win all of my most important belongings? Find out in this new video!
Model comparison tool: https://share.streamlit.io/playingnumbers/march_madness_predictions
Simulation Tool: https://share.streamlit.io/playingnumbers/basketball_sim_dash/main
Kagg...
exotic maple
@misty flint is the master of youtube videos about DS
misty flint
i just follow a lot of data scientist youtubers
i actually listen to a ton more podcasts
videos tend to eat up more time
ken's podcast is great btw. he interviews a lot of practioners

Spotify
Listen to Ken's Nearest Neighbors on Spotify. Welcome to Ken's Nearest Neighbors, the podcast where I interview the most interesting people I can find on Data Science, Sports Analytics, Content Creation, Health, Performance, and much much more!
also the title is a pun - ken's nearest neighbors
exotic maple
I refuse to listen to podcasts since my dumb-as-fuck neighbor decided to start one
misty flint
y i k e s
exotic maple
misty flint
also the title is a pun - ken's nearest neighbors
explaining the joke usually ruins it
:v
 exotic maple
Can you please ruin my company's servers? i'd like a day off to study sentiment analysis calmly zzz
misty flint
 bronze skiff
grave frost
pretty great article that outlines the basics of the HTM theory:- https://toward...
bronze skiff
grave frost
pretty great article that outlines the basics of the HTM theory:- https://toward...
As Jeff points out, deep learning leaders like Jeff Hinton have
jeff hinton
oof
exotic maple
I couldnt imagine being a researcher much less in this field
your knowledge become obsolete every..30 minutes?
exotic maple
some guy somewhere in the US, UK, China or Germany is always working whatever youre woking on, but better
and if not bettr, they get it out first
bronze skiff
i think people vastly overestimate how fast research goes
exotic maple
I dont like research either
I think i told squiggly
"I respect reseracher but for God's sake i find their work unbearably boring"
misty flint
i still might do this summer research thing this summer if i dont get a decent internship

whats it called when you do stuff you know you dont like
being a clown? 
 lime goblet
masochism !
misty flint
exotic maple
misty flint
whats it called when you do stuff you know you dont like
Working?
abandon society; return to monkey
 young dock
is there a such thing as multiple quantile regression?
bronze skiff
why not
misty flint
i heard roger peng talk about that on a podcast
so i know theres an R package for it
💀
bronze skiff
you don't need an r package for it lmao
its just regression with a shifted pinball loss
young dock
which package?
grave frost
bronze skiff
`As Jeff points out, deep learning leaders like Jeff Hinton have`
wasn't it george hinton of the OG neural networks?
so this is a fake site for the book's PDF - but I have got to say the comments are golden for such an academic book http://fullbooks.site/1541675819
 marsh berry
Does pandas expect dates to be in a specific format?
hardy agate
grave frost
you would need so many components just to get it to work on a basic level (not t...
yeah i know
 uncut bloom
grave frost
hardy agate
yeah i know
uncut bloom
grave frost
hardy agate
yeah i know
Before doing the project, I recommend you do the following things:-
- Learn about Reinforcement-learning and python
- Make sure your head is clear and if not, go and fash your face and think about your life choices
- Just get a PhD
hollow sentinel
misty flint
sounds like something a fang research team would be working on
and he's going to do it single handedly
 shut valve
hardy agate
and what the fuck i asked for help not to be judjed
shut valve
hardy agate
and what the fuck i asked for help not to be judjed
Programming the universe by Seth Llyod https://www.amazon.com/Programming-Universe-Quantum-Computer-Scientist/dp/1400033861
hardy agate
il have a look!
shut valve
its not about ai or cs as much as it is physics. Your ideas a bit big but dream big but make small goal my man
hardy agate
hm
hollow sentinel
might want to start a bit smaller than real life simulator
like maybe do the math along w starting to learn the libraries like Numpy, pandas, sklearn
that’ll give you a good basis
also Kaggle is a great resource
shut valve
^ Kaggle! the courses are amazing
hardy agate
cool
hollow sentinel
You can learn a lot from just reading people’s code
hardy agate
hm
cool
ill have a look at kaggle
im trying to understand this nr
rn
Building neural networks from scratch in Python introduction.
Neural Networks from Scratch book: https://nnfs.io
Playlist for this series: https://www.youtube.com/playlist?list=PLQVvvaa0QuDcjD5BAw2DxE6OF2tius3V3
Python 3 basics: https://pythonprogramming.net/introduction-learn-python-3-tutorials/
Intermediate Python (w/ OOP): https://pythonpr...
@hollow sentinel @shut valve
hollow sentinel
how’s your linear algebra, calculus, and probability theory?
hardy agate
no
hollow sentinel
that’s what my friends recommended I know before neural nets
hardy agate
yeah i figured
hollow sentinel
yeah I would suggest you learn those
bc otherwise you’re gonna get lost really quickly
hardy agate
i see
hollow sentinel
speaking from firsthand experience
hardy agate
i see
hollow sentinel
I hope it doesn’t seem like I’m gatekeeping
I’m just saying foundational knowledge is very important
hardy agate
yeah i got it lol it's cool
shut valve
honestly just do the kaggle courses first way more fun. you not gonna wanna learn linear unless your really serious and interested in deep learning
build some motivation for it first see if you even like it
hardy agate
cool i'll try doind kaggle
i should start with the intro right
intro to machine learning
hollow sentinel
Do you have your python basics down
hardy agate
yes
hollow sentinel
ok good
hardy agate
100% done
shut valve
yeah intro to ml, intermediate ml, then intro to deep learning.
hardy agate
cool
shut valve
you might wanna do the pandas one if you have never used pandas
hollow sentinel
That alone however won’t give you a great foundation for neural nets
the math is pretty important
shut valve
yeah but you gotta like it enough to do three small courses then you can decided what to do next
hardy agate
shut valve
yeah but you gotta like it enough to do three small courses then you can decided...
got it
serene scaffold
Pandas is for data manipulation. It ultimately has little to do with the actual ML/AI
hardy agate
is it wordth it
hardy agate
serene scaffold
Pandas is for data manipulation. It ultimately has little to do with the actual ...
ah i see so it's more like parsing/visually looking at the data ? :c
serene scaffold
hardy agate
ah i see so it's more like parsing/visually looking at the data ? :c
it's not for visualization
hardy agate
got it
hollow sentinel
matplotlib and seaborn
serene scaffold
you can print out what data is in it, but it won't even give you the full picture unless you specifically ask it to
hollow sentinel
that’s what you use for data visualization
hardy agate
ah got it
serene scaffold
@hollow sentinel did you implement merge sort?
hollow sentinel
@serene scaffold I did the first function I still have to do the other function
hardy agate
im confused already
misty flint
hollow sentinel
Can’t do that Rex has nitro
hardy agate
:c
shut valve
before i go back to work has anyone taken the tensorflow certification exam if you did (or are studying for it) dm me I'm wondering if its all sequential or if i should be good at functional api with multiple inputs?
misty flint
i am also wondering the same
 distant trout
Hi, anyone has a moment to helpme with matplotlib to make few animated charts which takes data from different txt files?
misty flint
just ask your question. if anyone can help, they will
distant trout
i already asked on #help-cherries
bronze skiff
shut valve
before i go back to work has anyone taken the tensorflow certification exam if y...
easy answer: use pytorch
hardy agate
model = keras.Sequential([
    keras.layers.Flatten(input_shape=(28,28)),
    keras.layers.Dense(128, activation='relu'),
    keras.layers.Dense(10 , activation='softmax')
])

model.compile(optimizer='adam',
              loss='sparse_categorical_crossentropy'
              metrics=['accuracy'])
what is the syntax error here
  File "<ipython-input-11-542e8608aa3b>", line 9
    metrics=['accuracy'])
          ^
SyntaxError: invalid syntax
:c
bronze skiff
you're missing a comma
bronze skiff
after your loss
hardy agate
o got it
bronze skiff
"hey i read your paper on distributed curved exponential fams and i think its pretty lit, and i wanna get involved plz thx"
 spiral trail
If you wanted detect physical trades within a picture.. how would you do that? For example a hand, an eyebrow.. or an ass? 🤔
It's for science! 👀
hardy agate
lmfao