#data-science-and-ml
1 messages · Page 291 of 1
 lavish swift
 shut slate
ye
lavish swift
should be able to df.to_csv(path_to_file.csv)
replace df with the name of whichever dataframe you want to create a csv from
also, pandas has lots of options for reading and writing csv files, might be worth of look if you're looking to do something specific.
lavish swift
That line I gave you above should work, just give .to_csv() a path to work with
shut slate
ok I erased the df1 completely, thank god I was smart enough to make 3 copies
lol
File "<ipython-input-85-3aedcd768420>", line 1
df1.to_csv("C:\Users\redacted\Dropbox\Documents\Elite")
^
SyntaxError: (unicode error) 'unicodeescape' codec can't decode bytes in position 2-3: truncated \UXXXXXXXX escape
😦
lol
soory if I m bothering you lol
lavish swift
On Windows you need to watch the backslashes in your path, they escape characters. Try "C:\Users\redacted\Dropbox\Documents\Elite\my_file.csv"
shut slate
Samething
hmm let me google
df1.to_csv(r"C:\Users\redacted\Dropbox\Documents\Elite\my_file.csv")
This worked
lavish swift
nice!
shut slate
what does the r do?
lavish swift
r = raw, means don't escape anything.
I also just noticed that my line above took out the extra slashes I put in
"C:\\Users\\redacted\\Dropbox\\Documents\\Elite\\my_file.csv"
that's what I sent. That should also work
shut slate
Ok thanks
I will create a bar graph no and a geomap
Should take me 5 hours and then I will be done for the day
lol
lavish swift
ha! good luck!
 slow flax
Pondering how to get Python 3.9 running on Databricks since there's not currently a runtime that supports > 3.8. My idea is to run a cluster init script that installs 3.9 and then see if setting the PYSPARK_PYTHON environment variable to point to the install location does the trick. Don't see why it wouldn't work, but any other ideas?
 mellow sun
Can anyone help me? i am getting some really weird model results i can't figure out why
 grave frost
mellow sun
Can anyone help me? i am getting some really weird model results i can't figure ...
grave frost
mellow sun
Can anyone help me? i am getting some really weird model results i can't figure ...
welcome to Machine Learning 🙂
BTW if you post your problem here, someone might be able to better help you
mellow sun
I am running 4 ML methods: Random Forest, Gradient Boost, Logistic Regression, and RNN. They are being run a credit card default data set. The first 2 seem to run fine and the results make sense. Here is the conf matrix for RF:

My last two are way off and look weird
here is the LG result

i can't figure out why its not fitting correctly
RNN training looks like this

 undone scarab
anyone machine learning devs able to help, my GAN accuracy does not improve from 0 even after thousands of epochs, not sure why
 arctic wedgeBOT
Hey @undone scarab!
It looks like you tried to attach file type(s) that we do not allow (.html). We currently allow the following file types: .gif, .jpg, .jpeg, .mov, .mp4, .mpg, .png, .mp3, .wav, .ogg, .webm, .webp, .flac, .m4a.
Feel free to ask in #community-meta if you think this is a mistake.
undone scarab
undone scarab
anyone machine learning devs able to help, my GAN accuracy does not improve from...
my code can be found here: https://paste.ofcode.org/EPdRW2bKfRAw22jtsktUQH
 misty flint
not familiar with vsc. sorry. i usually use pycharm or jupyter
undone scarab
mellow sun
I am running 4 ML methods: Random Forest, Gradient Boost, Logistic Regression, a...
share code?
also a lil off topic for ur current situation but play around with sklearn's GridSearchCV function and u will be able to make ur models more optimized
do they have any documentation of sorts??
mellow sun
@undone scarab code is here: https://colab.research.google.com/drive/1gADi2h2iJfwR1ISO192I6A3jVOPalIwA?usp=sharing

i think i got it though
i had to transform the data using a scaler
undone scarab
i dont have acess

 candid sable
Hello guys - what solution would be recommended for doing point and landmark labeling of images?
grave frost
mellow sun
what is the task?
 ripe forge
shut slate
ripe forge
shut slate
Maybe put the plot line up top and try?
 warm sphinx
Hello Everyone.
I have written a blog on image similarity without using any fancy techniques such as CNNs and more. It uses pure maths and basic programming and the results are pretty good. Please do give it a read.
https://www.analyticsvidhya.com/blog/2021/03/a-beginners-guide-to-image-similarity-using-python/
I am also new to this group but I aim to learn a lot from you guys. Thank you everyone
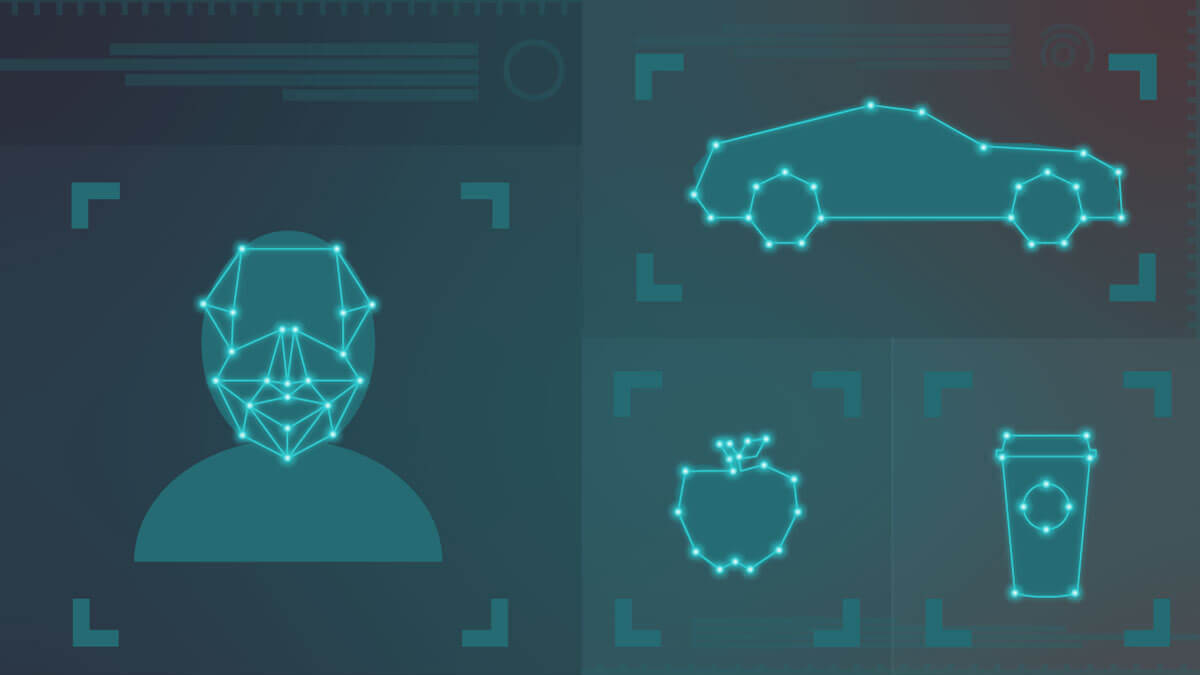
Image similarity is topic not talked about in the field of computer vision. In this article, let us understand Image similarity in Python
 whole mural
anyone knows how to plat data like shown in the chart, or what kind of dataset is required for this ?

don't forget to ping on reply 😅
 lapis sequoia
Hello, can someone help, I tried advices from https://stackoverflow.com/questions/34682828/extracting-specific-selected-columns-to-new-dataframe-as-a-copy but nothing work

# %% [markdown]
# ---
#
# **TASK #1: Resample the data into weekly bins**
#
# - Store the result in DataFrame referenced by variable `night_mexico_w_angles_df` in DataFrame `night_mexico_1w_sample`
# - Make a selection to only use column `counts`
# - See:
#     - https://pandas.pydata.org/pandas-docs/stable/reference/api/pandas.Series.resample.html
#     - Note: when pd.Timedelta() is used more, string formats are supported
#     - `pd.Timedelta('1day')` works, `resample('1day')` does not.
#     - https://pandas.pydata.org/pandas-docs/stable/user_guide/timeseries.html#offset-aliases
#     - https://pandas.pydata.org/pandas-docs/stable/reference/api/pandas.Timedelta.html
#
# ---

# %%
night_mexico_1w_sample = night_mexico_w_angles_df[['counts']].copy()
night_mexico_1w_sample

# TODO
 velvet thorn
lapis sequoia
Hello, can someone help, I tried advices from https://stackoverflow.com/question...
velvet thorn
lapis sequoia
Hello, can someone help, I tried advices from https://stackoverflow.com/question...
...have you looked closely at the code you wrote?
or the error?
can you suggest to me what you think the problem is
lapis sequoia
I think, the problem is that it gives me AttributeError: 'Series' object has no attribute 'counts'.
grave frost
warm sphinx
Hello Everyone.
I have written a blog on image similarity without using any fanc...
good one. Too often people treat Deep Learning as a silver bullet for their tasks that can be done with simple algos.
warm sphinx
grave frost
good one. Too often people treat Deep Learning as a silver bullet for their task...
Thank you. I just wanted people who are scared of terms like CNNs DNNs to move past that barrier and understand that the world offers many ways to do and all you need is passion. I personally was shit scared when I heard people talk about DL but I did this as one of my assignments got to learn something and now I am confident.
Thank you for your reply.
grave frost
shit scared when I heard people talk about DL
It's not that tough. classical DL is a tinker toy compared to the really sophisticated stuff in development
warm sphinx
I still have a long way to go. Thanks for the help. Love to be a part of this group
grave frost
once you build a MLP (Multi -layer perceptron) that is very easy and van be done on 10 lines, you would realize that DL is just that scaled up
warm sphinx
ATTENTION IS ALL YOU NEED ? naah Passion is all you need 😁
grave frost
self attention is a bit complicated IMO
grave frost
warm sphinx
*ATTENTION IS ALL YOU NEED* ? naah Passion is all you need 😁
but really agree about passion. I consider it to be one of the most important aspect
warm sphinx
Thank you
grave frost
while a lot of people say that passion is not really necessary - it's a pretty common occurrence in really successful people. passion provides such a powerful internal motivation because a passionate person would do anything because he/she loves his work so much.
especially in tech
lapis sequoia
velvet thorn
or the error?
I tried, but I don't understand it at all
 dapper hatch
I am starting with pandas. There is a function similar to Excel's vlookup in Pandas?
candid sable
pd.merge()
 primal tulip
dapper hatch
I am starting with pandas. There is a function similar to Excel's vlookup in Pan...
primal tulip
dapper hatch
I am starting with pandas. There is a function similar to Excel's vlookup in Pan...
Depends on what kind of data you're looking for. You can do something like
df['column_name' == 3] and it'll filter those values in that column_name that are equal to 3
 hoary wigeon
Hello
Can anyone teach me or instruct or provide source code for for how to fetch the table data from worldometer website ?
primal tulip
You could follow up a tutorial on lxml and requests library from python and read on how does XPATH works. Let me look for some resources for you. Give me a second.
primal tulip
hoary wigeon
Hello
https://lxml.de/ lxml official site with it's installing instructions and documentation. This will help you fetch the elements of the html.
https://requests.readthedocs.io/en/master/ requests library which helps you connect to the website itself.
Note that you could also use the beautiful soup library instead of lxml. I find lxml easier.
Here you'll find someone actually scraping with python and lxml
https://www.youtube.com/watch?v=5N066ISH8og
Come back with any follow-up question when you try it yourself @hoary wigeon
candid sable
Anyone knows an image labeling tool that can do point and landmark labeling?
lapis sequoia
young
 exotic maple
warm sphinx
Hello Everyone.
I have written a blog on image similarity without using any fanc...
exotic maple
warm sphinx
Hello Everyone.
I have written a blog on image similarity without using any fanc...
Hey man I looked into this and it looks pretty cool. I certainly wouldnt have thought that simple Euclidean distance could be used for image recognition
 bronze skiff
exotic maple
Hey man I looked into this and it looks pretty cool. I certainly wouldnt have th...
bronze skiff
exotic maple
Hey man I looked into this and it looks pretty cool. I certainly wouldnt have th...
you wouldn't have thought that because its a terrible idea
exotic maple
bronze skiff
you wouldn't have thought that because its a terrible idea
While it might not be "optimal" I don't see why it is exactly a terrible idea? Can you please elaborate?
bronze skiff
euclidean distance is an awful metric for image similarity-- you can arbitrarily make an image "dissimilar" by adding a constant noise to the image, or even a constant value shift to the pixels
count histograms are a decent idea-- it was heavily used pre cnn days, but the metrics used were scale invariant
in the end, if you wanted a suitable loss functiom you'd end up with convolutions anyway
grave frost
@bronze skiff the point was not in making a good algo, the point was just using something with simple algos for beginners to get their hands dirty and learn a bit about how things are like in DS/ALGO/ML like.
Though ofc, a lot of stuff has improved but still simple algos are one of the best ways to introduce beginners. DL in general is a bit complex when approaching it at the start
bronze skiff
beginners should know what and why things are awful
warm sphinx
bronze skiff
beginners should know what and why things are awful
You seem to be one of them 😅
warm sphinx
exotic maple
Hey man I looked into this and it looks pretty cool. I certainly wouldnt have th...
I tried to show how count histograms can be used. I yet did not include cross bin relations but they are known for giving better results. Mahalanobis Distance is another distance metric that is much more generic however with the SOTA available now this is indeed not practically efficient but enough to get a beginner excited 😁
exotic maple
bronze skiff
beginners should know what and why things are awful
Please explain how can a "beginner" know what and WHY something is bad. This is hilariously out of touch.
warm sphinx
I tend to ignore such things. There are a couple of people who loved it and I am pretty happy with it
 hollow sentinel
warm sphinx
You seem to be one of them 😅
hollow sentinel
warm sphinx
You seem to be one of them 😅
uhhh pastafish is no beginner
warm sphinx
hollow sentinel
uhhh pastafish is no beginner
Definitely not but he is awful
bronze skiff
¯\_(ツ)_/¯
hollow sentinel
warm sphinx
Definitely not but he is awful
awful?? do you even have a job?
lmao
pastafish is just here to vibe he's pretty chill
warm sphinx
👍
exotic maple
I'm not going to debate people's credential as it is both senseless and dumb, but my point stands:
Please explain how can a "beginner" know what and WHY something is bad. This is hilariously out of touch.
bronze skiff
exotic maple
Please explain how can a "beginner" know what and WHY something is bad. This is ...
a beginner should learn the limitations of their algorithms and why other techniques improve on them
this is a critical part of the scientific process
exotic maple
By definition, a beginner knows nothing / very little. Assuming that people who are learning / just beginning will somehow know all permutations of something and why it works / doesnt work, at first glance, sounds unrealistic.
warm sphinx
They won't know why its not practical unless they try out everything
exotic maple
bronze skiff
a beginner should learn the limitations of their algorithms and why other techni...
This is different. I agree with this.
The initial reply however was that the begineer should already know it.
I'm a beginner myself and I take huge amounts of time to understand how and why and algorithm does something, even if sometimes i struggle to generalize situations; I just dont like some of the intellectual elitism ive seen in the data science community
warm sphinx
As far as I know I learned how to use Euclidean distance and how its not practical moved to DNNs and then to CNNs
 charred umbra
bronze skiff
euclidean distance is an awful metric for image similarity-- you can arbitrarily...
charred umbra
bronze skiff
euclidean distance is an awful metric for image similarity-- you can arbitrarily...
This is interesting, since I've never done anything with image similarity; Whenever I compare images outside of classification its always unsupervised. I've just started getting into unsupervised with autoencoders and stuff; anyone here know how these metrics work?
bronze skiff
exotic maple
This is different. I agree with this.
The initial reply however was that the be...
when someone says "the beginner should know..." its the same as "the beginner should learn in order to progress..."
i apologize that it didn't transfer
exotic maple
bronze skiff
when someone says "the beginner should know..." its the same as "the beginner sh...
Perhaps there's a bit of a language difference there, my bad.
English "should" always confuses me because it can mean 10 things lol
bronze skiff
no prob
its not my first language anyway
so i probably made some interpretation errors
warm sphinx
I could have written a blog on CNNs but I wanted to share what I am learning.
I started with this moved to DNNs and then to CNNs and I know why it doesn't work. Sorry I should have mentioned that it isn't pragmatic
bronze skiff
i didn't criticize you, or the blog-- it was decently written if anything
i was just remarking that its an ineffective technique
if that's intellectual elitism in ds, then i don't really know what elsd to say
exotic maple
I think we are all speaking the same language here but we are not communicating properly and we are all making incorrect assumptions about the others lol
exotic maple
bronze skiff
if that's intellectual elitism in ds, then i don't really know what elsd to say
Oh my apologies if this came up as a direct. It was more a general rant, not talking about you in particular.
warm sphinx
exotic maple
I think we are all speaking the same language here but we are not communicating ...
So true. My bad. I just got to know today that there are discord servers where you can share and learn what you know so I posted it here
 desert oar
if you're introducing someone to distance matrices, why not use something that does work well with euclidean distance?
images are complicated to reason about anyway
i dont think teaching people "wrong" stuff is worth it even if it makes the task simpler, you never know who is going to read this blog post then try to do it at work
hollow sentinel
I've seen beginners to DS/ML who just try to dive headfirst into sklearn
It's not pretty
 smoky epoch
I'm a complete beginner and I'm trying to plot some things with matplotlib but I'm stuck, is this the right channel to ask or?
misty flint
smoky epoch
I'm a complete beginner and I'm trying to plot some things with matplotlib but I...
yep. go for it
arctic wedgeBOT
Hey @smoky epoch!
It looks like you tried to attach file type(s) that we do not allow (.csv). We currently allow the following file types: .gif, .jpg, .jpeg, .mov, .mp4, .mpg, .png, .mp3, .wav, .ogg, .webm, .webp, .flac, .m4a.
Feel free to ask in #community-meta if you think this is a mistake.
smoky epoch
i have a college stats project, im comparing exam scores for our year group and the one below and we have to analyse it etc etc its the first time we've done this, i collected my own data and since i do cs i decided to try visualize the data with pandas and matplotlib (my first time). i was able to read the csv file into a dataframe, the column Level is just ' year group ' e.g. AS or A2. and MAG is like a minimum end of year expected grade, the rest are numeric values out of 5.
i want to do some type of plotting but i cant' seem to get it work. i want to plot revision against difficulty for AS group and try show a correlation if possible. i also want to show a barchart ( if appropriate ) for Grade Vs MAG.
this is what i have so far:
import matplotlib.pyplot as plt
import numpy as np
df = pd.read_csv('Report Task.csv')
df.columns = ['Level','Grade','Difficulty','Revision','Happy','MAG'] #numerical values are out of 5
df[df.Level.str.match('AS')] #to get only AS group
plt.plot(df.Revision, df.Difficulty)```the plot looks really bad though its like a 2 year old just scribbled all over the graph.. could this be because of my data? its not really the best and i was only able to get 30 people to fill in the form
 misty flint
whats your data look like
smoky epoch
can i send the spreadsheet link?
misty flint
also this line
df[df.Level.str.match('AS')]
consider using .iloc instead
yeah you can send it to me
 tidal bough
smoky epoch
the plot looks really bad though its like a 2 year old just scribbled all over t...
tidal bough
smoky epoch
the plot looks really bad though its like a 2 year old just scribbled all over t...
Plots like that imply that your points' x-coordinates aren't sorted in ascending order.
plot just plots the points in the order provided and connects them with lines; making sure they are in the right order is up to you.
 grave frost
model does not generalize well to the validation data. either it is overfitting or the validation data is not representative enough of the training set. if you are deriving the validation set from the train data only, then try to increase a split slightly.
use k-fold validation to see if it overfits
Quick Question - if the validation accuracy is constant, does that always indicate that the model is overfitting, or can it also indicate lack of complexity of model?
🤔 Maybe it could be complexity - because increasing hidden layers does help
Alas I have a query - Does anyone know what a bell-shaped accuracy curve can lead to? Googling it doesn't produce relevant results
grave frost
Nah, it was just that my input features were not correctly processed leading to the weird shaped graphs
grave frost
My best guess is that the models are finding spurious relations that are hampering its' ability to make correct predictions. I found my input pipeline was pretty bad and naive so I am changing that to trained word2vec averaged (maybe multiply by their TF-IDF scores). that's a pretty good way to represent input data (if you are doing NLP)
 lean ledge
grave frost
Quick Question - if the validation accuracy is constant, does that always indica...
lean ledge
grave frost
Quick Question - if the validation accuracy is constant, does that always indica...
It could be overfitting, or it could be that you've reached the accuracy you can reach for the task, or your model isn't strong enough to predict
If training is still decreasing it's overfitting
But in general it's all a bit hard to tell, might have to experiment
grave frost
ye, you would reach max accuracy for a task pretty quick if your input data is malformed
 tall basin
Btw, I'm mathematician, but I'm interested in learn programming, all aspects, so if someone would like to learn math, and if you're interested to teach me programming, please DM me
arctic wedgeBOT
Resources
The Resources page on our website contains a list of hand-selected learning resources that we regularly recommend to both beginners and experts.
https://pythondiscord.com/pages/resources
misty flint
has lots of good stuff
 rapid ridge
how do I force how sent_tokenize to be multingual?
bronze skiff
tall basin
Btw, I'm mathematician, but I'm interested in learn programming, all aspects, so...
define mathematician, and what can you teach us
misty flint

hollow sentinel
statistics, linear algebra, calculus, discrete maths, probability?
the list goes on
 modern coyote
Hi everybody, I am looking for someone who writes production code in any data science field that would enjoy having an apprentice or a newB that would ask questions about data science and programming, I ultimately am going to start a programming career using python in any manner, and eventually specialize in machine learning
I am currently struggling to assure my learning path isn't full going to be wasteful and need direction on how i should learn to understand what is considered clean code and why things are done in certain manners and how to implement the structure in my head into code
this is my third time posting this and being recommended to another chat room if i am simply looking in the wrong community please let me know
misty flint
i mean this is the right chat room...but if someone wants to accept you as a mentee...thatll be a different story
either way, best of luck pal
modern coyote
@misty flint Just glad i found the right spot, thank you
 blazing lodge
How can I import all files(PDFs) from a folder in my drive to colab?
lapis sequoia
Hey a simple and quick question, don't think requires me to open the help channels, anyone has a clue how to remove 0-50 in the yaxis?
 bronze skiff
modern coyote
Hi everybody, I am looking for someone who writes production code in any data sc...
bronze skiff
modern coyote
Hi everybody, I am looking for someone who writes production code in any data sc...
why do you need someone who writes production code? are you a beginner? why not other beginners?
 wet cedar
I would like to plot the total confirmed cases of COVID-19 in all countries using folium's heatmap but I can't make it work because it somehow requires geojson.
I have all the countries' name and their corresponding total number of cases and longitude and latitude coordinates saved in my csv. I already loaded the dataframe with pandas as well
This is the dataframe I have been working with
 lean ledge
lapis sequoia
Hey a simple and quick question, don't think requires me to open the help channe...
lean ledge
lapis sequoia
Hey a simple and quick question, don't think requires me to open the help channe...
frame1.axes.get_yaxis().set_visible(False)?
 untold cove
Hey all, anyone know how I can display the username under each class: https://bpa.st/FLEQ
lapis sequoia
lean ledge
`frame1.axes.get_yaxis().set_visible(False)`?
removes % Population too, there has been answer to set y axis to an empty list, but i'm wonder it odesn't work perviously
lean ledge
ax.set_yticklabels([])?
or ax.set_yticks([]) if you want to remove the ticks in general, not just labels
lapis sequoia
yeah but wondering if there is a different way than this?
untold cove
Any ideas @lean ledge you sound like the pro here?
grave frost
Can anyone explain why it is impossible to create an embedding vector of a negative number?
bronze skiff
that makes little sense
unless you mean "why does nn.Embedding not take a negative index?" at which point
it's a lookup table from range(0, <your max idx here>) to trainable vectors
grave frost
yeah, I get that. but why is the domain only for N?
suppose I want the domain to be [-2, max_voc). Why can't I do that?
bronze skiff
because that's how nn.Embedding is written? it's not hard to fix
either override it with your own nn.Module, or you shift all your idx by 2
the shift all idx by 2 is easier
grave frost
would you happen to have a rough Ideas how I can override that?
bronze skiff
wrap nn.Embedding in a new nn.Module
grave frost
Ah, leave it
bronze skiff
i have no idea how to write code blocks in discord
grave frost
I will just add a dummy dimension
grave frost
bronze skiff
i have no idea how to write code blocks in discord
!code
arctic wedgeBOT
Here's how to format Python code on Discord:
```py
print('Hello world!')
```
These are backticks, not quotes. Check this out if you can't find the backtick key.
bronze skiff
class ShiftedEmbedding(nn.Module):
  def __init__(self, min_idx: int, max_idx: int, emb_dim: int):
    super().__init__()
    self.min_idx = min_idx
    self.emb = nn.Embedding(max_idx - min_idx, emb_dim)
  def forward(self, x):
    return self.emb(x - self.min_idx)
or something like that
grave frost
My problem was that I was feeding a 2D numpy array while the Trsf layer requires 3D. Figured it would be better to have an embedding
grave frost
bronze skiff
```py
class ShiftedEmbedding(nn.Module):
def __init__(self, min_idx: int, max_...
I would prefer not to use anything external coz It may break it. Better reshape
Thanx a lot anyways!
 timid vortex
Anyone know much about NLP? I recently became interested in it and I'm looking for resources on how to get started with it
grave frost
Also, if an input vector contains negative components, is it a good idea to make them positive? or does it lead to loss in features?
 austere swift
timid vortex
Anyone know much about NLP? I recently became interested in it and I'm looking f...
austere swift
timid vortex
Anyone know much about NLP? I recently became interested in it and I'm looking f...
i was recommended the stanford CS224n course
i've started going through it and its pretty good
https://www.youtube.com/playlist?list=PLoROMvodv4rOhcuXMZkNm7j3fVwBBY42z theres the yt link
 timid vortex
Thanks! I’ll check it out
 vivid maple
Hello everyone, I'm doing a little hobby project of analysing tweets to see if they have any relation with rising and falling stock prices, anyone done something similar?
I've scraped over 300000 tweets for an index fund and have stock index dataset, applied vader sentiment analysis on tweets
That give 4 values of positive, negative neutral and compound all ranging from -1 to 1 how do I correlate it to stock data ? Any ideas
misty flint
blazing lodge
How can I import all files(PDFs) from a folder in my drive to colab?
on the left hand side theres a google drive icon. click it and itll ask for your permission to access your Google drive
blazing lodge
misty flint
on the left hand side theres a google drive icon. click it and itll ask for your...
No I'm asking how do I import multiple files , some command to import all files in a folder maybe
exotic maple
Any good resources to learn Neural Networks / DeepL?
misty flint
just write a for loop
once you connect to your drive you can access it like any other filepath
grave frost
blazing lodge
No I'm asking how do I import multiple files , some command to import all files ...
!cp??
 glad mesa
Hey @grave frost I got tensorflow working. So it turns out, vms are bad for tensorflow and I used my actual machine and it works. I got the predictive text to work
grave frost
glad mesa
Hey <@738058085083381760> I got tensorflow working. So it turns out, vms are bad...
why were you using VM?
VM doesn't have GPU passthrough (unless you only wished to run it on CPU)
whats your error?
typo karnel
glad mesa
grave frost
why were you using VM?
I thought it could work since it uses the processor, but now that I think about it. The model would’ve needed more processing power so a VM is a really horrible option.
grave frost
glad mesa
I thought it could work since it uses the processor, but now that I think about ...
yeah, unless you are using hypervisor, VM offer pretty bad perf
you should have used colab 🤷
glad mesa
Yeh.
lean ledge
No real justification. If it's a limited dataset, you can just not have a test set.
Make it like 70/30
How big is your dataset and how complex is the relationship you're trying to learn?
 lavish tundra
i have a graphic like on the img, but it can have 1 or 2 points who are out of curve like top one of the white line, I'm thinking about how to delete these points, I'm thinking about take a median of the values and multiply by a number if the value be higher than this so delete from the data, what u guys think about this way and u guys think has a more easier way?

 iron basalt
lavish tundra
i have a graphic like on the img, but it can have 1 or 2 points who are out of c...
iron basalt
lavish tundra
i have a graphic like on the img, but it can have 1 or 2 points who are out of c...
So you are trying to remove outliers?
lavish tundra
ye
iron basalt
lavish tundra
ye

Feature engineering is an important area in the field of machine learning and data analysis. It helps in data cleaning process where data scientists and analysts spend most of their time on. Here are few examples of feature engineering techniques,
- Outlier detection and removal
- One hot encoding
- Log transform
- Dimensionality reduction ...
Second video in series.
Or third.
lavish tundra
ty, gonna watch it
iron basalt
One thing to note is that you can't just remove the point, since you have multiple curves that all need the same number of points (to match on the time axis), you can do various things instead, such as replace outliers with the average of the previous and next value (assuming neither of those are outliers). @lavish tundra
Or you need to remove all the points at that point in time for all the curves (the entire row in the table is invalidated). Edit: As @lean ledge wrote, this is the much more common case (probably what you want).
iron basalt
It's basically linear interpolation between two points.
Assuming a line connects previous and next point.
lean ledge
lavish tundra
i have a graphic like on the img, but it can have 1 or 2 points who are out of c...
If it's only a few points, calculate the standard deviation for the values and just take out anything greater than X deviations manually.
Averaging them out or linearly interpolating is generally not what you want to do
iron basalt
lean ledge
If it's only a few points, calculate the standard deviation for the values and j...
Yea that's the third video in the series.
Second is with percentiles.
lean ledge
Averaging outliers still gives them weightage. When you have 3 trials, in one of which you spilled half the solution, you get rid of the trial not average it out with other ones
In other cases averaging/filtering out is more appropriate
Eg a voltage spike may be a meaningful signal
iron basalt
Yea, idk what the y-axis is so I presented both choices.
lean ledge
The latter case is a lot rarer and probably not the case given the graph they showed
lapis sequoia
is anyone know about nltk, I'm having trouble with installing
 ruby magnet
Anyone know how I can remedy this error?
ValueError: Input contains NaN, infinity or a value too large for dtype('float64').
The block of code that this occurs on is:
from sklearn.linear_model import LogisticRegression logmodel=LogisticRegression(solver="liblinear") #initialize logmodel.fit(x_train,y_train)
but specifically that last line
grave frost
validation set is not always the best way to test the abilities of a model. Recommend you do AUC and CV
 quiet locust
hi is anyone particularly good at sql
velvet thorn
grave frost
validation set is not always the best way to test the abilities of a model. Reco...
they're not mutually exclusive
velvet thorn
quiet locust
I need help for a technical assessment
!rule 5
arctic wedgeBOT
5. Do not provide or request help on projects that may break laws, breach terms of services, be considered malicious or inappropriate. Do not help with ongoing exams. Do not provide or request solutions for graded assignments, although general guidance is okay.
quiet locust
ope sorry
velvet thorn
grave frost
validation set is not always the best way to test the abilities of a model. Reco...
also, "AUC" is an ambiguous term
velvet thorn
ruby magnet
Anyone know how I can remedy this error?
`ValueError: Input contains NaN, infini...
what do you think the error means?
ruby magnet
Honestly I have no idea. But I'll see what I can do to clean up the data
exotic maple
ruby magnet
Honestly I have no idea. But I'll see what I can do to clean up the data
I mean the error itself says it: Part of the dataset contains NaN (clean it up) Infinity (clean it up, good luck) or is too large (normalize it; MinMax or Standard scalers, perhaps)
 boreal summit
ruby magnet
Anyone know how I can remedy this error?
`ValueError: Input contains NaN, infini...
boreal summit
ruby magnet
Anyone know how I can remedy this error?
`ValueError: Input contains NaN, infini...
It's your dataset that's the issue. You should check to make sure there are no null values, empty spaces, letters or anything else like that in your dataset.
And like the poster above said, if different columns in the dataset have wide value margins, it could also cause an issue, so you'd have to normalise or standardise your dataset.
Not sure, but I think the Val curve being lower than the training curve a little is a good sign that the data is learning Since the Val data is unseen data.
If the training curve is lower than the Val curve, then the network is probably overfitting the data.
 woeful estuary
Hey, anyone know how to put a cnn neural network to my gralhics card
 sharp rover
Hello does anyone here know how to work with converting feature EEG data into visualizations (time domain, frequency domain)?
austere swift
woeful estuary
Hey, anyone know how to put a cnn neural network to my gralhics card
most deep learning frameworks will automatically use gpu
just because of how infeasible it is to run it on cpu
what framework are you using?
lavish tundra
about performance u guys thinks is better to acess data from a file or from a request on a link?
austere swift
file usually
i mean if its not much data then requesting a link will probably be fine
but usually file is more reliable and faster
lavish tundra
gotcha ty
woeful estuary
austere swift
just because of how infeasible it is to run it on cpu
Pytorch
austere swift
woeful estuary
Pytorch
it should use gpu by default
you just have to move the stuff to gpu
so like move the model to gpu using .cuda() or .to(torch.device("cuda"))
and the data too
woeful estuary
at what line do i need to add that
woeful estuary
austere swift
so like move the model to gpu using `.cuda()` or `.to(torch.device("cuda"))`
Do i put in in the network?
austere swift
you put that when you're creating the model object
so like if your model class was called Net it would be model = Net().cuda()
woeful estuary
Can you give an example
austere swift
or you can do it afterwards too
woeful estuary
austere swift
so like if your model class was called `Net` it would be `model = Net().cuda()`
Thanks
austere swift
like
model = Net()
model.cuda()```Thanks for the help
austere swift
also this is kinda obvious but you would have to install cuda and have the cuda version of pytorch as well
woeful estuary
How do i install that
austere swift

An open source deep learning platform that provides a seamless path from research prototyping to production deployment.
woeful estuary
Ok, thanks
austere swift
pip install torch==1.8.0+cu111 torchvision==0.9.0+cu111 torchaudio===0.8.0 -f https://download.pytorch.org/whl/torch_stable.html thats the command for pytorch 1.8.0 cuda 11.1
thats the latest
https://developer.nvidia.com/cuda-11.1.1-download-archive theres the link to install cuda 11.1
NVIDIA Developer
Please Note: We advise customers updating to Linux Kernel 5.9+ to use the latest NVIDIA Linux GPU driver R455 that will be available for download from NVIDIA website and repositories, starting today. Select Target Platform Click on the green buttons that describe your target platform. Only supported platforms will be shown. By downloading and us...
https://developer.nvidia.com/rdp/cudnn-download and theres to install cudnn
woeful estuary
What if i allredy install pytorch and torchvision
austere swift
if you installed the cpu version youd need to reinstall it with the cuda version
do pip show torch and show me the output
i'll lyk if you need to reinstall
woeful estuary
Ok, give me a minute
 next tree
could anyone help me with R studio stuff
woeful estuary
austere swift
do `pip show torch` and show me the output
It shows torch 1.7.1
austere swift
if it doesnt have +cu that means its the cpu only version
so you need to reinstall
woeful estuary
How do i reinsta the framework
woeful estuary
Can you reply to the mesage, i can't open the link on my phone
austere swift
austere swift
`pip install torch==1.8.0+cu111 torchvision==0.9.0+cu111 torchaudio===0.8.0 -f h...
this one
https://pytorch.org/get-started/locally/ just go to this link
An open source deep learning platform that provides a seamless path from research prototyping to production deployment.
and follow the instructions there
woeful estuary
austere swift
this one
Thanks
austere swift
https://developer.nvidia.com/cuda-11.1.1-download-archive and then this for cuda and https://developer.nvidia.com/rdp/cudnn-download for cudnn
NVIDIA Developer
Please Note: We advise customers updating to Linux Kernel 5.9+ to use the latest NVIDIA Linux GPU driver R455 that will be available for download from NVIDIA website and repositories, starting today. Select Target Platform Click on the green buttons that describe your target platform. Only supported platforms will be shown. By downloading and us...
 restive flare
hey, can anyone explain me what that graph means? I ran 3 layers (200, 100, 64) with 0.2 dropout, optimizer= adam, loss= mae. And use earlystop at 5 with min_delta = 0.001. My confusion is that what is happening when curve intersect at each other... Is the point of intersection best_fit or something else? Thanks in advance.
 austere swift
the bottom of the graph is epochs right
restive flare
austere swift
the bottom of the graph is epochs right
yes
austere swift
yeah so basically whats happening is that originally the training loss is very high, obviously because of the initialized weights, then the val loss is much lower since validation is after the first epoch so it would have had time to train. The intersection is basically just when the model technically starts overfitting, since the training loss becomes lower than the validation loss
its best to just take the lowest validation loss
and use that
since the validation loss is what you're going for
while there technically is overfitting in that graph it isn't really too bad, so you don't really have to worry about it
you only really need to worry about it when the validation loss starts going up instead of down
and diverging
a lot
like this, this was one of my previous loss graphs
 restive flare
high variance
restive flare
thank you, but what is actually mean when validation curve behave like an ECG curve very shaky

this is before earlySopping
 trim oar
restive flare
trim oar
restive flare
You really gotta have earlier early stopping. Small fluctuations is expected while finding weights towards minimal point, but your model is clearly overfitting
restive flare
trim oar
You really gotta have earlier early stopping. Small fluctuations is expected whi...
this what with batchnorm without early stopping.
 restive flare
trim oar
You really gotta have earlier early stopping. Small fluctuations is expected whi...
restive flare
trim oar
You really gotta have earlier early stopping. Small fluctuations is expected whi...
with early stopping using batchnorm
 trim oar
But what is your metrics saying?
Loss is relative.
What's more important is your metrics indicating your model is solving the problem.
lavish tundra
someone here understand about seaborn?
 crude rivet
 timid depot
Hii
If someone's good at deep learning and neural networks please dm me
Plz plz plz plz plz plz plz
grave frost
@iron basalt Gotta admit HTM theory has blown my mind 🤯 I am just gonna start with Sparse Data Representations but I still don't get - why sparse? it just increases the complexity of data while not adding much information. It seems counterintuitive that our brain works that way.
lean ledge
grave frost
<@!119925597395877889> Gotta admit HTM theory has blown my mind 🤯 I am just gon...
The way brains work are inherently sparse compared to computers. Computers have essentially random memory access and operations are fixed size. They're highly centralised in a particular way for processing. Brains have sparsity in their connection topology (all neurons are inherently only linked to a few more), there's sparsity built into activation (in form of the action potential theshold voltage, etc)
It doesn't really add any complexity
For a computer to recreate the equivalent dimensionality of problem, it does make it faster computationally because you can ignore the 0 operations.
In case of HTM, sparsity helps with reliability by having some inherent redundancy
grave frost
lean ledge
In case of HTM, sparsity helps with reliability by having some inherent redundan...
so...if each unit of a sparse vector is fed to a hierarchical model, then even the 0s count as features and helps the model learn/converge?
Also, does the current level of research incorporate hierarchy?
 solemn holly
Hey guys, I've been programming for a while now and the machine learning field is one that interests me a lot, however I'm a high school student with no advanced math knowledge.
I've just read the "Getting Into ML: High Schoolers Guide" on r/machinelearning, and wanted to know your opinions about this. Do you think it's not worth it for a person of my age to get into machine learning rn, and I should focus on other things? Sorry if this is not the right place to ask, but thanks in advance!
untold cove
just got to make a legend now
untold cove
anyone know to to add a custom legend?
 wicked mantle
does any newbies here want to be friends? Lets tryhard together😄
untold cove
Newby here

 mystic orchid
wicked mantle
does any newbies here want to be friends? Lets tryhard together😄
mystic orchid
wicked mantle
does any newbies here want to be friends? Lets tryhard together😄
yeah, im noob too
trim oar
You never ever ever touch the test set. Never. You would create cross validation only within the train set. You fine tune your model based on what’s happening with the Val sets within your train set. And once you trained the model to your satisfaction, you score again test set, record the result, and you’re done. Even if it’s bad. You would have to get new data, as best practices, if you plan to research again.
 nimble saffron
Hello, I'm trying to drop rows in a pandas Dataframe that has a column location with different values A1, L2, BB1 and others.
Since there are the fewest rows containing data on L2, I'm trying to chop rows from the other different locations to have the height at L2
I'm starting with A2 using the following lines, this brings the height of A2 to be the same as L2:
test_df.drop( test_df[ test_df['site'] == 'A2' ].loc[:'2/9/2020 10:30'].index, inplace=True )
test_df.drop( test_df[ test_df['site'] == 'A2' ].loc['1/1/2021 8:30':].index, inplace=True )
However, after removing those rows from A2, I noticed the size of total rows containing BB1 also changes!
Even more, I'm unable to perform the same two lines on BB1 to change its size to the same height as L2.
Please let me know if my question is unclear. Thank you!
grave frost
solemn holly
Hey guys, I've been programming for a while now and the machine learning field i...
age is just a number, and best time to do something is always right now
 serene scaffold
solemn holly
Hey guys, I've been programming for a while now and the machine learning field i...
serene scaffold
solemn holly
Hey guys, I've been programming for a while now and the machine learning field i...
This is a fine place to ask. If you're a high school student in the US, I would encourage you to take the most advanced math courses that you feel you would succeed in. You will likely need to take a few calculus courses and linear algebra.
And you'd likely be taking those in college, so if you can take the first semester's worth of calculus in high school, that will buy you some time.
And if you already feel that you have a good foundation in general programming skills, I'd say it's a fine time to pursue AI knowledge. That's a matter of how much time is available to you outside of school and how you'd like to spend it.
nimble saffron
solemn holly
Hey guys, I've been programming for a while now and the machine learning field i...
I'd recommend fast.ai lectures, Stanford Deep learning lectures, and most of all the deeplearning.ai coursera course with Andrew.Ng. You don't need to understand all the linear algebra and calculus math to begin working with tensorflow, pytorch or any other machine learning libraries.
serene scaffold
Also let me expand on what I had said about taking advanced math classes now: showing competence in math signals to admissions counselors that you would succeed in their computer science courses, so your math grades will probably be a key consideration.
@solemn holly does that help at all?
iron basalt
grave frost
<@!119925597395877889> Gotta admit HTM theory has blown my mind 🤯 I am just gon...
I recommend reading through https://en.wikipedia.org/wiki/Compressed_sensing.
"At first glance, compressed sensing might seem to violate the sampling theorem, because compressed sensing depends on the sparsity of the signal in question and not its highest frequency. This is a misconception, because the sampling theorem guarantees perfect reconstruction given sufficient, not necessary, conditions. A sampling method fundamentally different from classical fixed-rate sampling cannot "violate" the sampling theorem. Sparse signals with high frequency components can be highly under-sampled using compressed sensing compared to classical fixed-rate sampling" - This is a common confusion (key part).
Another key part is: "Compressed sensing takes advantage of the redundancy in many interesting signals—they are not pure noise. In particular, many signals are sparse, that is, they contain many coefficients close to or equal to zero, when represented in some domain.[11] This is the same insight used in many forms of lossy compression. "
lean ledge
Compressed sensing is pretty unrelated to HTM other than the idea of sparsity but a lot of things have the idea of sparsity
It's also not really very impressive to anyone who hasn't taken an electrical engineering degree/signal processing course and doesn't already know Nyquist Shannon theorem
iron basalt
lean ledge
Compressed sensing is pretty unrelated to HTM other than the idea of sparsity bu...
HTM is related to sparse coding, and one of sparse coding's main applications is in compressed sensing. I believe that reading about it would help give a bigger picture. Especially since @grave frost was asking "why sparse?".
iron basalt
lean ledge
It's also not really very impressive to anyone who hasn't taken an electrical en...
Was it suppose to be impressive?
solemn holly
@grave frost @serene scaffold @nimble saffron
thank you for your responses!
Unfortunately I live in Europe, and in the place where I am things don't really work like in the US. Here, we have a very specific and predefined school program and we can't really get much more beyond than that, if you know what I mean.
There is only one math course available to us, in which I'm already in.
I've heard many good things regarding the Andrew Ng's Machine Learning Course, but as I randomly explored some of its videos I came cross some very intimidating math I would say at least xd, thats way I was asking that question in the first place.
Maybe with a bit of googling I could get through it? Or would it be better to try something more programming related like the Sentdex video series on yt? The deeplearning.ai course seems really interesting as well.
I currently have a lot of spare time and I think it would be a great chance to start learning this.
lean ledge
"why sparse" has a lot of different answers tbh
 little compass
Is it possible to build a good image classifier without convolutions? As it turns out one can just use the Vision Transformer! It was proposed in the paper: An Image is Worth 16x16 Words: Transformers for Image Recognition at Scale. In this video, you can learn how to implement it from scratch in PyTorch.

In this video I implement the Vision Transformer from scratch. It is very much a clone of the implementation provided in https://github.com/rwightman/pytorch-image-models. I focus solely on the architecture and inference and do not talk about training. I discuss all the relevant concepts that the Vision Transformer is using e.g. patch embedding,...
lean ledge
Sparsity in compressed sensing is in basis vectors for L0 optimisation, which is a different reason than sparsity for computational reasons in general numerical computing, which is different than the many-brains type of reasons behind redundancy+sparsity of data
lean ledge
solemn holly
<@!738058085083381760> <@!253696366952316929> <@!200011570468618240>
thank you...
Just spend your own time learning maths
If you're in the most mathematical stream for your country, you'll go over calc 1, maybe a bit of calc 2, at some point in the last couple years.
You just have to go over linear algebra and calc 3
nimble saffron
solemn holly
<@!738058085083381760> <@!253696366952316929> <@!200011570468618240>
thank you...
Wow I had no idea how different European school is, how interesting. What I would recommend is not randomly jumping through Andrew Ng's courses, but to instead enroll in his deeplearning.ai coursera course and pursue the courses in recommended order. I've completed Linear Algebra and mulitvariate Calculus, but Andrew's courses lead you through the material and expect that you don't understand the math.
lean ledge
But yeah, just learn all the maths in high school. Save machine learning for university
Andrew Ng's course expecting you to not understand is hardly a good thing
nimble saffron
solemn holly
<@!738058085083381760> <@!253696366952316929> <@!200011570468618240>
thank you...
Imo you don't need to wait until you understand the maths. You can totally start learning about machine learning now. The maths can be learned on a case by case basis.
lean ledge
If you're learning a field of applied maths without learning the maths, you're missing out on stuff and not even realising you are
Maths has anywhere from subtle to important implications
hollow sentinel
please don't just do DS/ML with no math foundation
take the time and learn the math
iron basalt
lean ledge
Sparsity in compressed sensing is in basis vectors for L0 optimisation, which is...
Yes sparsity has many benefits and one can make use of all or only one of them (or some number of them in-between). Compressed sensing is one of my favorite reasons / applications.
lean ledge
I like compressed sensing also, I find finding sparse bases is very interesting
And it has some interesting applications (speeding up MRI scan times etc)
iron basalt
Do you like using sparse distributed representations? If so, I would like to hear about any applications or other cool thing you found out about them.
lean ledge
I don't know as much about them. My background is more robotics/signal processing/control/scientific computing type stuff
Weird niche areas of neuroscience and AI are just a side hobby
iron basalt
You might want to look into them. Distributed representations are cool, but when you combine them with sparsity, it becomes really powerful (not just for HTM's purposes).
 hard canopy
@hollow sentinel the math is kinda easy anyway. you just need to know what matrixes and gradients are
lean ledge
Only if you're looking at super basic courses lol
The more maths you know, the better
hard canopy
I'm only talking about the basic math you need to understand what ML is
lean ledge
Understanding what ML is is sadly different from actually doing ML in practice
iron basalt
cortical.io for example uses SDRs for NLP: https://www.cortical.io/science/sparse-distributed-representations/

Cortical.io
Sparse Distribution - The fundamental concept behind Cortical.io’s Retina Engine consists in converting text into a Sparse Distributed Representation (SDR) so that it becomes numerically computable. Contact Cortical.io to learn more about our solutions.
solemn holly
so should I go ahead with this or leave it for later?
nimble saffron
Following Andrew Ng's course?
solemn holly
yeah
grave frost
@solemn holly as someone, who used to live in India with 0 resources available to europeans, I would emphasize it hardly matters
solemn holly
or machine learning in general
nimble saffron
Yes, definitely go for it!
solemn holly
ok guys, tysm! I'll give you updates later 🙂
nimble saffron
Let me get that coursera course link I was talking about
grave frost
You don't always need math for learning ML. learning things intuitively first and then exploring the math behind it later is a really great way (speaking from expereince)
nimble saffron
grave frost
You don't always need math for learning ML. learning things intuitively first an...
I agree
solemn holly
yh that's what I was thinking, thx
nimble saffron
@solemn holly here ya go https://www.coursera.org/learn/neural-networks-deep-learning?specialization=deep-learning#instructors

Coursera
Offered by DeepLearning.AI. In the first course of the Deep Learning Specialization, you will study the foundational concept of neural ... Enroll for free.
You can even get a certificate of completion for your linkedin profile afterwards
nimble saffron
You can audit it
The coursework is laid out over 4 weeks, but if you're really in a groove you can bust it out in only a couple days.
grave frost
@iron basalt@lean ledge I just learned more about SDR's and I am already quite fascinated by their properties. Honestly, there is much more than meets the eye. on the YT course, the guy demonstrated the compressibility and noise-withstanding capabilities that I never could have guessed. Another thing - I think (not sure) that the SDR also provides redundancy by resusing features in the hierarchy of the HTM and having different columns study different parts of it? am I getting that right?
iron basalt
lean ledge
I don't know as much about them. My background is more robotics/signal processin...
If you are willing to share what robotics you have been working on I would be very interested, there is no robotics section in this python discord, but you can DM me.
grave frost
I haven't started on the thousand brains theory so I only know vaguely how HTM works
nimble saffron
grave frost
I haven't started on the thousand brains theory so I only know vaguely how HTM w...
woah that sounds awesome, what is that?
grave frost
nimble saffron
woah that sounds awesome, what is that?
some resources: https://numenta.com/resources/videos-podcasts-and-more/
Want to learn about Numenta's brain theory and technology? Whether you're a neuroscientist looking for published papers or an AI enthusiast interested in how the brain works, here you'll find papers, posters, podcasts and videos about HTM cortical theory and its applications for machine intelligence.
solemn holly
nimble saffron
The coursework is laid out over 4 weeks, but if you're really in a groove you ca...
could you explain what audit is?
iron basalt
grave frost
<@!119925597395877889><@!193268441476497410> I just learned more about SDR's and...
Watch the cortical.io video on that link. It may help your understanding even more since you have been doing NLP stuff IIRC.
grave frost
iron basalt
Watch the cortical.io video on that link. It may help your understanding even mo...
I will surely do that 🙂 but right now, I am doing the YT course cuz it hollows out the extreme foundations - and since the theory is so complex anyways I would like to do it properly with actual math
hollow sentinel
hard canopy
<@!567030124306759710> the math is kinda easy anyway. you just need to know wha...
linear algebra, calculus, statistics, discrete maths
nimble saffron
solemn holly
could you explain what audit is?
Checkout this article: https://learner.coursera.help/hc/en-us/articles/209818613-Enrollment-options It talks about what you'll get from auditing the course, basically you'll be allowed to view all course lessons and lectures but you won't be able to submit quizzes and tests that amount of recieving a course certificate.
If you really want the course certificate, you can subscribe for a trial to coursera after you've compelted the material, take the quizzes/tests and then recieve the certificate. Thats what I did.

Coursera Help Center
When you enroll in a course, you'll see different paid or free options depending on the course. These options may include:
Paying for a Course Certificate
Subscribing to a Specialization
Subscri...
hollow sentinel
there's plenty of math you have to know
lean ledge
Pls just learn the maths first before ML, I've worked with a lot of "maths second" people and it still gives me nightmares
hollow sentinel
don't just dismiss the math as "easy" it hurts beginners to see someone just say that when they're struggling
grave frost
@lean ledge the maths is often not in the currciulum that is required for DL. college is the best place to learn that level maths
solemn holly
oh god
hollow sentinel
knowing the math and then learning sklearn is much better than randomly using algorithms that they don't even know
grave frost
if you tell any high-schooler to do the amount of math to build a transformer, it would likely take years
lean ledge
If you want any confirmation the maths is important, compare Andrew Ng's course to his actual course at Stanford
hollow sentinel
I would start w the practical statistics behind machine learning
that is a good book
grave frost
cuz its already made by people with phds
nimble saffron
This is a fruitless argument, entirely based on opinion, lets agree to disagree @lean ledge @grave frost @hollow sentinel
lean ledge
His coursera course is just for self learnt people to feel better. If his coursera approach was any good, he'd teach it the same way to his actual undergrads
hollow sentinel
nimble saffron
This is a fruitless argument, entirely based on opinion, lets agree to disagree ...
No, math is definitely important.
there is no opinion to this you either know the math behind what you're doing or you don't at all
it's just facts
lean ledge
@iron basalt I'm getting ready for work but I'll mention you in off-topic when in free :)
iron basalt
lean ledge
Pls just learn the maths first before ML, I've worked with a lot of "maths secon...
I agree with this, learning the math first will make learning the ML that much faster. The slow start will pay off over time. If you are not in an actual course, get some books and you can self study, but it requires a lot of self motivation.
grave frost
@lean ledge if you don't mind me asking, what use do you do with HTM+ robotics
lean ledge
I don't do htm with robotics but I do use other neuroscience methods with Robotics
iron basalt
I am interested in all neuroscience based methods, especially applied in robotics (right now grid cells are my primary target / focus).
grave frost
neuroscience seems to be a pretty well-focused area. But are there other theories apart from HTM that try to relate AGI with neuroscience
lean ledge
I'll move this to #ot1-perplexing-regexing to explain what I'm doing rn :)
solemn holly
Thank you guys for your opinions, time and help. I might leave this for later.
exotic maple
The problem with the math discussion in data science is that more often than not people view deterministically. Either you learn it or you don't.
In reality, I think you will always learn it either before or after but YOU WILL be forced to learn it.
The thing is, what does "learn" math mean for you guys here? I haven't done any decent math in over 8 years so I the most I remember about calculus is general concepts and intuition. If you ask me "what is gradient?" I would just say "Delta, how much Y changed along with X, which is also the solution to f'(x) for x in the range of change"
If you ask me, and from what i've seen so far, Statistics is the math I'd consider "most important" -if one can even say such a preposterous thing-
Hypothesis testing, sampling, distributions, etc. I've found much more IRL uses to statistics than to Calculus. That's just my humble opinion.
On another note: It's sad reviewing my notebooks from 8 years ago when I could watch anime and solve differential equations; then look at myself now and I can't remember wtf a diff equation is 
lean ledge
Learn maths meaning understanding the relationships and nuances of mathematical objects, equations, etc.
Gradient is obviously high school level stuff but within ML there's stuff with nuance like optimisation. Can someone without much understanding of maths understand stuff like why quasi Newton methods are everywhere outside ML but don't work for ML?
Does someone doing linear regression understand they're placing a Gaussian assumption on the noise?
Sure often it doesn't matter when you're doing basic linear regression, but there's so many situations in which the extra maths background helps you have intuition and make better decisions than those without that same level of knowledge
grave frost
math is important - just that the time to learn it may not always be early. everything has a proper time to be done. IMO if you ask a high-schooler to learn that level of maths (it being easy to you, so you may be underestimating it) that's overkill
lean ledge
Also yeah, people saying "that level of maths is best learned in college" are sort of missing their own point. Machine learning is best learnt in college
There's no reason machine learning should be accessible to high schoolers
exotic maple
@lean ledge Then there's me, who 90% understand things but always forgets wtf things are called so i'm always lost
by Gaussian you mean normally distributed?
lean ledge
Indeed. From a statistics perspective, linear regression solution is the maximum likelihood estimate of a linear model with normally distributed noise.
grave frost
lean ledge
There's no reason machine learning should be accessible to high schoolers
true, but there is no harm in being familiar with it - the same way you learn basic Quantum mechanics in high school but not the real deal
lean ledge
- The core difference is physics is about the intuition and understanding which can be done without maths
- If you know how physics people work, high schoolers interested in physics learn maths subjects like calc series and dive into it properly during high school
I absolutely dived into differential equations and then simplified infinite potential well/finite potential well stuff when I was in high school
exotic maple
since we're talking math, I'd like to ask for some particular advice @lean ledge your opinion.
I have variable, let's call it TOTAL.
TOTAL is the sum of 4 different features.
question: should i delete total?
after all, as a feature, it holds no mathematical value and its nothing but a simple addition of its parent features
My intuition tells me Total would skew any solving as it is adding unnecesarry noise
lean ledge
Not really a maths question. Keep it for readability I guess
exotic maple
Thing is, my DF is around 250k rows, so any dimensionality reduction is appreciated haha
so i'm trying to get rid of whatever is -obviously- useless and then i'll go more in-depth
lean ledge
If you need the total at some point, you're gonna add them anyway. Dimensionality doesn't factor into this.
Adding or not adding isn't improving dimensionality anyway
exotic maple
wouldnt it affect model training? because if we are looking for y = wx, and x is also a sum of "other" x, isn't a bit, ehm, odd?
grave frost
lean ledge
I absolutely dived into differential equations and then simplified infinite pote...
well, your high school is quite different. states?
@exotic maple that type of feauture enginnering is pretty common
lean ledge
grave frost
well, your high school is quite different. states?
no, the US has dismal education
Australia
exotic maple
@lean ledge Damn i'm envious of your Australian schools. Diff eq in high school?
grave frost
lean ledge
Australia
pretty cool schools you have
exotic maple
That, or I have to praise you for being gifted lol
lean ledge
For reference, we covered part of diffeq stuff in maths but physics finite/infinite potential well stuff is covered without diffeq
I self learnt it with proper maths on my own
lean ledge
exotic maple
<@!193268441476497410> Damn i'm envious of your Australian schools. Diff eq in ...
It's not specific to Aus. Lots of European countries do part of diffeq in high school also
Eg UK has diffeq stuff in A level maths/further maths
grave frost
lean ledge
It's not specific to Aus. Lots of European countries do part of diffeq in high s...
idts
yeah, UK might be, not the whole EU
iron basalt
Some US high schools do too, but US schools have high variance.
exotic maple
my brother studied in Germany and he didnt' learn jack shit about DF EQ lol
grave frost
ye, the country of your residence impacts much about your life
exotic maple
cries in 3rd world country
grave frost
(and future too)
but still, stuff can be done - just in the same degree offered in other countries
exotic maple
admittedly I can't blame everything on country, but still...
wish i had a bit more math during high school :v
grave frost
learnig stuff through internet is pretty inefficient - contrary to popular beleif
 exotic maple
grave frost
learnig stuff through internet is pretty inefficient - contrary to popular belei...
exotic maple
grave frost
learnig stuff through internet is pretty inefficient - contrary to popular belei...
Oh I know. I've been strugglinh with some stuff
I'm certain i would have eaily elarned with a teacher
lean ledge
exotic maple
my brother studied in Germany and he didnt' learn jack shit about DF EQ lol
Might depend on stream? Was he in gymnasium?
exotic maple
@lean ledge I saw those things until college lol
lean ledge
Yeah my curriculum is definitely a step above most
exotic maple
@lean ledge beats me. German education is a bit weird. He has a masters in CS now thou
lean ledge
But it's also an international curriculum
grave frost
lean ledge
But it's also an international curriculum
..?
lean ledge
This is part of International Baccalaureate
exotic maple
IB?
lean ledge
Yep
exotic maple
I learned about that option only until I was already in 1st year of college 🙂
fk me
grave frost
India had IB - but parents usually will not take it on the advice of (f-ing) teachers
lean ledge
First year for me repeated a lot of that yeah. Main maths I learnt in first year was linear algebra and multivariate stuff
misty flint
oh we just got a name change? its about time
lean ledge
grave frost
India had IB - but parents usually will not take it on the advice of (f-ing) tea...
Doesn't really make sense compared to CBSE or something unless you're moving countries
misty flint

lean ledge
So makes sense
 grave frost
lean ledge
Doesn't really make sense compared to CBSE or something unless you're moving cou...
grave frost
lean ledge
Doesn't really make sense compared to CBSE or something unless you're moving cou...
CBSE sucks af
lean ledge
Yeah indian education is dismal. Glad I left there like more than 10 years ago now
grave frost
did you give the board?
grave frost
lucky
exotic maple
Sounds really bullshit but yeah. I mean, i'm also from a 3rd would country but i've worked with tons of Indians from all levels and we've always struglled
lean ledge
I'm still in uni, 10 years ago I was pretty young
exotic maple
@lean ledge how old are you?
an advice from an old relic here (29) before 25 your brain is super fresh and fast, train it hard on math. after that it gets a bit difficult 🥲
grave frost
29's young IMO
exotic maple
I'm joking lol. I dont feel old, but i've noticed a HUGE difference in learning speed and processing
lean ledge
exotic maple
<@!193268441476497410> how old are you?
I am 20
21 in a month or so
Month and a half
exotic maple
I thought myself Python and lots of stuff in like 2 months, even made a few shit programs to test myself, so I guess I can still "learn"
but some abstractions or some fast things I could do before...I can't anymore
smoetimes i wonder if it just stress occupying working memory in my brain or if im getting dumber lol
grave frost
hmm....
lean ledge
Growing up sounds scary. That's why I try to speedrun through the learning part of life now :p
Just gotta make sure I don't delay my PhD too much
exotic maple
@lean ledge Eh, i make it sound bad but nt everything is
you get bad at some things , you get better at others
grave frost
doesn't bachelors+masters take years?
lean ledge
Oh soz should have clarified, I mean starting my PhD
I'm just finishing up my master's by end of this year
And plan to work for a couple years before jumping into PhD
iron basalt
exotic maple
smoetimes i wonder if it just stress occupying working memory in my brain or if ...
It's probably a stress thing, my grandpa learned programming at like 70. What's important is that you take the time to build a solid foundation (like knowing a bunch of math), as it will make learning other things much faster (later on you may not have enough time due to other adult things, unless you become a study hermit type (no social life, etc)).
exotic maple
@iron basalt Yeah i've been thinknig about it and i think its stress too. I'm finding it difficult to focus latelly, but when I do i usually breeze through most things
iron basalt
Just also make sure you don't do drugs and you should be fine (don't damage your brain significantly).
grave frost
iron basalt
Just also make sure you don't do drugs and you should be fine (don't damage your...
is that supposed to be serious advice?
exotic maple
grave frost
is that supposed to be serious advice?
It is
Former smoker vouches for it
iron basalt
Yeah, people get stressed and do drugs, it's bad.
exotic maple
Ha, i've been staring at my DF for 2 hours thinking wtf to do with missing values
delete, interpolate from averages, bfill (for dates) ugh... there's also no reference info
iron basalt
Also study groups and clubs (or other gatherings) are very important for some. Some people need other people's shared excitement to stay focused/motivated for a longer period of time.
exotic maple
I estimate rows with missing data represent 2% of all my valid DF
exotic maple
iron basalt
Also study groups and clubs (or other gatherings) are very important for some. S...
I feel personally attacked. I learned this too late. I need people with similar interests to stay motivated on something
which is why im here :p
but its still not the same as IRL acquaintances
iron basalt
Conferences are a great tool in this aspect if you are doing research.
exotic maple
mmm... as expected, simply deleting all my NaN rows gets rid of 2% of data. i wonder if its worth trying to go ahead like that
I'm tired of thinking wtf to do with some of those columns
 brazen knot
misty flint
exotic maple
but its still not the same as IRL acquaintances
brazen knot
misty flint
exotic maple
but its still not the same as IRL acquaintances
its not. but better than nothing
misty flint
iron basalt
Also study groups and clubs (or other gatherings) are very important for some. S...
me
i start to lose motivation if i dont see others doing stuff
 rotund dagger
hey guys, im doing a decision tree with 418 data points. i have cleaned the data and fit the model, my classification report is only showing support of 105. i didnt specify a size in my train_test_split. what am i doing wrong? or in better words how do test the entire csv. here is code:
from sklearn.tree import DecisionTreeClassifier
from sklearn.metrics import classification_report, confusion_matrix
from sklearn.model_selection import train_test_split
X = test.drop('Survived',axis=1)
y = test['Survived']
X_train,X_test,y_train,y_test = train_test_split(X,y)
dtree = DecisionTreeClassifier()
dtree.fit(X_train,y_train)
prediction = dtree.predict(X_test)
print(confusion_matrix(y_test,prediction))
print("\n")
print(classification_report(y_test,prediction))
i made a software
that detects political ideology sentiment from religious books
where can i share my results
and howcan i know if if code is doing the right suff
serene scaffold
lapis sequoia
i made a software
that detects political ideology sentiment from religious books...
Here 😁
lapis sequoia
Liberalism       :   8.5%
Socialism        :   7.6%
Fascism          :   7.5%
Syndicalism      :   7.4%
Democracy        :   7.3%
Communism        :   7.2%
Libertarianism   :   6.9%
Nationalism      :   6.3%
Populism         :   6.3%
Environmentalism :   5.5%
Conservatism     :   5.4%
Communitarianism :   5.4%
Corporatism      :   5.3%
Anarchism        :   5.0%
Progressivism    :   4.4%
Authoritarianism :   4.0%
after some nlp on bible
serene scaffold
How did you arrive at these numbers?
serene scaffold
Does this mean that 5.5% of the Bible supports authoritarianism?
grave frost
lapis sequoia
```
Liberalism : 8.5%
Socialism : 7.6%
Fascism : 7.5...
I haven't read the bible, but does it have communism?
lapis sequoia
lemme explain
serene scaffold
grave frost
I haven't read the bible, but does it have communism?
You can find Bible passages to prop up a lot of different ideas.
 lapis sequoia
Liberalism       :   8.6%
Socialism        :   7.6%
Fascism          :   7.5%
Syndicalism      :   7.2%
Democracy        :   7.2%
Communism        :   7.1%
Libertarianism   :   6.8%
Populism         :   6.4%
Nationalism      :   6.1%
Corporatism      :   5.4%
Conservatism     :   5.4%
Communitarianism :   5.4%
Environmentalism :   5.3%
Anarchism        :   5.1%
Progressivism    :   4.5%
Authoritarianism :   4.3%
quran sentiment
serene scaffold
It's not off until we know specifically what it's designed to do
grave frost
yeah, true
serene scaffold
But you're right that I don't think these numbers are currently insightful
grave frost
but the OP did say sentiment analysis
 bitter harbor
lapis sequoia
i made a software
that detects political ideology sentiment from religious books...
bitter harbor
lapis sequoia
i made a software
that detects political ideology sentiment from religious books...
How are you would you classify ideological sentiment in the first place?
lapis sequoia
assuming everone knows how senti analysis works
bitter harbor
Doesn’t that heavily depend on context?
serene scaffold
Let's hear out their explanation
lapis sequoia
bitter harbor
How are you would you classify ideological sentiment in the first place?
so i took the entire quran/bible in plain text
then i took the wikipedia articles on all these idealogies, democracy, communism etc
in plain txt
then tried to see their match
serene scaffold
So you did textual similarity?
grave frost
euclidean distance with vectors?
grave frost
ye, NN's would be much better
lapis sequoia
the n i used was 3 4 5 6
but all produce simmilar results
i wanna do nn
but donno how
bitter harbor
Wouldn’t you be picking up/comparing words like articles too?
serene scaffold
I might need to head out but I'll try to get caught up with your explanation
grave frost
wasn't there some command for DS resources?
lapis sequoia
bitter harbor
Wouldn’t you be picking up/comparing words like articles too?
i kindda sanitised the data
from wikipedia
serene scaffold
bitter harbor
Wouldn’t you be picking up/comparing words like articles too?
That probably wouldn't matter if you're normalizing for how words are used throughout the corpus
lapis sequoia
i did it manually so i need an api that will olny give me plain txxt aricle without bs
lapis sequoia
serene scaffold
That probably wouldn't matter if you're normalizing for how words are used throu...
i did the normalisation shit
grave frost
punctuation, stop words?
lapis sequoia
grave frost
punctuation, stop words?
yeah
grave frost
lemmatization and stemming?
lapis sequoia
yes all those
grave frost
good, the bases are covered then
lavish tundra
someone know why this code is giving me a error:
go_dias = [0, 24, 48, 72, 96, 120, 144, 168]
go.loc[i]["timestamp"] for i in enumerate(go_dias)
TypeError: object of type 'generator' has no len()
lapis sequoia
lavish tundra
someone know why this code is giving me a error:
```py
go_dias = [0, 24, 48, 72,...
list(generatoor)
lavish tundra
whats a generator?
grave frost
you prob need to debug your model. OR I recommend you go the easy way and fine-tune some pre-trained model (Like BERT) for your task
serene scaffold
lavish tundra
whats a generator?
A certain type of iterator. Why don't you open a help channel so that there's space carved out for your question?
lapis sequoia
lapis sequoia
```
Liberalism : 8.6%
Socialism : 7.6%
Fascism : 7.5...
mostly liberal?
am i doing this shit right
grave frost
probably not
lapis sequoia
grave frost
you prob need to debug your model. OR I recommend you go the easy way and fine-t...
tf is a bert
grave frost
did you adjust class weights?>
serene scaffold
lapis sequoia
am i doing this shit right
If your model is saying that every political ideology is represented similarly in every text, you probably haven't gotten it right quite yet
lapis sequoia
no no
grave frost
lapis sequoia
tf is a bert
its a model trained with a supervised technique
lapis sequoia
serene scaffold
If your model is saying that every political ideology is represented similarly i...
the ideologies in a qural are different
serene scaffold
lapis sequoia
tf is a bert
A way of representing semantics as a vector.
grave frost
on a pretty big corpus of data (maybe even quran and bible)
serene scaffold
grave frost
?
I was explaining what Bert is.
grave frost
yeah, the results are too same to say that your model is correct
lapis sequoia
basically my conclusion is from the data, bible and quran convey the same ideo logies and are primarily liberal
grave frost
serene scaffold
I was explaining what Bert is.
BERT is a model. internally it does represent as tensors but it doesn't return them
serene scaffold
If you limit the scope to the old testament, I would expect your model to predict mostly authoritarianism
lapis sequoia
bible too i guess
grave frost
lapis sequoia
cause quran is all kill kill kill
.....?
bitter harbor
Would you even be able to pull sentiment out of a Wikipedia article?
lapis sequoia
i too whaer i got on the innernet
grave frost
bitter harbor
Would you even be able to pull sentiment out of a Wikipedia article?
probably not
lapis sequoia
bitter harbor
Would you even be able to pull sentiment out of a Wikipedia article?
thats the only data i have from say communism
serene scaffold
grave frost
BERT is a model. internally it does represent as tensors but it doesn't return t...
Right
grave frost
the style of wiki and bible is much different
lapis sequoia
if you have better sample txt then send me
bitter harbor
Keywords maybe but I can’t imagine you’ll be able to pull the actual ideology
lapis sequoia
bitter harbor
Keywords maybe but I can’t imagine you’ll be able to pull the actual ideology
what would be a better way
where can i gext txt tat contains only communist ideas
or socialist ideas
grave frost
you have to hand label a part of it , or download some data fron the net
lapis sequoia
or democratic ideas etc
grave frost
no, no articles
lapis sequoia
how
serene scaffold
lapis sequoia
where can i gext txt tat contains only communist ideas
The communist manifesto
grave frost
only text whose vocabulary is similar to your target corpus
bitter harbor
Communist manifesto/ other biased writing but your success will heavily depend on how you train it
lapis sequoia
serene scaffold
The communist manifesto
tf is that
serene scaffold
lapis sequoia
tf is that
The book that describes communism
serene scaffold
I can't think of a seminal work about the virtues of democracy
bitter harbor
Find the root of the ideologies and find texts from those roots
grave frost
maybe some lecture by democrates
bitter harbor
I’m sure there’s an Ancient Greek text out there somewhere
grave frost
but the style will be quite different
lapis sequoia
but what youguysthink the bible/quran primarily are
bitter harbor
Not capitalism
grave frost
But even with all that, @lapis sequoia your model will perform badly even then
serene scaffold
lapis sequoia
but what youguysthink the bible/quran primarily are
Both of those books are about following rules laid down by a supreme being, so they should probably be authoritarian.
 golden raven
Here, so what is the difference between sql and excel? I want to learn it but I need to know what it absolutely does
lapis sequoia
authoritarian seems to be the least
bitter harbor
grave frost
but the style will be quite different
Also language is going to differ from text to text which skews that analysis
lapis sequoia
the supreme being seems to be cool
serene scaffold
golden raven
Here, so what is the difference between sql and excel? I want to learn it but I ...
Sounds like a good question for #databases.
lapis sequoia
golden raven
Here, so what is the difference between sql and excel? I want to learn it but I ...
sql is some advanced shit, excel is like basic spreadshit
grave frost
bitter harbor
Also language is going to differ from text to text which skews that analysis
not only that, the context and style is so different, and they are using such a naive method
sql is commandline
i think so
golden raven
lapis sequoia
sql is some advanced shit, excel is like basic spreadshit
I did not mean sql I mean excel
grave frost
thats how I learnt it
golden raven
So what is the difference between excel and pandas
bitter harbor
Well also I can make the same ‘model’ by generating a bunch of random numbers and arguing why they’re right
Excel is its own software?
serene scaffold
Feel free to continue the thread about SQL vs Excel in #databases. I want @lapis sequoia to get the feedback they asked for about their project
grave frost
bitter harbor
Well also I can make the same ‘model’ by generating a bunch of random numbers an...
yeah
golden raven
bitter harbor
Excel is its own software?
I mean for the functionality
grave frost
its too naive to be inefficient
serene scaffold
Please don't discuss websites that aren't appropriate for this community
grave frost
well, he was discussing ai
serene scaffold
Doesn't change what I said
grave frost
@lapis sequoia recommend you pretrain some model
serene scaffold
Try training a classifier to distinguish between capitalist and communist content
lapis sequoia
and do you think my results make any sense
grave frost
lapis sequoia
and do you think my results make any sense
not at all
serene scaffold
I don't think the results you showed us are informative
serene scaffold
Let's not be too harsh. It looks like they've made a lot of progress
serene scaffold
lapis sequoia
what u guys think of the project tho
I think it's a great project. How do you think it could be used?
lapis sequoia
serene scaffold
I think it's a great project. How do you think it could be used?
who says anything about using it
golden raven
Do excel and pandas have the same functionality
lapis sequoia
golden raven
Do excel and pandas have the same functionality
yea
golden raven
lapis sequoia
yea
Thanks
lapis sequoia
pd is better once you know python
you can do the same shit with both, one ise gui, another is code
golden raven
lapis sequoia
pd is better once you know python
I know python but I use it mainly for web development and discord bot development
serene scaffold
golden raven
Do excel and pandas have the same functionality
Excel has a graphical user interface. Pandas gives you a lot more flexibility with how you manipulate the data and what you do with it.
lapis sequoia
learn pd, it doesnt have a learning curve
serene scaffold
Some people make complicated data pipelines in excel that are hard to understand
grave frost
lapis sequoia
learn pd, it doesnt have a learning curve
excel is pretty straightforward IMO
lapis sequoia
so is pd
grave frost
well, excel is GUI
golden raven
serene scaffold
Excel has a graphical user interface. Pandas gives you a lot more flexibility wi...
But the functionality is the same they do the exact same thing but differently
grave frost
misty flint
excels crashes after certain amount of rows
hmm...really?
bad programming
misty flint
oh yes
 scenic turtle
Hello, i have a small question regarding Cartopy/Axis3D usage
golden raven
I am guessing the best way to learn pandas is with the docs?
scenic turtle
import itertools
from mpl_toolkits.mplot3d import Axes3D
from matplotlib.collections import LineCollection
import cartopy.feature
from cartopy.mpl.patch import geos_to_path
import cartopy.crs as ccrs
import matplotlib.pyplot as plt
fig = plt.figure()
ax = Axes3D(fig)
ax.set_zlim([-110, 0])
ax.set_xlim([-72.4044, -67.3506])
ax.set_ylim([-31.279, -24.1272])
borde = [-72.4044, -67.3506, -31.279, -24.1272]
target_projection = ccrs.PlateCarree()
feature = cartopy.feature.NaturalEarthFeature("physical", "coastline", "50m")
geoms = feature.intersecting_geometries(borde)
lc = LineCollection(geoms, color="black")
ax.add_collection3d(lc)
ax.set_extent = (borde, target_projection)
ax.scatter(eve_long, eve_lati, eve_profu, s=20, c='b')
plt.xlabel("Longitud")
plt.ylabel("Latitud")
ax.set_zlabel("Profundidad")
plt.title(" TALTAL-SERENA 2019 : eventos 4> ")
plt.show()
In this code
serene scaffold
golden raven
But the functionality is the same they do the exact same thing but differently
Pandas and Excel are both about working with tabular data, but Excel is a specific environment for working with them, whereas pandas is programmatic
scenic turtle
i can't leave the coastline feature within the box
 serene scaffold
golden raven
I am guessing the best way to learn pandas is with the docs?
serene scaffold
golden raven
I am guessing the best way to learn pandas is with the docs?
Not really. Just try working on projects that use pandas and look things up as you go
Do you know how to use numpy?
misty flint
golden raven
I am guessing the best way to learn pandas is with the docs?
the pandas docs are pretty good, but theres some good YT tutorials. even for projects too
serene scaffold
Pandas is a lot like numpy
golden raven
serene scaffold
Do you know how to use numpy?
Tbh I barely know numpy, I think I should get started their
golden raven
serene scaffold
Pandas is a lot like numpy
Thanks
golden raven
misty flint
the pandas docs are pretty good, but theres some good YT tutorials. even for pro...
Thanks
serene scaffold
golden raven
Tbh I barely know numpy, I think I should get started their
I don't think it matters which you learn first. Pandas and nunpy share a certain approach to iteration
Numpy*
I'm on mobile BTW
misty flint
ye
lapis sequoia
pandas numpy matplotlib
golden raven
serene scaffold
I don't think it matters which you learn first. Pandas and nunpy share a certain...
But so many people tell me to learn numpy, I need to get started with that, then I can get up one more level by learning pandas, and then after maybe learn a few different databases basically something that is not JSON
misty flint
hmm theyre not as sequential as you would think. you can learn both at once.
numpy and pandas are like pb&j
lapis sequoia
they are made by the same dude
golden raven
Just one problem, my computers broke so I am stuck on an iPad until I have a couple more dollars to get a proper pc 😂
bitter harbor
golden raven
Tbh I barely know numpy, I think I should get started their
Numpy’s epic and super useful for a tonnn of stuff
misty flint

golden raven
bitter harbor
Numpy’s epic and super useful for a tonnn of stuff
Ik, but rn I am trying to learn MySql, I am so confused
bitter harbor
Ah gl with that, I’ve had 0 motivation to go anywhere near databases 😄
Numpy’s a lot friendlier
Not really but it’s more worth it imo
golden raven
bitter harbor
Ah gl with that, I’ve had 0 motivation to go anywhere near databases 😄
Thanks
Sorry removed the msg accidentally
bitter harbor
Ya if you’re doing data analysis then some sort of sql will go a long way
golden raven
bitter harbor
Ya if you’re doing data analysis then some sort of sql will go a long way
Yep
I wanna know which is the easiest
 jolly nest
has anyone made an AI in python that makes AIs?
that would essentially be an AI with self-reproducing capability :>
 odd lion
That probably depends on your definition of AI. I assume you're mostly referring to some sort of AI Singularity which is a no. But if you're talking about an AI that makes some custom mini AIs for specific tasks, certainly
misty flint
golden raven
Ik, but rn I am trying to learn MySql, I am so confused
hey im learning that too!
SQL buddies


sql is a good skill to have
and it doesnt break after a million or so rows
unlike excel
golden raven
misty flint
SQL buddies
Eyy!
golden raven
misty flint
SQL buddies
Ma man I decided to use this tutorial https://youtu.be/p3qvj9hO_Bo

In this video we will cover everything you need to know about SQL in only 60 minutes. We will cover what SQL is, why SQL is important, what SQL is used for, the syntax of SQL, and multiple examples of SQL. SQL is the standard language for interacting with and manipulating data in a relational database system, and is one of the most important con...
misty flint
noice
 zenith nova
handled, thanks for the ping 👍
 upbeat jetty
What version of Java do you suggest for latest Pyspark? It works with both 8 and 11, and 11 starts generating warnings, since apparently Pyspark uses some outdated features.
lapis sequoia

 brave relic
is this... a new channel or am I seeing this for the first time?
velvet thorn
brave relic
is this... a new channel or am I seeing this for the first time?
it used to be called plain data science
brave relic
o, they renamed it
misty flint
they should add ML to the name
make it DS-AI-ML
all the acronyms
the alphabet soup channel
anyway, debating on learning more math before learning more ML
its such a slog to get through
might just look at chain rule and partial derivatives for now
 round orchid
I have experience in frontend dev and now learning backend do you think when I switch to Data Engineering career path it's gonna useful?
lapis sequoia
round orchid
I have experience in frontend dev and now learning backend do you think when I s...
It'll help but not that much...
Data Engineering is totally different thing.
Basic will be very similar but you can't become data engineer by learning backend.
round orchid
lapis sequoia
It'll help but not that much...
Data Engineering is totally different thing.
Bas...
I see do you think this roadmap is enough https://coursebank.ph/sparta/pathway/data-engineer
 uncut barn
Which is better for image classification PyTorch or Tensorflow?
grave frost
jolly nest
has anyone made an AI in python that makes AIs?
its been done already by google
though the task would be similar - its just that the child AI would perform much better than the parent one
I think there was a link

Futurism
The applications range from autonomous cars to robots that can “see.”
lapis sequoia
uncut barn
Which is better for image classification PyTorch or Tensorflow?
They are just framework for deep learning. Image classification is not dependent on frameworks.
You can use any models in both of them..
lapis sequoia
round orchid
I see do you think this roadmap is enough https://coursebank.ph/sparta/pathway/d...
For starters it looks good enough.
They are focusing on lot of stuff but yeah if you do them you should not have any problem in starting as data engineer.
Obviously you will have to learn new skills/tools depending on the company you will work so one course can't cover anything.
round orchid
lapis sequoia
For starters it looks good enough.
They are focusing on lot of stuff but yeah if...
Thanks for clarification bro
 kindred radish
So I'm kind of confusing myself and just want some advice on something
Say ive got data on when a machine breaks: the input are things like the condition of the object the machine is working with and the output is"did machine break yes or no?"
Im using Scilearn, specifically the multilayer perceptron
But im unsure which one to use, am i meant to be using the regression model or the classifier model?
The model should be able to predict when the machine breaks essentially
My gut is saying it's a classifier "did machine break? Yes class and no class". Could i be wrong on this?
tidal bough
Regression is for predicting some continious quantity, classification is predicting some discrete quantity, like a class. Your task is very much the latter - a binary (only two classes) classification task.
kindred radish
If you turned it into trying to find a probability of it breaking, wouldnt that be like a continuous quantity and therefore become a regression problem?
Thank you for your answer btw!
tidal bough
The thing is, many classifiers are secretly just regressors finding the probability of each class, then predicting the class they predict the highest probability of 😅
So if you just want a classifier that also tells you how sure it is about its prediction, this I believe can be achieved by asking for that data from a classifier model.
kindred radish
oooohhhh ok that does make sense actually!
One more thing, what score is acceptible?
I get around 0.6 as my score, which i assume means it's correctly predicting the test data 60% of the time
tidal bough
https://scikit-learn.org/stable/modules/generated/sklearn.neural_network.MLPClassifier.html#sklearn.neural_network.MLPClassifier
Looks like it's predict_proba. Essentially, when you ask a classifier to .predict, it simply gets the .predict_proba, then returns 1 for points whose probability is >0.5 and 0 otherwise.
tidal bough
kindred radish
I get around 0.6 as my score, which i assume means it's correctly predicting the...
score "Return the mean accuracy on the given test data and labels.", so yeah, it means for 60% of the points the right class is predicted.
kindred radish
what would it say about the data if it wasn't consistently 60% though?
Like it jumps between 40% and 70% each time i run the code. The data is arranged differently each time
If i got a score of 0.1 that would be fine, im not worried about it being low, i just need it to be consistent
tidal bough
As for how good it is... well, suppose your data is 50% class A and 50% class B. Then a completely dumb model that just flips a coin each time would get 50% accuracy just by random chance.
Another, even worse example: consider your data is 90% class A and 10% class B. Then a dumb model may simply predict A always and get 90% accuracy.
So it really depends on how good the data is and what accuracy are you going for.
tidal bough
kindred radish
Like it jumps between 40% and 70% each time i run the code. The data is arranged...
Hmm, are you using a validation subset (like, separating the validation points from the rest of the dataset to check the accuracy on points the model have never trained on)?
kindred radish
Yeah so say i have 200 data points, I split 60% into a "training" data set and 40% into a "testing" data set
kindred radish
tidal bough
As for how good it is... well, suppose your data is 50% class A and 50% class B....
So if 60% of my data gave breaks, it would just predict a break to happen 60% of the time? Is that what youre saying?
tidal bough
kindred radish
So if 60% of my data gave breaks, it would just predict a break to happen 60% of...
I'm just talking about the fact that the more imbalanced the data is, the higher the possible accuracy for a "dumb" model that does no actual computation can be. So depending on how much of your data is class A, 60% accuracy may mean the percepton has actually learned something (if it's 50/50, that means it's beating a coin by a solid 10%), or it may be doing worse than it could be by simply predicting the more common class each time.
That's the problem with accuracy as a metric, basically. If you, say, identify cancer patients among healthy ones, you may have a percentage of sick ones as low as 0.1%. That means a model that just labels everyone as healthy will achieve an "enormous" 99.9% accuracy.
So for heavily unbalanced classes, accuracy is not a good metric.
kindred radish
that makes so much sense, I should probably run a check to see if this is the case in my data
tidal bough
Yeah, that's a good idea.
kindred radish
So presumably the closer it is to being a coin flip on whether the machine breaks or not within my data the more likely the model is actually predicting something useful?
tidal bough
More like the closer your class composition is to 50/50, the lower the minimal accuracy levels that need actual work are.
If your accuracy is 60%, that needs (a bit of) actual work if your dataset is 60/40 or more balanced than that.
Also, a good idea to detect this kind of cheating is to check the accuracy for each class: as in, the 4 probabilities:
P(X is classified as A when really being A)
P(X is classified as A when really being B)
P(X is classified as B when really being A)
P(X is classified as B when really being B)
kindred radish
tidal bough
If your accuracy is 60%, that needs (a bit of) actual work if your dataset is 60...
I just checked, this is literally the case. The number of breaks in the data is around 60%
tidal bough
or just the two P(X is classified as A when really being A) and P(X is classified as B when really being B) as the other two are 1-these.
kindred radish
So to do that, i should use the .predict(X) function and count how many times the output is "break" when the true result is "break" and count how many times the output is "break" when the true result is "no break"?
tidal bough
Yeah, but I feel like sklearn should have a function for that, hold on
hmm, guess not, because sklearn metric functions are mostly one-output (rather than an output per class)
so do something like
# predict the validation dataset
validation_predictions = model.predict(validation_data)
# separate the validation dataset into two true classes:
B_inds = validation_true == 1
A_inds = validation_true == 0
# calculate the accuracies for each class:
A_total = validation_predictions[A_inds] == validation_true[A_inds]
B_total = validation_predictions[B_inds] == validation_true[B_inds]
A_acc = np.mean(A_total)
B_acc = np.mean(B_total)
Thank you! Let me try this out. What result should I be hoping for?
tidal bough
A bad result would be a very low accuracy on one of the classes - that's what the model cheating like I described looks like.
kindred radish
Oh right because it's disproportionately guessing between the two
tidal bough
yeah
 untold cove
@plush portal ask @hard frost 🙂
 plush portal
well is he minds replying, he is free to do so
kindred radish
tidal bough
so do something like
```py
# predict the validation dataset
validation_predictio...
would you mind if i quickly DM you about this?
untold cove
Any plotly pro’s here?
Maybe best to just add the content with dash I guess, no need to filter the histogram
 paper lake
plush portal
what's data science
paper lake
plush portal
what's data science
Data Science is an interdisciplinary field. A mix of statistics, computer science, and one or more disciplines (e.g. biology, mathematics). Data Science can be an umbrella term but one can guess that it involves data. A data scientist's job is to fetch, clean, manipulate, and analyze large amounts of data so that it can be interpreted into a form where a human can then understand or read the result of an analyses. Anyway, thats the gist of it and u can just look it up on Google or some search engine
plush portal
Bravo! thankies
kindred radish
@tidal bough So i gave it a whirl and I got exactly the same as my score which means i interpreted your code wrong lol What did you mean by the validation_true step when you separate the data-set into two classes?
misty flint
paper lake
Data Science is an interdisciplinary field. A mix of statistics, computer scienc...
nice status. lol
tall basin

Python tip:
Yes, the python shell is unsightly, but you can install the ptpython shell, with autocompletions, highlight. ...
#developers #coding #100DaysOfCode #webdev #coder #tech #javascript #womenwhocode #CodeNewbie #java #Python #DEVCommunity #Python3 #DataScience
#AI

 Twitter
·
Twitter
·
 paper lake
tall basin
https://twitter.com/Br3Sc/status/1368924489703129088
paper lake
tall basin
https://twitter.com/Br3Sc/status/1368924489703129088
your point is?
how is this relevant here?
paper lake
better do that on #ot0-psvm’s-eternal-disapproval or other offtopic channels
tall basin
paper lake
better do that on <#291284109232308226> or other offtopic channels
Oh, sorry, I really hadn't saw that, I'll send It there now
Sorry again
lapis sequoia
does this channel topic include neural networks?
paper lake
it does i guess since neural networks is part of machine learning
odd lion
Technically yes, though I kind of feel like we need a numpy/pandas channel and then the rest of DS channel
paper lake
odd lion
Technically yes, though I kind of feel like we need a numpy/pandas channel and t...
#community-meta suggest that there if u think it is a good idea
lapis sequoia
well i have no idea what the transform argument is in the mnist function (im using pytorch), i have been following a tutorial but its kinda broken
paper lake
also sadly i am new to data science because i am learning bioinformatics so i still cant help u with that
paper lake
lapis sequoia
well i have no idea what the transform argument is in the mnist function (im usi...
probably an outdated one?
check the versions
and read documentations just in case
lapis sequoia
wait its not outdated i misstyped something, but i still have no idea what the transform argument is
paper lake
hmmm i hope someone can help u with that. i usually ask in discourse or on another platform
lapis sequoia
can you send a link to the docs?
misty flint
paper lake
also sadly i am new to data science because i am learning bioinformatics so i st...
i seriously considered bioinformatics before deciding on a grad program that was more data-science leaning
(artificial intelligence)
i was just afraid it was too narrow of a scope and wouldnt have as many job prospects
paper lake
misty flint
i seriously considered bioinformatics before deciding on a grad program that was...
any data science stuff is actually good,
u can translate what youve learned into other fields thats why data science is so hot right now for the next few decades be it in biology (bioinformatics, computational biology) or in other fields
misty flint
paper lake
any data science stuff is actually good,
u can translate what youve learned into...
yeah i actually have a medical and public health background, so ill see about leveraging that domain expertise some time after schooling
but also maybe not bc that industry is heavily regulated
hollow sentinel
I am avoiding data science for now bc I want to do data strucs/algos
misty flint
so its harder to do stuff in the field
paper lake
ooooh we have the same goals then
misty flint
paper lake
similar rather
misty flint
yeah i might try a couple industries then circle back to the medical field
hollow sentinel
do machine learning for petroleum companies
hollow sentinel
they make hella money
paper lake
hollow sentinel
~~I am avoiding data science for now bc I want to do data strucs/algos~~
it is actually a good choice to learn that first
misty flint
its also extremely volatile
paper lake
misty flint
its also extremely volatile
haha true but getting familiar with it is a good idea tho
hollow sentinel
paper lake
it is actually a good choice to learn that first
exactly then I have the foundational knowledge for the algorithms in sklearn and I'll know the data structures I can use instead of just lists and dictionaries
I was joking
strange sense of humor
misty flint
oil and gas industry: oh price of gas has gone down, since youre not a senior position, you get laid off

hollow sentinel
data science position at a bank
paper lake
u should also know how to use grakn too guys
:3
plan to learn it next
after some stuffs
https://grakn.ai/ good stuff
misty flint
paper lake
planning to learn BioGrakn
hollow sentinel
I am stuck in linked list hell
hollow sentinel
R is not that bad to learn
misty flint
its not
paper lake
misty flint
i would have to learn R first tho
just julia with me
misty flint
i used it to do my stats homework
hollow sentinel
according to the CUNA mutual group people it's easy to make the switch
misty flint
paper lake
i know R since i played with it in highschool
hollow sentinel
sigh if only Textron let me work remotely
paper lake
misty flint
something something <- something something
julia is good too :((