#data-science-and-ml
1 messages · Page 290 of 1
 hasty grail
 arctic wedgeBOT
@hasty grail :white_check_mark: Your eval job has completed with return code 0.
001 | [[ 10. 100.]
002 |  [ 10. 100.]
003 |  [ 10. 100.]
004 |  [ 10. 100.]
005 |  [ 10. 100.]
006 |  [ 10. 100.]
007 |  [ 10. 100.]
008 |  [ 10. 100.]
009 |  [ 10. 100.]
010 |  [ 10. 100.]
011 |  [ 10. 100.]
... (truncated - too many lines)
Full output: https://paste.pythondiscord.com/ukasudeciw.txt
hasty grail
You're welcome
Regarding vstack:
Stack arrays in sequence horizontally (column wise).
This is equivalent to concatenation along the second axis, except for 1-D arrays where it concatenates along the first axis.
That's why it didn't work in your case
 distant path
Can you run code in this server?
hasty grail
!e
arctic wedgeBOT
 Command Help
!eval [code]
Can also use: e
*Run Python code and get the results.
This command supports multiple lines of code, including code wrapped inside a formatted code
block. Code can be re-evaluated by editing the original message within 10 seconds and
clicking the reaction that subsequently appears.
We've done our best to make this sandboxed, but do let us know if you manage to find an
issue with it!*
arctic wedgeBOT
You are not allowed to use that command here. Please use the #bot-commands channel instead.
distant path
Oh
hasty grail
You can also use it in the help channels (help-<element>)
 misty flint
hasty grail
Regarding `vstack`:
> Stack arrays in sequence horizontally (column wise).
>
> ...
misty flint
hasty grail
Regarding `vstack`:
> Stack arrays in sequence horizontally (column wise).
>
> ...
ahhhh didnt see that in the documentation. thanks for pointing that out
hasty grail
(Obviously only if you intend to contribute to the discussion)


 hasty grail
Hmm not sure, are you using the same version as that in the tutorial?
 hoary wigeon
i guess, i installed the requirement which they provided me with the tutorial
any other way to do the same ?

 misty flint
for fun i found an alternative to hstack/vstack; wont use this but i thought it was cool to see

yeah irl i would just assign the dataset directly
hasty grail
as in
misty flint
no need to fill it up with zeroes first
hasty grail
training_data[:, 0] = Blue
misty flint

i feel like i tried that first
but that was where i got the shape errors
bc i hadnt reshaped it in that case
but i see your point
no need to even use np.full

 misty flint
for me it works with plot
i just pulled my hair trying to do so

@hoary wigeon

also nice upside down text 
i think the function is just plt.legend for whatever graph
misty flint
ah
i had the same question
its an optional parameter fmt
if you look at the scatterplot, each one is a different shape
good for those that are colorblind
so good practice is to try to have different shapes
heres the key for it
 misty flint
hoary wigeon
when did u started with visualization ?
misty flint
hoary wigeon
when did u started with visualization ?
when did i start? this semester
forced to learn matplotlib bc of school
ive learned id rather use other viz tools instead if i can get away with it
i heard R's ggplot2 is good
ill have to try that sometime
 cosmic heron
Hey guys, I have some columns in my data frame that hold the same data, just that I get them in different names.
similar_cols = ['SKU', 'Sku', 'Query', 'Product Keywords']
I want to merge all of these into a single column df['SKU'], how would I go about doing that? I'm trying to use concat right now:
merged_df['SKU'] = merged_df[['Query', 'Product Keywords', 'Sku']].sum(1)
but it doesn't seem to be working, the original data in the 'SKU' column remains intact, but all other rows are filled with 0.0.
I'm using pandas
 swift geode
merge_df['SKU'] = merged_df = similar_cols[1] + similar_cols[2] + similar_cols[3] + similar_cols[3] + similar_cols[4]
 chrome skiff
Hello guys, rn i'm stuck at how to merge rows of subsidiaries/sister companies (ex: Tesla Motors and Tesla Battery). The merge will based on their name
cosmic heron
swift geode
``merge_df['SKU'] = merged_df = similar_cols[1] + similar_cols[2] + similar_cols...
Oh damn, trying, one sec
swift geode
Im not good at python but i think thats a simple solution xd
cosmic heron
Should this be merged_df[similar_cols[1]] and so on?
On the addition side
Cuz right now it's just adding strings
swift geode
Try
cosmic heron
Alright, so this is what I have now:
merged_df['SKUU'] = merged_df['Query'] + merged_df['Product Keywords'] + merged_df['Sku']
But 'SKUU' is just full of nulls
swift geode
i would prefer to delete the "['SKUU]" so like this : merged_df = merged_df['Query'] + merged_df['Product Keywords'] + merged_df['Sku']
i dont even know what "['SKUU']" is doing xd
cosmic heron
It's supposed to be where the new column sits
Wouldn't what you're suggesting delete the entire df?
I'll try anyway
swift geode
i dont know Xd im a noob
 swift geode
just wanted to help
 tacit basin
Thanks! So what you are saying magic %matplotlib online is not needed?
 iron basalt
tacit basin
Thanks! So what you are saying magic %matplotlib online is not needed?
iron basalt
tacit basin
Thanks! So what you are saying magic %matplotlib online is not needed?
Maybe idk
try it
tacit basin
Yep i never use it and it works as if I used it
That's why I'm curious why this magic is needed?
Do some people have to specifically call the magic to get online graphs?
iron basalt
In past you had to, inline was not the default.
A lot of the tutorials out there are old, so people have been just using %matplotlib inline without thinking about it because they just follow the tutorial, it works, and they just assume they need it.
 velvet thorn
tacit basin
Thanks! So what you are saying magic %matplotlib online is not needed?
velvet thorn
tacit basin
Thanks! So what you are saying magic %matplotlib online is not needed?
not any more
there are other backends you can use
that will cause plots to be rendered differently
in particular...the inline backend doesn’t support interactivity.
 chilly geyser
If it's not required anymore it does seem like a really persistent relic from before, and I still see it a lot
Then again I never really read into the details of that particular magic command so I never removed it in my own code
tacit basin
seems to be some confusion if the %matplolib inline magic is needed, but also different behaviour if you import matplotlib in separate cell: https://stackoverflow.com/questions/54329901/behavior-of-matplotlib-inline-plots-in-jupyter-notebook-based-on-the-cell-conten

Stack Overflow
I am curious to understand the below explained behavior of inline matplotlib plots in the Jupyter notebook. I will show three cases:
Case 1: Importing and plotting in separate cells. In this case,...
 gleaming goblet
how do I get a nice average of this line (both a straight line average and a curve firring one)
im using matplotlib

 gleaming goblet
**sneak peak but im trying to see a correlation between the digit of a number and the amount of 1s it has in binary
tacit basin
gleaming goblet
how do I get a nice average of this line (both a straight line average and a cur...
maybe try prophet and plot components: weekly, yearly ? https://facebook.github.io/prophet/docs/quick_start.html

Prophet
Prophet is a forecasting procedure implemented in R and Python. It is fast and provides completely automated forecasts that can be tuned by hand by data scientists and analysts.
tacit basin
 turbid willow
I'm working on correlation too
turbid willow
I'm working on correlation too
what are you trying to do?
turbid willow
tacit basin
what are you trying to do?
finding corr between stocks
tacit basin
never did correlation between stocks. but did some correlation analysis in the past. i can have a look at your data, but can't promise i will know more than you 🙂
turbid willow
I'm very new to this. I'm sure you woould know more than me
the channel is #help-grapes
@tacit basin did u get a chance to check?
tacit basin
long thread 😉
turbid willow
haha 😅
gleaming goblet
if list = [1,2,3,4,5,6] how do I get it to
pair = [1,2]
newlist = np.mean(pair[0], pair[1])
so the new y is the mean of every 2 in the list?
hasty grail
Where does pair come from?
gleaming goblet
thats the thing
i want it to get a pair
cause every 2 points relate
so it takes the average
hasty grail
So what would pair be if you want to take every 3?
gleaming goblet
so list = mean(1,2), mean(3,4) mean(5,6)
but i only want every 2
its a way of averaging my data
hasty grail
oh
gleaming goblet

i want an even line for them
so im going to take every 2
that way i get more of a "curve"
hasty grail
!e
lst = [1, 2, 3, 4, 5, 6]
result = []
for i in range(0, len(lst), 2):
    mean = (lst[i] + lst[i+1]) / 2
    result.append(mean)

print(result)
@hasty grail :white_check_mark: Your eval job has completed with return code 0.
[1.5, 3.5, 5.5]
That's the pure python way
If you want to leverage NumPy then you'll have to reshape the array into (..., 2, ...) and take mean along that axis
gleaming goblet
ty
how do i display them on different plots, green is the mean of each 2, yellow is the maount of 0s and blue is the amount of 1

thanks by the third time averaged it basiced down to this

 vale fjord
I wanna try making a model which classifies files, for a classifier i'd use something like a decision tree, correct?
Also, which library would you guys reccomend for this? I've been looking at Keras, as it seems quite high level, but sklearn seems to have built in methods for decision trees.
 faint patio
Hello everyone
I am having issues plotting a grouped dataframe

This is my grouped Dataframe
And I need to plot this
3 lines, representing 25%, 50% and 75%
in one graph
x axis = hour
I honestly have no idea how to do that
pls help
gleaming goblet
- the amount of "1" in each binary, 2. amount of "o" 3. the sum off them both
any cool information gotten from this you reckon?
 tacit basin
faint patio
tacit basin
faint patio
would df.plot() work?
faint patio
yea i fixed it already, thanks for the help
 lapis sequoia
Is logistic regression a classification or regression algorithm?
 brisk plaza
lapis sequoia
Is logistic regression a classification or regression algorithm?
brisk plaza
lapis sequoia
Is logistic regression a classification or regression algorithm?
fairly sure it's still a regression alg
lapis sequoia
brisk plaza
fairly sure it's still a regression alg
I thought so too but it's recommended in a few articles ive been reading for classification
 languid spruce
Hi guys,
Would a software engineering degree still let me be a data scientist?
Right now I love programming and my main language is python.
But I've been looking into data scientists, and I'm unsure whether my degree will be helpful to become one
Mention me if you reply to me
tacit basin
lapis sequoia
Is logistic regression a classification or regression algorithm?
sklearn has it as Logistic Regression (aka logit, MaxEnt) classifier. usually used to classify input data into classes.
lapis sequoia
languid spruce
Hi guys,
Would a software engineering degree still let me be a data scientist?
R...
Yeah that'd be fine, but you'd need to brush up on your stats pretty heavily
It's perfectly accessible though
You can either go via the maths route or the compsci route
lapis sequoia
tacit basin
sklearn has it as Logistic Regression (aka logit, MaxEnt) classifier. usually us...
so it's a classification algorithm?
I mean it's a separator so I'd imagine so right?
tacit basin
languid spruce
Hi guys,
Would a software engineering degree still let me be a data scientist?
R...
i think software engineers have easier to get into field as most of the time you need to program (a lot in python) to do analysis. you may want to try the more coding heavy ones. like deep learning. i would suggest for you to check fastai deep learning for coders course and book.

Medium
The hidden relationship between linear regression and logistic regression that most of us are unaware of
 grave frost
tacit basin
i think software engineers have easier to get into field as most of the time you...
grave frost
tacit basin
i think software engineers have easier to get into field as most of the time you...
agree on the programming point, but most SWE I have met are mostly not very familiar with stats and maths which becomes a stumbling block for them (unless they just wanna mess with frameworks and keep it at that)
languid spruce
Ok thank you all. You lots helped me a lot
languid spruce
tacit basin
i think software engineers have easier to get into field as most of the time you...
Ok thanks will do
languid spruce
lapis sequoia
Yeah that'd be fine, but you'd need to brush up on your stats pretty heavily
Ok thanks. Will do
turbid willow
how do I write a heat map of a 500 by 500 correlation matrix?
tacit basin
Sure depends what's your goal. If applied machine learning then i think don't need to know much math.
Theoretical ML i would think lots of math
turbid willow
I get smthg like this
 tacit basin
Will be huge heat map. Yes like that lol
turbid willow

for 10 by 10 I get this
neat af
I need the 500 by 500 to look like this
possible?
grave frost
tacit basin
Sure depends what's your goal. If applied machine learning then i think don't ne...
IMHO Applied ML is just an excuse to say that you have shallow knowledge and no interest at all in the domain
 cloud thorn
Can I ask for ML help in here or do i need a help channel? I think its a simple question
 ripe forge
lapis sequoia
Is logistic regression a classification or regression algorithm?
ripe forge
lapis sequoia
Is logistic regression a classification or regression algorithm?
You can use logistic regression for classification. The issue is, it's a bit more nuanced than that, because it still predicts like a normal regression but then it's converted into a 0-1 range of continuous values (so still regression!) and then you set a threshold on it to turn those values into a binary classifier.
So, whenever someone asks whether it's regression or classification... The answer is "it depends" on what you meant. Aka the layman answer is, ick it's complicated go away!
grave frost
cloud thorn
Can I ask for ML help in here or do i need a help channel? I think its a simple ...
yeah
lapis sequoia
1984-09-07    0.42388
1984-09-10    0.42134
1984-09-11    0.42902
1984-09-12    0.41618
1984-09-13 0.43927``` Assume this is a print to the first 5 entries `print(prices[:5])` of a dataset of stock prices. What is the following function supposed to output `df = prices.index.searchsorted(prices.index - delta)` ; where delta is a time filter `pd.Timedelta(days=1)`.Okay, so it may be a stupid question...
I have my training sets, tweets which are labelled positive or negative. I am unsure on how to get my testing data classified, as whenever I plug it into the classifier made from the training data I get accuracy of 0. Heres my code.
posDataset = [(tweet_dict, "Positive")
                     for tweet_dict in posModel]

negDataset = [(tweet_dict, "Negative")
                     for tweet_dict in negModel]

testDataset = [(tweet_dict, "")
                     for tweet_dict in testModel]

trainingDataset = posDataset + negDataset

random.shuffle(trainingDataset)

trainData = trainingDataset[:7000]
testData = testDataset[7000:]

classifier = NaiveBayesClassifier.train(trainData)
How can I classifiy testData correctly?
misty flint
ripe forge
So, whenever someone asks whether it's regression or classification... The answ...
thats so funny
or "ugh stats"
tacit basin
grave frost
IMHO Applied ML is just an excuse to say that you have shallow knowledge and no ...
everyone can have an opinion 🙂
 lapis sequoia
ripe forge
You can use logistic regression for classification. The issue is, it's a bit mor...
lapis sequoia
ripe forge
You can use logistic regression for classification. The issue is, it's a bit mor...
Ah, so the logarithm turns the continous range to a binary one?
ripe forge
Pretty much. Or it doesn't even turn it into a binary on its own, that's the threshold that we apply in post
misty flint
ye
ripe forge
Technically logistic regression has done its job when it gives values between 0-1
lapis sequoia
Cool, thanks
ripe forge
Np :)
misty flint
always gotta think about your situation/problem
i think thats why many people DONT like it
 brave anvil
Hey everyone, I'm a chemistry uni student and ive been assigned a remote lab that I'm really stuck on. It's using python to send and receive data from an Arduino device - am I on the right help chat?
lapis sequoia
brave anvil
Hey everyone, I'm a chemistry uni student and ive been assigned a remote lab tha...
Nah check general, you just want a normal API so it's not data science specific
cloud thorn
So I have my tweet datasets, labelled Positive, Negative and a set which needs classified, so has no labels
Is this possible to do with the Naive Bayes?
Everytime I plug it in to my classifier I get accuracy of 0
grave frost
hello everyone, my model is not learning - I wager the problem is in the input pipeline so could anyone take some time out to verify my inputs are correct? I am taking the x_train tokenized and padded and x_pred converted to a categorical 1D feauture using the TF utility looking like this: -
[ 1544   137 16858     7    89   128   114   137   176    10    74    10
   144   250     2   133    44   250   112    97   115   159   169     2
   172  6465  6466   212     2   370   383   339   155 16859    14  4245
  4246   211  6467  3133  7964    99   783  7964   127   155  1434 10597 ................. and so on ]

--LABEL---------->
[0. 0. 0. 0. 0. 0. 0. 1. 0. 0. 0. 0. 0. 0. 0. 0. 0. 0. 0. 0.]
Any guesses what could be wrong?
BTW The problem is that with my model, for each epoch, it essentially resets whatever it has learned. Tried with a simple dense layer - same results. right now, its just guessing randomly. I reduced regularizations and dropouts suspecting perhaps there wasn't enough updation in the gradients to no avail. Can't overfit also
 exotic maple
grave frost
IMHO Applied ML is just an excuse to say that you have shallow knowledge and no ...
exotic maple
grave frost
IMHO Applied ML is just an excuse to say that you have shallow knowledge and no ...
That's like saying any form of applied discipline i.e: mechanics, for example. are shallow because they are not materials engineers
grave frost
exotic maple
That's like saying any form of applied discipline i.e: mechanics, for example. a...
My opinion was in scope of CS only; I wasn't taking the liberty to speak on other fields where I may not be familiar with
exotic maple
I mean, even in CS, many kinds of developer jobs / tasks don't require in-depth knowledge of CS.
grave frost
but saying you are an applied ML engineer is just like saying you don't even know how your tools work - its all just programming for you, nothing else
I don't need to learn a lot of things in depth to create something, but as the proverb goes "better to be ignorant than to know a little" (or smthing like that)
exotic maple
I guess we have a gentleman's disagreement, but I understand your point of view
I might kind of biased thinking i dont need the math but i already studied it all in college lol
grave frost
you can go out and hack a screen with an arduino and say you made a gaming console, but can you actually put it in the production level? no. you need a team who knows their shit and how to make an actual game console and code it up
grave frost
exotic maple
I might kind of biased thinking i dont need the math but i already studied it al...
you do need math - just in ML, not necessarily everywhere
you can do ML without math (like I do) but you would never have an in-depth knowledge of the tools you use.
exotic maple
eh, you can "know" math and still get fucked by it lol. I lost half a day reading the in-depth math behind SVC and I only got halfway there
grave frost
ikr. that's why I like to get an intuitive sense of it, because the math explained is for collegers anyways
some of it is understandable, but the most of it.......not too much
exotic maple
Like, I understand what it does, how it does it, but getting the full sense of the algorithm, no thanks lol
 sweet zenith
guys, do you have cool ai project ideas you want to share?
grave frost
@sweet zenith what for?
sweet zenith
grave frost
<@!698791901767139338> what for?
what do you think I'm asking it for
grave frost
guys, do you have cool ai project ideas you want to share?
sounds like you want to post them somewhere
sweet zenith
grave frost
> guys, do you have cool ai project ideas you want to share?
sounds like you wan...
nope
I want to make them
grave frost
ahh.. stocks prediction?
grave frost
Mostly, just take a stock that you like (and may think about investing in) and predict that. It would be more educational than useful as a financial tool
sweet zenith
grave frost
Mostly, just take a stock that you like (and may think about investing in) and p...
well 👏👏👏
anyother ideas?
grave frost
text generation - if you like reading books, you could pick up one of your favorite series (Harry Potter is a good one because It has plenty of data) and try to fine-tune some model and predict what should happen next
sweet zenith
grave frost
text generation - if you like reading books, you could pick up one of your favor...
so, a storybook predictor
grave frost
precisely.
None of them are very easy - but they are pretty educational (not to mention fun!)
sweet zenith
hmm, pretty cool ideas you have
grave frost
😎
sweet zenith
just spill out all the ai ideas you have
grave frost
haha, I am just thinking some that I have done 🙂
sweet zenith
grave frost
haha, I am just thinking some that I have done 🙂
so are you good at AI?
grave frost
nah
sweet zenith
oh
grave frost
well, its kinda more like you want to do, rather than me suggesting projects 🤷
A lot of beginners like to make AI to play some game (RL)
sweet zenith
well, I want a good AI startup idea
grave frost
good AI startup idea
If I had one, do you think I would be here?
sweet zenith
grave frost
> good AI startup idea
If I had one, do you think I would be here?
i dont think so
grave frost
anyways, you would have to gain some knowledge of AI before trying to figure out how you can make a startup out of it
exotic maple
grave frost
anyways, you would have to gain some knowledge of AI before trying to figure out...
Eh, I'd look at it the other way. He's more likely to find a startup idea from something he already works on / knows off, than random ideas out there
grave frost
True
 stable wing
sweet zenith
i dont think so
stable wing
sweet zenith
i dont think so
lol, you really scrapping other people's ideas just like that? get a consultant...
 tame root
do you guys have any tips for getting data
im looking for works of art specifically (if i can organize by style/era that would be super helpful)
 tardy bison

Academic Torrents
115 paintings from the Hermitage museum, high-resolution, JPEG All images are public domain.
cloud thorn
Hi guys, I want to classify every tweet in my database, which looks like this

But when I do classifer.classify(tweets)
It only prints 'Positive' which I think is either the first or last tweet, not the overall sentiment
Using the NaiveBayes from the NLTK
Does anyone have any ideas?
vale fjord
If i wanna play around with decision trees for classifying files, would you guys reccomend i go with something like scikit-learn, or look at higher-level tools such as keras?
grave frost
scikit-learn
 void zodiac
vale fjord
If i wanna play around with decision trees for classifying files, would you guys...
void zodiac
vale fjord
If i wanna play around with decision trees for classifying files, would you guys...
For playing around and testing different classification algorithms, scikit-learn is probably a good choice and a very versatile library. There is an outstanding user guide which is a great reference both for beginners and advanced users: https://scikit-learn.org/stable/user_guide.html#
If you want to start with deep learning, keras could be a good choice.
Want kind of classification do you want to do? 🙂
vale fjord
Classifying files into different categories, Feel like it could make company files be more... structured, instead of a blobby mess we currently have + it's a good way into ML i think.
void zodiac
vale fjord
Classifying files into different categories, Feel like it could make company fil...
Yes, sounds interesting and something others could benefit from. Guess you could assign a few category labels to files yourself and then start training a simple classifier. Are these text files your want to classify based on their content?
 wintry zinc
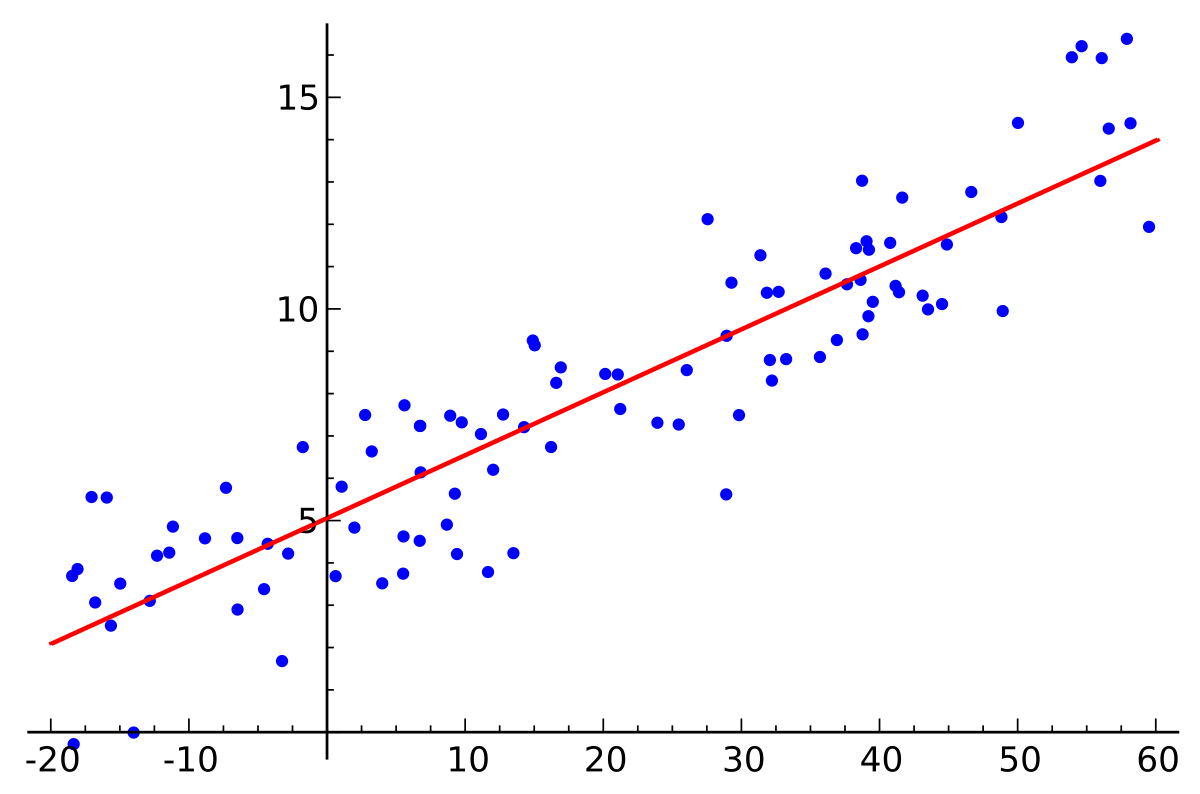
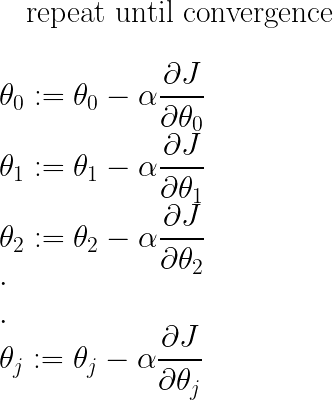
Hello guys, I have started a blog where I will explain a new machine learning algorithm each week with two articles each week where one article is how the algorithm works and the other article would be the python implementation, Currently, Linear Regression and Logistic Regression are available on my blog. It would be great if you could check my articles and out and suggest some feedback. Thanks!
Theory of Linear Regression : https://ahaanpandya.medium.com/linear-regression-explained-868914443188
Python Implementation: https://ahaanpandya.medium.com/linear-regression-python-implementation-18f38d71b8ff
Logistic Regression: https://ahaanpandya.medium.com/classification-using-logistic-regression-bf4572023
Medium
Linear Regression is one of the most fundamental algorithms in Machine Learning you will ever encounter. Linear Regression involves…
Medium
In my last article, I focused on how the algorithm works and the theory behind linear regression but now in this article, I will focus on…

Medium
In my last article, I explained Linear Regression which is used to predict a continuous value like a stock or a house price. The value can…
vale fjord
void zodiac
Yes, sounds interesting and something others could benefit from. Guess you could...
Text files indeed! A few of them actually already have "labels", so getting the rest + future files applied would be dope.
Files have some content in them which i could use, certain symbols show up a lot in some files, i guess i could count these and put them into one attribute.
 dawn kite
Hi everyone! I am trying to build a neural network in Pytorch, but I keep getting the error: 'dict' object is not callable when trying to iterate through data in a DataLoader object. Do any of you lot have experience with this error or Pytorch in general? I can provide code snippets if needed!
void zodiac
vale fjord
Files have some content in them which i could use, certain symbols show up a lot...
Here is a good example running through a text dataset (newsgroup emails): https://scikit-learn.org/stable/tutorial/text_analytics/working_with_text_data.html
It's quite fast-paced and does not explain all the basics but might get you to a working classifiere quite quickly
void zodiac
void zodiac
Here is a good example running through a text dataset (newsgroup emails): https:...
Just replace the newsgroup emails with the contents of the files you want to work with, for example 🙂
vale fjord
That's awesome! Thanks alot, i didn't find that guide in my search, just found the iris parts, this should help more!
wintry zinc
guys it would be aweome if you could check out my articles and give me some feedback, thanks!
Theory of Linear Regression : https://ahaanpandya.medium.com/linear-regression-explained-868914443188
Python Implementation: https://ahaanpandya.medium.com/linear-regression-python-implementation-18f38d71b8ff
Logistic Regression: https://ahaanpandya.medium.com/classification-using-logistic-regression-bf4572023
Medium
tame root
tardy bison
https://academictorrents.com/details/0ef42919a5688ea60f7174ccf899a91774508b48
thanks
iron basalt
lapis sequoia
Ah, so the logarithm turns the continous range to a binary one?
Take a look at the logistic curve: https://upload.wikimedia.org/wikipedia/commons/thumb/8/88/Logistic-curve.svg/1920px-Logistic-curve.svg.png

(-infinity, infinity) -> (0, 1)
It basically squashes the whole number line into 0 to 1 range.
wintry zinc
guys it would be aweome if you could check out my articles and give me some feedback, thanks!
 abstract zealot
 cloud thorn
wintry zinc
guys it would be aweome if you could check out my articles and give me some feed...
cloud thorn
wintry zinc
guys it would be aweome if you could check out my articles and give me some feed...
Ill check them out, im actually working on my dissertation looking into them so they should be useful!
abstract zealot
the kstest is for poisson distribution, and the variance on the x axis is the variance of data generated by norm.rvs
can someone help explain the bgeinning of this graph?
The same happens with anderson stat and chi squared
iron basalt
exotic maple
eh, you can "know" math and still get fucked by it lol. I lost half a day readin...
In programming and CS there is a lot of useful math, but also a ton of useless math that is just math for that sake of math. For a mathematician, application is not necessary, in the same way a painting's usefulness is not necessary (both are art and art needs no direct nor indirect utility). If you get annoyed by wasting a bunch of time on useless math written by some professors that is way worse than the stuff people just intuit (and have actually implemented), you are not alone. Many programmers have been annoyed by this for a long time, including Donald Knuth who wrote about it in his lecture notes: https://www.amazon.com/Selected-Papers-Computer-Science-Lecture/dp/1881526917.
People have kind of figured out at this point which math has proven useful for programming. Of course there will be others found to be useful, but some obvious and tested ones include linear algebra, calculus, differential equations, set theory, number theory, graph theory, topology, group theory, probability, statistics, logic (first order and other variants like fuzzy logic), decision theory, control theory, game theory, etc.
 heady warren
does pytorch have any baseline visualization tools?
i'm trying to produce a histogram with intermediate output values
but i'd rather not deal with an external library
misty flint
so word embeddings in nlp are a way of quantifying the context of a certain word in a sentence, if i am understanding this correctly?
grave frost
iron basalt
In programming and CS there is a lot of useful math, but also a ton of useless m...
That's a pretty bad approach for people who want to go into ML research
grave frost
misty flint
so word embeddings in nlp are a way of quantifying the context of a certain word...
yeah - pretrained embeddings. we (I) normally use embeddings in models just to increase their dimensions and help the model to map out more complex patterns.
but using the pre-trained embeddings (GLove being a famous one) you can use simple vector distance to calculate how similar words are (a technique used by some to find synonyms) which increases their usefulness
iron basalt
grave frost
That's a pretty bad approach for people who want to go into ML research
Not sure what you mean. I did not present an approach to ML.
iron basalt
ML requires math, not saying that you can just not use any math. Just that often people can go way overboard with the math (see programming languages / Knuth's notes), whereas the main ideas are what really matter. Like for ML you want of bunch of the general concepts from probability, statistics, linear algebra, calculus, etc.
 undone scarab
anybody know as to why my GAN discriminator accuracy isnt changing
iron basalt
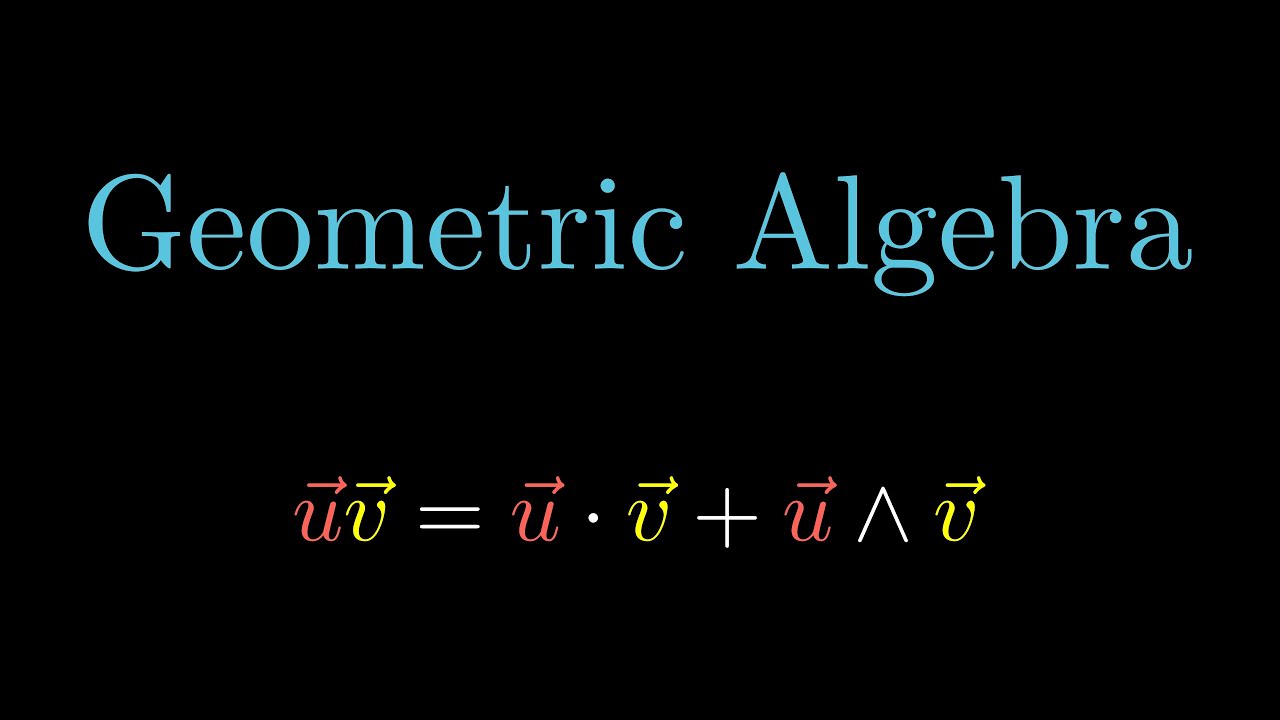
Btw since i'm already writing a bunch about math, I would like to mention Geometric/Clifford Algebra is the future and will replace traditional linear algebra. It's an improvement in every way, much more intuitive, cool visualizations for everything (hence the geometric part of the name). It's currently being slowly implemented in game development to replace quaternions for rotations and inverse kinematics.
There is a discord for it called bivector if you are interested.
grave frost
I haven't even started on HTM's yet man 😅
 real pier
I am currently working on a machine learning project that involves recommending music to people based on age and gender.What I need is data for this project ,and I don't know where to find this data. Can anyone help me find some good data?
iron basalt
grave frost
I haven't even started on HTM's yet man 😅
There is an endless ocean of stuff to do. Which is what makes AI so hard, it's a multi-arm bandit problem. Which level do I pull?
grave frost
real pier
I am currently working on a machine learning project that involves recommending...
that's stereotypical
real pier
grave frost
that's stereotypical
it is a basic program.
grave frost
iron basalt
There is an endless ocean of stuff to do. Which is what makes AI so hard, it's a...
agreed. so much to learn, so little energy
real pier
grave frost
that's stereotypical
I am a beginner.I don't mean to offend anyone
grave frost
real pier
I am a beginner.I don't mean to offend anyone
its cool
😦

cant figure it out. Did everything - what could it be? Any ideas anyone?
real pier
what is that?
grave frost
model loss
real pier
oh
dawn kite
iron basalt
Btw since i'm already writing a bunch about math, I would like to mention Geomet...
based
exotic maple
iron basalt
Btw since i'm already writing a bunch about math, I would like to mention Geomet...
Any decent places to read about Clifford Algebra? I tried Wikipedia but that's like asking my 6yr old daughter for an explanation...
iron basalt
exotic maple
Any decent places to read about Clifford Algebra? I tried Wikipedia but that's l...
Ask in the bivector discord, there are several books, but I just learned it after knowing linear algebra already and some game dev (quaternions) so it came naturally.
I watched some lectures but I don't have them bookmarked. Other than that I just followed some stuff people were programming in bivector.
This video is an introduction to geometric algebra, a severely underrated mathematical language that can be used to describe almost all of physics. This video was made as a presentation for my lab that I work in. While I had the people there foremost in my mind when making this, I realized that this might be useful to the general public, so I ...
seems p good
grave frost
Anyone know some sort of light monitoring tool to study network gradients etc.?
iron basalt
idk about light, I actually just make my own really quickly (with pygame, or ursina, or dear imgui (bimpy for python or dearpygui)).
(if what I want to monitor is simple enough)
misty flint
grave frost
yeah - pretrained embeddings. we (I) normally use embeddings in models just to i...
interesting
misty flint
iron basalt
https://www.youtube.com/watch?v=60z_hpEAtD8&feature=emb_logo
oh nice.
 sweet zenith
stable wing
lol, you really scrapping other people's ideas just like that? get a consultant....
sweet zenith
stable wing
lol, you really scrapping other people's ideas just like that? get a consultant....
chill man
 charred umbra
My paper got published in an E archivr
It uses python and ML stufd
You guys can read it if interested
iron basalt
@charred umbra I skimmed it and I noticed that your DNN is all linear acitvations. Is this correct?
charred umbra
All RELU yeah
 eager timber
how do i create an roc-auc curve like what are the key considerations used in the syntax and steps involved?/
charred umbra
Yeah I thought you meant it being linear as in not something like sigmoid or tanh
But yeah rectified linear
iron basalt
Is RELU mentioned in the paper?
charred umbra
I don't remember, but it could be
Not in the version you saw, but in another version i did mention it
I'm a high school student btw, so not really experienced with writing real ML type research papers
iron basalt
Yea it's all good, just thought you wanted some feed back.
The other thing that stood out to me was "The positive control was the tap water without any HC."
Tap water does of course differ from one place to another, but i'm not an expert in this domain.
charred umbra
For this expiriment, tap water was the positive control just because tao water has been proven to help plants grow throughout the united states
iron basalt
*demonstrated (maybe even strongly demonstrated), not proven. Proof is for mathematicians (it's a very strong word, so strong it can only really happen in the abstract world).
Though most people will just use the word proof.
(Of course I mean within the context of math/science, in something like legality / everyday usage of the word, something is proven when the evidence reaches an arbitrary threshold that depends on the context).
misty flint
charred umbra
https://vixra.org/abs/2103.0015
pretty good paper for a high schooler
better than some undergrads ive seen
iron basalt
misty flint
pretty good paper for a high schooler
I agree.
misty flint
if youre looking for feedback, i would maybe polish your abstract
your intro and conclusion are both better written
in the research world, your abstract needs to be 💯
 round orchid
Hi noob question what is the process of implementing ML in this data https://drive.google.com/file/d/1nqSl3JjWfBIUZuAOdn3lBfroNHRnHqzM/view?usp=sharing

Google Docs
we're trying to do visualization and time series analysis with that data
 hollow sentinel
You should clean the data first
figure out what you’re doing w the Nans
figure out how you’re handling extremely high values and low values
drop rows of missing data
round orchid
alright thank you sir 🙂
 glad widget
hollow sentinel
figure out what you’re doing w the Nans
glad widget
hollow sentinel
figure out what you’re doing w the Nans
Hi bro, you mean the "N/A"?
iron basalt
nan = not a number
round orchid
Handling the Nan Value?
glad widget
iron basalt
nan = not a number
Oohh, okay. Thank you. 🙂
hollow sentinel
You can actually replace the nans with the mean of a column
iron basalt
(aka the expected value)
hollow sentinel
Yep
misty flint
round orchid
we're trying to do visualization and time series analysis with that data
just glancing at your data, i would consider comparing the same "parameters" between different "regions/systems"
i think that would be meaningful
would help point out outliers or abnormal cases and maybe lead to further investigation of said water source
if you had multiple years, you could do time series but not if you only have 2018 data
iron basalt
misty flint
would help point out outliers or abnormal cases and maybe lead to further invest...
A quick and easy way to do this is the use an isolation forest, it will probably work.
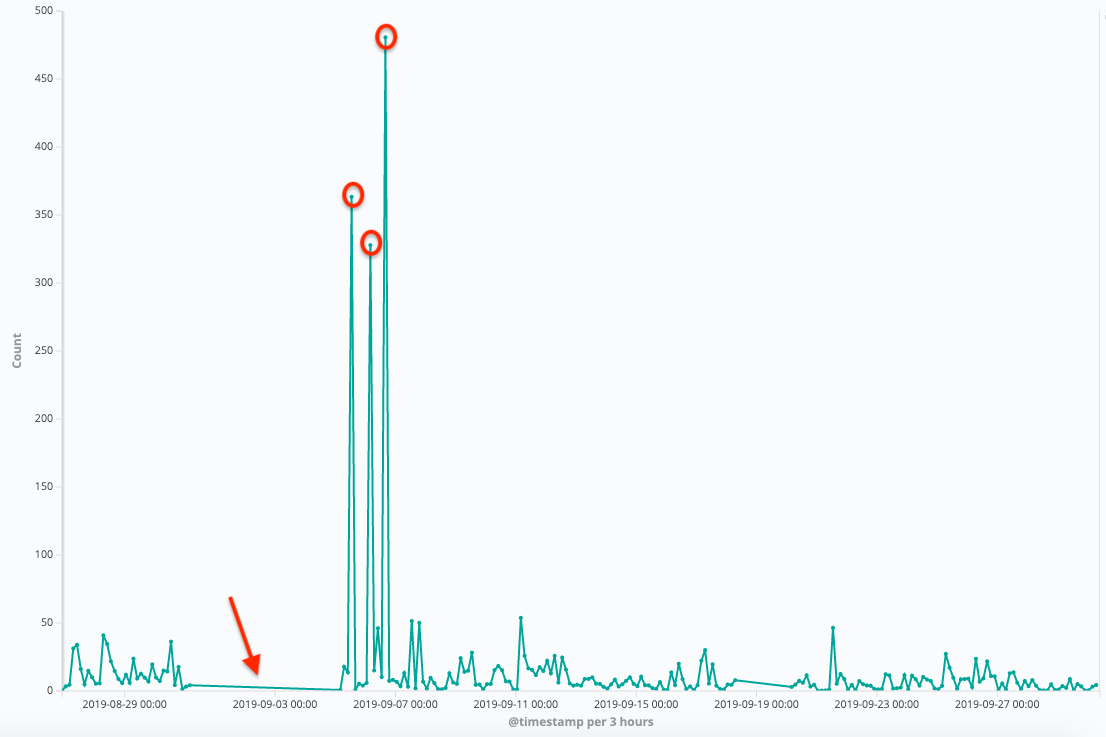
Isolation forest is an unsupervised learning algorithm for anomaly detection that works on the principle of isolating anomalies, instead of the most common techniques of profiling normal points.
In statistics, an anomaly (a.k.a. outlier) is an observation or event that deviates so much from other events to arouse suspicion it was generated by a...
glad widget
misty flint
if you had multiple years, you could do time series but not if you only have 201...
Hi bro! Would 3 years be enough data to perform Times Series Analysis and Forecasting?
 lusty iron
iron basalt
A quick and easy way to do this is the use an isolation forest, it will probably...
lusty iron
iron basalt
A quick and easy way to do this is the use an isolation forest, it will probably...
Isolation forest is for independent data(not time series)
 shadow cedar
Hi. I working on a code project, but am struggling to execute it properly. I was wondering if someone is willing to help me out?
arctic wedgeBOT
Did you mean ...
classmethod
class
 topaz minnow
!class
arctic wedgeBOT
Classes
Classes are used to create objects that have specific behavior.
Every object in python has a class, including lists, dictionaries and even numbers. Using a class to group code and data like this is the foundation of Object Oriented Programming. Classes allow you to expose a simple, consistent interface while hiding the more complicated details. This simplifies the rest of your program and makes it easier to separately maintain and debug each component.
Here is an example class:
class Foo:
    def __init__(self, somedata):
        self.my_attrib = somedata

    def show(self):
        print(self.my_attrib)
To use a class, you need to instantiate it. The following creates a new object named bar, with Foo as its class.
bar = Foo('data')
bar.show()
We can access any of Foo's methods via bar.my_method(), and access any of bars data via bar.my_attribute.
iron basalt
lusty iron
Isolation forest is for independent data(not time series)
Do you mean that it does not work well? Because many people use it for time series.
If you want collective anomalies to be detect you can try adding a rolling window (add a rolling mean to each point).
It's not the best algorithm, but it's very simple to implement and use so I brought it up.
lusty iron
iron basalt
Do you mean that it does not work well? Because many people use it for time seri...
I guess you can use isolation forest on time series data, but I don't know how meaningful the results would be(I don't know if there are "metrics" measuring the success of anomaly detection) . So isolation forest assumes that data order is irrelevant. I guess you can use rolling-windows(ie: pandas's diff/shift to create new variables) to allow for non-independent techniques to work on time series data, I have personally had good performance using rolling-windows for supervised tasks.
iron basalt
lusty iron
I guess you can use isolation forest on time series data, but I don't know how m...
It depends on what their data looks like in general. If they have for example, a spike at the end of each month regularly, isolation forests would probably mark each one of those as an anomaly unless you use a giant window. But if your time series data is something like sales per month then large spikes would show up correctly as anomalies (without even having a rolling window).
lusty iron
iron basalt
It depends on what their data looks like in general. If they have for example, a...
...I don't know if you need isolation forests to catch anomalies in one variable.....
iron basalt
lusty iron
...I don't know if you need isolation forests to catch anomalies in one variable...
True, I am assuming you have some other stuff too. Like sales, and clicks and other.
What I mean is that regular patterns can show up as anomalies without a window method.
Since it would only detect point anomalies.
lusty iron
so Isolation forests make random cuts on data .....data points that tend to be easily isolated with a few cuts are labeled as anatomies......
iron basalt
yea it's like random forests, but faster (not as accurate)
iron basalt
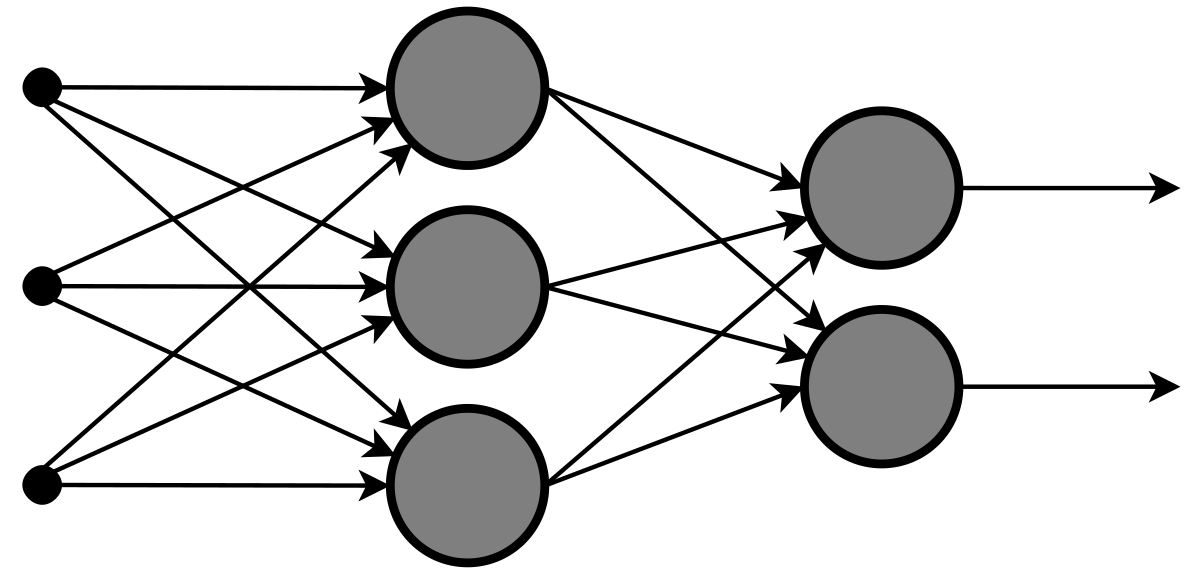
Random forests or random decision forests are an ensemble learning method for classification, regression and other tasks that operate by constructing a multitude of decision trees at training time and outputting the class that is the mode of the classes (classification) or mean/average prediction (regression) of the individual trees. Random deci...
I mean those
iron basalt
hmm maybe I getting mixed up about the random forests
I saw them mentioned somewhere next to isolation forests
Ah the original paper compares it against them
lusty iron
well, Scikitlearn keeps both of them under ensemble
iron basalt
well they are both ensemble methods
(used in combination with other things)
like find anomalies, remove them, feed to rest. But I think it's referring to within the algorithm. The decision tree-ness of them.
lusty iron
I think Isolation forests might be related to extra tree; both make random cuts on data......I would not be shocked if the scikit-learn guys reuse some modules for both
iron basalt
"The implementation of extra-trees is identical to that of a random forest, the only difference lies in the splitting criterion used by the decision trees."
lusty iron
personally, I have not found anomaly detection uselful. Data that ends up being labeled as anomalies is never interpretable
iron basalt
Interoperability usually comes from the problems already being simple. Idk if the isolation forests results will be useful on their data, it's just something to try.
(They were asking for things to try)
lusty iron
from my understanding extra-trees just makes random cuts until a stopping criteria is reached. Then "trains" for the nodes....
iron basalt
yeah it's random cuts for isolation forests
they use the fact that with random cuts, anomalies will on average require fewer cuts to be separated.
being further away from the other points
That's why it's so simple to implement, just some random cuts and build a tree while doing it. Then anomalies will have a low height in the tree.
lusty iron
I have gotten decent performance on extra-tress when the data is really noisy, extra-tress don't overfit 🙂
iron basalt
extra-tress can work pretty well
might want to try random forests, see which works better
lusty iron
Iv seen extra-tree outperform random forests on some data
lusty iron
I would not say that any tree biased algorithm is easy to implement, I have trying as a hobby...it is very hard
I find the scikitlearn implementation of trees hard to read....
iron basalt
Well it's all relative. From my point of view i'm thinking of algorithms I typically find in graphics and simulation as the high end of difficulty. But everything requires some effort.
lusty iron
cart is far from a b-tree
iron basalt
I'm mean like ray tracing craziness when it's nothing but tons of differential equations.
lusty iron
iron basalt
I'm mean like ray tracing craziness when it's nothing but tons of differential e...
yeah, that is fair
iron basalt
lusty iron
I find the scikitlearn implementation of trees hard to read....
I don't really use scikitlearn, for reasons like this.
lusty iron
so be fair,I don't think most ml is not that crazy......unless you doing auto-grad or back-propagation. I think only the math for optimization is a bit crazy
iron basalt
I'm probably wasting my time, but it really bugs me if I don't have an actual understanding so I usually implement things myself (it's also really good practice).
iron basalt
lusty iron
so be fair,I don't think most ml is not that crazy......unless you doing auto-gr...
Oh yea, for sure, if you get into AI stuff too it goes full banana cakes.
lusty iron
iron basalt
I'm probably wasting my time, but it really bugs me if I don't have an actual un...
ahhh, I would stick to code that is well tested and written by people smarted than me
iron basalt
lusty iron
ahhh, I would stick to code that is well tested and written by people smarted th...
I would do that for security things, or maybe as a base implementation to compare mine too. But I don't assume they are smarter than me, a lot of open source code is really questionable.
I like to be brave (or maybe just foolish).
lusty iron
iron basalt
I would do that for security things, or maybe as a base implementation to compar...
I would like to think those guys know what they are doing
you get a lot of phd types contributing to that code base
iron basalt
lusty iron
you get a lot of phd types contributing to that code base
That makes me less confident. I trust people that have coded and shipped actual products.
Some professors know what they are doing for sure. I follow them directly though, some random phd does not mean anything to me personally.
lusty iron
Knowing how to implement those algorithms is hard, I don't know any coder can do it. it is easy to knock on academics/phds when you are on the side lines. There are a lot of eyes on scikit-learn, I would trust it
iron basalt
Yeah it's totally fine to use. It's just a me thing. I need to know all the code that I use (so I can hack / extend / iterate on it).
*There is another point that I like to create / invent new algorithms and for that I really do need to know how these algorithms are coded (the general ideas, not necessarily the exact same stuff).
 cosmic glacier
Squiggle; I would also google on terms such as "time series discord searc/identify" (option: +python) and second keyword instead of discord: Martix profile analysis. For time serie,s, ,those cover more than anomaly detection because it considers intervals (consecutive set of points).
You may have a look for instance at STUMPY package
And there are also (older) time-series encoding approaches such as SAX
(here package saxpy)
iron basalt
cosmic glacier
Squiggle; I would also google on terms such as "time series discord searc/identi...
Are you referring to this? https://notamonadtutorial.com/stumpy-unleashing-the-power-of-the-matrix-profile-for-time-series-analysis-7c46af040adb

Medium
An interview with Stumpy creator Sean Law
cosmic glacier
Now that said, I didn't check especially if your time-series should have patterns but I think approaches also work in case there are not especially patterns
iron basalt
cosmic glacier
Yes: https://stumpy.readthedocs.io/en/latest/Tutorial_STUMPY_Basics.html
Idk it's not my time series problem ask @glad widget
cosmic glacier
iron basalt
Idk it's not my time series problem ask <@!691853439650758736>
Oups sorry discussion chain was long didn't read all just saw latest message
iron basalt
cosmic glacier
Oups sorry discussion chain was long didn't read all just saw latest message
Yea it start by me giving a basic place to get started on their analysis problem.
grave frost
Anyone have any fixes for non-converging models?
iron basalt
Self implemented?
cosmic glacier
Which type of model also?
grave frost
iron basalt
Self implemented?
somwhat yeah
iron basalt
Well then it could always be a bug.
grave frost
its built on Tensorflow 😦 and they try to minimize bugs
iron basalt
Oh ok, then what type of model?
cosmic glacier
Other possibles reasons: too few targets, two few data, multi-colinearity issues in features
grave frost
simple model (like dense one) doen't overfit; I suspect I am missing something
cosmic glacier
oh if so forget my points
grave frost
but I cant figure out what
iron basalt
maybe some wrong hyper-parameters too.
cosmic glacier
indeed, incorrect ranges
grave frost
iron basalt
maybe some wrong hyper-parameters too.
I dont have many at the moment - its pretty bare bones
lapis sequoia
hello, I have this problem, can You help me please?
 grave frost
you want to use ipython?
lapis sequoia
as Kernel I use Python 3.8
iron basalt
grave frost
simple model (like dense one) doen't overfit; I suspect I am missing something
Model could be too simple.
grave frost
iron basalt
Model could be too simple.
hmm..then I try to add transformers to it but that doesn't help it converge either!
Lemmetry with a giant wall of Dense layers and see if it overfits
lapis sequoia
 grave frost
x = layers.Dense(800, activation="relu")(inputs)
x = layers.Dense(800, activation="relu")(x)
x = layers.Dense(800, activation="relu")(x)
x = layers.Dense(800, activation="relu")(x)
x = layers.Dense(800, activation="relu")(x)
x = layers.Dense(800, activation="relu")(x)
x = layers.Dense(800, activation="relu")(x)
x = layers.Dense(800, activation="relu")(x)
x = layers.Dense(800, activation="relu")(x)
x = layers.Dense(800, activation="relu")(x)
x = layers.Dense(800, activation="relu")(x)

x = layers.Dense(800, activation="relu")(x)
x = layers.Dense(800, activation="relu")(x)
x = layers.Dense(800, activation="relu")(x)
x = layers.Dense(800, activation="relu")(x)
x = layers.Dense(800, activation="relu")(x)
x = layers.Dense(800, activation="relu")(x)
x = layers.Dense(800, activation="relu")(x)
x = layers.Dense(800, activation="relu")(x)
x = layers.Dense(800, activation="relu")(x)
x = layers.Dense(800, activation="relu")(x)
x = layers.Dense(800, activation="relu")(x)
x = layers.Dense(800, activation="relu")(x)
x = layers.Dense(800, activation="relu")(x)
x = layers.Dense(800, activation="relu")(x)
x = layers.Dense(800, activation="relu")(x)
x = layers.Dense(800, activation="relu")(x)
x = layers.Dense(800, activation="relu")(x)
x = layers.Dense(800, activation="relu")(x)
x = layers.Dense(800, activation="relu")(x)
x = layers.Dense(800, activation="relu")(x)
x = layers.Dense(800, activation="relu")(x)
x = layers.Dense(800, activation="relu")(x)

outputs = layers.Dense(20, activation="softmax")(x)
Haha, its got to work! (Nope, doesn't)
sad noises 😦
contemplates about life
iron basalt
alright gotta go cya all, @cosmic glacier thanks for the cool link.
grave frost
c ya!
 paper lake
hello. so i am pretty new to data science, can anyone pls explain or share experience using Grakn?
 peak crane
I am trying to install some packages in my conda environment, but the default location where packages are installed is full (in my machine). How do I change this default location?
 sturdy dune
Have you ever been frustrated by extra tedious tasks while working with machine learning models? For sure, most of you would have.
In this era of automation, why couldn’t you automate these machine learning pipelines to save time and effort?
This is where AutoML frameworks come into the picture. Some of the popular AutoML frameworks are :
- H20 AutoML
- Auto-Sklearn
- TransmogrifAI
- TPOT
- Auto-Keras
- MLBox
One could choose any of these frameworks depending upon the business needs.
Refer to the link mentioned below, to know more about them.

In this era of automation, why couldn’t you automate these machine learning pipelines to save time and effort? This is where AutoML frameworks come into the picture. This article will introduce you to the 6 most popular AutoML frameworks.
grave frost
AutoML is actually not good for beginners due to its high resource requirement
Not to mention using those tools can get you banned from competitions as well as showing that you are incapable of actually deploying an end-to-end model to a recruiter
lapis sequoia
hey,
I'm using matplolib for my program
I have no error but the graph is not displayed
import numpy as np
import matplotlib.pyplot as plt
x = np.linspace(0, 2, 10)
y = x **2
print(x)

plt.plot(x, y)```please
what is the command to open a help lounge please
hasty grail
try plt.show()
cloud thorn
Has anyone have any experience in the NLTK NaiveBayes classifier?
Ive managed to train my classifier, but struggling to classify new data, data without a label already attached.
 cold stump
Anyone here good with Elasticsearch?
I have a weighted TFIDF full text representation like this
([help, 0.34] :  23, 45, 72)
([meee, 0.21] : 3, 56)```Basically a list of words that stores the words TFIDF and each document that mentions it in order of increasing numerical value
I have already indexed the full documents to Elastic
How might I index this TFIDF representation into Elastic and how would I search using it?
 mossy sable
does anyone have experience with tensorflow?
i am trying to do something i think is simple. I just am a noob with ai
grave frost
you can post your question here
misty flint
grave frost
Not to mention using those tools can get you banned from competitions as well as...
automl also suffers from the same old adage
"garbage in, garbage out"
you cant just skip data preprocessing and cleaning
grave frost
actually, no. AUtoML does feauture extraction and some basic feature engineering
grave frost
you cant just skip data preprocessing
misty flint

misty flint
i have nothing to say except you should see real world data
grave frost
ofc - automl is not the solution to everything. if you are too lazy to clean your data, what can the lib do?
automl is just for finding the best pipeline and model - some things you have to do
lapis sequoia
Hi all. I have a dataset of millions of documents, each with a collection of symbols. I have a database of the document ids and their symbols, and I would like to create a network graph or something like a network graph so that I can browse these symbols.
For example, If I start with a set of symbols, I want to know what other symbols most often appear along with that set. I am asking for a big picture approach to this problem.
grave frost
are you...trying to decode something?
lapis sequoia
grave frost
are you...trying to decode something?
No, I am trying to discover what other symbols might commonly be cited along with my initial set
grave frost
thats confusing. can you clarify what exactly you want to accomplish
 candid sable
hello everyone! I bit off more than I can chew while choosing a machine-learning based project for my dissertation. I'd like to build a model to look for a specific line/edge and being that my dataset is really small (thank you covid, couldn't get good enough number of pics in needed quality), I gather that k-fold validation would be the best way.
now.. as for training.. should I manually label the area where my line/edge is?
any great edge detection based models which I could retrain or do learning transfer on?
lapis sequoia
Anyone here?
Apparently I need to make it so that I use the group by function in pandas to get values that are greater than a particular value from a dataframe
You guys have any ideas how that's done?
tacit basin
why groupby?
grave frost
candid sable
hello everyone! I bit off more than I can chew while choosing a machine-learning...
use canny filter from cv2 for preprocessing. As for edge detection, could you elaborate on what you exactly want to accomplish?
iron basalt
lapis sequoia
No, I am trying to discover what other symbols might commonly be cited along wit...
So basically a search engine?
arctic wedgeBOT
Hey @haughty ingot!
It looks like you tried to attach a Python file - please use a code-pasting service such as https://paste.pythondiscord.com
lapis sequoia
import collections
def my_mp3_playlist(file_path):
    new_data = ()
    with open(file_path,"r") as f:
        data = f.read().split(";")
        longest = data[2::3]
        longest = max(longest)
        new_data = new_data + (data[data.index(longest) - 2],)
    with open(file_path,"r") as f:
        data = f.read()
        if(data.count(";") % 3 == 0):
            new_data = new_data + (int(data.count(";") / 3),)
        else:
            new_data = new_data + ((int(data.count(";") // 3) + 1),)
    with open(file_path,"r") as f:
        data = f.read().split(";")
        new_data = data[1::3]
        print(collections.Counter(new_data))

my_mp3_playlist("songs-long.txt")
so new_data is
['Static and Ben El Tavori', 'The Black Eyed Peas', 'Unknown', 'Coldplay', 'The Black Eyed Peas']
i want to get the most occurs of a name
which is The Black Eyed Peas
soo you have an idea how?
hollow sentinel
lapis sequoia
```python
import collections
def my_mp3_playlist(file_path):
new_data = ()
...
you can check if Black Eyed Peas is in the list
and then set a totalOccurencesvalue = 0
and then increase it by 1 every time it's there
 thorn marlin
hi anyone here that could help me out with NLTK? I only found a video series from 2015 but is just assuming i know so many things and im currently lost
 austere swift
guys just imagine:
import numpy as pd
import pandas as tf
import tensorflow as np
what do you mean by that
misty flint
austere swift
guys just imagine:
```py
import numpy as pd
import pandas as tf
import tensorflo...

misty flint
thorn marlin
hi anyone here that could help me out with NLTK? I only found a video series fro...
their documentation is pretty good so start there
velvet thorn
austere swift
guys just imagine:
```py
import numpy as pd
import pandas as tf
import tensorflo...
🛑
velvet thorn
lapis sequoia
i want to get the most occurs of a name
!e
from collections import Counter

print(Counter([1, 5, 2, 2, 1, 1, 4, 3, 3, 2, 1]).most_common())
@velvet thorn :white_check_mark: Your eval job has completed with return code 0.
[(1, 4), (2, 3), (3, 2), (5, 1), (4, 1)]
I'm sure you know what to do with this
grave frost
@velvet thorn Any tips to debug if a model is not converging?
velvet thorn
grave frost
<@!171929073063297024> Any tips to debug if a model is not converging?
could be many reasons
grave frost
I have cancelled out almost every one I saw on the net
grave frost
yeah
velvet thorn
not learning past a certain point?
grave frost
both
austere swift
velvet thorn
🛑
tf.read_csv() 🤣
velvet thorn
not learning means loss is constant
grave frost
it doesn't even start reducing
grave frost
velvet thorn
not learning means loss is constant
exactly
velvet thorn
then it's not oscillating?
velvet thorn
velvet thorn
could be insufficiently complex
doubt it
if it's not even going down
wrong architecture for problem
I'm assuming
you're using default initialisers etc.
so probably not that
too much regularisation?
probably not, right
grave frost
I changed the kernel initializers 😦 set the factor for l2 like 0.00001
grave frost
tokenized text and categorical labels (all processed using TF functions). Transformers + Dense
transformers was borrowed from official keras doc, so I doubt a bug in that
grave frost
tried that too, all dense layers no embeddings
velvet thorn
try classical ML
velvet thorn
grave frost
tried that too, all dense layers no embeddings
!?
no, like, some basic RNN
grave frost
yeah, but it doesn't overfit also
on like 2 train samples that are duplicate
debugging models in keras is so hard
For some reason, I always manage to find undocumented bugs/problems. I am a magnet for them
velvet thorn
submit an issue/PR 🙂
grave frost
Yeah, I gave up and did that. probably expect a reply in the next decade or so
iron basalt
You can always try to implement it yourself.
grave frost
what, the model?
iron basalt
Yea if it's bugged
iron basalt
if you only need it to run on the cpu, yes, or maybe switch to pytorch
grave frost
nah, it need to be in GPU. and it would take me years to implement by hand
pytorch is too verbose
iron basalt
is it? idk seems p simple to me
grave frost
I don't have that much in-depth knowledge to place tensors on device, and customize training loops and whatnot
iron basalt
well that's why I said use pytorch, gpu version
grave frost
still, pytorch has more complex steps which increases the chance of bugs and errors
you can get near-SOTA just by fiddling around with some stuff. TF also allows a good amount of control, just not at that level in PyTorch
iron basalt
Well there is some trade-offs, pytorch may take a bit more work, but since it's more granular you can find bugs more easily. While TF would have the details hidden from you.
grave frost
yeah. but TF automates a lot of useless stuff 🤷
Pytorch is like - "you wanna make your input pipeline? here write 200 lines of code"
iron basalt
I mean 200 lines of code is really nothing.
grave frost
It takes a day in TF to train a model; in Pytorch it takes a day to plan the architecture alone
austere swift
pytorch is actually pretty simple
why not pytorch lightning
that gives a more "keras-like" interface for pytorch
grave frost
Hmm... looks pretty interesting. but if the same stuff can be done in TF, why do in Pytorch?
iron basalt
You mean why do in pytorch or why not?
grave frost
why do
iron basalt
Preference. And if TF is bugged. It also depends if you prefer pytorch's run stuff immediately vs TF's build a graph and then compute the graph later.
grave frost
What does this do? Rest of it looks familiar
super().init()
initialize - but what is super?
iron basalt
you mean super().__init__()?
lapis sequoia
i wanna make a data science project, but don't know where to start can someone help?
lapis sequoia
basically, i wanna see what the average amount letters in a word are, and plot them
iron basalt
super class -> sub class
super().__init__() is used to invoke the super constructor.
grave frost
but there is no mention of super anywhere in the code
grave frost
k
Did a little searching - there is nothing with transformers in pytorch?
like the layer block, not fine-tuning it
iron basalt

GitHub
A set of examples around pytorch in Vision, Text, Reinforcement Learning, etc. - pytorch/examples
        src = self.encoder(src) * math.sqrt(self.ninp)
        src = self.pos_encoder(src)
        output = self.transformer_encoder(src, self.src_mask)
        output = self.decoder(output)
        return F.log_softmax(output, dim=-1)
self.encoder = nn.Embedding(ntoken, ninp)
self.pos_encoder = PositionalEncoding(ninp, dropout)
self.transformer_encoder = TransformerEncoder(encoder_layers, nlayers)
self.decoder = nn.Linear(ninp, ntoken)
def init_weights(self):
        initrange = 0.1
        nn.init.uniform_(self.encoder.weight, -initrange, initrange)
        nn.init.zeros_(self.decoder.weight)
        nn.init.uniform_(self.decoder.weight, -initrange, initrange)
bro, you can also customize in TF
iron basalt
You asked for an example
iron basalt
how is that heavy? It's just creating some some parts.
Do you just want a complete model? They have some of those.
grave frost
hmm
iron basalt
GitHub
🤗Transformers: State-of-the-art Natural Language Processing for Pytorch and TensorFlow 2.0. - huggingface/transformers
does both actually
 dusky dagger
using matplotlib my x axis titles overlap when trying to visualize thousands of bars, is there a way to either fix them or remove them?
grave frost
iron basalt
https://github.com/huggingface/transformers
not this one - I meant Pytorch implemented but simple example (like below 120 lines of code)
 astral path
dusky dagger
using matplotlib my x axis titles overlap when trying to visualize thousands of ...
astral path
dusky dagger
using matplotlib my x axis titles overlap when trying to visualize thousands of ...
you can use ax.set_xticklabels(df.index, rotation=45, rotation_mode='anchor', ha='right') where df is your dataframe and ax is your plot
and also change the window size to be longer horizontally so they're less likely to overlap
or you could do plt.tick_params(axis = "x", which = "both", bottom = False, top = False)
dusky dagger
astral path
you can use `ax.set_xticklabels(df.index, rotation=45, rotation_mode='anchor', h...
is this really useful when having like 2000 bars?
iron basalt
grave frost
not this one - I meant Pytorch implemented but simple example (like below 120 li...
>>> transformer_model = nn.Transformer(nhead=16, num_encoder_layers=12)
>>> src = torch.rand((10, 32, 512))
>>> tgt = torch.rand((20, 32, 512))
>>> out = transformer_model(src, tgt)
😞 don't stress, just leave it. c ya later
astral path
dusky dagger
is this really useful when having like 2000 bars?
it sounds like you're trying to make a histogram rather than a barplot so if it's a continuous variable instead of categorical you can just use a scale like this

or you could bin together values
dusky dagger
im trying to visualize messages in a chat and how often they were used
which is kinda hard when there are thousands of them
iron basalt
grave frost
😞 don't stress, just leave it. c ya later
cya
astral path
so like exact strings?
 astral path
what are you trying to learn from the plot?
dusky dagger
how popular certain words/ messages are
astral path
like, are you just trying to find a distribution of message frequency?
or are you trying to find a certain # of messages that have a certain popularity?
astral path
i mean if you just want to visualize the distribution amounts then you'd just want to remove the labels
dusky dagger
 well then you wouldnt know what the certain word or message is
astral path
if you're interested in what particular messages have a high frequency, you could just plot, say, the top 1% of messages
dusky dagger
which destroys the whole purpose of even visualizing it
yeah that would probaly be a good idea, filtering out like 90% of the messages
maybe a cli visualization would be even better
astral path
if you really need to plot every message, you could use a library like plotly that allows you to hover over the graph and get more information
like you could hover over a bar and see what message it is
although with 2000 bars it would be hard to select specific ones
dusky dagger
yeah i wanted to implement a custom on hover function and then link that to the event when you hover over something but nah
yeah
astral path
i think you should make your question more specific, like what are the 100 most popular messages or the 1% more popular messages or smn
aight well i personally have a problem I'm trying to solve
I have a DataFrame hidden_gems which contains a track and artist column denoting a specific song. I have a function defined lookup_plays_per(artist, track) which makes an API request and returns a value avg_plays based on the artist and track values (strings). I'm trying to make a new column in hidden_gems called avg_plays using hidden_gems['avg_plays'] = lookup_plays_per(hidden_gems['artist'], hidden_gems['track']), however if you look at the avg_plays column which has been added, it's all None values. What should I do differently?

here is my function
def lastfm_get(payload):
    # define headers and URL
    headers = {'user-agent': username}
    url = 'http://ws.audioscrobbler.com/2.0/'

    # Add API key and format to the payload
    payload['api_key'] = key
    payload['format'] = 'json'

    response = requests.get(url, headers=headers, params=payload)
    return response

def lookup_plays_per(artist, track):
    response = lastfm_get({
        'method': 'track.getInfo',
        'artist':  artist,
        'track': track
    })

    # if there's an error, just return nothing
    if response.status_code != 200:
        return None
    listeners = response.json()['track']['listeners']
    playcount = response.json()['track']['playcount']

    # rate limiting
    if not getattr(response, 'from_cache', False):
        time.sleep(0.5)
    return int(playcount) / int(listeners)
and when I test it out with an example I know is in the dataset (display(lookup_plays_per('Radiohead', 'No Surprises'))), it returns the expected value 8.610100840571198
so I know it works
how should I be applying it to the dataframe?
 hollow gull
@dusky dagger the first argument he passed could be any subset of the bars, it doesn't just have to be the index. Using that method you have the ability to "completely"(?) customize which ticks will be displayed.
dusky dagger
? what are you refering to
hollow gull
sorry, I was a few messages behind. I was referring to "ax.set_xticklabels(df.index, rotation=45, rotation_mode='anchor', ha='right')"
 gusty pond
I am using sympy.solver to solve a linear equation for 'x'. It returns a fraction, how do I get it to print the decimal number? Does the answer change if I am solving quadratic equations?
misty flint
astral path
and when I test it out with an example I know is in the dataset (`display(lookup...
so the api works.
no interesting problem this time?
lol
but for your problem idk. i feel like id have to try it myself to debug it
it could just be the data for that artist isnt being returned for some reason
 sturdy frost
Is Pyspark faster than SQL or HiveQL for search and filtering data?
ripe forge
Quick googling shows me that pyspark should be faster than hive. As for traditional sql, on database that fits in memory sql probably beats both. The only caveat is, the moment data can't readily fit, traditional sql databases are out
Take these findings with a grain of salt. It's what the internet said.
sturdy frost
ripe forge
Quick googling shows me that pyspark should be faster than hive. As for traditio...
thanks was looking for info from someone that has used pyspark
velvet thorn
sturdy frost
Is Pyspark faster than SQL or HiveQL for search and filtering data?
how big is your data
sturdy frost
velvet thorn
how big is your data
peta
misty flint
velvet thorn
sturdy frost
peta
depends on what you wanna do then
you should perform your own profiling
for any sort of complex data manipulation
Spark will likely be faster
 blazing lodge
How do I use tesseract on Colab?

 onyx drum
Is there a way to save Jupyter notebook sessions (including all the variables) into a file that I can then "load" without having to run all the cells/simulations again?
 dry harness
anyone know what this type of graph is called?
https://gyazo.com/b95423120a35dc1685bd66a1d2185ca1
 velvet thorn
dry harness
anyone know what this type of graph is called?
https://gyazo.com/b95423120a35dc1...
velvet thorn
dry harness
anyone know what this type of graph is called?
https://gyazo.com/b95423120a35dc1...
extremely complicated
🥴
dry harness

 still otter
dry harness
anyone know what this type of graph is called?
https://gyazo.com/b95423120a35dc1...
still otter
dry harness
anyone know what this type of graph is called?
https://gyazo.com/b95423120a35dc1...
I guess it's a style of treemap?
 lucid raven
volyball?
 proper tendon
I doubt I'm asking in the right channel, but is there a way to make sure 2 python scripts dont edit the same json at the same time?
there is a json that is being readed by one and edited by another script, and another that is being edited alot by one and once/minute by an other
so i would like to know how to make sure the 2nd JSON does not get edited by both at the same time

 tall trail
hey! so im inporting csv files from a datalake, and all of a sudden it has this weird extra 'index' column
anyoen know where this comes from?
adls.get(data_path , f'data/data.csv')
                temp_df = pd.read_csv(f'data/data.csv' , delimiter=';')
                if not temp_df.empty:
                    if len(df.index) == 0:
                        df = temp_df
                    else:
                        frames = [df, temp_df]
                        df = pd.concat(frames, ignore_index=True)
                del temp_df
 chilly geyser
Has there been anyone who has tried the same task? If your method is very much underperforming compared to State-of-the-Art (which you should find out is what exactly) there should be ways you can show this.
Even if it is a data limitation, have you tried to curate the data yourself such that your accuracy improves?
Essentially what I think is your task under a classification perspective is a binary classification problem. Under NLP sentiment analysis tasks with large datasets, accuracy is very high (I think >90% out of sample accuracy), but that could be a totally different world from what you have
If you think your accuracy is too low - the biggest issue I see is that it becomes unpublishable, since non-success stories in science are not well appreciated, but I think you should be able to make a point that "I tried this, this, this, and this, ..." with reference to latest data science methods. If your methods are all reasonable, I don't think you can be faulted exactly, but given the need to graduate/publish, you might even need to rescope or rethink your approach. For these things I would defer to your advisor.
And yes, data science is not a panacea. Data is data, and it is expected that you can get bad data. Problems come when good data goes in but bad results come out. If bad data goes in, then you can blame data, but you should be able to show it is bad data in the first place
chilly geyser
proper tendon
I doubt I'm asking in the right channel, but is there a way to make sure 2 pytho...
Prevention of race conditions and the like it sounds like, maybe #async-and-concurrency? Even if I'm wrong I have higher confidence #async-and-concurrency can lead you to a better source to refer to
I'm not sure what you mean by hard-cut-on-every-feature approach
You mean like, a decision tree?
If you're saying a decision tree beats a neural network, then so be it. Simple methods beating complex methods is not a bad thing
I'd also assume you are not a data scientist, it's not exactly your business to develop neural network methods which beat simple methods
Yup, that's a decision tree
It's a manually(?) curated decision tree
You can try some automated decision tree methods, random forests. If those also lose then maybe automated/data-sciency methods are not able to beat expert-knowledge-in-the-field, which is also to be expected
I'll just tell you simply nobody knows how NNs really work. It's simpler to just 'try everything'
Don't work on the NN if it's not fruitful. Try some highly-automated decision trees, like CART or something
Run CART with defaults, run random forest with defaults (assuming it terminates at all)
You can easily get validation accuracies and compare, if all those are worse you have good confidence in saying that a manually curated decision tree is better than more black-boxy datascience methods now
Hmm that's a complicated question
If your methods were more simple like SVMs, you could show that it is impossible to classify datapoints with halfplanes for example (non-linearly separable)
I'm not really into talking, sorry
proper tendon
chilly geyser
Prevention of race conditions and the like it sounds like, maybe <#6305048815427...
okay, ty
chilly geyser
This is an example of a really difficult binary classification problem

Also I don't know what's MVA
oh
"how much data" seems like a comparison of how many your sample points are and how high dimension space your data is
I can't comment on magic numbers sadly hmm
^going back to the difficult problem, the 'solution' is to find different dimensions which can separate the blue and red crosses, but finding that magic dimension could be impossible, or it might not exist
6k isn't terrible sample size though
But yeah I think NLP sentiment analysis can go >50k data points (sentences)
What's your data exactly though
It's all vectors of real numbers right
You can visualize your manual cuts
Manual cuts which are simple rules "are just" chopping the data up
Something like this is what you're doing
(image via https://jakevdp.github.io/PythonDataScienceHandbook/05.08-random-forests.html)

Except that in a more typical case, people use algorithms to just generate the rules/regions
Sounds like AUC curve?
I mean everyone can wish for AUCs that have area 1 but
As I said, I think as long you show you tried you shouldn't be faulted for it
Yeah I think you have put in actual work
So
I think you should be a little confident of it
Could be the latter honestly. I think it's a good thing that neural nets are not magical
chilly geyser
You could try that, but I can't imagine there being a 'rule'
It's more empirical than any theory I think
As for 'how' to do it, perhaps you randomly subset your data into partitions, then you use more and more partitions
e.g. 10 partitions, first round use only 1, second round use 2, ... till 10 rounds
So you get a 10%, 20%, 30% of data used and corresponding accuracy
lapis sequoia
can someone help me please? I totally don't know what to do.
 lapis sequoia
I watched a lot YouTube video tutorials, but still I don't understand what to do.
hollow sentinel
you’re using VSC for data sci?
I prefer Jupyter notebook the visualizations are just better to look at
 odd lion
lapis sequoia
I watched a lot YouTube video tutorials, but still I don't understand what to do...
odd lion
lapis sequoia
I watched a lot YouTube video tutorials, but still I don't understand what to do...
Pretty sure a question like that wants you to copy/paste the code above and change the variables
lapis sequoia
I solved it
thanks to another student
aka "ctrl+c/v" and your code is now our code. #comunism
odd lion
I mean... that works, but did you learn then?
hollow sentinel
you should take a random data set from Kaggle and use Pandas on it
it'll teach you how to use it

YouTube
Are you trying to learn data science so that you can get your first data science job? You're probably confused about what you're "supposed" to learn, and then you have the hardest time actually finding lessons you can understand!
Data School focuses you on the topics you need to master first, and offers in-depth tutorials that you can understan...
this is who I like for Pandas
grave frost
 hard canopy
wow 🤣
misty flint
odd lion
I mean... that works, but did you learn then?
literally THIS
and then on the next assignment its only going to be that much harder
trust me
misty flint
this one is pretty decent too
Solve short hands-on challenges to perfect your data manipulation skills.
astral path
hey y'all i got a kind of interesting problem this time
I'm trying to plot the array size vs. runtime for mergesort which should be fit to an N*LogN curve, but I can't figure out how to plot it in matplotlib
i've used this code from stack overflow
from matplotlib import pyplot as plt

x=df['sizes']
y=np.log(df['times'])

coefficients = np.polyfit(np.log(x),y,1)
fit = np.poly1d(coefficients)

plt.plot(x,y,"o",label="data")
plt.plot(x,fit(np.log(x)),"--", label="fit")
plt.legend()
plt.show()
but it looks completely wrong

any ideas?
it should not be an enclosed shape
 merry fern
How can I iterate through dataframe rows to find the # of occurrences of each value in 1 column of a dataframe?
I'd like to look at each item in the actors_list e.g. "Tim Robbins" and count the # of rows that appears, the # of genres their in, etc...
 misty flint
astral path
i've used this code from stack overflow
```python
from matplotlib import pyplot ...
misty flint
astral path
i've used this code from stack overflow
```python
from matplotlib import pyplot ...
that is an interesting problem. what do you mean by enclosed shape?
astral path
I mean like if you look at the orange dashed line, there's a logarithmic curve and a straight line which meet at their ends
what I want is a curve with shape N * logN
 astral path
no NLogN
misty flint
astral path
it's an algorithm which does repeated halving (logN) and at each recursive call takes N time, so it's NLogN
should look like this
 misty flint
ohhhh
oh wait i also see the same stackoverflow answer as you
Stack Overflow
Below is an excerpt of my code that plots and creates a trend line based of the order that is given to the numpy.polyfit library. I'm able to plot linear, quadratic, and many other polynomial trends.
astral path
yeah that's the one
astral path
huh, I'm working with specific data tho
sizes = pd.Series([10000,12000,14000,16000,18000,20000,22000,24000,26000,28000,30000,32000,34000,36000,38000,40000,42000,44000,46000,48000,50000,52000,54000,56000,58000,60000,62000,64000,66000,68000,70000,72000,74000,76000,78000,80000,82000,84000,86000,88000,90000,92000,94000,96000,98000,10000]).astype(float)

times = pd.Series([5125859,6492930,8270944,10803248,12746120,15683541,23940920,18669468,16690614,21205870,19375574,33276943,31503634,33824279,31546036,30966680,33066456,36669142,42781165,47406711,38457224,44712014,44463616,45940564,45293809,51865449,56881066,50505464,41785982,39784816,40716154,41771047,43764800,44486714,45546531,46736429,48112744,49366831,51980438,66368931,56614911,54930097,55183534,57303029,58451822,60375879]).astype(float)

df = pd.concat([sizes, times], axis=1)

df.columns = ['sizes', 'times']
whoops, should by astype(int), but that doesnt change it

 twilit pilot
I am trying to build a chatbot for my project, but i can only make my chatbot handle messages related to my project. If someone asks my chatbot a random unrelated question, it will not know the answer. That's why does anyone know a chatbot api that can give answers to random questions?
 astral path
Bizarre
grave frost
twilit pilot
I am trying to build a chatbot for my project, but i can only make my chatbot ha...
ask this again in a few decades
astral path
lol
twilit pilot
lmao
 whole mural
Anyone here
I am trying to plot two columns from a dataframe on a chart, anyone has any idea ?
misty flint
import matplotlib.pyplot as plt

%matplotlib inline
plt.plot(df['column_1'], df['column_2'], 'o')
plt.show()
 brisk moth
can someone help me with my homework lol its a group project and its due tmrw
 shut slate
Hi guys
 lethal geode
what's the homework
brisk moth
implementing linear regression
shut slate
When I groupby size in Pandas, how can I make it in descending order?
brisk moth
i need to fill in the blanks of some skeleton code and i have no idea what goes in
shut slate
df1.groupby(['Bike_Colour']).size()
So i type this but its not sorted, how would I sort it by descending order?
lethal geode
ascending = False or ascending = True
lethal geode
df1.groupby(['Bike_Colour'], ascending = True).size()
okay eden send it to me i'll take a look
@brisk moth
brisk moth
okay
shut slate
TypeError: groupby() got an unexpected keyword argument 'ascending'
😦
i tried before but it just diesnt work lol
lethal geode
you can try df1.groupby(['Bike_Colour'], ascending = True).size().sort_values()
or try sort = False
df1.groupby(['Bike_Colour']).size().sort_values()
sorry take out the ascending that's not right
lethal geode
false or true
shut slate
Where would you place that, I am sorr I am just starting out with Python
shut slate
Ok thank you. I just put true in brackets without the ascending
It akes sense now
Thank you @lethal geode
 lavish swift
merry fern
How can I iterate through dataframe rows to find the # of occurrences of each va...
lavish swift
merry fern
How can I iterate through dataframe rows to find the # of occurrences of each va...
What dtype is the actors_list ? object? if so, you might be able to simply do a str.contains on it
shut slate
Then one more question. How can make a bar graph to ilustrate the size, also in ascending order?
 civic flax
i think you can use the library matplotlib
shut slate
I understand that but lol
shut slate
How can groupby.mean one column only?
 tidal bough
Take that column and do groupby on it, maybe?
shut slate
df1.groupby(['Bike_Colour']).mean("Cost_of_Bike")
Like when I do this
I still get this:https://gyazo.com/e8cb6b1bbd2ee1997cb4d8945e6cd115

But I only want to see cost of bike
tidal bough
df1[['Bike_Colour',"Cost_of_Bike"]].groupby(['Bike_Colour']).mean("Cost_of_Bike")
like this, perhaps
shut slate
Yes thank you
But I dont fully understand how this works
sec lemmme think
Why do you need the two names at the beginning?
whole mural
misty flint
```py
import matplotlib.pyplot as plt
%matplotlib inline
plt.plot(df['column_1'...
I am trying to plot something like this

I called plot on this dataframe itself and was able to get it to work , can't figure out how to get rid of the margins
 lavish swift
have you tried .sort_values() ?
shut slate
Nope
 mellow sun
Hi, i am running different methods on credit card defaults for a class: Random Forest Classifier, Gradient Boost, Logistic Regression, and RNN. The first two seem to work fine but last two seem way off and i can't figure out why
shut slate
How would it look fully>
mellow sun
here are the matrices for the two

 lavish swift
it works on both a series and dataframe so you should be able to add it to the end of your last entry
 lavish swift
lower case "a" on ascending
 whole mural
misty flint
idk what you mean by margins
whole mural
misty flint
idk what you mean by margins
like the area around y-axis
whole mural
misty flint
also idk the ide youre using. maybe its that
vscode
could you ping me when you reply, so I get a pop up
shut slate
df1_t['Cost_of_Bike'].sort_values(ascending = False)
 exotic creek
hey guys. anybody knows how exactly the formula for q-value in q-learning works? i dont get why this works. how will it get tuned only by stacking discounted max future q even when reward is sparse?
new_q = (1 - LEARNING_RATE) * current_q + LEARNING_RATE * (reward + DISCOUNT * max_future_q)
lavish swift
it must still be a dataframe, but doesn't appear to have a column name for the mean, try getting a list of column names to see if any show up? df1_t.columns
 lavish swift
is that bottom df after you've gotten your mean values?
shut slate
yeah mean values of the sorted colour
I hope
lol
But I want it to show from the highest mean to the lowest
lavish swift
ha! so on that dataframe is where you should be able to run the sort_values. It looks different now from the screenshot above though, so I'm not sure what's changed. It now looks like an actual dataframe, where as before it looked more like a series.
with a dataframe sort_values you need to tell it which column, which is why it complained about not have a "by"
lavish swift
ah...so you need to do one of 2 things then
- Write it to a new DF - I usually do this first to make sure I'm getting what I want
If I'm sure it's working, then I may do an "inplace" transformation
so inside your .sort_values(ascending=False, inplace=True)
 lavish swift
can you paste the line of code that just failed
not the error, just your line of code
shut slate
df1_t['Cost_of_Bike'].sort_values(ascending = False)
oops
sec
lol
df1_t['Cost_of_Bike'].sort_values(ascending = False, inplace = True)
lavish swift
df1_t.sort_values(by=['Cost_of_Bike'], ascending = False, inplace = True)
see if that works
shut slate
When I put false inplace it works,,,
Yours worked
But what is different?
by


Now to make a bar graph
lol
I will probably comeback
But thanks man
lavish swift
excellent question. So... when you tried to do this:
df1_t['Cost_of_Bike'].sort_values(ascending = False, inplace = True)
df1_t is your dataframe, and by asking for just ['Cost_of_Bike'] you were actually creating a temporary/cached series from the dataframe, which is why that last error said it was just "view" of another array. And you can't do an inplace change to something that is just a view
shut slate
Oooooooh
lavish swift
In contrast, my line was working on the dataframe object as a full dataframe and I simply told the sort_values what to sort BY 🙂
lavish swift
awesome! that's the most important part!!
lavish swift
ha! That's how I always feel
shut slate
Quick question
So I disected some data and removed some columns etc
How can I now download the new csv from Jupyter notebook?
lavish swift
you mean create a csv from your dataframe?
shut slate
yeah sure. To my computer
import base64
import pandas as pd
from IPython.display import HTML
def create_download_link( df, title = "Download CSV file", filename = "data.csv"):
csv = df.to_csv()
b64 = base64.b64encode(csv.encode())
payload = b64.decode()
html = '<a download="{filename}" href="data:text/csv;base64,{payload}" target="_blank">{title}</a>'
html = html.format(payload=payload,title=title,filename=filename)
return HTML(html)
df = pd.DataFrame(data = [[1,2],[3,4]], columns=['Col 1', 'Col 2'])
create_download_link(df)
This seems to work but they create their own here
I want the one I just created