#data-science-and-ml
1 messages · Page 289 of 1
 exotic maple
btw @grave frost I'm assuming I can link google colab with my github, right? to sync the notebooks i mean
nvm i found it
 stray roost
I downloaded a bunch of long json files for my chatbot but every website I check uses a simple json intents file so I don't know how to implement my json file to a chatbot
 grave frost
stray roost
I downloaded a bunch of long json files for my chatbot but every website I check...
grave frost
stray roost
I downloaded a bunch of long json files for my chatbot but every website I check...
just follow some tutorial; it would give you a great idea
exotic maple
well, i'm trying when it would be optimal to use either algorithm @velvet thorn
 velvet thorn
exotic maple
well, i'm trying when it would be optimal to use either algorithm <@!17192907306...
velvet thorn
exotic maple
well, i'm trying when it would be optimal to use either algorithm <@!17192907306...
in a practical scenario?
not that much difference
SVMs tend to shine with nonlinear kernels
however
in cases where confidence score is important
vs just the prediction
then of course LR would be preferable
exotic maple
from what i understood so far (with a headache) is that in general SVM (non linear)m projects in different dimensions in ordfer to create the boundaary
where as LR is just linear
velvet thorn
LR also has higher interpretability
exotic maple
so if my data is CERTAIN to be linearly related I can use either, but if not, SVM?
velvet thorn
which again, can matter (e.g. for regulatory reasons)
exotic maple
yeah i liked LR interpretability as a subject of probabilities
of p(x) or p(!x) while SVM's conversation to +1 or -1 didnt completely get into my head lol
conversion*
velvet thorn
why do you say it is a "conversion"?
exotic maple
well, i said conversation but its just how the algorithm parametizes the result no? if the predict > 0 then sets to 1 / TRUE for a class
or -1 for the other class / rejection
god dammit, conversion* lol
velvet thorn
uh
velvet thorn
exotic maple
well, i said conversation but its just how the algorithm parametizes the result ...
what is "the predict"
exotic maple
man trying to read into the math of SVM fried my brain... it has been 7 years since calculus ugh
eh, nvm me im probably babbling
regardless is this interpretion ok?
velvet thorn
kind...of?
exotic maple
if the relationship can be assumed (or easily transformed) into linear -> either is ok
though logistic is easier to read
for non linear, SVM?
exotic maple
fixed as in?
velvet thorn
you can add features that will result in a linear relationship between X and y
exotic maple
oh you mean polynomial features?
grave frost
QQ - What is the Feature engineering you guys do when fine-tuning models in NLP (besides the basic text ones)?
velvet thorn
exotic maple
oh you mean polynomial features?
not necessarily polynomial
just nonlinear
exotic maple
@velvet thorn if i may ask, are you currently working as a DS?
 astral path
I have a dataframe with 386 million entries in it, and peforming the pandas function rank() on it makes google colab run out of RAM and crash. Is there a way to fix it
velvet thorn
exotic maple
<@!171929073063297024> if i may ask, are you currently working as a DS?
nope! software engineer
exotic maple
astral path
I have a dataframe with 386 million entries in it, and peforming the pandas func...
You can try purchasing cloud power lol 386million rows is no game
velvet thorn
I’m @ a consultancy (ThoughtWorks, if you’ve heard of it)
velvet thorn
astral path
I have a dataframe with 386 million entries in it, and peforming the pandas func...
you can try memmapping
or Spark, too
exotic maple
velvet thorn
I’m @ a consultancy (ThoughtWorks, if you’ve heard of it)
oh dang. that sounds really cool.
velvet thorn
exotic maple
oh dang. that sounds really cool.
heh well
it’s just to learn new stuff
my game plan involves my startup
exotic maple
I never programmed or anything before. I'm industrial engineer from career. Thought myself python and now learning machine learning
exotic maple
which im probably mediocre at boht compared to an actual practitioner lol
exotic maple
thanks 🙂
thankfully I have friend who is a CS master and he really judges my code and stuff mercilessly lol
whoa you went from law to software engineering
that's quite the shift
 stuck kiln
If you have a dictionary like how python has it, where there’s one array for the hashes and another for insertion order, is it possible to have an indexable dictionary with the only trade off being deletion is O(n)?
Or is that not right?
And also wouldn’t looking up a value always be O(1) if you were looking it up by index instead of by key?
There’s this: https://github.com/niklasf/indexed.py
But looking up values by index is potentially O(n), and looking up a key’s index is O(n), because it achieves it by just having a list of keys

GitHub
A Python dictionary that is indexed by insertion order - niklasf/indexed.py
exotic maple
dictionaries in python are not indexed as they are mapped by hashes
as far as i remember
that is
you can't iterate through a dictionary or slice a dict
stuck kiln
What I mean is that wouldn’t it be possible to set something like that up?
exotic maple
oh im sorry you're asking if its possible?
uh
you mean like a named tuple or something?
i think an indexed dictionary would lose its purpose though
but if you're looking by index why not just use a set or a list?
if index is a must
stuck kiln
Idk how often something like this would be useful
But I’m wondering if it’s possible to do it, or if I’m just overlooking something
exotic maple
inteestingly it seems like from version 3,7 of pythno something might be doable
because
dict.pop removes the LAST ADDED ELEMENT, which means its being recorded somewhere in memory
stuck kiln
Maybe you were in a position where you have a leaderboard, and you wanted to be able to look up someone by name, but also be able to look up who’s in the nth place
Or something like that
stuck kiln
exotic maple
dict.pop removes the LAST ADDED ELEMENT, which means its being recorded somewher...
Yeah they’re insertion ordered in 3.7
They use one array which you hash into, and then it directs to another array which is populated index by index
exotic maple
interesting. on principle it sounds possible.
how though i have no clue., i havent even thought of that before lol
stuck kiln
I’ve been thinking of it, but I’m wondering if I’m overlooking some big thing, or if it actually is possible
velvet thorn
stuck kiln
Maybe you were in a position where you have a leaderboard, and you wanted to be ...
that would be an ordered dictionary?
like inherently maintaining order
sorted dictionary would be the more appropriate term
also maybe #algos-and-data-structs
velvet thorn
stuck kiln
But you couldn’t look up positions in the middle
why not
stuck kiln
You couldn’t do it in O(1) time by the index
 iron basalt
exotic maple
you can't iterate through a dictionary or slice a dict
iron basalt
exotic maple
you can't iterate through a dictionary or slice a dict
You can iterate over a dict's keys with a for ... in ... loop.
exotic maple
@iron basalt yes but that's just for the keys or values or via tuple unpacking. He mentioned direct slicing
like
Dict[0] for position 1
velvet thorn
like pandas .loc?
iron basalt
So your goal is to have a list that you can slice, but also by able to index via say names (strings) in O(1)?
velvet thorn
like 'from':'to'
iron basalt
@exotic maple
exotic maple
@iron basalt I'm not the OP, but i think that was his idea yes
pretty much like a pandas df
that you can use
.loc for index value or .iloc for index position
iron basalt
So you want to be able to do something like students[10:15] and also students["Bob"]?
exotic maple
index = key
iron basalt
Yeah so pandas can do that, but if you want to know how to implement this it can be done by taking a page out of the database design book.
The data structure is simply a regular hash map and a list.
The list contains the values and can be sliced like normal. While the hashmap maps strings to indices (for the list).
You then put both the hashmap (dict) and array (list) in the same class and override the dunderscore operators __getitem__ and __setitem__.
so you can do [10:15] or ["Bob"]
exotic maple
you'd need to create a custom class for that no?
iron basalt
yes
exotic maple
well, if he really needs it, good luck haha
though on principle it should be easy
inheriting from both dictionary and list class perhaps
iron basalt
Pandas dataframe is basically that but much more complicated / can do more stuff
stuck kiln
An insertion ordered dictionary where you can look up a key and it’s value in guaranteed O(1) time through indexing, but with the trade off of O(n) deletion time
exotic maple
aren't those 2 conditions contradicting?
because if you can find in o1, you should be able to delete in o1
stuck kiln
By using what python does, where one array is hashed into, and then it holds index positions of another array which is populated index by index
exotic maple
oh wait. not really. if its indexed, deleting would probably imply re-indexing the whole thing
iron basalt
In the structure I gave you would need to subtract 1 from all the indices of the elements that got moved back
so it's O(n)
stuck kiln
Yeah so that you don’t index into a space that’s now empty
exotic maple
yeah that was my correctiong from here
oh wait. not really. if its indexed, deleting would probably imply re-indexing the whole thing
stuck kiln
Yeah
exotic maple
yeah @iron basalt 's approach sounds like what you want
back to the topic of data science
iron basalt
The method I gave is very much like normalization in a database.
exotic maple
Does anyone if it's possible to train an estimator with a cross validation in scikitlearn?
stuck kiln
It seems similar to how python does it
iron basalt
In which you use two arrays rather than 1
exotic maple
i've only been able to do it to get scores
but not to train the estimator via the cross-validation folding
stuck kiln
Ok, thanks squiggle and the warden
 fresh abyss
what sort of stuff does being a data scientist entail
 hollow sentinel
@fresh abyss you spend a lot of time cleaning data
it’s mostly just cleaning data
 late schooner
numpy - library for Data Science?
hollow sentinel
@late schooner correct
exotic maple
@late schooner in general numpy is a library for numerical processing. its just used a loooooot in DS

 hoary wigeon
I want to install anaconda
Python 3.8
64-Bit (x86) Installer (529 MB)
64-Bit (Power8 and Power9) Installer (279 MB)
what i power 8,9 ?
which one i must use ?
grave frost
velvet thorn
my game plan involves my startup
is it still in the ideation phase, or has it been established?
 lapis sequoia
Why are float64 and int64 prefered for training sets
velvet thorn
grave frost
is it still in the ideation phase, or has it been established?
well
working on the product now
so somewhere in the middle?
velvet thorn
lapis sequoia
Why are float64 and int64 prefered for training sets
as opposed to?
and why do you say that?
lapis sequoia
velvet thorn
and why do you say that?
Every tutorial I've gone through makes a point to switch the values in the training numpy arrays to float64s or int64s
But they never explain why
velvet thorn
lapis sequoia
Every tutorial I've gone through makes a point to switch the values in the train...
show example
because that's not in general true
in particular, newer GPUs support half-precision training (float16)
because it's faster
lapis sequoia

In this video we walk through the process of training a convolutional neural net to classify images of rock, paper, & scissors. We do this using the Tensorflow & Keras libraries. This is a follow-up to the first video I posted on neural networks.
Introduction to Neural Nets: https://youtu.be/aBIGJeHRZLQ
Link to my code (github): https://github...
I've seen it in a couple of other examples too
velvet thorn
there is no need, in general, to widen the datatype
lapis sequoia
Alright
 untold cove
Hi all, I have the following code https://bpa.st/CXG5C each username is in a class, im wanting the class to be selected in the dropdown and when a class is selected, that will list the username and the score values in the bar graph. Both csv's have the username, 1 csv has the classes, the other the score. managed to seperate them out and create a dict per user but that was with csv dictReader and I didnt think pandas was going to be that much different but it is :/
grave frost
velvet thorn
so somewhere in the middle?
cool. update us when its launched 😁 👍
Anyone here ever tried to train a large model on a specific language corpus and trying it to further fine-tune the pre-trained model for a specific task? How hard is it to do that?
 tall basin

One of the biggest 🐍Python tricks by far I can give you, It's use the .get() instead of the dictionary Key, wanna know more? Let's go!
👇🧵
#100DaysOfCode #30DaysOfCode #301DaysOfCode #CodeNewbies #CodeNewbie #Python #Python3 #AI #MachineLearning #DataScience #code #tech
 Twitter
·
Twitter
·
 daring crag
Hello there, i hope you all are good.
Which math should I now before getting into data science and machine learning?
hollow sentinel
daring crag
Hello there, i hope you all are good.
Which math should I now before getting int...
the most important ones are statistics, linear algebra, calculus, and discrete maths
i include probability in statistics
the math will give you a solid foundation for you to code on
don't do what i did and just jump headfirst into ML without the math
it's not a fun time
daring crag
hollow sentinel
don't do what i did and just jump headfirst into ML without the math
Thats what some friends are telling me so i will take care of getting first the math foundations.
Thanks for the answer btw.
Is here someone who has a github where i can look at their Data Science finance/Economy projects? Just for curiosity....
hollow sentinel
daring crag
Is here someone who has a github where i can look at their Data Science finance/...

GitHub
Portfolio of investment and finance-related data science projects - quinamatics/Financial-Data-Analytics
just some google searching
daring crag
great, thanks you!
 young dock
does someone know how to convert ndjson into a pandas dataframe? or into csv (because csv can import easily into a dataframe)
I tried online converters such as https://www.privatedaddy.com/ndjson_to_csv but the file is too big.
Convert Newline-delimited JSON (NDJSON) to CSV: Convert a Newline delimited JSON file (NDJSON) to comma-separated CSV format. Free online tool.
lapis sequoia
What do the filters actually describe during a sequential layer?
young dock
ah nvm I figured it out 🙂
records = map(ujson.loads, open('file.ndjson',encoding='utf-8'))
df = pd.DataFrame.from_records(records)
young dock
this may be a stats patzer question, but is .5 r-squared good?
 mellow vapor
Which kind of models give the final answer of prediction as a binary result of 0 or 1?
 solar bluff
young dock
ah nvm I figured it out 🙂
`records = map(ujson.loads, open('file.ndjson',encod...
solar bluff
young dock
ah nvm I figured it out 🙂
`records = map(ujson.loads, open('file.ndjson',encod...
DataFrame.from_records() is also good for 1 dimensional numpy structured arrays
mellow vapor
I know about logistic regression,are there any other as well?
grave frost
hoary wigeon
I want to install anaconda
Python 3.8
64-Bit (x86) Installer (529 MB)
64-Bit (P...
just use the fattest one
Anyone here ever tried to train models on a corpus then further pre-train it?
iron basalt
mellow vapor
I know about logistic regression,are there any other as well?
Any binary classifier.
 misty flint
best nlp libraries? looking to do something with contract analysis
 crisp gazelle
i am trying to fit a Neural net to a sine wave.....
my neural network is displaying the same value for every input
can anyone check my code and tell me what im doing wrong?
https://colab.research.google.com/drive/1qBUWFkOoXz-B9lO4g3W8vVTLLW1qTtu0?usp=sharing
 grave frost
misty flint
best nlp libraries? looking to do something with contract analysis
grave frost
misty flint
best nlp libraries? looking to do something with contract analysis
NLTK + Huggingface
exotic maple
@iron basalt Aren't all classifiers binary in nature? multi-classification just branches everything automatically
 solemn oracle
Anyone know how to do datestrength on a pandas dataset with a Datetime column
grave frost
exotic maple
<@!119925597395877889> Aren't all classifiers binary in nature? multi-classifica...
depends on the classifier
not true with Neural networks tho
solemn oracle
I used to do it in google sheets to make sure that time wasn’t more correlated than some other factor
exotic maple
decision trees is binary at every level
solemn oracle
but I can’t find a function that does that similar function for pandas
exotic maple
LR is binary as a probability
grave frost
exotic maple
decision trees is binary at every level
yeah, thas why I said it depends
on NN it doesnt work that way
exotic maple
oh i dont know NN yet :v
grave frost
the neurons activation determines that
grave frost
exotic maple
oh i dont know NN yet :v
thats alright 🙂
exotic maple
@grave frost btw
question for someone a bit more experienced
having so many classification algorithms, for example, how do you pick what's best? Aside from let's say an obvious "test them all and pick whats best"
grave frost
NN
Neural Networks can be scaled up much more efficiently thus finding complex patterns that traditional algos may not be able to find
exotic maple
So you'd throw NN at everything? :p
grave frost
yup
no point in messing about other algos - unless I am on a really tight resource management
like doing stuff on pentium with 2gb RAM
iron basalt
@exotic maple The binary in binary classifier refers the number of output classes, not what it does internally. Example: random.randint(1) is a binary classifier (a very bad one (50% accuracy)). There is no internal mechanics at all.
iron basalt
exotic maple
having so many classification algorithms, for example, how do you pick what's be...
There is only testing, you can use the fact that the classifier has been tested on other stuff before and you know what type of data it's good at classifying in general and which not.
The only things mathematics can prove is very general stuff like "does it converge at all given infinite samples?".
Other than that you have a general intuition of why the classifier works on some types of data and not others (which is probably correct but either way too hard to prove or not worth proving).
exotic maple
oh so in summary, try them all and intuitively learn what works best for your data and problem?
iron basalt
yes, but also many of them are built on each other so you can see the history of how they got their classifier, they basically took an existing one (or built an entirely new one just on vague ideas from a bunch of other methods), looked at which data it's bad at, made a hypothesis as to why, and then came up with a solution (and tested it).
Typically the improvements come from more general ideas, like the bias-variance trade-off, curse of dimensionality, stability-plasticity problem, topology preserving, etc.
 opal solar
what is the stability-plasticity problem?
exotic maple
@iron basalt Thanks a lot man. You've given me lots of topics to research lol
I wonder where is a good place where a newbie/learner like me can go and try working on stuff and possibly connect with mentors :v there's a lot of intuition that you miss through self-learning
iron basalt
@opal solar How does the brain obtain new knowledge without disrupting existing knowledge? If you don't solve this problem your model will suffer from catastrophic interference (https://en.wikipedia.org/wiki/Catastrophic_interference).
opal solar
I think I sat through a lecture on this once, but in the context of treatments for epilepsy
iron basalt
Deep Learning suffers from catastrophic interference. This hack used to solve this is usually a very low learning rate and have a resampling buffer.
opal solar
I get what it is
iron basalt
It's why DL struggles with real-time tasks.
exotic maple
@iron basalt My brain must work with a DL algorithm because everytime i learn something i forget something else :v
iron basalt
@exotic maple haha
@opal solar The current best and most probable (in terms of the real brain using it to solve this problem) is sparsity. DL uses dense models (hence the term Dense in Keras).
opal solar
isn't this really an issue with model transferability?
iron basalt
The problem with dense models is that everything is connected meaning that one change to one thing will propagate and interfere with everything else.
opal solar
*of
iron basalt
So the solution typically is the make changes very small (low learning rate)
But it's not a full fix to the problem.
opal solar
yes, I get that, but the process of model learning is really a process of sequential model generation, where each successive model is tested against some reference. If the model is not transferable, then it will change too much, ergo cost function does not converge
iron basalt
@grave frost You are thinking of convolutions
grave frost
iron basalt
<@!738058085083381760> You are thinking of convolutions
nope
iron basalt
drop-out?
grave frost
There are many different type of cells and specialized layers and regulatory ones that are used in DL models
opal solar
What I am thinking is that plasticity ought to require some sort of compartmentalization within the overall mathematical construct representing the model
grave frost
Saying only dense is used in DL is like saying that every animal uses wings to fly
grave frost
there is a kinda an idea to what it is attributed to
iron basalt
The deep in deep learning does not refer to using many layers. The term was first coined just to sound pretentious (their words, not mine).
grave frost
iron basalt
The deep in deep learning does not refer to using many layers. The term was firs...
agreed - but not just dense layers
opal solar
aka backpropaganda @iron basalt
grave frost
if you are gonna say BERT Is made up of Dense layers...
you are gonna be pretty wrong
iron basalt
@opal solar Yes, I consider backprop = DL more or less.
exotic maple
@opal solar Backpropaganda sounds like a nostalgia trip towards USRR / US propagand a in the cold war
opal solar
yeah, it does. It's a cool sounding neologism
iron basalt
and you can't backprop through a sparse layer (non-differentiable).
@grave frost Could you link me a paper? Transformers are usually setup to be differentialable for backprop.
grave frost
iron basalt
<@!738058085083381760> Could you link me a paper? Transformers are usually setup...
ofc they are supposed to be differentiable - but that doesn't mean BERT is made up of dense layers
iron basalt
When I say sparse, I don't just mean sparse activations, I mean sparse weights too.
my bad
other way* (sparse activation)
 glad mesa
can anyone help?
I need to make a text-generation service and apparently tensorflow is just freaking buggy. Why is it buggy? Its because every time I try to train the model, it keeps erroring out and every stackoverflow article I've read says to downgrade, but still keeps erroring out. I plan on using PyTorch instead, but I need help finding a text-generation article using PyTorch and NO tensorflow
grave frost
glad mesa
I need to make a text-generation service and apparently tensorflow is just freak...
its not buggy - you are just using it wrong
glad mesa
well i mean from all those attribute errors and then not implemented errors. Pretty buggy to me
there official documentation for the text-generation service on like I think the character guessing wasn't working
I've like downgraded, reinstalled, and tested tensorflow on different systems and yet still doesn't work
grave frost
I think you should first try to learn Neural Networks from the ground up before jumping in to generate text
glad mesa
yeah i'll do that, but for now I just need an alternative to tensorflow
I think PyTorch is good, but I can't find any LSTM articles based for that
grave frost
You would get more bugs in Pytorch then
its meant for PhD's - people who are very deep into what exactly they want to do and research
glad mesa
yeh ig your right, but i don't have much time since i need this programmed immediately
i can't learn machine learning now since there's time constraints and I just need my text-generation service working
doesn't have to be perfect btw.
grave frost
well, the you are gonna keep having problem nobody can solve because there would be too many. SO answers take 2-3 days on avg.
there official documentation for the text-generation service on like I think the character guessing wasn't working
The output wasnt great, right?
glad mesa
no its not that
its like errors i can't troubleshoot from stackoverflow
or other sources
you see idc if its perfect, I just need it to work.
again, not trying to make it perfect. I'm just trying to make one for the project im working on, which is a autotyping solution
grave frost
can you tell use what exactly you want to do?
 velvet ore
can someone make me a bot
glad mesa
remember how autocomplete works? Yeah im trying to implement that
grave frost
glad mesa
remember how autocomplete works? Yeah im trying to implement that
cool. That's pretty advanced stuff - not something to be done in a fortnight
grave frost
best you can do is to pay for an API - unless you want to spend much more time and effort to make a model for that
glad mesa
yeh. Thanks for helping out!
I'll go ahead and learn some machine learning before I get with autocomplete/Text-Prediction
grave frost
velvet ore
can someone make me a bot
thats against the rules
velvet ore
why
glad mesa
kinda don't have money for an API
grave frost
glad mesa
kinda don't have money for an API
there are open-source ones
that you can host on your local machine
velvet ore
i dont even know how to make olnine
grave frost
velvet ore
i dont even know how to make olnine
'olnine'??
thats against the rules - we can help you out but no one here would make the whole thing (maybe someone would, but you would have to DM them)
and the chance they would work for free = 0
glad mesa
Oh wait rlly?
grave frost
glad mesa
I'll go ahead and learn some machine learning before I get with autocomplete/Tex...
yeah. ML is not like just learning a framework or a library. anyways - text autocomplete is to be done real-time which is pretty complex than normal text generation
unless you can wait 15-20 secs for each autocomplete
glad mesa
Yeh real time would be a bit hard.
I plan on making delayed since it is just a feature for the application.
grave frost
what is your use case BTW?
glad mesa
So I’m developing a auto typing program. Where you can store temporary hot keys to type certain words phrases for speed. Now for autocomplete, that feature would benefit when the user presses a certain key which predicts the text. I’m basically automating the keyboard.
grave frost
wow - I have never heard anything like that
how much do you reckon it increases speed?
glad mesa
Yeh it’s for a school project and like I’m supposed to make a program to present.
grave frost
store temporary hot keys to type certain words phrases for speed
but a good ML model would eliminate that need
glad mesa
Well not much. At best 25% faster since I’m not too experienced with programming, but know some Python to be able to make the app.
Good point that could defeat the purpose of storing custom keys like that.
grave frost
glad mesa
Good point that could defeat the purpose of storing custom keys like that.
yeah
iron basalt
Hmm I could be wrong, but it's probably different defintions of sparsity (DL vs neuro-science-ish stuff). Either way, I would probably find it used in NLP since they are working with series and would probably want to avoid forgetfulness the most.
grave frost
probably want to avoid forgetfulness the most
True, but the attention layers in NLP try to minimise that with the K,Q,V vectors. Pretty efficient seeing GPT3
BTW DL is based on neuroscience-ish-stuff. its not actual neuroscience but has a slight resemblance
iron basalt
Yeah I know, just the stuff I work with is a lot more neuro-science-y (spiking neurons and all that).
grave frost
that sounds interesting - what do you work on?
iron basalt
Sparse predictive heirarchies.
(SPH)
Hierarchical temporal memory (HTM) is a biologically constrained machine intelligence technology developed by Numenta. Originally described in the 2004 book On Intelligence by Jeff Hawkins with Sandra Blakeslee, HTM is primarily used today for anomaly detection in streaming data. The technology is based on neuroscience and the physiology and int...
similar stuff
grave frost
Why does it sound like dropout on steriods? 🙂
grave frost
Hmm.. so basically representing vectors spatially (with relations) rather than directly?
that looks pretty interesting - i would research that
iron basalt
It's like regularization via only sparsity (see k-sparse autoencoders)
but it has many other effects
we know the brain does it because if it was not sparse (activate everything), it would melt from the heat.
it also happens to make computation a lot faster
grave frost
Roughly it kinda seems like making the information more blurrier
iron basalt
(you can run billions of synapses on a cpu single core)
other way around
less blurry
dense stuff is more blurry because more things are mixed together
if that makes sense
Sparse coding in general is what the field is (though those try to directly solve for sparse codes with loss functions), this stuff is like an approximation of that (but a very good approximation).
you probably know Lecun from MNIST, but he works on sparse coding stuff too.
grave frost
Roughly it kinda seems like making the information more blurrier
that reason for the assumption ( if we take a sentence as an example) is that it values the relationship between each of the terms of the sentence which can be used to calcualte its similarity.
that doesnt't take into account the structuring (i.e order) and makes the information more "blurry" since words are context-dependent.
anyways, I just gave a read-through so I may be wrong
iron basalt
There is sparse models in which order matters
like Adaptive Resonance Theory.
(order of input)
grave frost
thats not enough - what about the context?
iron basalt
The context it has through the heirarchical memory
hence the entire goal of SPH, memory and sparse (so stable).
grave frost
how does the hierarchical memory preserve context?
without more data? It wont be able to identify that context in a sentence or 2
grave frost
but you cant use it pretrained from a corpus
iron basalt
you can pre-train it
grave frost
thats intriguing. can you link some resource that covers it all?
iron basalt
one of it's massive strengths is online learning, you can just keep feeding it more and more data.
(which makes it very interesting for robotics)
unfortunately there are no books really for it, the people that work on it seriously I can count on my hands
There is actually one
On Intelligence by Jeff Hawkings
but it covers more than just SPH ideas
it's a path towards AGI
grave frost
sad, because it seems to so much more accurate to neuroscience than the classical variance
grave frost
iron basalt
it's a path towards AGI
explain?
iron basalt
his vision of how we could reach AGI
a path forward
it's in the title that it covers new neuroscience
grave frost
are you sure it covers HTM's?
iron basalt
um let me check again
i have a physical copy here
if not, it sets the basis for it'
I think he made a new book though too
don't remember what the title was
grave frost
well, If I am gonna order a book it might as well be the best one
hollow sentinel
I will borrow PDFs of the books
iron basalt
thousand brains
hollow sentinel
what should I use to learn the math behind DS/ML
grave frost
I dont like to read on devices
iron basalt
I prefer physical books
hollow sentinel
I found a book for statistics
what about linear algebra, calculus, and discrete maths?
iron basalt
hmm guess either wait or get the previous book
previous book is still very good though
I would love to see more ppl working on sparse stuff, especially NLP ppl can mix ideas.
grave frost
intelligence was published in 2007?
iron basalt
first edition 2004
iron basalt
sorry

 lavish tundra
hello someone here use seaborn?
grave frost
@iron basalt is there some online resource to learn that? googlig htms doesn't give much results
iron basalt
To help transition from DL to this stuff I would recommend getting in sparse coding first.
To get into the world of sparse methods.
grave frost
no coding - theory only
iron basalt
Maybe here then? https://en.wikipedia.org/wiki/Sparse_dictionary_learning
Sparse coding is a representation learning method which aims at finding a sparse representation of the input data (also known as sparse coding) in the form of a linear combination of basic elements as well as those basic elements themselves. These elements are called atoms and they compose a dictionary. Atoms in the dictionary are not required t...
grave frost
I rarely find wiki to be a good place to learn, but I will try it. thanx a lot!
iron basalt
Neural coding (or Neural representation) is a neuroscience field concerned with characterising the hypothetical relationship between the stimulus and the individual or ensemble neuronal responses and the relationship among the electrical activity of the neurons in the ensemble. Based on the theory that
sensory and other information is represente...
yeah just go to the references then, or at least to get some vocabulary to search.
grave frost
iron basalt
yeah just go to the references then, or at least to get some vocabulary to searc...
good idea
lavish tundra
this looks cool
grave frost
iron basalt
"This seems to be a hallmark of neural computations since compared to traditional computers, information is massively distributed across neurons. " Because of this you may find many people trying to implement stuff like HTM and SPHs in general on FPGAs.
grave frost
FPGA's - were those the intel's stuff to replace GPU's that flopped?
iron basalt
They did not flop and they don't replace GPUs
They are programmable hardware
as in you can program a hardware implementation for an algorithm.
grave frost
That's kinda deep. Id rather trade performance for quick prototyping
iron basalt
now for most of DL you just use the GPU because it happens to work well, but for this kind of stuff (like spiking NNs) it does not.
yes ofc prototype first
they just want to test how it scales up so they get an FPGA
like running an NN on CPU vs GPU
grave frost
I dont trust anything intel makes. but why cant we spike NN's on GPU?
iron basalt
grave frost
I dont trust anything intel makes. but why cant we spike NN's on GPU?
That gets into the details of it and that would be too much to cover here, let's just say that the GPU architecture is not well suited for it and the CPU is too generic (making it slow)
misty flint
grave frost
NLTK + Huggingface
thanks
grave frost
and (just asking) has there been any breakthrough in HTM and sparsity for benchmarks?
like what can it potentially do? (except agi)
iron basalt
I don't think there are really any benchmarks (like at least not compared to say DL, maybe itself (older versions), and they are still messing around with the basic idea of it before they bother trying to win benchmarks (time investment)).
grave frost
iron basalt
I don't think there are really any benchmarks (like at least not compared to say...
sounds ripe for research
iron basalt
yes we need way more ppl and there is a lot of low hanging fruit simply due to not being able to try everything (trying things takes time).
grave frost
iron basalt
yes we need way more ppl and there is a lot of low hanging fruit simply due to n...
Rather than brute-forcing through all the things we could do, IMO better to have a strong intuition on what to do
iron basalt
Also neuroscience is moving very fast and faster all the time, so sometimes they are half-way done and then get distracted by new stuff and want to do that instead.
Yes we are in that intuition phase
Getting the intuition is also not easy
like pre-calculus vs post-calculus
pretty confident we will get some kind of big explosion.
grave frost
Maybe
iron basalt
like how MLPs did for image recognition
iron basalt
grave frost
Maybe
If we don't believe it, then who will? Sometimes you gotta trick yourself so you can make progress.
Yes it's hype (well, within the small community), but at least we are trying things, so not just sitting there and all hype and no doing things.
grave frost
but I hope the hype sticks - we could do with the funding
young dock
So I was doing multiple linear regression, but it turned out the pval from the breusch pagan test was below 0.05, so what should I do? Is there a different model I should be using for heteroscedastic data?
iron basalt
The hype will probably not die down until new neuroscience does, but I don't see that happening, now with brain computer interfaces happening and all that too.
grave frost
iron basalt
The hype will probably not die down until new neuroscience does, but I don't see...
agreed. I dont think BCI's are happening anytime tho
iron basalt
Well, we have them, just not a mass consumer thing, some people rely on them every day.
maybe Elon will make it happen but idk, he does some pretty dumb things (hyperloop).
AFAIK Valve is also trying
grave frost
yeah. hyperloop was slated to be no profitable and too expensive. but there would be a pretty long argument just on that topic
grave frost
iron basalt
AFAIK Valve is also trying
donts forget Virgin Media
grave frost
gotta go. talk to ya later
grave frost
iron basalt
k cya
same 🙂
grave frost
Easy to grasp blog for anyone to read by, who might want to know how AGI migth be created.
https://numenta.com/blog/2019/01/16/the-thousand-brains-theory-of-intelligence/

In our most recent peer-reviewed paper published in Frontiers in Neural Circuits, A Framework for Intelligence and Cortical Function Based on Grid Cells in the Neocortex, we put forward a novel theory for how the neocortex works. In this updated blog about the Thousand Brains Theory of Intelligence originally published in March 2018, Jeff Hawkin...
mellow vapor
Can i apply Pearson's correlation coefficient after performing one hot encoding on categorical data?
mellow vapor
iron basalt
Any binary classifier.
Ok cool,got the idea
 agile wing
im thinking of choosing the udemy course python for data science and machine learning bootcamp anyone ever heard of it thoughts on the course?
opal solar
You'll learn mostly syntax and recipes. Not a lot of actual theory
Take a course, figure out which one by looking at reviews, etc. But you'll have to do way more than what the course offers to be credible in the field
hollow sentinel
agile wing
im thinking of choosing the udemy course python for data science and machine le...
bro still stuck in tutorial hell huh?
agile wing
yeah
i keep switching back and forth as well
like one month its this one, next month its somethign new...not making any progress really
iron basalt
@agile wing If the course just teaches you a bunch of python machine learning libraries it's bad. You should learn how to do machine learning from scratch in python.
And also make sure that you first have a rock solid understanding of how to make things in python.
agile wing
ml from scratch hmm
hollow sentinel
agile wing
ml from scratch hmm
you should also start contributing to open source projects on ML
agile wing
yea
hollow sentinel
this will get you way more clout than just switching udemy courses
and it's something to put on your resume
 blazing bridge
Just a question, I know that when you train a neural network that the weights get updated as the training goes on but does the bias also get updated or is it just constant.
iron basalt
It's updated.
Perhaps it helps if I call them bias weights instead of just bias, does that help?
@blazing bridge
blazing bridge
iron basalt
Perhaps it helps if I call them `bias weights` instead of just `bias`, does that...
yeah that makes a bit more sense. To clarify, the bias input is always one and the bias weight gets updated like the rest of the weights in a neural network?
iron basalt
You can view bias as being and input of 1 multiplied by the bias weight, but it's much more simple if you just think of it as just the bias which gets added to the end result.
(since 1 * w is just w)
blazing bridge
yeah ok so the bias is a number added at the end of the weighted sum and is updated like any other parameter of a neural network
@iron basalt
iron basalt
yea, output of a single neuron is the dot product of the inputs and the weights plus the bias
(dot product is weighted sum)
iron basalt
no it's not constant
so let's say you have 1 input for 1 neuron
it's output is y = x*w
a line, but it always has y-intercept 0
the bias let's that y intercept change
y = x*w+b
with two inputs it's y = x1 * w1 + x2 * w2 + b
blazing bridge
where b is the bias right
blazing bridge
alright
blazing bridge
so b in the case of a linear regression model allows the line to move up and down
iron basalt
yea
blazing bridge
Thank you, it made way more sense when you told me that the input of the bias is 1 and it has a weight attached which is updated
iron basalt
@blazing bridge Note that if then pass y into an activation function like sigmoid(y), the bias has the effect of shifting the curve left or right (because it's the input to the curve).
iron basalt
no
blazing bridge
ok thank you so much

 true verge
misty flint
features can be engineered from data to create a better model
true verge
misty flint
features can be engineered from data to create a better model
i could only google pages explaining feature scaling but nothing that explains the difference. could you please help?
 subtle bronze
[4 in 1][python] [vscode][Jupyter]and [python extension for visual studio code] [WIN10] in 8 minutes
https://youtu.be/Bl7TB2UD01A

#pyhon #Jupyter #vscode #python3 #BestIDE
#visual_studio_code
how to install [python] [vscode][Jupyter]and [python extension for visual studio code] [WIN10] in 8 minutes
With us, One step ahead!
Our courses start soon Please help us by subscribing to our channel.
if you want to learn Programming (especially Python and C++), MS Office, ...
 vast tapir
Hi, anyone here that could help and nudge me in the right direction?
I have an industrial machine power usage dataset, looks similar to this: https://www.researchgate.net/profile/Hugo-Carvalho-4/publication/277939018/figure/fig3/AS:294395699056645@1447200812649/Electricity-consumption-of-a-CNC-machine-tool-during-the-machining-of-one-part.png
I'm trying to find out something interesting from the data, such as outliers or different states (off / idle / in use).
For outliers, I've used DBSCAN and isolation forest (among others but these were most useful) and got good results.
As for finding out different states, I'm stuck.

 shadow quiver
I have a numpy array in a shape of 3, 4, 5 like in the image. How can I reshape it to 4, 3, 5 and keep the colored values in the middle axis?
 shadow quiver
I have a numpy array in a shape of `3, 4, 5` like in the image. How can I reshap...
shadow quiver
shadow quiver
I have a numpy array in a shape of `3, 4, 5` like in the image. How can I reshap...
Ok, np.stack(a, axis=1) 🙂
 full palm
anyone can explain what is data science
grave frost
@lapis sequoia you can easily check the docs here https://www.tensorflow.org/api_docs/python/tf/data/Dataset#repeat which shows that repeat simply clones the dataset (I don't know why anyone would do that). which tutorial are you referrring to?
grave frost
agile wing
ml from scratch hmm
dont learn ML if you dont like it. Its going to be a long journey and you would need all the motivation you can muster. doing things half-heartedly is never productive
cool 👍
yw
@iron basalt preordered it 😁 just gotta wait some time now
lapis sequoia
Are neurons always linear functions? Or can you have polynomial ones?
lapis sequoia
full palm
anyone can explain what is data science
The mining and analysis of data
 tidal bough
lapis sequoia
Are neurons always linear functions? Or can you have polynomial ones?
tidal bough
lapis sequoia
Are neurons always linear functions? Or can you have polynomial ones?
You mean the weights between the neuron layers? I don't think nonlinear ones are interesting, because it seems to me they'd be equivalent to just changing the activation function of the layer and then using a linear mapping.
lapis sequoia
tidal bough
You mean the weights between the neuron layers? I don't think nonlinear ones are...
Yeah I thought so.
@tidal bough Also what exactly do the filters and units specify in the layers?
someone teach me python ples :>
Is a dense layer going for 4096 units to 1000 units just creating a linear function with 4096 units on 1000 new neurons
tidal bough
Yup, it's pretty much a 4096x1000 matrix - multiply it by the activations of the first layer, and you'll get the inputs of the second layer.
tidal bough
Filters for CNNs are mostly convolutions or poolings, I think. For example, you can have a filter of "replace each pixel with the average of its 8 neighbours" (this can be done via a convolution, which is technically a linear function, but it's calculated more efficiently then via multiplication by a matrix), or a filter of "replace each 3x3 panel with the brightest pixel in it" (which is a pooling - it reduces the size of the data).
So they can technically be represented with just special activations and linear mappings, but that'd be inefficient - calculating convolutions with a kernel is really fast.
(consider what a convolution is equivalent to. Suppose you have a convolution, like an averaging one, that turns a 1000x1000 image into a 1000x1000 one again. Representing it as a multiplication by a matrix would require a 1 million x 1 million matrix, that'd also be hella sparse - there'd be one 9 nonzero entries in each row, because each pixel of the output only depends on the 9 closest pixels of the input).
young dock
I'm trying to do a WLS but im confused how I get the weights
I think im supposed to use the inverse of something, but idk what
 wind yacht
Just looking for some ideas....
I want to make a bot to solve a candy crush like game... so there is a 9x7 (w x h) grid of numbers and the bot needs to move a cell in that grid into another location. I can program the logic of the game easily enough, I am just not sure what I should use for inputs and outputs....
I first thought I would input the grid and a target number (because in this game, it's some times better to crush a certain candy over the others) but I am not too sure what I would output from the network... so like, what move the network would make.
I first thought the outputs could be the "source" cell (x1,y1) and the "target" cell (x2,y2), the game logic would crush what it can and a score generated. but then I thought, I could do a source cell, direction (up, right, down, left) and distance.....
But I am a little lost, my rather tired, 12:30am brain is getting smooth and not exactly thinking straight.
Any ideas would be appreciated
daring crag
Hello there, i hope you all are good, can you recommend me some machine learning, data science courses or youtube videos?
grave frost
wind yacht
Just looking for some ideas....
I want to make a bot to solve a candy crush lik...
I have never played candy crush, but I beleive that you can hard code the logic yourselves
for input, you can have python libraries to sample the color at a particular coordinate point in the game. the color there would be give you information as to what candy is rpesent in a grid. but that in a matrix and you have constant input
making a matrix of all candy positions would be the first part - after that, you can use coordinates to simulate a swipe (using some HID python lib) and get the program to swipe.
for scoring purposes, you would either have to track it yourselves (and implement a function that scores swipes acccordingly.) ==== boring+inefficient
rather than that, just crop the area of the game which displays the score, and apply some off-the-shelf (dont train your own) ML model to get the score from the frames every 1/10th or so of a second. I beleive there are already python libs for that
so basically, a frame from the game every half a second, finding the colors at particular present point and score, then use logic to find best swipe. pretty good project and its actually easier than it sounds 🙂
wind yacht
oh, I know I can hardcode the logic to work it out @grave frost, but I thought a neural network might be fun to attempt ya know
grave frost
wind yacht
oh, I know I can hardcode the logic to work it out <@!738058085083381760>, but I...
yeah, you can do that. There are plenty of RL agos out there. I would recommend DQN
it would be the simplest and fastest - because candy crush doesn't have much logic or planning required
grave frost
daring crag
Hello there, i hope you all are good, can you recommend me some machine learning...
checkout the Neural Network videos on 3BLue1Brown. He tries to explain it intuitively using the least maths. good for beginners.
wind yacht
well there is some planning, as in combos and getting the best score per turn
grave frost
nothing a DQN can't handle 🙂 but if you don't like its performance, then you can easily switch
wind yacht
like, it's not that necessary to combo, but it is better if you do
alrighty, I will do some looking... but from my initial searches, most use gym haha
wind yacht
like, I could set up my own gym environment but that is more effort I don't really wanna do lol
grave frost
wind yacht
like, I *could* set up my own gym environment but that is more effort I don't re...
I have explored that option and beleive me, its worse than writing the whole game itself
better use the game alone, try something else. I heard NEST could be used without gym
though it is genetic algorithm and may be overkill, but you would probably have the best bot in the world
wind yacht
for fast training I would need to write a basic version of the game anyway so I can easily reset and have it "see" different layouts
grave frost
for fast training I would need to write a basic version of the game anyway
that's lazy - I don't know why everyone does that
espcially when you have the whole game already made
wind yacht
yea, but it takes a while to get into game, and I would need to script button presses and mouse clicks
grave frost
mouse and button presses are literally one line 🤷
wind yacht
not from my experience... I needed to use 3 different methods to control "Race the Sun"... I have no idea why tho
wind yacht
yes, directional arrows and "return" are more complex :p
ok, so lets go with the DQN method with some jank code around it... how do I work out what my outputs are?
Im not sure if I should go with the source cord,target cord or the source cord,direction,distance method
 bronze skiff
grave frost
nothing a DQN can't handle 🙂 but if you don't like its performance, then you ca...
bronze skiff
grave frost
nothing a DQN can't handle 🙂 but if you don't like its performance, then you ca...
well... no, dqns tend to be bad when it comes to that level of planning. especially when the action space is so large
which is why techniques like mcts and trpo were developed
grave frost
bronze skiff
well... no, dqns tend to be bad when it comes to that level of planning. especia...
hmm...isnt the action space just to swipe up,down,left or right?
sorry I haven't played candy crush
bronze skiff
i think you also have to choose where on the grid to apply that direction
its a touch based iphone game
grave frost
ohh, you mean that those 4 on any number of cells and variable length of swipe?
bronze skiff
yes
wind yacht
yea, you need to select a "start" cell, and then a direction and then how far to go
grave frost
yeah, then I doubt it be that good to use DQN - it was mostly for atari with just up,down left or right.
I still recommend NEAT
wind yacht
NEAT or NEST, cause you suggested NEST before :p
wind yacht
haha 🙂 just having a go at you, don't feel bad
grave frost
cool, no worries
wind yacht
I might just do it the programmed logic way, it'll be a pain to program but meh, seems like this might be a touch hard for a neural network
grave frost
I think GA's can usually handle that 🙂 I have seen more complex stuff done by GA, but you are free to experiment
wind yacht
I should sleep, its 2:17am haha, thanks for the knowledge
I will do a touch more research before I give up :p
grave frost
yw 👍
 fickle kettle
Just a quick question about machine learning, will overfitting help in classifying future data records in some way?
grave frost
no
grave frost
decision trees can be pruned to preven overfitting 🤷 overfitting in general is not something that is appropriate - it won't be able to generalize and you end up with a bad model. you should probably do cross-validation to see whether it overfits or not
daring crag
Hello there, i hope you all are good, i have a situation and i dont have idea of how to aproach it, so i got around 10000 images and they have all one watermark (the same) in different positions of the images, i want to make a way of taking those images and putting on the watermark a black square, how should I aproach this in a automatic way? btw i dont know in which topical chat put this so i think this one is the most similar.
 tiny seal
Hi there, how might I split the values in a groupby.nlargest(n) into n columns instead of keeping the multiindex?
 dawn crown
daring crag
Hello there, i hope you all are good, i have a situation and i dont have idea of...
dawn crown
daring crag
Hello there, i hope you all are good, i have a situation and i dont have idea of...
train your haarcasscade to identify the watermark using linux and cv2
daring crag
dawn crown
train your haarcasscade to identify the watermark using linux and cv2
Do you know any python library in which i can do that?
dawn crown
daring crag
Do you know any python library in which i can do that?
if the water mark had a fixed positon then you could have done it with cv2 alone(py libary)
daring crag
Mmmmmm so im forced to use Machine Learning for this situation?
dawn crown
daring crag
Mmmmmm so im forced to use Machine Learning for this situation?
not machine learning use haarcascade
dawn crown
or theres an alternative
daring crag
yeah..
dawn crown
if you have the png of the watermark then you can try subtracting the array of the images from png of watermark
it will create a black spot where the watermark was there
daring crag
yeah... and i can fill that blacksport with another thing...
daring crag
dawn crown
if you have the png of the watermark then you can try subtracting the array of t...
do you know how can i do this?
dawn crown
you need to have the png of the watermark
watch a youtube turotorial or go through documentations
daring crag
Ok sure! Thanks for the help
daring crag
dawn crown
you need to have the png of the watermark
Also... i used to have "SeleniumSoup + some numbers" as a pasword Hahhaha
exotic maple
Hello folks I've had this " question" for a while here. Basically, I've been studying studying and practicing a lot about DS, but I still havent gotten a feel as to 'HOW' an End-to-End data science, ML Project looks like.
Does anyone have a public sample of your own that I could possibly check for this? It doesn't need to be something overly complex I just want to see and get the intuition as to the E2E steps, and what is the expected "end" of it.
lapis sequoia
sad bot hours rn
i was token nuked idfk how anyone got my token i used message purger but i think i forgot to delet repl
grave frost
exotic maple
Hello folks I've had this " question" for a while here. Basically, I've been stu...
if you want the real deal, choose a project where you solve a real-world problem with real-world data collected by you. It would give you some hint as to how end-to-end datascience/ML projects look like
exotic maple
@grave frost Hey man. Yeah I understand that, but i was wondering if anyone had like a sample of their own work like that. Just to get a general idea of how it would look like. I havent found anything online lol
grave frost
exotic maple
<@!738058085083381760> Hey man. Yeah I understand that, but i was wondering if ...
chances are that no one would share that - because if they did do the full-on project (most datasets nowadays are pretty clean) it would prob be for a company so they wont be able to disclose anything
 cosmic heron
Hi again, I was wondering if plotly has a way of outputting something like this: https://www.youtube.com/watch?v=a3w8I8boc_I&ab_channel=DataIsBeautiful
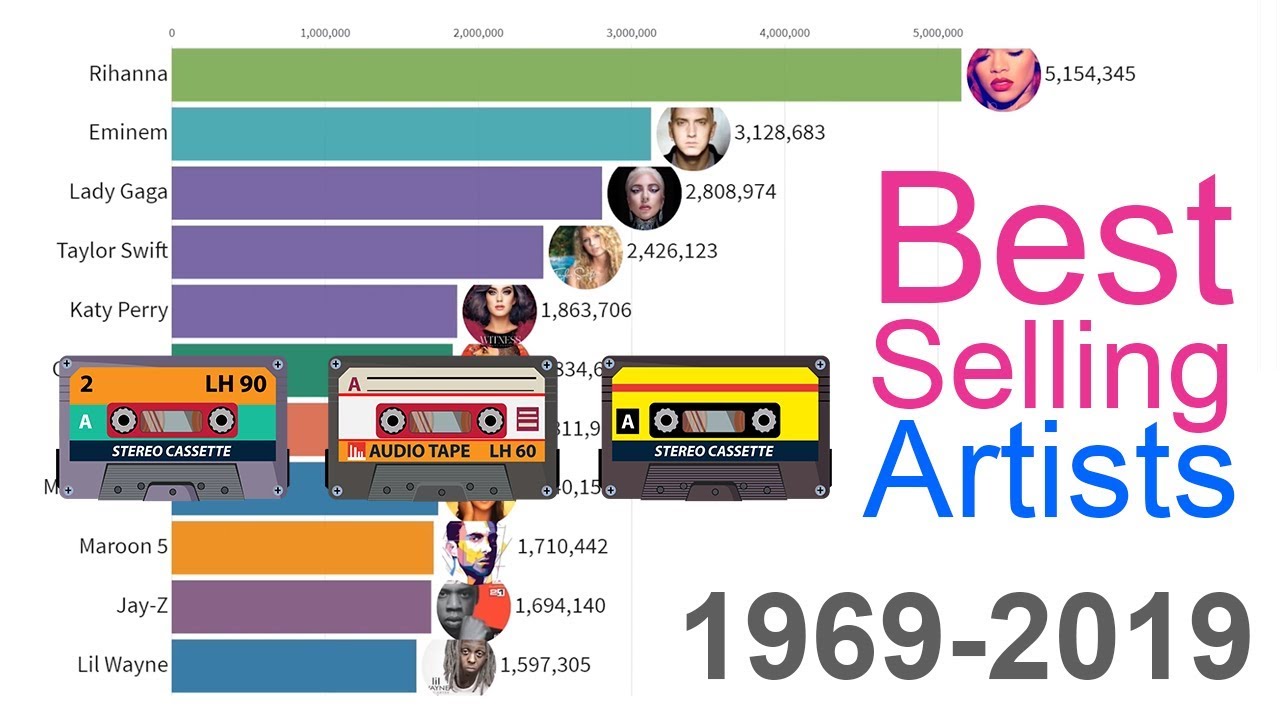
Timeline history of most popular music artists from 1969 to 2019 ranked by yearly certified record sales. Numbers are worldwide and adjusted to twelve months trailing average.
Recent years data includes digital singles sales as reported by online music retailers and streaming services. This data aggregates multiple sources and can serve as popu...
iron basalt
grave frost
I think GA's can usually handle that 🙂 I have seen more complex stuff done by G...
Yea, genetic algorithms are like a cheat code, if you are in a situation in which you can use them, you should. @wind yacht
hollow sentinel
cosmic heron
Hi again, I was wondering if plotly has a way of outputting something like this:...
perhaps... did you try looking in the doc?
iron basalt
cosmic heron
Hi again, I was wondering if plotly has a way of outputting something like this:...
yes, orientation='h'
grave frost
iron basalt
Yea, genetic algorithms are like a cheat code, if you are in a situation in whic...
genetic algorithms are like a cheat code,
GA devs : Excuse me sir, will you please GTFO?
iron basalt
Meant as an approval, as in they are very powerful / effective. Unexpectedly so.
grave frost
its ok 🙂 its just that nobody likes getting their powerful tools compared to "cheat codes"
cosmic heron
hollow sentinel
perhaps... did you try looking in the doc?
I did look at the plotly docs, I checked the gallery but I didn't see anything that looked right
cosmic heron
iron basalt
yes, `orientation='h'`
did you intend this for me?
iron basalt
cosmic heron
did you intend this for me?
yes
cosmic heron
iron basalt
yes
orientation='h', okay, horizontal I guess, but what type of graph is that?
Like, is it just a bar graph
omg
iron basalt
yeah a bar chart
cosmic heron
lmao mb, sorry
would you happen to know how to get it styled like that? it's very pretty
iron basalt
colored bar chart
cosmic heron
iron basalt
colored bar chart
bless, will try my best, thank you 🙂
iron basalt
it's in the docs
iron basalt
grave frost
its ok 🙂 its just that nobody likes getting their powerful tools compared to "c...
I wanted some extra emphasis, just saying they are "powerful" did not feel right.
grave frost
s'ok
lapis sequoia
hey
i need help i am working with flask and html
in vsc
is there any shortcut to pass hmtl structer >
?
structure *
grave frost
you should use a help channel
lapis sequoia
sorry
grave frost
its alright 🙂
from the docs link, it does say in the skeleton
shuffle=True
So I guess so
lapis sequoia
im taking databases so i am learning sorry
grave frost
lapis sequoia
im taking databases so i am learning sorry
as I said before, its alright. just that it seems to be a pretty general enquiry rather than something focused directly on data-science - so you would get help faster there
grave frost
@pure pond This:-
Model.fit(
    x=None,
    y=None,
    batch_size=None,
    epochs=1,
    verbose=1,
    callbacks=None,
    validation_split=0.0,
    validation_data=None,
    shuffle=True,
    class_weight=None,
    sample_weight=None,
    initial_epoch=0,
    steps_per_epoch=None,
    validation_steps=None,
    validation_batch_size=None,
    validation_freq=1,
    max_queue_size=10,
    workers=1,
    use_multiprocessing=False,
)
its right in the front man
 lean dagger
Does anybody have any data-cleaning line number tips for something like this?
Q. Is one of the things with Cymbalta2that you review the possible side effects3associated with discontinuation of the drug?4 A. More likely than not, the package5insert was reviewed. If it was part of the6package insert, then more likely than not, yes.7 Q. And is it your understanding, sitting8here today, that discontinuation symptoms are9discussed in the label for Cymbalta?10 A. The current label has -- it has to be11tapered off, so . . .12 Q. And was that true in 2009 as well?13 A. If it was in the package insert, yes.14If it was in the package insert in 2009.15 Q. But as of 2009, beyond the package16insert or the label, did you also have that17understanding from your practice and your18experience as a rheumatologist?
I've tried using nltk_sent_tokenize, but that didn't work. I was thinking about using a regex approach, but I need to retain numerical information from the deposititon transcript.
iron basalt
@pure pond You linked to it.
astral path
I exported a dataframe as a .csv file and a lot of the headers, which have special characters like emojis and accents, just returned like ç…:registered:å‡ã‚Šãƒ¶æ²¼ Nikogoriganuma
or §§§§§§§§§§ IIzo
how do I convert it back to normal ? can I just do that using to_csv() in pandas with some specific argument? is there another converter i should use?
idek what format this is in
 near gulch
i want to create a histogram based on the distribution of time (minutes) attendees spent in a zoom call:
y-axis: frequency
x-axis: different time ranges (0 - 10 mins), (10 - 20 mins) etc as an example
[2, 6, 7, 8, 9, 10, 13, 16, 18, 30, 35, 38, 41, 57, 69, 76, 87, 88, 91, 96, 103, 104, 105, 106, 107, 108, 113, 117, 119]```what would be a way to create those time ranges based on the list above
lmk if this is the wrong channel
 hollow gull
You can use numpy to build bins for you using np.arange() or np.linspace.
One of the arguments for panda's histogram plots is bins, and you can pass in the appropriate value from numpy.
near gulch
ok thanks that sounds good, what do you mean by bins?
hollow gull
it is a list or array that tells pandas where to break the data up at.
alternatively you can pass it an int in which case it will use the minimum and maximum of the data along with the number of bins to split it up for you.
near gulch
ahh ok
hollow gull
np.arange and np.linspace are just really convenient to use to build the bins youself. arange if you know the width of the bins you want and linspace if you know the number of bins you want.
near gulch
thanks, much clearer idea now @hollow gull
iron basalt
@near gulch Or just in plain python:
>>> times_spent = [2, 6, 7, 8, 9, 10, 13, 16, 18, 30, 35, 38, 41, 57, 69, 76, 87, 88, 91, 96, 103, 104, 105, 106, 107, 108, 113, 117, 119]
>>> buckets = [[]]
>>> interval = 10
>>> for x in times_spent:
...     while x > interval:
...             buckets.append([])
...             interval += 10
...     buckets[-1].append(x)
...
>>> buckets
[[2, 6, 7, 8, 9, 10], [13, 16, 18], [30], [35, 38], [41], [57], [69], [76], [87, 88], [91, 96], [103, 104, 105, 106, 107, 108], [113, 117, 119]]
thanks @iron basalt
hollow gull
if you throw in a buckets= [ len(bucket) for bucket in buckets] it would put it more in the format of a histogram.
I put a count in there, which doesn't exist for lists... I am pretty use to relying on pandas and numpy.
iron basalt
hollow gull
I put a count in there, which doesn't exist for lists... I am pretty use to rely...
Not sure what you mean by count not existing for lists.
near gulch
wohoo
 hollow gull
lists don't have a count method do they?
iron basalt
they have len
near gulch
just one other thing - how do i get the bars to show with an outline
iron basalt
Sounds like a matplotlib API question, try searching for it first.
near gulch
so i found the answer on Stackoverflow
https://pandas.pydata.org/pandas-docs/stable/reference/api/pandas.DataFrame.hist.html - but when i looked through the documentation here
i couldnt see the argument was looking for
which is edgecolor
hollow gull
It mentions that it is using matplotlib.pyplot.hist() in the documentation, so you need to search for that.
near gulch
so where should i look in the future
iron basalt
**kwargs

    All other plotting keyword arguments to be passed to matplotlib.pyplot.hist().
got youu

 native bay
can someone suggest some interesting projects?
hollow sentinel
@native bay Kaggle
native bay
i mean i dont have much experience with data science till now i only know 4-5 algorithms i just started this january
 eager timber
Im new to coding, getting error:NameError: name 'classifier' is not defined
trying to use Stratified cross validation from sklearn.model_selection import StratifiedKFold
RSEED = 60
accuracy=[]
skf = StratifiedKFold(n_splits =10, shuffle = False, random_state = RSEED)
for train_index, test_index in skf.split(X,y):
print('Train:',train_index, 'Validation', test_index)
X1_train, X1_test = X.iloc[train_index], X.iloc[test_index]
y1_train, y1_test = y.iloc[train_index], y.iloc[test_index]
classifier.fit(X1_train, y1_train)
prediction = classifier.predict(X1_test)
score = accuracy_score(prediction, y1_test)
accuracy.append(score)
print(accuracy)
native bay
eager timber
Im new to coding, getting error:NameError: name 'classifier' is not defined
tryi...
you have not defined classifier
like you never gave the variable classifier a type
print(x)
over here you never gave x a value so the same error will occur
eager timber
are you saying that im suppose to give a value to classifier.fit
native bay
see
x=5
print(x)
this will output 5
but if you write
print(x)
it will say i dont know x or it is not defined
so i think in your case it is classifier=StratifiedKFold()
and then use classifier.fit
eager timber
okay Naman thanks for the instant reply..
native bay
👍
eager timber
where you frm..
native bay
India
eager timber
like what city..
native bay
Bengaluru
eager timber
okay.. I was planning to shift in bengaluru in nxt month..
I hope we can meet than..
native bay
oh cool its a good place for techies
native bay
eager timber
I hope we can meet than..
i dont think i am just 14 so...
 fleet grail
lol
eager timber
you got me..
native bay
lol
eager timber
for second
okay.. bro take care.. If need help anytime call me 7517229088. From Pune.. Anosh
eager timber
As i owe you big time..
native bay
ok cool gr8 👍
eager timber
okay.. take care buddy you saved my hours of research..
actually im new to discord..
native bay
yes your profile told me
eager timber
okay..
native bay
bye take care
eager timber
yeah
lapis sequoia
Anybody familiar with knime?
hoary wigeon
hello
Im getting error on importing seaborn

when i check in terminal, seaborn is available
 misty flint
looks like youre running in jupyter. conda environment probably doesnt have seaborn package
so just gotta make sure your environment has it installed/the right version
hoary wigeon
%matplotlib inline is used for what ?
iron basalt
To tell jupyter notebook that you want matplotlib to display the plots inside of jupyter notebook, not a separate window (which is the default behavior).
lavish tundra
i was thinking about the differences between data in json, xml, yaml, yml, sql, excel... at the end the best is just about what u prefer?
velvet thorn
lavish tundra
i was thinking about the differences between data in json, xml, yaml, yml, sql, ...
nope
depends on how you want to access it
lavish tundra
but I'm thinking more about performance, cause i believe the access don't gonna be a problem
iron basalt
 soft fiber
can someone help me with colour identification
soft fiber
can someone help me with colour identification
Colour of what? The entire image? As in the most common color in the image?
A single pixel?
velvet thorn
lavish tundra
but I'm thinking more about performance, cause i believe the access don't gonna ...
that is what I’m saying
actually...
only SQL is even a database
so it’s not really right to compare it to the others?
soft fiber
iron basalt
Colour of what? The entire image? As in the most common color in the image?
most common
of a piece of clothing
iron basalt
soft fiber
most common
How are you doing it now?
soft fiber
iron basalt
How are you doing it now?
sent u the file
 tidal bronze
hye guys
how do you manage NaN when they actually have a meaning
I'm doing a kaggle comp, the housing prices one
BsmtCond: Evaluates the general condition of the basement
   Ex    Excellent
   Gd    Good
   TA    Typical - slight dampness allowed
   Fa    Fair - dampness or some cracking or settling
   Po    Poor - Severe cracking, settling, or wetness
   NA    No Basement
this is the description of one of the column
I guess I should change the NAs to something else otherwise the machine learning might not know how to handle them?
grave frost
you have to convert those features to numeric form anyways
hoary wigeon
iron basalt
To tell jupyter notebook that you want matplotlib to display the plots inside of...
how to go for separate window ?
 somber depot

Tableau
Tableau senior research scientist Ana Crisan reflects on the questions of what data science is, what data science work is, and who data scientists are.
 tacit basin
hoary wigeon
how to go for separate window ?
tacit basin
hoary wigeon
how to go for separate window ?
in jupyter lab you can right click on the inline graph and select 'creat new view from output'
tacit basin
iron basalt
To tell jupyter notebook that you want matplotlib to display the plots inside of...
for some reason i never have to use that command and graphs are printed inline anyway. do we know why is that? is that used as default setting maybe?
 kindred canyon
hey, can someone help me with importing and exporting data with csv, please? i am getting error :( ||(ping/dm me if you'd like to help)||
 pure pond
kindred canyon
hey, can someone help me with importing and exporting data with csv, please? i a...
pure pond
kindred canyon
hey, can someone help me with importing and exporting data with csv, please? i a...
try numpy.savetxt("filename.csv", array_name, delimeter=',') and numpy.loadtxt(filename, delimeter)
I'm using tensorflow for the first time, how do I stop these warnings about not using gpu parallelisation (thats what it looks like to me anyway)?
 kindred canyon
pure pond
try numpy.savetxt("filename.csv", array_name, delimeter=',') and numpy.loadtxt(f...
kindred canyon
pure pond
try numpy.savetxt("filename.csv", array_name, delimeter=',') and numpy.loadtxt(f...
um i am supposed to use a certain syntax for it lol. unfortunately, i can't use other commands for it
something like this?
 kindred canyon
oh thats alright then!
 austere swift
pure pond
I'm using tensorflow for the first time, how do I stop these warnings about not ...
austere swift
pure pond
I'm using tensorflow for the first time, how do I stop these warnings about not ...
those are errors saying it couldnt load cuda libraries
do you want it to run on cpu?
pure pond
Yeah
austere swift
kindred canyon
hey, can someone help me with importing and exporting data with csv, please? i a...
in what form is the data?
pure pond
I'm not telling to do anything with my gpu, this is my first use of TF so I'm just getting a feel for how it works
austere swift
by default it uses gpu
pure pond
How do I switch that off?
austere swift
you can do os.environ['CUDA_VISIBILE_DEVICES'] = '-1' at the beginning of your code
that will basically just make tensorflow think there arent any gpus
or tf.config.set_visible_devices([], 'GPU')
kindred canyon
austere swift
in what form is the data?
dataframe?
austere swift
kindred canyon
dataframe?
if its a dataframe you can just do df.to_csv('filename.csv')
are you interested in making a neural network or to just use more "classical" machine learning
kindred canyon
austere swift
if its a dataframe you can just do `df.to_csv('filename.csv')`
i did that and it shows this error
 austere swift
kindred canyon
i did that and it shows this error
austere swift
kindred canyon
i did that and it shows this error
its because youre trying to copy it to the C: drive, which you need administrator permissions for
kindred canyon
some file location error?
austere swift
thats why you get permission denied
austere swift
save it to a different place
kindred canyon
ah okay cool, let me try that
austere swift
that you have permission to access
kindred canyon
austere swift
save it to a different place
um i want to save it in documents then what command do i use?
"documents:\filename.csv"?
austere swift
kindred canyon
um i want to save it in documents then what command do i use?
documents would be C:/Users/<your username>/Documents/filename.csv
misty flint
somber depot
https://www.tableau.com/about/blog/2021/2/data-science-and-future-visualization-...
interesting read

somber depot
good mornig team
i am working with JIRA cloud
is there a way to interact Python with JIRA?
grave frost
could you elaborate?
tidal bronze
hello
when converting categorical variables to dummies for ML, is it ok to drop the first one?
 brisk plaza
https://gist.github.com/eyx092/9858adc70c3d76d93ab42aafa577e158 ok so i'm running this
which for some reason returns this:
  File "/Users/root/PycharmProjects/LSTMPredictor/main.py", line 62, in <module>
    x_train = np.reshape(x_train, (x_train.shape[0], x_train.shape[1], 1))
IndexError: tuple index out of range```
Gist
Stock Prediction using LSTM Model. GitHub Gist: instantly share code, notes, and snippets.
 serene scaffold
I'm trying to do conditional mean imputation
import pandas as pd

data = pd.read_csv('./titanic.csv')
features = data[['Sex', 'Age', 'Pclass']]  # age is sometimes nan
grouped = features.groupby(['Sex', 'Pclass'])
print(grouped['Age'].mean())
I'm not clear on how to use fillna or features['Age'] = ... to write the imputed values back to the dataframe.
tidal bronze
replace_age = train_df.groupby(["Sex", "Pclass"])["Age"].transform("mean")
train_df["Age"].fillna(replace_age, inplace=True)
@serene scaffold
you can also do it in one line
serene scaffold

somehow I never learned "transform"
tidal bronze
so now that I helped a mod do I become the owner of this server?
serene scaffold
No.
tidal bronze
dic = {"2ndfloor":[0,10,0,15], "1stfloor": [10,10,0,13]}
df = pd.DataFrame.from_dict(dic)
let's say we have the df above, how can I make a function that will tell me the number of floors (i.e. if the value is positive for 2nd floor return 2,...)?
 limpid oak
kindred canyon
i did that and it shows this error
limpid oak
kindred canyon
i did that and it shows this error
try like this df.to_csv(r'dirvePath\ip.csv') this should work
limpid oak
tidal bronze
```python
dic = {"2ndfloor":[0,10,0,15], "1stfloor": [10,10,0,13]}
df = pd.DataF...
first your code is redundant , why are you passing dict two times?
simply pd.DataFrame(dic) try this
limpid oak
tidal bronze
```python
dic = {"2ndfloor":[0,10,0,15], "1stfloor": [10,10,0,13]}
df = pd.DataF...
explain your problem in details
kindred canyon
limpid oak
try like this ```df.to_csv(r'dirvePath\ip.csv')``` this should work
r'dirvePath? is there an error here?
limpid oak
r is used for to declare string as raw
means backslashes'/'or '\ will be consider as string no escape character
as you know \n means new line
but if you use r'\n' nothing will happen
try once

 limpid oak
kindred canyon
it worked
limpid oak
kindred canyon
it worked
welcome
tidal bough
the weird jumps are likely because your accuracy is so low, there's only a few correctly identified examples
 summer gulch
!resources
 arctic wedgeBOT
Resources
The Resources page on our website contains a list of hand-selected learning resources that we regularly recommend to both beginners and experts.
https://pythondiscord.com/pages/resources
grave frost
tidal bough
the weird jumps are likely because your accuracy is so low, there's only a few c...
agreed. but I am basically guessing at this point - lower learning rate? it was converging initially (before I made some of my changes) Any other possible guesses?
iron basalt
grave frost
Maybe there is something that shows up in val, but not in train (at all).
Idk pretty strange.
 noble sand
With Matplotlib, can we display string text horizontally along the x-axis of a graph including adding text vertically with stem plots corresponding to each value on the x-axis?
grave frost
iron basalt
Maybe there is something that shows up in val, but not in train (at all).
ikr. Pretty strange 🤷
iron basalt
grave frost
ikr. Pretty strange 🤷
To me this raises questions of potential bugs in the code. But if you are using a library it may be very hard to tell.
iron basalt
tacit basin
for some reason i never have to use that command and graphs are printed inline a...
So you know how when you're in python interactive mode and create an object it prints something <object ...>? That is the return value from the line you executed. Jupyter notebook is like python interactive mode, but rather than just printing the text instance of the plot object, it will actually render it. Normally you need to call show() to show the plot (which renders that object in a new window).
@hoary wigeon
Also i'm not sure but inline may be the default now for jupyter since everyone does it, so you may not need to do %matplotlib inline anymore.
grave frost
I know that after 20 days of frustration and hair pulling, there would probably be some simple explanation as to why the model is not converging 😦
lapis sequoia
Is cross validation just test_train_split a bunch of times on one dataset?
 odd lion
lapis sequoia
Is cross validation just test_train_split a bunch of times on one dataset?
odd lion
lapis sequoia
Is cross validation just test_train_split a bunch of times on one dataset?
It's a bit more involved than that, but essentially, yes. The things to keep in mind is that it's test_train_splitting only on the training dataset, the test is still eft out. And there is no repetition of the data between splits (unless you force it)
Has anyone see this before with matplotlib? I set plt.style.use('ggplot') which is looking nice, except that the white lines are crossing through my data, and I'd prefer my data to be on top:

 indigo steppe
a have a df that has a date in it and i want it to make it the index with pandas.what is the difference between
df.set_index('Date')
and
df=df.set_index(pd.DatetimeIndex(df['Date'].values))?
Thx
velvet thorn
misty flint
dAtA iS tHe New OiL
produced only after a really long time?
misty flint
ig with a lot of data thats true
i was more thinking along the lines of industry
bc i feel like data is even more prevalent than oil -- and ik oil touches a lot of industries
plastics, chemicals, aviation, etc.
 faint patio
Alright

This is my grouped dataframe
I know that plotting a grouped dataframe is strange, as the columns are not recognized or something.
I do know how to plot a grouped dataframe.
However, for this assignment I need to plot the first 25 weeks from each year.
And I don't know how to select the first 25 weeks, as 'weeks' does not exist anymore as a column to select
graph = df_data_weekly[(df_data_weekly['week'] <= 25)]
Therefore, something like this doesnt work
So how do I select the first 25 weeks?
 rapid comet
faint patio
rapid comet
faint patio
did you try to reset_index()
faint patio
where should I put reset_index in my code?
faint patio

this is my code
It still crashes at the last line
the graph doesnt work
because the column 'week' is not recognized
rapid comet
put it after grouped.agg(), so it's saved
faint patio
oh wow that actually doesnt crash
the graph is completely fucked tho
thanks for the help man
rapid comet
cool
faint patio

look at that ugly thing
i might as well ask another question
I not only have to get the frist 25 weeks
I also have to put each year in a different line
so each year has to be seperated
rapid comet
you need a facetgrid with hue = year
faint patio
I have to loop it right?
iron basalt
faint patio
```graph = df_data_weekly[(df_data_weekly['week'] <= 25)]```
>>> df
   Year  Month  Animal  Max Speed
0  2012      3  Falcon      380.0
1  2013     10  Falcon      370.0
2  2014      7  Parrot       24.0
3  2015      4  Parrot       26.0
>>> indexed
            Animal  Max Speed
Year Month
2012 3      Falcon      380.0
2013 10     Falcon      370.0
2014 7      Parrot       24.0
2015 4      Parrot       26.0
>>> indexed.loc[indexed.index.get_level_values("Month") > 4]
            Animal  Max Speed
Year Month
2013 10     Falcon      370.0
2014 7      Parrot       24.0
>>>
You can do it like that
iron basalt
i just set_index(["Year", "Month"])
faint patio
i have to group it tho, for the assignment
iron basalt
Well it looks like you already have that no?

Looks like you have a multi-index of year, week
iron basalt
Yea so get_level_values gets you the values of an index at a given level (either a number or the name)
faint patio
im so confused man
thanks for the help
do you know how to get every year apart?
every year has to be its own graph
so i have to select a year from my Dataframe
each year
iron basalt
>>> df = pd.DataFrame({'Year': [2012, 2013, 2014, 2015, 2015], 'Month': [3, 10, 7, 4, 5], 'Animal': ['Falcon', 'Falcon','Parrot', 'Parrot', 'Parrot'],'Max Speed': [380., 370., 24., 26., 28.]})
>>> df
   Year  Month  Animal  Max Speed
0  2012      3  Falcon      380.0
1  2013     10  Falcon      370.0
2  2014      7  Parrot       24.0
3  2015      4  Parrot       26.0
4  2015      5  Parrot       28.0
>>> indexed = df.set_index(["Year", "Month"])
>>> indexed
            Animal  Max Speed
Year Month
2012 3      Falcon      380.0
2013 10     Falcon      370.0
2014 7      Parrot       24.0
2015 4      Parrot       26.0
     5      Parrot       28.0
>>> indexed.loc[indexed.index.get_level_values("Month") > 4]
            Animal  Max Speed
Year Month
2013 10     Falcon      370.0
2014 7      Parrot       24.0
2015 5      Parrot       28.0
>>> indexed.loc[indexed.index.get_level_values("Month") > 4].loc[2015]
       Animal  Max Speed
Month
5      Parrot       28.0
>>>
You can select any year you want as shown
Here I first index my dataframe (multi-index aka composite key). Then I filter all the rows by those with month > 4, and finally I get the row(s) with year == 2015.
faint patio
i just think a lot of code is missing
do i add this to my original code?
changed ofcourse
iron basalt
Idk, do what you need to do. This is just an example.
 spark dirge
 dusky furnace
How I make bitcoin
dusky furnace
How I make bitcoin
Check out: https://ethereum.org/en/developers/. More javascript and golang than python maybe though.

ethereum.org
Documentation, tutorials, and tools for developers building on Ethereum.

 viscid drift
hi, anyone familiar with cnf-response module for AWS?
misty flint
i have this numpy array

im trying to insert these two 1d arrays

i cant actually use np.insert bc it just pushes the zeroes down, expanding the array
ive also tried copying the array over but i think theres a shape problem
do i need to concatenate the 2 1D arrays first? then try copying over?
 hasty grail
training_data has shape (24, 2), but your blue and green arrays have shape (24,), making them incompatible
misty flint
should i do hstack first then?
hasty grail
Not sure what are you trying to do
misty flint
just trying to replace the zeroes with the 2 arrays instead
hasty grail
Just assign a brand new array
training_data = np.stack([blue, green], axis=1)
misty flint
yeah thats what i should do tbh
idk why our prof wants us to try to insert it into an array of zeroes
misty flint
hasty grail
xD
hasty grail
it's called slice assignment
misty flint
also i tried to hstack but the shape ended up being (48,)
hasty grail
!e
a = [1, 2, 3, 4, 5]
a[2:5] = [10, 11, 12]
print(a)

arctic wedgeBOT
@hasty grail :white_check_mark: Your eval job has completed with return code 0.
[1, 2, 10, 11, 12]


