#data-science-and-ml
1 messages · Page 288 of 1
 real wigeon
```, arrow is a library i use for manging time data, however from what ive googled this is more of an sql/pandas issueim looking at this stack overflow post

Stack Overflow
I'm trying to load a pandas dataframe to a mysql table using Sqlalchemy.
I connect using; engine = create_engine("mysql+pymysql://user:password@ip:port/db")
I am then simply running;
df.to_sql(con=
but i dont understand how im supposed to actually do the correct conversion when im defining the dataframe, im not sure how thats accomplished
 exotic maple
panda has read_sql generator for dataframes, perhaps try that one?
pd.read_sql, i hink it is.
ive never used mysql and pandas together tbf
 quiet locust
Hi guys I have a simple question
With the pandas library
Is it different to use the functions in pandas then simply using python
For example
So I have this pandas dataframe and I want to iterate over a column for a certain value. I know I could use df.loc to locate that value but I want to practice writing functions with if-else statements. Is it possible to do tha
 severe valve
i mean it probably is, but I wouldn't waste my time with that. get familiar with Pandas functions first. Then maybe you can use certain Pandas functions within your function i guess if that makes sense.
@quiet locust
 velvet thorn
quiet locust
Is it different to use the functions in pandas then simply using python
velvet thorn
quiet locust
Is it different to use the functions in pandas then simply using python
you should not
it’s not idiomatic
quiet locust
Plz explain??
I feel like I have a good grasp of pandas
What I’m not comfortable with is regular functions in python
Hence why asking
 abstract zealot
wht u trying to do?
iterate over rows in a column?
iterate over a specific value in a column?
quiet locust
Iterate over a column for a specific value
For example I only want the value “restaurants” from this column which includes other categories
I know it’s easy asf with pandas but I wanna try a function
velvet thorn
quiet locust
I feel like I have a good grasp of pandas
trust me... you don’t
better for me to be direct here
quiet locust
velvet thorn
trust me... you don’t
Lmfao ok ok
Yeah I respect that
So do I continue learning pandas documentation?
velvet thorn
quiet locust
What I’m not comfortable with is regular functions in python
I’d suggest you work on that with other projects
defo a good thing but it’s like
trying to push a car around to get stronger
you could...but that’s not what the car is for
and there are more efficient methods
if you wanna do something DS related
velvet thorn
thank you for being understanding
velvet thorn
quiet locust
What I’m not comfortable with is regular functions in python
do you know what functional programming is
one way you can maybe combine the two is write a FP-oriented library for data processing
not specifically numeric computation like pandas/numpy are
velvet thorn
quiet locust
So I have this pandas dataframe and I want to iterate over a column for a certai...
another reason is that you can do a lot of things with apply
but it’s a very bad habit to reach for it first
because it’s inefficient and encourages not knowing the “proper” solution
quiet locust
I don’t know what functional programming is exactly
When I get home I can send the data I’m working with
That may help
I’ll @ you when I send it
velvet thorn
quiet locust
I don’t know what functional programming is exactly
pandas takes a fair bit of inspiration from some FP principles
so it’s good to know the basics at least
quiet locust
So what do you suggest in particular
Just to give you some background
I did a bootcamp through uc Berkeley for data analytics and visualization last year
For about 6 months
That was my first time being introduced to data analytics and data science
velvet thorn
quiet locust
So what do you suggest in particular
for?
if you wanna do DS my advice would be to get a proper grounding in software engineering
take on some non-DS projects that require you to architect good software
DS coding is often too adhoc IMO
like knowing the basics of data engineering, for example, would be relevant
quiet locust
Okay for sure I will pay attention that and do some research
Thanks @velvet thorn appreciate your advice my guy
velvet thorn
quiet locust
Thanks <@171929073063297024> appreciate your advice my guy
yw 👋
 misty flint
this is good advice. i feel like i need to learn 1) software engineering design principles, 2) databases, 3) distributed systems, 4) ds&a, 5) networking
along with data science to get a good foundation
velvet thorn
misty flint
this is good advice. i feel like i need to learn 1) software engineering design ...
I'm not sure why many people consider DSA a separate topic
it's like
you will use DSA in more or less everything you do
misty flint
part of programming?
velvet thorn
like what's one of the first few things you learn in Python?
lists, tuples, dicts
🥴
misty flint
yeah but i feel like i have to explicitly list it out or else i will keep forgetting to work on it
velvet thorn
misty flint
yeah but i feel like i have to explicitly list it out or else i will keep forget...
fair enough
knowledge of a wide range of data structures, at least, is useful
especially in ML
not many people know, for example, how KNNs are commonly implemented
(hint: exhaustive search gets slow real quick)
velvet thorn
misty flint
i wonder if working with c/c++ data structures would help
hm
well
depends on what you wanna do?
one thing that might be nice
is implement your own versions
of common DS
in a lower-level language
like C/C++
misty flint

velvet thorn
Python is a bit too high-level for that to be useful IMO
misty flint
yeah to really practice those skills, i see
velvet thorn
misty flint
yeah to really practice those skills, i see
the thing is
implementing a DS
is different from knowing when to use it
that said, it does help you appreciate the time complexities of common operations
velvet thorn
misty flint
do you have any books you recommend. im kinda a book guy but its ok if you dont
not a book person, sorry
I prefer tinkering with stuff
severe valve
Does anyone know if this problem would be more suited towards regression or classification?
So basically, I'm attempting to predict a wildfire using historical weather data, using a random forest. So far it has a varying accuracy between 45% - 93% on certain datasets. But after looking at the data, I'm not so sure if classification is really the way to go.
Basically my data is temperature, wind speed, relative humidity, and soil temperature between 0-7 cm above/below ground.
This is all hourly as well and the data can go all the way back to the 1950's
 blazing bridge
severe valve
Does anyone know if this problem would be more suited towards regression or clas...
blazing bridge
severe valve
Does anyone know if this problem would be more suited towards regression or clas...
Someone more experienced could correct me if I am wrong but this task seems to be a classification task. This is because you are predicting if a wildfire would happen or not (ex: 1 for True and 0 for False). Since you are not predicting a continuous value, it wouldn't be a regression task. Try experimenting with different features or even normalizing your features to put them at the same scale. I think that may help and you could also try standardizing the data as well. I hope that helps a bit.
severe valve
@blazing bridge thats what I thought as well. I'm also quite inexperienced as I have zero idea what normalizing features / putting them on the same scale means lol. I'll look into. Thanks a ton! have a great day. :)
 torn dove
I'm working on a detection system, and I'm having trouble with how to save images after the bounding boxes have been annotated during the detection process. I need to be able to manually check whether or not the detections are accurate to modify my models going forward.
In the event nobody sees this until later and has an answer, just send it to me. Questions about the problem and a look at the code are cool too. Happy to share the repository with interested parties
 lilac geyser
Hello
Recently I was going through Hypothesis testing.
What I understood after listening to the introduction to hypothesis testing is.
So basically hypothesis testing is nothing but.
When we take the sample data from population and try predicting the population parameters. Whatever we get the population parameters from the sample data will be judged whether to reject or not...
This process is known as hypothesis testing.
Is my understanding correct?
Please help me!
@tidal bough
 topaz cipher
Based on video of person, you'll have to derive characteristics like what person has wear, how are their features (face, hairstyle, body type etc). Create a recommendation of clothes, based on these derived features
How will you derive data for this use case, what will be the manual work required to label the data, what will be the pre-processing steps, what models are going to be used for this use case etc.
I am just a beginner in ML, can anyone help me with this question?
misty flint
lilac geyser
Hello
Recently I was going through Hypothesis testing.
What I understood after l...
with hypothesis testing you have to explicitly state both your null and alternative hypotheses and the alpha/confidence level you are testing at
lilac geyser
Was my understanding wrong?
lilac geyser
Ok ok
I just wanted the basic thing that's all
I known that we need to give null and alternate hypothesis and doing some calculations we will be deciding to accept or reject null hypothesis
Thanks for the help @misty flint
💚💚💚
lilac geyser
misty flint
if others have more to add feel free
Yes please
I can get better understanding!🙏
misty flint
topaz cipher
Based on video of person, you'll have to derive characteristics like what person...
this is more of an open-ended question. theres not a "right" answer per se. its testing 1) your business sense and 2) your data science problem-solving skills -- i would really think about the question and how you would approach it
another question is, how are you designing the recommendation system? it says "based off a video of a person". does that mean a video of that specific person or general videos of people + fashion
topaz cipher
misty flint
another question is, how are you designing the recommendation system? it says "b...
Its a video of a single person only
misty flint
and yes, "how WILL you derive data?" questions to consider are: are you grabbing a bunch of images online that have different people in "fashion" and then using that to train your model or what?
1 video of 1 person? or multiple videos showing you what that one person likes to wear?
the question isnt clear to me
topaz cipher
misty flint
and yes, "how WILL you derive data?" questions to consider are: are you grabbing...
I have no idea how to derive the data
misty flint

misty flint
topaz cipher
I have no idea how to derive the data
i think fashion mnist would be a good place to start

An MNIST-like dataset of 70,000 28x28 labeled fashion images
topaz cipher
Thank you so much
misty flint
np and definitely take a look at that dataset and see if you can apply some similar ideas to the question
topaz cipher
👍
 astral path
how do I conditionally format seaborn axis labels?
this is what I have so far

but I want to include the artist (which is a column in this dataframe) in the y axis label as, say "Zeeland - Mindset" (artist is Zeeland, track is Mindset) rather than just "Mindset"
also how do I escape words that start with the char $?
if you look at the label My First Time Dying *hristal, *hristal Eye), it's supposed to be My First Time Dying ($hristal, $hristal Eye) but the $ is interpreted as markup
thanks!
misty flint

idk but it is an interesting problem
i feel like you always have the interesting problems

astral path
Lol thanks
I always have the most weird issues with CS related things no matter how much experience i have
 hasty grail
 cedar sonnet
can anyone can help me with graph programm 🙂 ?
cedar sonnet
can anyone can help me with graph programm 🙂 ?
Just ask your question. If anyone can help you they will answer
cedar sonnet
lzts gooo
Hi! I wanna a simple graphe with all the argument (a) in label, but i only have hundred graph and then error
where i need to put the for a in [1,0.5,0.1]: ?
fig= pyplot.figure()
for a in [1,0.5,0.1]:
    x_list=[]
    y_list=[]
    for i in range(npoint+1):
        x=xmin + i* pas
        x_list.append(x)
        y_list.append(fa(x,a))
        x=1
        pyplot.plot(x_list,y_list, label = 'a ='+ str (a))

pyplot.title('fa')
pyplot.xlabel('x')
pyplot.ylabel('y')
print(a)
pyplot.show()
 lapis sequoia
Does ETL include prepping the data before running it through a neural network, or is it purely the function of dragging data into the database in preparation for use by the system
cedar sonnet
purely the foncton of dragging data into database, it's exercice to learn python programm to scientist recherch ( the beginning so we😅)
velvet thorn
lapis sequoia
Does ETL include prepping the data before running it through a neural network, o...
that depends
on what kind of preparation
 short heart
How can I maximize usage of LogisticRegression?
velvet thorn
that would fall in the "T" step
in general specialised kinds of preparation, like tokenising, would probably not go there
but you might see, for example, imputation
velvet thorn
astral path
if you look at the label `My First Time Dying *hristal, *hristal Eye)`, it's sup...
you need to escape the $ with \
matplotlib interprets $ as start/end LaTeX
lapis sequoia
velvet thorn
that depends
Like right now I'm doing image processing with a CNN. Would my API to twitter dragging out the images and putting them into my hard drive be the entire ETL, or would changing all the dimensions, greyscaling, augmenting etc also count as ETL
velvet thorn
lapis sequoia
Like right now I'm doing image processing with a CNN. Would my API to twitter dr...
okay
basically
the "L" step
is when it's transferred to persistent storage
so the question is
do you store the raw images?
lapis sequoia
yes
lapis sequoia
entry_images = entry_images.astype('float32')
entry_images /= 255```

Then I use something like this before my Keras model to prepare it for sequencingextract - get data from somewhere
transform - process it in some way
load - save to persistent storage
"transform" is everything before "load"
lapis sequoia
What would this step be then?
velvet thorn
data preprocessing?
velvet thorn
operating on the result of your ETL workflow
depends.
generally, yes
for images
lapis sequoia
Or would you normally save everything formatted beforehand
velvet thorn
lapis sequoia
Or would you normally save everything formatted beforehand
no
because
you might want the raw data
lapis sequoia
What would T even be in my case?
The API just drags from twitter, checks if it's an image, and if it is, saves it in my hard drive as an anime
velvet thorn
lapis sequoia
What would T even be in my case?
nothing
or the identity transform, if you want to be particular
lapis sequoia
So ETL -> preprocessing -> processing -> analysis would be the obvious workflow
velvet thorn
lapis sequoia
So ETL -> preprocessing -> processing -> analysis would be the obvious workflow
uh
normally "preprocessing" is like "pre-usage processing"
 chilly pasture
Hi I am working on a deep learning project for which I need a hindi to english translator. When I used external python packages like googletrans, goslate they are getting timed out stating "Too many requests". Then I came to know that we can use google cloud translate api directly but for that we need a trial account which gives 300 dollars free credit. To open a trial account it is asking for credit card, which I don't have. Is there a way for me to open a google cloud platform account without credit card? I am also open to any alternative suggestions for a hindi english translator.
 grave frost
chilly pasture
Hi I am working on a deep learning project for which I need a hindi to english t...
grave frost
chilly pasture
Hi I am working on a deep learning project for which I need a hindi to english t...
use colab, translate in chunks. Don't put the credit card
if by some miracle you have PayPal, use it
 cold stump
When chunking with NLTK should I be doing that with tokenized sentences or is just tokenizing the whole paragraph and chunking that okay?
 silk marsh
Anyone up for project collaboration.?
silk marsh
Stock prediction with GUI
grave frost
is it for a project or do you want some actual financial gain
lilac geyser
The critical F value with 8 numerator and 29 denominator degrees of freedom at alpha = 0.01 is
How can we calculate the F value without the table?
astral path
velvet thorn
you need to escape the `$` with `\`
i understand how escaping them works in a normal string, I just have no clue how to format it to axis labels
 twilit imp
Guys, i have this data:
weights = [0.6466213557229189, 0.16675178829485038, 0.5429099879496979, 0.7827968514311152
, 0.359522882584691]
bias = 0.11431804700550019
output = 0.9999996776896098
Can anyone explain me why the output is so huge all the time?
im using a sigmoid function in the output btw
the problem is, all my neurons do this weird thing where they make the output very large.
And that results into the output always being 1.0
def sigmoid(x):
    return 1.0 / (1.0 + math.exp(-x))

def sigmoid_der(x):
    return x*(1.0-x)
```^sigmoid func im using def forward_propagate(self, row):
next_inputs = row
for layer in (self.layers):
hidden_neurons = []
for neuron in layer.neurons:
neuron.activate(next_inputs)
print(f"{next_inputs}")
print(neuron.weights)
print(neuron.bias)
print(neuron.output)
hidden_neurons.append(neuron.output)
next_inputs = hidden_neurons
output = next_inputs
exit()
return output```
^feedforward functhe exit() func in my feedforward func is for debugging purposes
 arctic wedgeBOT
Hey @earnest wadi!
Uh-oh! It looks like your message got zapped by our spam filter. We currently don't allow .txt attachments, so here are some tips to help you travel safely:
• If you attempted to send a message longer than 2000 characters, try shortening your message to fit within the character limit or use a pasting service (see below)
• If you tried to show someone your code, you can use codeblocks
(run !code-blocks in #bot-commands for more information) or use a pasting service like:
 earnest wadi
model.compile(optimizer=optimizers.Adam(5e-4), loss='mean_squared_error')
model.summary()
model.fit(x_train, y_train,
          batch_size=2048,
          epochs=1000,
          verbose=1,
          validation_split=0.1,
          callbacks=[callbacks.ReduceLROnPlateau(monitor='loss', patience=10),
                     callbacks.EarlyStopping(monitor='loss', patience=15, min_delta=1e-4)])
above code is giving traceback as seen in the pastebin below
cold stump
Is anyone here familiar with NLTK? I am trying to identify key phrases and words in a set of documents I have. I also want to calculate the TF-IDF for these. I am not sure about ordering though. For example I want to do the following steps
For each document->
  tokenize
  remove stop words
  extract phrases (part of speech tagging and chunking)
I then want to combine all words and phrases into a set to calculate TF-IDF
My issue is, If I remove stop words it seems that I don't get very good phrases
So should I be calculating phrases and then removing stop words?
My fear is that would mean stop words would still be present in phrases
I feel this is probably a pretty common use case of NLTK so I would expect there is some standard for approaching this sort of problem
grave frost
I have no idea what TF-IDF Is but you can use tokenizer from NLTK for tokenization, remove stop words only if you are going to use a Deep Learning model
cold stump
This is for an Information Retrieval project, TF-IDF is Term Frequency * Inverse Document Frequency It is a way of calculating the relevance of each unique term in a series of documents. I need to remove stop words as I will be indexing this into elasticsearch and it would be inefficient to have them,
grave frost
calculating the relevance of each unique term
Stop words are not unique, so I guess you would be allright if you removed them
cold stump
I have another more NLTK specific question.

Example of my tree structure
I have a list of string to contain both words and phrases
 late schooner
wow
cold stump
I need to read chunks in as single concatenated strings
and words in as well words, Just reading the value of the leaf essentially
 iron basalt
Just write the idea (and give context).
 untold cove
Hi all, hoping to get a dash expert that would be able to help me here. I have this code that currently shows scores of all people however, I was to now add another spreadsheet that puts these score into groups via another spreadsheet. Here is my code currenlty:
import dash
import plotly.express as px
import pandas as pd

df = pd.read_csv("DATA.csv")

print(df.loc[:100, ['Family name']])

import dash_html_components as html
import dash_core_components as dcc
from dash.dependencies import Output, Input

app = dash.Dash(__name__)
app.layout = html.Div([
    html.H1("Graph Analysis of SCORE Data"),
    dcc.Dropdown(id='choice',
        options=[{'label':x, 'value':x}
        for x in sorted(df.SCORE.unique())],
        value='Username'
        ),
    dcc.Graph(id='my-graph', figure=px.histogram(data_frame=df, y='SCORE', x='Username') or {})

    ])

@app.callback(
    Output(component_id='my-graph', component_property='figure'),
    Input(component_id='choice', component_property='value')
)
def interactive_graphing(value_choice):
    print(value_choice)
    dff = df[df.SCORE==value_choice] #only there rows appear not the whiole dataframe
    figure= px.bar(data_frame=dff, x='SCORE', y='Username')
    return figure


if __name__ =='__main__':
    app.run_server()
I was to change this, so in my other spreadsheet it is shown like so:
USERNAME1 class1 class2 class3
USERNAME2 class3 class4 class1
etc etc, Im wanting my dash board to have the dropdown select the class and in that class have all the people and their scores from the DATA.csv file.
I need some help, can anyone assist me with this please?
iron basalt
untold cove
Hi all, hoping to get a dash expert that would be able to help me here. I have t...
"other spreadsheet", I don't see any spreadsheets (I am assuming you mean DataTable). Can you make a small sketch to show what you envision your UI to look like?
 frank echo
Im having probems installing imageai can I get help
grave frost
@frank echo just post your error here
grave frost
Imma out here in a minute anyways
frank echo
The problem im having is that I dont think I installed imageai with the version of pip associated with the python installation I have
grave frost
so prob wont be able to help you
frank echo
Alright
grave frost
frank echo
The problem im having is that I dont think I installed imageai with the version ...
k. whats the command you used
grave frost
which OS?
frank echo
When I use visual studio, python, 3.7 and 3.9
 calm thicket
windows i'm guessing
calm thicket
are you using a virtual environment
grave frost
pip install imageai or pip3 install imageai
calm thicket
hm, no
grave frost
wdym?
frank echo
idc at this point I just want it to work so i installed it on visual studio and standalone
Im testing python 3.9
grave frost
did you try the above commands?
grave frost
both of 'em?
grave frost
then you have some problem with your installation
calm thicket
uh, no
frank echo
Nope
calm thicket
you're using python 3.9 right?
frank echo
I installed 4 versions of it
calm thicket
what
calm thicket
4 versions of what
frank echo
python
calm thicket
which version do you want to use
frank echo
whatever version is functional
calm thicket
that's probably all 4 that you downloaded
frank echo
I downloaded 3.9 and 3.7 standalone and visual studio
calm thicket
visual studio doesn't give you a version of python
grave frost
You would had better luck following a tutorial
frank echo
...
grave frost
or a Youtube video
calm thicket
grave frost
You would had better luck following a tutorial
not helpful
frank echo
Im literally using visual studio python right now
calm thicket
let's move to a help channel, this isn't a data science problem
frank echo
alright
astral path
I'm trying to plot a time series as a line plot

however, for some reason, the last two months are put at the very end of the plot
I'm looping over some dataframes to produce this result

these are a couple examples
any ideas why this might be occuring?
 sturdy belfry
anyone have an idea ahow i can automatically omit outliers in my dataset?
im scraping the price for an item and some items are priced really high like 500 for a 200 avg item
exotic maple
@sturdy belfry you should define those outliers first, either statistically or holistally.
After you should be able to just mask them away
Something like
Df[Relevant Column] < Target Value
That creates the mask
And if you apply the mask to the DF it only keeps the values where the mask ks true
sturdy belfry
That will work but i also want to be able to define it in an automatic way
like i give it a tolerance of say 20% and it will cut out outliers more conservatively or more strictly. Yk?
exotic maple
Define "automatic" because that sounds like something you should from the data source itself
If you cant query the data source you need to script it regardless
Since you mention 20% you just need to find the appropiate percentiles.
And mask away from there
Value > (pct20%) & Value < (pct80%)
iron basalt
@sturdy belfry What is your standard deviation?
sturdy belfry
Alright ill try to explain what I want to create more accurately. I want to be able to have a dataset and a tolerance value. Tolerance value can be any unit or whatever, its just a value indicating how harshly or generously it will cut out outliers. Then I get a dataset with no outliers using those two arguments
sturdy belfry
iron basalt
<@!383842702070120449> What is your standard deviation?
idk ive never taken any math over grade 9
iron basalt
@sturdy belfry Learn about mean, median, mode, variance, standard deviation, and z-scores.
sturdy belfry
Ooooohhhhhh
that makes sense yeah, id need to calculate the standard deviation first
iron basalt
what you can do is use z-scores and 3 standard deviations to filter outliers.
the standard deviation can be used to get an upper and lower filter bounds.
sturdy belfry
what datatype are SDs held in?
iron basalt
float
sturdy belfry
SDs are numbers?
iron basalt
yes
sturdy belfry
how does that work
iron basalt
here is a definition: "In statistics, the standard deviation is a measure of the amount of variation or dispersion of a set of values.[1] A low standard deviation indicates that the values tend to be close to the mean (also called the expected value) of the set, while a high standard deviation indicates that the values are spread out over a wider range. " - wikipedia
astral path
i figured out my issue but don't know how to solve it
not all of my artists have the same # of month values, and artists that have earlier month values are sometimes added after and artist without those values
so when I'm plotting it, it will plot the earlier month values after the later month values
any ideas how to fix this or how to sort a multiindex by # of child indices?
sturdy belfry
@iron basalt Is the term Argument basically the same in math as is with programming? Could I say something like "Using these two arguments how can I build a function to isolate outliers" to a maths person and they'd understand?
astral path
parameters, arguments, whatever but yeah
you're taking some input and creating a function/method/procedure to get some output
iron basalt
Yeah they will understand you. The specifics go roughly something like this: arguments are what come in the parenthesis like f(x) = a * x + 10. Here x is an argument, but a is a parameter, it just comes from somewhere, typically it is some value that is meant to be tuned and is under your control, while the argument comes from the environment / outside world and may not be under your control. @sturdy belfry
lapis sequoia
how would I decide on a kernel size for a convolutional neural network
 thorn bobcat
sturdy belfry
thorn bobcat
sturdy belfry
brain
 frank heart
Would anyone use a python video editing framework? i.e.
video = VideoFile('input.mp4')

movie = Movie(video.width, video.height, [video])

# (Use ml to manipulate video)

movie.record('output.mp4',  framerate=25)
What do you think possible use-cases for this would be?
 waxen pivot
Anyone would like to talk
untold cove
@iron basalt ideally I’m trying to make it look like this:
Instead of ‘Fred Anderson’ have the class selected from one of the columns, on the x axis have the username of all the users in that class, then on the y axis have the score index.

 chrome skiff
anyone knows how to verify email addresses if it is legit or not
iron basalt
@untold cove Something like this:
import pandas as pd
from dash import Dash
import dash_html_components as html
import dash_core_components as dcc
import plotly.express as px
from dash.dependencies import Output, Input

df = pd.DataFrame(
    {
        "month": ["january", "february", "march", "april", "april", "december"],
        "year": [2012, 2014, 2013, 2014, 2012, 2013],
        "sale": [55, 40, 84, 31, 77, 21]
    }
)

unique_years = df.drop_duplicates(subset="year", keep="last")

app = Dash("my app")

app.layout = html.Div([
    html.H1("Graph Analysis of Sale Data."),
    dcc.Dropdown(
        id="choice",
        options=[{"label":str(i),"value":i} for i in unique_years["year"]],
        value=df["year"][0]
    ),
    dcc.Graph(id="chart")
])


@app.callback(
    Output(component_id="chart", component_property="figure"),
    Input(component_id="choice", component_property="value"))
def on_choice(choice):
    return px.bar(df[df["year"] == choice], x="month", y="sale")


app.server.run(debug=True)
@frank heart Already exists: https://pypi.org/project/moviepy/
 frank heart
Yeah, but it doesn't offer gpu acceleration afaik
This would use opengl for rendering, and you could use glsl to write custom effects
iron basalt
moviepy gives you the frames as numpy arrays, just feed those to whatever modifying code you want.
Clip.transform is what you are looking for, just pass that a function that applies the gpu computed effects.
or just manually get_frame
frank heart
That involves a lot of copying from gpu to cpu and vice-versa. You copy the frame from the cpu to the gpu, do the processing in the gpu, and then copy it back to the cpu to return to moviepy.
I'm suggesting only copying from the cpu to the gpu. So you read the video frame into memory, send to opengl (gpu), render with modifying shader, and that's it. When saving the video, you send the entire rendered frame back to the cpu to convert into a video file, but if you are compositing multiple videos, you only need to send the composited result back to the cpu, not each video
i would also include built-in hardware accelerated effects
would you use something like that?
iron basalt
I'm not exactly sure that I follow. You have to copy all frames to be modified from the cpu to the gpu. And all the resulting frames back to the cpu to be saved. "When saving the video, you send the entire rendered frame back to the cpu to convert into a video file" I assume you meant "frames" (plural).
frank heart
I meant frame, but you would repeatedly send each frame back to the cpu. The point I was trying to make was that if you mix multiple videos, you only need to send each frame back to the cpu one time
iron basalt
You can already only send it back once.
frank heart
In moviepy, you send each clip back to the cpu after you gpu-modify it, and then mix it right?
iron basalt
I guess what I meant is that I don't see how this is a limitation on moviepy's part
Yeah you can modify a clip on the gpu by processing each frame on the gpu.
frank heart
clip.transform(... function that uses gpu ... )
i'm not sure how clips are composited, lemme look at the source code
iron basalt
Transform is a convenience method that just calls get_frame for each time t.
and passes that to the function that you provide
iron basalt
no the frames are
frank heart
frame*
iron basalt
the clip itself is an object holding multiple frames, transform applies the given function to each frame that it holds
frank heart
yeah, typo
iron basalt
so yeah each frame would (in your function provided) send to gpu, and then get the result back from the gpu.
frank heart
ok, right, unless the composited video result is being modified, in which case there is no said performance issue
But when different videos being composited are being modified separately, my method would theoretically have a performance gain
and that's a pretty important use case, wouldn't you say?
iron basalt
you mean you are compositing multiple videos in parallel?
iron basalt
So when chroma keying two videos you would have two clips
clip a from video a and clip b from video b
Lets say you are modifying a with b
if you transform a, you can in your function provided, also get a frame from b and pass both frames from a and b to the gpu and get the result back
iron basalt
sure but i gotta go soon
 vivid cairn
Does anyone who what are some common approaches for going from classifying i.e. "Cat", "Dog", "Bird" into more discernable classes like "Red Cat", "Merle Cat" "Dog", "Bird". In some sense, red and merle are properties of Cats, so it does not make much sense to just expand classes into more detailed classes? I seem to be unable to ask Google the right question.
velvet thorn
vivid cairn
Does anyone who what are some common approaches for going from classifying i.e. ...
hm
that depnds
on whether the classes are mutually exclusive
if so, why not?
 blissful hound
grave frost
<@457604973891420162>\
blissful hound
grave frost
<@457604973891420162>\
yeah?
vivid cairn
velvet thorn
on whether the classes are mutually exclusive
Yes they are. Im curious though. How does specialization scale within data driven models? I guess I have no intuition about which approach to choose: one model with many classes or multiple models to for first classifying "cat" then another for which type of fur?
grave frost
Quick question - is it a good idea to remove stop words when fine-tuning the dataset to a medium sized model?
 ripe forge
vivid cairn
Yes they are. Im curious though. How does specialization scale within data drive...
ripe forge
vivid cairn
Yes they are. Im curious though. How does specialization scale within data drive...
I think the answer is purely emperical here. Which basically means "no one knows, it depends. Just try it" type of deal 😅
Also i should note that if you do break it into multiple steps, not all steps have to be model based. You can choose to do some steps with just rules
There's also an approach where you build this model as if it's a granular single model, but one of the features is predictions from your broad model.
vivid cairn
ripe forge
I think the answer is purely emperical here. Which basically means "no one knows...
This is the curse of machine learning I guess.
Yeah, the compositional part of breaking up the model is somehow appealing from a developer point of view. Also, I tend to find my self thinking that one model to rule them (output classes) all would work good in an end-to-end training type of scenario? Whereas having multiple models connected systematically can suffers from the bias we have about cats and their properties.
untold cove
@iron basalt This is what im trying to do, i commented out what im trying to get from each spreadsheet:
import dash
import plotly.express as px
import pandas as pd

df = pd.read_csv("DATA.csv") #this data has the usernames and their score, the usernames fall in the range E colume range, however it doesnt start until row 12 for the headers but i can remove this if i have to with a function maybe? The score is on  col AV row 13 for headers and score following down.
df2 = pd.read_csv("DATA2.csv") #this is the spreadsheet where i want to match USERNAMEs from col A, get the classes from all the other rows that follow and have the classes in the drop down.This is the one i struggle with as it has no headers and is like so:
#Username1, class1,class4, class3 etc etc
#Username2, class2, class5, class6 etc etc

import dash_html_components as html
import dash_core_components as dcc
from dash.dependencies import Output, Input

app = dash.Dash(__name__)
app.layout = html.Div([
    html.H1("Graph Analysis of SCORE Data"),
    dcc.Dropdown(id='choice',
        options=[{'label':x, 'value':x}
        for x in sorted(df.SCORE.unique())],
        value='Username'
        ),
    dcc.Graph(id='my-graph', figure=px.histogram(data_frame=df, y='SCORE', x='Username') or {})

    ])

@app.callback(
    Output(component_id='my-graph', component_property='figure'),
    Input(component_id='choice', component_property='value')
)
def interactive_graphing(value_choice):
    print(value_choice)
    dff = df[df.SCORE==value_choice] #only there rows appear not the whiole dataframe
    figure= px.bar(data_frame=dff, x='SCORE', y='Username')
    return figure


if __name__ =='__main__':
    app.run_server()
So it appears something like this with the classes in the drop down that are colelcted from df2:
 ripe forge
vivid cairn
This is the curse of machine learning I guess.
Yeah, the compositional part of...
ripe forge
vivid cairn
This is the curse of machine learning I guess.
Yeah, the compositional part of...
Potentially, but there's also a tradeoff that it's a much harder problem for a model to differentiate so many things at once
So it's generally tough to decide without actually seeing the performance I believe
vivid cairn
ripe forge
So it's generally tough to decide without actually seeing the performance I beli...
Great advice! Thanks for chiming in.
untold cove
Does anyone know how I could group data that don’t have headers? Like create a list from col B to col N and grab the users in col A, then when I print a value from one of the columns it will list all users in that dataset. Data looks like this: user1, class4, class3,class11 etc etc row by row.
 odd ruin
Guys, about max_iter in iterativeimputer, does higher the number the better?
 severe python
@iron basalt so basically, i added the option at the beginning to search by acro, parent, or account. it worked, but i need error handling. now, i get the initial error message even on correct input. would love if you could take a look:
from tabulate import tabulate
from termcolor import colored

class bcolors:

    FAIL = '\033[91m'


while True:
    try:
        variable = input("Search by Acronym / Parent / Account?    ")

        if variable != "Acronym" or "A" or "Parent" or "Account":
            print("Please try again")
            continue

        if variable == "Acronym" or "acro" or "acronym" or "a":
            input1 = input("Please provide an Acronym:   ")
            df = pd.read_excel("accounts.xlsx")
            df = df.set_index('Acronym')
            result1 = df.loc[input1]
            print(tabulate(result1, headers='keys', tablefmt='psql'))

        elif variable == "Parent" or "parent" or "p":
            input2 = input("Please provide a Parent ID:   ")
            df = pd.read_excel("accounts.xlsx")
            df = df.set_index('Parent')
            result2 = df.loc[input2]
            print(tabulate(result2, headers='keys', tablefmt='psql'))

        elif variable == "Account" or "Acc" or "acc":
            input3 = input("Please provide an Account ID:   ")
            df = pd.read_excel("accounts.xlsx")
            df = df.set_index('Account')
            result3 = df.loc[input3]
            print(tabulate(result3, headers='keys', tablefmt='psql'))
    except KeyError:
        print("error")
 brisk stump
Hi! for a project for school I have to make a neural network. We didn't get any real explanation on how to start or whatsoever, only that we have to use scikit learn. My question would be: what would be a good place to start to learn about neural networks (without any knowledge about the subject) because it is pretty overwhelming searching online. Thanks!
 agile jolt
hey everyone, can someone inform me or give some good materials for uplift modelling?
misty flint
brisk stump
Hi! for a project for school I have to make a neural network. We didn't get any ...
start here https://youtu.be/CqOfi41LfDw

Neural Networks are one of the most popular Machine Learning algorithms, but they are also one of the most poorly understood. Everyone says Neural Networks are "black boxes", but that's not true at all. In this video I break each piece down and show how it works, step-by-step, using simple mathematics that is still true to the algorithm. By the ...
statquest is easy to understand imo
 winged yew
 ruby magnet
anyone know why I would be getting this error?
ValueError: With n_samples=1, test_size=0.1 and train_size=None, the resulting train set will be empty. Adjust any of the aforementioned parameters.
 austere swift
can you show some code
ruby magnet
`import pandas as pd
import seaborn as sns
df=pd.read_csv("C:/Users/ymaxn/Documents/Python Data Mining/USA_Housing.csv")
x=[["Avg. Area Income","Avg. House Age","Avg. Area Number of Rooms", "Avg. Area Number of Bedrooms","Area Population","Address"]]
y=["Price"]
from sklearn.model_selection import train_test_split
x_train,x_test,y_train,y_test=train_test_split(x,y,test_size=0.3,random_state=1)`
@austere swift
trying to make multiple linear regression and I cant proceed until I figure this error out
 west copper
you need x=df[[ (the rest of it) and y=df["Price"] -- I believe.
 limpid oak
are you selecting columns?
if you are using [[ ]] it means that you are calling dataframe
y=df["Price"] this will work
try for x also
x=df["Avg. Area Income"..........]
west copper
That's why it said they had one record, it accepted a list of list of strings that was the column selector
austere swift
@ruby magnet your y is literally a list that just contains "Price"
it doesnt have the values from the dataframe
 ashen forge
Hi everyone, I'm new in this world and I would like to introduce myself to data science. What should I do first?
austere swift
same with your x
limpid oak
ashen forge
Hi everyone, I'm new in this world and I would like to introduce myself to data ...
start with datacamp.com
austere swift
ashen forge
Hi everyone, I'm new in this world and I would like to introduce myself to data ...
for data science you need a pretty good background in linear algebra, statistics, and calculus
do you have those?
ashen forge
I'm currently studiyng in university those
ashen forge
limpid oak
start with datacamp.com
Ill try it thanks
austere swift
ok so you should be fine
i recommend starting by trying to do a simple project
and learning by doing
austere swift
the main tools are pandas, scikit learn, and numpy
west copper
That's about the most anyone will agree to 😆
austere swift
for project just try finding some simple dataset and doing some regression or analysis on that
theres some pretty good datasets on https://kaggle.com/datasets/
Download Open Datasets on 1000s of Projects + Share Projects on One Platform. Explore Popular Topics Like Government, Sports, Medicine, Fintech, Food, More. Flexible Data Ingestion.
ashen forge
I dont know a lot about this
limpid oak
your subject in Uni
ashen forge
Id like to be in a company doing some data reports like what customers most like or something like that
austere swift
the point is to learn by doing
find some tutorial on how to do something
then do it but dont copy the code
austere swift
try modifying what they do to use it for a different dataset or a doing a different analysis or something
ruby magnet
That worked, Thanks everyone! Cant believe i missed that
ruby magnet
adding df before the brackets, I missed that so it wasnt pulling from the Dataframe
for a question i asked earlier
limpid oak
are you using df[[...]] or df[]?
ruby magnet
for x it is df[[...]] but y is df[...]
astral path
If I'm trying to plot the count of a variable for each day over time, but I only have columns for year, month and day of month, how should I approach this?

my data looks like this, and what I'm trying to do as of right now is create a new column for day which contains a unique day value
should I just do something with the timestamp column?
 lavish swift
@astral path is the timestamp column your index? does pandas see it as a datetime? or as a object (string)
lavish swift
no worries! Glad ya got it working!
 meager acorn
not sure if this falls under data science, but
Stack Overflow
I am attempting to download a file from the CDC website by clicking a button in a dropdown menu (I would just access the file URL directly, but the blob URL seems to change every time the download ...
web scraping a csv file
severe python
have a question for someone: i added the option at the beginning to search by acro, parent, or account. it worked, but i need error handling. now, i get the initial error message even on correct input. (script to search excel file and print based on user input):
import pandas as pd
from tabulate import tabulate
from termcolor import colored

class bcolors:

    FAIL = '\033[91m'


while True:
    try:
        variable = input("Search by Acronym / Parent / Account?    ")

        if variable != "Acronym" or "A" or "Parent" or "Account":
            print("Please try again")
            continue

        if variable == "Acronym" or "acro" or "acronym" or "a":
            input1 = input("Please provide an Acronym:   ")
            df = pd.read_excel("accounts.xlsx")
            df = df.set_index('Acronym')
            result1 = df.loc[input1]
            print(tabulate(result1, headers='keys', tablefmt='psql'))

        elif variable == "Parent" or "parent" or "p":
            input2 = input("Please provide a Parent ID:   ")
            df = pd.read_excel("accounts.xlsx")
            df = df.set_index('Parent')
            result2 = df.loc[input2]
            print(tabulate(result2, headers='keys', tablefmt='psql'))

        elif variable == "Account" or "Acc" or "acc":
            input3 = input("Please provide an Account ID:   ")
            df = pd.read_excel("accounts.xlsx")
            df = df.set_index('Account')
            result3 = df.loc[input3]
            print(tabulate(result3, headers='keys', tablefmt='psql'))
    except KeyError:
print("error") ```@severe python Remove the try except and show me the error it shows. Also show your input.
severe python
@iron basalt

i removed the try except, as you can see it reverts to the error message even when I type Account or an acceptable input
grave frost
Whats that supposed to be?
class bcolors:

    FAIL = '\033[91m'
it's to output the error message as red, but i haven't put that in because i am having troubles with it anyways
iron basalt
Ok so that is not an error message, it's your own message that rejects the input.
When you write error message I am thinking of something that causes a crash.
severe python
no sorry, this is what i mean when i say my error message:
            print("Please try again")
continue```So first thing I notice is that you read the xlsx file every time, just read it once outside the loop at the start
severe python
true that's a waste
iron basalt
it will do more than make it not a waste
just do that first and then paste the code again, but with syntax highlighting please
severe python
how do i do that
iron basalt

Technipages
In Discord, you can separate text and make it really stand out with the use of code blocks. Code blocks change the background of the affected text but
last example, but python instead of css
severe python
import pandas as pd
from tabulate import tabulate
from termcolor import colored

class bcolors:

    FAIL = '\033[91m'

df = pd.read_excel("accounts.xlsx")

while True:
        variable = input("Search by Acronym / Parent / Account?    ")

        if variable != "Acronym" or "A" or "Parent" or "Account":
            print("Please try again")
            continue

        if variable == "Acronym" or "acro" or "acronym" or "a":
            input1 = input("Please provide an Acronym:   ")
            df = df.set_index('Acronym')
            result1 = df.loc[input1]
            print(tabulate(result1, headers='keys', tablefmt='psql'))

        elif variable == "Parent" or "parent" or "p":
            input2 = input("Please provide a Parent ID:   ")
            df = df.set_index('Parent')
            result2 = df.loc[input2]
            print(tabulate(result2, headers='keys', tablefmt='psql'))

        elif variable == "Account" or "Acc" or "acc":
            input3 = input("Please provide an Account ID:   ")
            df = df.set_index('Account')
            result3 = df.loc[input3]
            print(tabulate(result3, headers='keys', tablefmt='psql'))
what's also annoying is that the set index moves the column i want it to search for to column A -- but that's a diff problem
iron basalt
outside the loop
 iron basalt
Alright instead of variable != "Acronym" or "A" or "Parent" or "Account" use variable in df.columns
severe python
ok let me try that
ValueError: The truth value of an array with more than one element is ambiguous. Use a.any() or a.all()
ah wait
lavish swift
@severe python I think another issue might be that let's say you input "Account" - when you check that with if variable != "Acronym" or "A" or "Parent" or "Account": Only one needs to be true for it to eval as true. So with the "Account" input that evaluates to True, True, True, False (since Account is NOT "Acronym" or "A" or "Parent"
severe python
        if variable in df.columns != "Acronym" or "A" or "Parent" or "Account":
            print("Please try again")
            continue
this isn't right, right?
iron basalt
no it's not
severe python
ahh i see @lavish swift
iron basalt
I think you lack some basic python skills, maybe review some python basics
(Or you will keep asking me more and more questions)
severe python
"Alright instead of variable != "Acronym" or "A" or "Parent" or "Account" use variable in df.columns"
iron basalt
A very simple rule to follow is that when your code does not work, make it more simple.
severe python
isn't too specific
iron basalt
Right now you are trying to do the more complex thing of checking is variable is "Account" or "Acc", etc.
Just check for 1 thing
severe python
and your solution is to check for the column values right?
iron basalt
Yes
severe python
but how does that output an error
iron basalt
You can add the ability to do parts of columns later
severe python
i thought you were showing "if this doesn't match, print this error code"
iron basalt
variable not in
severe python
ok that makes sense
iron basalt
or not(variable in ...
severe python
yeah i realize the code is very messy and not simple
iron basalt
The problem is that you are tackling two problems at the same time. Getting data by inputting a column, and also being able to use abbreviations for column names.
severe python
well not really how i was envisioning it. i was thinking that the index is already set to say "Acronym" column, so it's basically referring it as "A" or "Acro"
when user inputs
i see what you mean in a way
if variable not in df.columns:
            print("Please try again")
            continue
that's what you wanted me to do right
iron basalt
yeah
severe python
but why is it when i type "Account" i get "Please provide an Acronym: " ?
iron basalt
Because you are using incorrect if statements that do not make sense. Again, please review python basics. You can't do if blah == a or b or c. It's if blah == a or blah == b or blah == c.
Or you can do if blah in [a, b, c].
severe python
why can't you?
isn't it just referencing what the user inputs? i read the "or" online
iron basalt
or is a boolean operator, it operators on booleans, anything else will cause strange behavior or a crash. In your case you applied or to a boolean variable == "Acronym" and a string "A".
Don't expect python to be written like English, just learn the rules for expressions.
severe python
can i create a variable to reference the "A" "Acro" "acronym"?
and use the if blah in [a,b,c] or no
iron basalt
yes
severe python
can't think of a way i can use the [a, b, c] because i'm referencing just "variable"
iron basalt
if variable in ["Acronym", "A", ...]
in operates on two values, an object (left side) and a collection (right side). A string is an object and a list is a collection. It returns a boolean value, which the if takes.
brisk stump
misty flint
start here https://youtu.be/CqOfi41LfDw
thanks! i'll look into it
severe python
okay i'm going to just stick with the if variable == "Acronym": so i don't make it complicated yet
last q squiggle then i won't bother you
when i do parent or account, it removes the acronym column which i need. i'm guessing this is the set index function?
 iron basalt
Don't use set_index, you don't need it.
severe python
  File "/Library/Frameworks/Python.framework/Versions/3.9/lib/python3.9/site-packages/pandas/core/indexing.py", line 895, in __getitem__
    return self._getitem_axis(maybe_callable, axis=axis)
  File "/Library/Frameworks/Python.framework/Versions/3.9/lib/python3.9/site-packages/pandas/core/indexing.py", line 1124, in _getitem_axis
    return self._get_label(key, axis=axis)
  File "/Library/Frameworks/Python.framework/Versions/3.9/lib/python3.9/site-packages/pandas/core/indexing.py", line 1073, in _get_label
    return self.obj.xs(label, axis=axis)
  File "/Library/Frameworks/Python.framework/Versions/3.9/lib/python3.9/site-packages/pandas/core/generic.py", line 3738, in xs
    loc = index.get_loc(key)
  File "/Library/Frameworks/Python.framework/Versions/3.9/lib/python3.9/site-packages/pandas/core/indexes/range.py", line 354, in get_loc
    raise KeyError(key)
KeyError: '2378DM'```df.loc[df[variable] == input]
df[variable] gets you the column with variable as its name. df[variable] == input gives you a boolean mask that has a bunch of True for the rows in which the values are equal to input. df.loc[df[variable] == input] Gets all rows with the given mask (where the condition is True).
severe python
do you mean add that line or replace result2 = df.loc[input2] with it
iron basalt
replace it
severe python
but i'm still referencing result1, result2, result 3 in this line:
print(tabulate(result1, headers='keys', tablefmt='psql'))
iron basalt
result1 = df.loc[df[variable] == input1] etc
severe python
output

import pandas as pd
from tabulate import tabulate
from termcolor import colored

class bcolors:

    FAIL = '\033[91m'

df = pd.read_excel("accounts.xlsx")
print(df.columns)

while True:
        variable = input("Search by Acronym / Parent / Account?    ")

        if variable not in df.columns:
            print("Please try again")
            continue

        if variable == "Acronym":
            input1 = input("Please provide an Acronym:   ")
            result1 = df.loc[df[variable] == input1]
            print(tabulate(result1, headers='keys', tablefmt='psql'))

        elif variable == "Parent":
            input2 = input("Please provide a Parent ID:   ")
            result2 = df.loc[df[variable] == input2]
            print(tabulate(result2, headers='keys', tablefmt='psql'))

        elif variable == "Account":
            input3 = input("Please provide an Account ID:   ")
            df = df.set_index('Account')
            result3 = df.loc[df[variable] == input3]
            print(tabulate(result3, headers='keys', tablefmt='psql'))
i need to take the inputs off the end?
iron basalt
Where is the tabulate function coming from?
iron basalt
print(result1) etc and show both the inputs and outputs
iron basalt
insert the prints below result1 = ... etc
severe python

 severe python
let me try
iron basalt
I just wanted to make sure it was not the result = ... code
severe python
that worked
perfect
is there an easy way to add a customized error code for each?
can i use else or except keyerror or something
for example "Please provide a valid Acronym", "Please provide a valid Account ID" , etc
iron basalt
if len(result1) == 0: then there was no hits from the search (so the user entered either an invalid value or a non-existent value in the table).
if you want to make sure the format is correct that requires more work
input format*
severe python
Ok let me try
 echo orbit
Hi guys, may i ask what you would suggest to calculate the integral of a probability distribution function please ? I tried using quad but it's not working (as the distribution function returns an array instead of a single value since it's sampling with a parameter, so i can't integrate over an interval)
from scipy.integrate import quad

t, y, s = np.loadtxt('data/decay_Pu186.txt', unpack=True)

def distrib_integ(tho):
    return np.random.exponential(scale=tho,size=300)

A=quad(distrib_integ,t[0],t[-1])[0]```
that was the program i tried and noticed it wasn't working (with the reason mentioned above)@severe python https://stackoverflow.com/questions/20002503/why-does-a-b-or-c-or-d-always-evaluate-to-true It's a common beginners mistake.
Stack Overflow
I am writing a security system that denies access to unauthorized users.
import sys
print("Hello. Please enter your name:")
name = sys.stdin.readline().strip()
if name == "Kevin" or "Jon" or "Inb...
severe python
ah okay ty for the link
do i put that if statement underneath the print tabulate line?
iron basalt
do you want it to print the results and then tell the user that they entered a wrong value?
severe python
Not particularly
ty that worked
how can i make it so it will only ask the previous question and not restart fully? i'm using continue at the end, what can i use instead? Or do I need a new loop for each?
 iron basalt
echo orbit
Hi guys, may i ask what you would suggest to calculate the integral of a probabi...
iron basalt
echo orbit
Hi guys, may i ask what you would suggest to calculate the integral of a probabi...
def integrate(f, a, b, n):
  x = np.linspace(a, b, n)
  y = f(x)
  return np.sum(y) * (b - a) / n
would that work with a function using numpy.random though ?
echo orbit
x is already defined here ("t"), so something like this :
t, y, s = np.loadtxt('data/decay_Pu186.txt', unpack=True)
def integrate(distrib_integ, tho):
  y = distrib_integ(tho)
  return np.sum(y) * (t[0] - t[-1]) / len(t)```

should work, right ?with tho in t (so a loop on values in t)
iron basalt
integrate(lambda x: my_distribution, t[0], t[-1], n)
n is the number of slices (more = better precision, but more computation)
echo orbit
hmm
iron basalt
my_distribution = np.random.exponential(tho, size=100)
echo orbit
def integrate(f, a, b, n):
    x= np.linspace(a, b, n)
    y = f(x)
    return np.sum(y) * (b - a) / n
A=integrate(lambda tho: np.random.exponential(tho,size=300), t[0], t[-1], len(t))```

Output : ```py
ValueError                                Traceback (most recent call last)
<ipython-input-65-311d7519113e> in <module>
      9     y = f(x)
     10     return np.sum(y) * (b - a) / n
---> 11 A=integrate(lambda tho: np.random.exponential(tho,size=300), t[0], t[-1], len(t))
     12 #for i,tho in enumerate(t):
     13     #A[i]=quad(distrib_integ,t[0],t[-1])

<ipython-input-65-311d7519113e> in integrate(f, a, b, n)
      7 def integrate(f, a, b, n):
      8     x= np.linspace(a, b, n)
----> 9     y = f(x)
     10     return np.sum(y) * (b - a) / n
     11 A=integrate(lambda tho: np.random.exponential(tho,size=300), t[0], t[-1], len(t))

<ipython-input-65-311d7519113e> in <lambda>(tho)
      9     y = f(x)
     10     return np.sum(y) * (b - a) / n
---> 11 A=integrate(lambda tho: np.random.exponential(tho,size=300), t[0], t[-1], len(t))
     12 #for i,tho in enumerate(t):
     13     #A[i]=quad(distrib_integ,t[0],t[-1])

mtrand.pyx in numpy.random.mtrand.RandomState.exponential()

_common.pyx in numpy.random._common.cont()

_common.pyx in numpy.random._common.cont_broadcast_1()

__init__.pxd in numpy.PyArray_MultiIterNew2()

ValueError: shape mismatch: objects cannot be broadcast to a single shape```make this more simple
np.random.exponential(size=100) gives you an array with 100 values
echo orbit
yes
echo orbit
i don't understand why it's just the sum
is it because the values go from 0 to 1 or something like that ?
iron basalt
The area under a curve is the sum of the y values multiplied by dx
and integral is just a continuous version of that
but computers can't compute infinite things so we sample at only a couple of the x values
for example a really bad approximation of an integral:
curve: y = 2x
we want the area from 0 to 12
the integral from 0 to 12 is 144: x^2 at 12 minus x^2 at 0.
echo orbit
yeah, np about that
iron basalt
ok so that is the exact 100% precision answer
now for the approximation that our computer will do
we use 12 sample points
each spaces 1 apart on the x axis
we sample the y values
echo orbit
It's using approximations which simplify the curve as a group of rectangles ig ?
iron basalt
yes we are putting rectangles under the curve and adding them up
so now if we have those 12 y values and call np.sum(y) that will give us 144 in this specific case
but what if we want more or less samples or the spacing in x is not 1?
previously we used a spacing of 1 on the x axis. So dx was 1.
so the correct formula was np.sum(y) * dx
echo orbit
yup
echo orbit
yeah
iron basalt
we can now use this to only do say 3 samples
n = 3
so dx becomes 4
(bigger rectangles)
(wider)
i gotta go though so ill write later
echo orbit
I'm alright with everything you said
 pure pond
What even is your question funky? how to numerically integrate?
echo orbit
How to integrate an exponential probability distribution function
pure pond
a specific one? Just throw it in wolfram alpha
pure pond
whats the fuction?
echo orbit
from scipy.integrate import quad
t, y, s = np.loadtxt('data/decay_Pu186.txt', unpack=True)
def distrib_integ(tho):
return np.random.exponential(scale=tho,size=300)
A=quad(distrib_integ,t[0],t[-1])[0]``` pure pond
 echo orbit
I mean numerically
pure pond
echo orbit
Do i necessarily have to rely on approximative methods (such as euler's or simpson's) on such a case ?
pure pond
Thats what numerical integration is
echo orbit
ik computers use these kind of methods to calculate
pure pond
I've just seen above you were having errors with scipy's quad(), is it that you want fixed?
echo orbit
But is it necessary to rewrite the whole method (as you wrote it above) instead of relying on python functions such as quad ?
i was using quad as this is what i've been taught to use when i started coding, but if there is another function which can make the calculation easier, i'm fine with that
So if it's possible to fix the way i use quad that would be great, otherwise i'll rely on something else
pure pond
I don't really have any experience with this, but in the last code snippet you sent, on the last line, your first argument of quad is distrib_integ, which is the name of the function but not a variable
echo orbit
isn't it how quad works though ?
quad(function,a,b,args) ?
my issue here is distrib_integ doesn't return a single value, but a whole array
pure pond
Oh, well yeah I don't have experience so idk
echo orbit
So everything is already calculated beforehand
pure pond
echo orbit
my issue here is distrib_integ doesn't return a single value, but a whole array
it sounds like thats the point though? What single value would you expect it to want
seems like its a way for quad to generate values. I'm not sure how it'd get tho though, try revmoing that argument from the function and just hard coding a value?
echo orbit
Let's say i have this :
def square(x):
  return x**2```

When quad takes a value between a & b, it applies the function ```integrate``` you sent above and returns the value given by ```square(x)``` for the associated taken valueIn my case, for each value between a & b, i get an array of values
pure pond
Oh right ofc
echo orbit
as it's returning np.random.exponential(value)
So i can't calculate the integral like this
pure pond
Um, why is size=300?
If you want the function to take a number tho and return a number then I guess remove the size argument
 elfin spruce
can anyone help me figure out what this dude wants for this? I never understand it but this is something he never taught us
https://prnt.sc/1071j9n
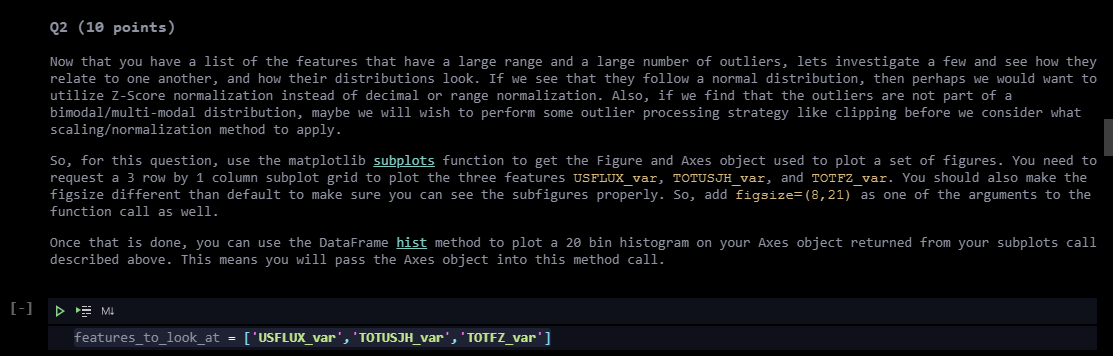
does this mean that each one of those features is a different row? and a column comes from the list explained in the top paragraph?
misty flint
uhhh, i think he means to use matplotlibs subplot function but use a [3 rows by 1 column] array as your input
misty flint
elfin spruce
does this mean that each one of those features is a different row? and a column ...
array like a matrix in linear algebra
misty flint
You can treat lists of a list (nested list) as matrix in Python. However, there is a better way of working Python matrices using NumPy package. NumPy is a package for scientific computing which has support for a powerful N-dimensional array object.
velvet thorn
@echo orbit what is t?
echo orbit
velvet thorn
<@208595588709613569> what is `t`?
time, from 0 to 50s
velvet thorn
echo orbit
time, from 0 to 50s
are you trying to integrate the PDF?
echo orbit
yes
echo orbit
Calculate this :

Then to plot it along with the datas
to compare the model & the datas we obtained
"a" here is the integral of the distribution
iron basalt
Idk at this point i'm pretty confused, so you want to calculate the area under the actual distribution? Then what was np.random.exponential all about?
velvet thorn
^
iron basalt
echo orbit
"a" here is the integral of the distribution
What distribution? I have yet to see one.
velvet thorn
^
iron basalt
If you have the PDF it's a trivial problem.
(Or even better, the CDF (slightly less work for you, it's already solved))
velvet thorn
the function to be integrated over should return a single value
but the way you have set it up it returns 300 values randomly drawn from an exponential distribution
that’s why you get an array result
elfin spruce
misty flint
array like a matrix in linear algebra
thanks
echo orbit
If you say it's trivial, then i probably misunderstood something
iron basalt

In probability theory and statistics, the cumulative distribution function (CDF) of a real-valued random variable
    X


{\displaystyle X}
, or just distribution function of
    X


{\displaystyle X}
, evaluated at
    x


{\displaystyle x}...
Let's say i don't have the CDF
iron basalt
"In the case of a scalar continuous distribution, it gives the area under the probability density function from minus infinity to x {\displaystyle x} x."
 civic fractal
Hard question for the best of the best only haha: https://stackoverflow.com/questions/66378725/how-do-i-transfer-values-of-a-csv-files-between-certain-dates-to-another-csv-fil
Stack Overflow
Long question: I have two CSV files, one called SF1 which has quarterly data (only 4 times a year) with a datekey column, and one called DAILY which gives data every day. This is financial data so ...
echo orbit
iron basalt
If you have the PDF it's a trivial problem.
Isn't the function displayed on my screen the said PDF ?
I mean isn't it an exponential distribution ?
iron basalt
I can't assume that you have to tell me.
echo orbit
echo orbit
How to integrate an exponential probability distribution function
i mentioned it there
 iron basalt
Also the exponential distribution is f(x;lambda) = lambda * e^-(lambda * x) for x >= 0 and 0 for x < 0.
echo orbit
lambda here is equal to 1/tho
iron basalt
you mean tau?
iron basalt
the cdf for an exponential distribution is F(x;lambda) = 1 - e^-(lambda * x) for x >=0 and 0 for x < 0.
if you want to area under the pdf from 0 to x it's F(x).
echo orbit
In other words i calculate the cdf of my exponential distribution to figure out the value of "a"
then plot my formula ?
ik it's basic knowledge when it comes to probability but i really hate them 😩
iron basalt
What do you mean? I thought a = 1
you wrote that lambda = 1 / tau therefor, a = 1.
ok wait
do you know the value of a?
iron basalt
do you know the value of tau
echo orbit
No, we're trying to figure out what it is
So i took tau in t
as t is an array
And i was trying to evaluate the value of a for each value of t (taken by tau), then express the function depending on the value of a
etc
iron basalt
wait, just tell me what are your known values, and what are your unknown values
echo orbit
alright
I'll explain the problem from start , that will surely help
I currently have, in a txt file, datas of a fictive element's disintegration rate y depending on time t, along with its standard deviation s. Our main objective is to figure out what's the exact value of tau.
To figure out that, i did a plot of y as function of t, and got an exponential function (see in pic).
Now i wanted to use the formula f(t|x) above, to express it and plot it on the same figure to compare both the datas & the model, and see how close they are to each other.
However, the formula (that looks a lot like an exponential PDF) has a variable named a that is the value of the integral of the PDF. From what i understand, i have to apply that formula for each possible value of tau in the interval given by t, figure out which curve is the closest to the one deduced from datas, then get the associated value of tau.

At least that's how i see my current problem
That's t
 elfin spruce
anyone familiar with pandas and can give me a hand rq
 lime folio
Can someone please refer me to a good book on how to use py torch?
I’m taking a very difficult deep learning class
elfin spruce
fig, axs = plt.subplots(3, 1, figsize=(8,21))
hist = summary_table.loc[features_to_look_at, get_features_with_large_range(summary_table)].hist(ax=axs, bins=20)```
ValueError: The number of passed axes must be 9, the same as the output plotwhat am i doing wrong here
anyway to bypass this error?
these were the parameters given to me by my professor
iron basalt
"However, the formula (that looks a lot like an exponential PDF) has a variable named a that is the value of the integral of the PDF". When you say the "integral of the PDF", do you mean of the entire PDF?
(negative infinity to infinity)
@echo orbit
Also this entire thing just seems like a curve fitting problem.
echo orbit
Wouldn't it be from the lowest value to the highest value ?
iron basalt
@echo orbit Does not matter, do you mean under the entire PDF? Under the whole curve?
echo orbit
I think it's under the whole curve
iron basalt
Well then a = 1
echo orbit
I looked a bit further into the notebook and noticed they ask to fix a (from 4 to 5) and tau
In the next questions
iron basalt
Is this for school?
echo orbit
It is
Not mandatory but i want to at least try & understand how it works (and decrypt what the hell my teacher tries to explain in his notebooks)
iron basalt
So your problem statement is to find out Tau (therefore what lambda is also), by fitting a curve to the data?
echo orbit
I think that's the objective of this part of the notebook
Anyway i'll ask my teach tomorrow about it because his way of explaining instructions sometimes doesn't make any sense (along with me thinking everything's difficult when it probably takes less than 5 lines of code)
misty flint
elfin spruce
thanks
no problem
 foggy fern
Hey I'm trying to do integral of two interpolating function(both of them are two separate data sets) to get a new array of data and I'm running into error : The truth value of an array with more than one element is ambiguous. Use a.any() or a.all()
can anyone please help?
lime folio
Let's say I have a tensor consisting of 1 and 0's as shown below. How can I get the index of a specific column to replace with new values ? If I want to replace the values of column 1 with the [3.,4.,5.,6.], how do I accomplish this ?
a = torch.tensor([[[1., 0., 0., 0.]],
[[0., 1., 0., 0.]],
[[1., 0., 0., 0.]],
[[0., 0., 0., 1.]],
[[1., 0., 0., 0.]],
[[0., 0., 0., 1.]],
[[1., 0., 0., 0.]]])
short heart
Will 11 hours be enough for 250.000.000 values to be made and Logistic Regression to handle them
misty flint
only one way to find out
it really depends on what youre working with
gpu acceleration?
access to cloud?
etc.
short heart
32gb and r7 2700x
It didnt tho..which sucks
I set it up yesterday but it hasnt even made dataset for itself by now
not even close to start learning
misty flint

 tight spade
I am having a problem that needs help in NLP.
The text "TSLA is going to the moon. I think TSLA is the greatest company ever and GM and other car manufacturers don't stand a chance when competing with TSLA" would ideally return something indicating that TSLA had positive sentiment and GM had negative sentiment.
How can I write a code in python?
misty flint
there are plentiful of nlp libraries out there. take a looksee
misty flint
short heart
32gb and r7 2700x
did you set up your gpu too? might as well if youre going to be running models like this all the time
or you could just fire up a cloud instance to help
if youre pressed for time
misty flint
short heart
i doubt my gpu could handle it
misty flint
🕯️
short heart
and i heard when u use gpu it wont do swap and break everything
misty flint
if youre a student, you get free cloud credits
enough to train models

if not, its still pretty cheap
hasty grail
Can you explain what are you trying to do?
tight spade
misty flint
there are plentiful of nlp libraries out there. take a looksee
What library do you suggest me to use?
 chilly geyser
tight spade
I am having a problem that needs help in NLP.
The text "TSLA is going to the moo...
chilly geyser
tight spade
I am having a problem that needs help in NLP.
The text "TSLA is going to the moo...
Your code depends on how involved you want to be in terms of the whole process
If you want to 'just get a number' there are pipelines (kind of) for that
But I think all this still assumes you retrain on 'new' data I think
So you probably would need to manually label a few
tight spade
chilly geyser
Your code depends on how involved you want to be in terms of the whole process
Actually I am not sure what it does mean. Can we discuss more about this via DM?
tight spade
chilly geyser
Nope, sorry, not into DMs
Okay, thank you!
chilly geyser
I think https://github.com/ThilinaRajapakse/simpletransformers is the simplest so far if you don't really care that much about the nitty gritty for now
GitHub
Transformers for Classification, NER, QA, Language Modelling, Language Generation, T5, Multi-Modal, and Conversational AI - ThilinaRajapakse/simpletransformers
Do you only have positive and negative by the way
Is there 'neutral'?
There's also transformers pipeline
tight spade
Yes there is neutral.
chilly geyser
I like Simple Transformers more, but you just have to stick with the BERTs they have implemented I guess
I think roBERTa should be fine for most needs
chilly geyser
tight spade
I am having a problem that needs help in NLP.
The text "TSLA is going to the moo...
Oh wait, you're not just classifying, this is a multi-labelling task I think
tight spade
chilly geyser
Oh wait, you're not just classifying, this is a multi-labelling task I think
Okay
chilly geyser
That would be a lot harder I think
I personally never tried multi-label before, can't comment on how usable current state of the art is unfortunately
tight spade
chilly geyser
That would be a lot harder I think
Okay I got it. Thanks for your help anyway!
chilly geyser
The keyword for this seems to be 'Aspect Based Sentiment Analysis' so you might want to google that and see where it goes
grave frost
chilly geyser
I personally never tried multi-label before, can't comment on how usable current...
Multi Label works pretty well with transformers - there are example notebooks for BERT in Sentiment Analysis
tight spade
grave frost
Multi Label works pretty well with transformers - there are example notebooks fo...
can you point me to the notebooks?
chilly geyser
I know multiclass is pretty good, it's possible to >95% accuracy on BERT Multiclass sentiment
But multilabel I don't know the accuracy of SOTA
grave frost
tight spade
can you point me to the notebooks?
 tight spade
grave frost
Its in the docs; https://colab.research.google.com/github/huggingface/notebooks/...
tight spade
grave frost
Its in the docs; https://colab.research.google.com/github/huggingface/notebooks/...
Thank you!
grave frost
tight spade
Thank you!
your welcome
 jade adder
is anybody here experienced with numba?
i ve been struggling with some errors and want their wisdom
austere swift
you'll probably get more help if you just ask your question
severe python
@iron basalt i'm getting this error:

import pandas as pd
from tabulate import tabulate
from termcolor import colored

class bcolors:
    HEADER = '\033[95m'
    OKBLUE = '\033[94m'
    OKCYAN = '\033[96m'
    OKGREEN = '\033[92m'
    WARNING = '\033[93m'
    FAIL = '\033[91m'
    ENDC = '\033[0m'
    BOLD = '\033[1m'
    UNDERLINE = '\033[4m'

df = pd.read_excel("accounts.xlsx")
print(df.columns)

while True:
        variable = input("Search by Acronym / Parent / Account?    ")

        if variable not in df.columns:
            print(f"{bcolors.FAIL}Error: Invalid Input{bcolors.ENDC}")
            continue

        if variable == "Acronym":
            input1 = input("Please provide an Acronym:   ")
            result1 = df.loc[df[variable] == input1]
        if len(result1) == 0:
            print(f"{bcolors.FAIL}Acronym not found. Please try again{bcolors.ENDC}")
            continue
            print(tabulate(result1, headers='keys', tablefmt='psql'))

        if variable == "Parent":
            input2 = input("Please provide a Parent ID:   ")
            result2 = df.loc[df[variable] == input2]
        if len(result2) == 0:
            print(f"{bcolors.FAIL}Parent ID not found. Please try again{bcolors.ENDC}")
            continue
            print(tabulate(result2, headers='keys', tablefmt='psql'))

        if variable == "Account":
            input3 = input("Please provide an Account ID:   ")
            df = df.set_index('Account')
            result3 = df.loc[df[variable] == input3]
        if len(result3) == 0:
            print(f"{bcolors.FAIL}Account ID not found. Please try again{bcolors.ENDC}")
            continue
            print(tabulate(result3, headers='keys', tablefmt='psql'))
but i'm defining result1, result2, result3 before that python if len(result1) == 0: statement
 spark stag
your only defining result2 if variable == "Parent", otherwise it will be undefined when that if causing the error is run
also the prints below the continues but indented to the same level will never run i believe
severe python
so what you're saying is i should define result1, 2, 3 with that same line outside of the loop at the top?
and then i should indent that if len(result1) == 0: line and keep the print tabulate with the if variable indentation
spark stag
or indent that section inside the other if, it is more nesting but that part of the code should only run in the case of selection above it branching that way by the looks of it
severe python
okay that's what i'm saying above, gotcha. so i should define result1,2,3 outside of the loop? and should i use that same line?
spark stag
i meant more change py if variable == "Acronym": input1 = input("Please provide an Acronym: ") result1 = df.loc[df[variable] == input1] if len(result1) == 0: print(f"{bcolors.FAIL}Acronym not found. Please try again{bcolors.ENDC}") continue print(tabulate(result1, headers='keys', tablefmt='psql')) to ```py
if variable == "Acronym":
input1 = input("Please provide an Acronym: ")
result1 = df.loc[df[variable] == input1]
if len(result1) == 0:
print(f"{bcolors.FAIL}Acronym not found. Please try again{bcolors.ENDC}")
else:
print(tabulate(result1, headers='keys', tablefmt='psql'))
continue
then the if only runs on the variable matching, and one of the prints will always run
again, I am making assumptions about what you are trying to do but your code contained segments that would never run so i think this is what you are trying to do
severe python
that is exactly what i'm trying to do, thank you so much
let me show you output real quick of what's happening on a different topic and what i am expecting
so with this example, i would like it to ask the same question rather than starting from the beginning. i would think the continue function is having it go back to the beginning but would i need to have a new loop for that to work?
 exotic maple
you need a nested loop for that
@severe python once the user selects "Acronym" or other
you would need to enter a loop AFTER that selection, if what you want is to keep circling the 2nd question
Also, and perhaps this is more a of personal preference but i dont think you need those 3 blocks of code at all
those 3 ifs
severe python
definitely looking to simplify in the near future
exotic maple
they're not taking differen branches, they're performin pretty much the same operation, just with different labels
severe python
let me try adding the nested loops, and yeah i initially thought i needed separate because i was setting index, not really sure why i was
would i add while True right after if variable == "Acronym": ?
exotic maple
id say this
--hwo do you add code in discord lol
if variable not in [LIST OF RELEVANT STUFF]
print(BLABLA)
continue
if variable in [list of relevant stuff]
while result is None: --> this requires result to be defined earlier, which, id perosnally prefer doing. after all your whole program is about providing this
 blazing lodge
Anyone familiar with OCR, please help
I getting this error and don't know what to do
Stack overflow doesn't really have much on this as well

also its on Colab
severe python
@exotic maple i see, that would make a lot more sense. for now i think i'm going to just add functions then simplify. is that what i would do for the above?
exotic maple
You can try enclosing some of that in a function yes, although to be honest its not necessary if you dont want to.
what i find most unnecesarry is the multiple result variables and the if's.
ultimately though, what matters the most is that you remember and understand what the code is doing lol
tight spade
I am looking for help for my test assessment in NLP / sentiment analysis.
Task: The text "TSLA is going to the moon. I think TSLA is the greatest company ever and GM and other car manufacturers don't stand a chance when competing with TSLA" would ideally return something indicating that TSLA had positive sentiment and GM had negative sentiment.
severe python
@exotic maple having trouble understanding, this isn't correct, right?
while True:
        variable = input("Search by Acronym / Parent / Account?    ")

        if variable not in df.columns:
            print(f"{bcolors.FAIL}Error: Invalid Input{bcolors.ENDC}")
            continue

        if variable == "Acronym":
            while True:
                input1 = input("Please provide an Acronym:   ")
                result1 = df.loc[df[variable] == input1]
                if len(result1) == 0:
                    print(f"{bcolors.FAIL}Acronym not found. Please try again{bcolors.ENDC}")
                else:
                    print(tabulate(result1, headers='keys', tablefmt='psql'))
                continue
```definitely doesn't make sense
exotic maple
My question is, why do you need to verify of it is am acronym?
You are literally retrieving the column name aa stored kn variable, so why checl name again?
severe python
so if you enter an invalid acronym, and it lets you know, i want it to prompt the same question again instead of having to type "Acronym" then it ask you "Please provide an Acronym: "
exotic maple
You dont need variable == acronym. I dont see any purpose for that
You can just string format the questiom based on VARIABLE
Print(f"Please input {VARIABLE}")
Input=()
Also. If im not mistaken
Df.loc and non existent row raises an exception no?
You can try except that
severe python
edit: ohhh i think i follow what you're saying
this is built to search a large excel file based on user input. i couldn't find a way to search based on multiple criteria (acronym, parent, account), so i had to add the prompt at the beginning to divide the search
i wanted to make it so i could just type an acct or parent or acronym right off the bat and it print corresponding rows, but it wouldn't work
i like the idea of simplifying it but i'm on a time crunch and don't have enough knowledge to do it on my own
figured out the looping
grave frost
Anyone deeply familiar with HuggingFace's Transformers?
exotic maple
Can anyone help me with something ? I'm not completely understanding the difference between logistic regression and a linear support vector machine
I understand LR is more statistical in that result is a p(class), and that LSVM is more geometric in nature (vector spaces and maximizing hthe boundary between planes), but aside from those differences in concept, as classification algorithms i feel they are too similar
 stray roost
Hello guys. What would be a best way to create a chatbot in python? I heard about nltk and using indents.json files but is there a better way to create a bot?
exotic maple
@severe python
This is what I would do (AFTER FIRST IF)
while True:
  print(f"Please provide an: {VARIABLE}")
  row = input()
  try:
    result = df.loc[row]
    print(tabulate(result1, headers='keys', tablefmt='psql'))
    break # or quit, whatever suits your code
  except KeyError: # as far as i remember pands raises an error if .loc cannot find the data in the index via .loc
    print(f"{bcolors.FAIL}Acronym not found. Please try again{bcolors.ENDC}
    continue
Deep Learning
stray roost
grave frost
Deep Learning
Yeah that was my idea as well. Do you know any good databases for a chatbot?
exotic maple
@severe python I might have missed a bit of logic there snice im rushing it but i think that explains the gist of my idea lol
 bronze gorge
Hello Guys , which laptop to buy for data science?
grave frost
@stray roost depends on your use case
grave frost
bronze gorge
Hello Guys , which laptop to buy for data science?
save your money - use cloud
for AI and MAcihne Learning
for general data science, you can use anything
exotic maple
@grave frost any providers suggestions that are not AWS?
grave frost
exotic maple
<@!738058085083381760> any providers suggestions that are not AWS?
GCP
They are the best
exotic maple
google cloud?
grave frost
yep
Cloud AI notebooks - simple intuitive stuff
and very cheap
you wont regret using GCP
grave frost
exotic maple
are you sponsored? lol
just working with GCP for quite some time
stray roost
grave frost
<@!514684696953880586> depends on your use case
Currently I am just trying to create a dialogue chatbot bcs I am training for a competition where we will have to create a chatbot for a specific purpose
grave frost
its pretty good for beginners. AWS is so complicated
exotic maple
 grave frost
not to mention you will lose all your money
exotic maple
im guessing you mean that option?
grave frost
yea. dont get the spanish tho
grave frost
stray roost
Currently I am just trying to create a dialogue chatbot bcs I am training for a ...
they would have provided a dataset
you can use that
exotic maple
interesting ill look into it. I'm still learning ML so im not sure how worth it would be for me to pay for it lol
grave frost
dont use it then. pay for colab
pro
after that, if you need more hardware, use cloud
exotic maple
colab pro?
grave frost
yea
it would do most of the needs of a beginner
reserve cloud for competetions
you can check the price using gcp price calculator
grave frost
yup
exotic maple
oh nice
that looks pretty cool
so its basically jupyter running on google?
neat
exotic maple
i wont have to burn my gtx anymore lmao
grave frost
which one do you have?
grave frost
8g?
exotic maple
yup
grave frost
thats good enough. you would prob only need that + colab free
exotic maple
Its decent for light stuff but if try being a smartass
it goes up 90+ degress lmao
my CPU is a bit old, so i think that might a bottleneck
exotic maple
try living in a tropical country :v
exotic maple
anyways @grave frost thanks a lot man. That google colab thing looks neat
grave frost
cool, no worries
exotic maple
damn really? ive lived all my life in the tropics and hottest ive been is 34 degrees sustained
50% humidity
annoying, but bearable
grave frost
welcome to India