#data-science-and-ml
1 messages · Page 285 of 1
 mint palm
 velvet thorn
mint palm
well i think sry i meant traing set...........cuz it would mean that our nn is d...
velvet thorn
mint palm
well i think sry i meant traing set...........cuz it would mean that our nn is d...
yes
that is correct
mint palm
we can check on test set...thats what its for
mint palm
yes
velvet thorn
do you understand why I say this?
mint palm
cuz i understand u understand that i dont understand basics correctly
velvet thorn
what?
no I mean like
do you agree with my explanation
of why dropout is turned off at test time
velvet thorn
yup but your question was specifically "why no dropout at test time", right
mint palm
velvet thorn
of why dropout is turned off at test time
umm because we dont know what will our nn do originally
velvet thorn
have I answered that properly
mint palm
maybe cuz we cant just troubleshoot without trouble
mint palm
velvet thorn
of why dropout is turned off at test time
i think i misunderstood you thinking you were checking if i understand this correctly
the original question was about why we need scaling for activation ( deviding but probability of dropping neuron in layer) to increase activation
velvet thorn
mint palm
the original question was about why we need scaling for activation ( deviding bu...
yup
and that's related
to the question of why no dropout at test time
so
basically you can think of it this way
each layer has an expected value for the output
and this expected value is dependent on the number of neurons and the values of the weights for each layer
velvet thorn
velvet thorn
and this expected value is dependent on the number of neurons and the values of ...
because of dropout, the "number of neurons" value will change from training time to test time.
mint palm
is the expected value is the one without droppout?
velvet thorn
mint palm
is the expected value is the one without droppout?
there is an expected value with dropout and one without dropout
mint palm
ok
velvet thorn
therefore, there is a need to scale the output of each layer in such a way that the activations will be the "same" at both training and test time
this scaling can be done at test time (regular dropout) or at training time (inverted dropout).
mint palm
ok i get it...........to make it up to expectation...........but how did we expected that before..........i mean how expectations are made
velvet thorn
mint palm
ok i get it...........to make it up to expectation...........but how did we expe...
hm
that's a question with a long answer
but
BASICALLY
the output of a layer is wx + b, right
mint palm
hmm
velvet thorn
w and b are constants, and x has a distribution
mint palm
yes
velvet thorn
therefore wx + b also has a distribution, and it has an expected value
mint palm
should i know further about it
velvet thorn
uh
mint palm
or leave it
mint palm
at this stage of learning
mint palm
thank you
velvet thorn
yw! 👋
 desert parcel
Is this a good dataset for non-linear regression?
 warped vale
I've a question about matplotlib, is it the right channel ?
mint palm
i think yup
warped vale
I'm using matplilib.pyplot to make graph (in POO), I did that :
import matplotlib.pyplot as plt
fig = plt.figure()
ax = fig.add_axes([0,0,1,1])
langs = ['C', 'C++', 'Java', 'Python', 'PHP']
students = [23,17,35,29,12]
ax.bar(langs,students)
ax.set_title("my title")
fig.show()
But it doesn't show to title etc... just the bars
 versed jacinth
Hi! Do you guys think we can query big data like our structured database management systems???
 hasty grail
If you can somehow preprocess the data into a structured format, yeah
But that's not always the case
Data samples could simply be too complex to encode as a database record
e.g. images
 tall trail
why does this give me single positional indexer is out-of-bounds
df_sensoren.loc[df_sensoren['id'] == df_peaks['id'][i], 'bounding_lat'].iloc[0]
as i understand this it should check if the 2 ids are the same, and if they are it should return bounding_lat
[i] is from a for loop:
for i in range(0, len(df_peaks)):
nm, figured it out
versed jacinth
hasty grail
If you can somehow preprocess the data into a structured format, yeah
ok thx
 lapis sequoia
That code looks slow
 spring mortar
Hi guys, I don't exactly know where to go with this. I'm looking for a library to do exploratory image analysis in terms of remote sensing. One thing I would like to do is to create a simple change map between two images. My first idea was to read the image files with Python as a three dimensional array (one for each channel), divide it into the three channels and see if there is a difference in the cells of the arrays (pixels). However, I think there might be an easier solution I haven't stumbled upon yet so the question is if someone can point me towards a library.
 misty flint

 weak panther

spring mortar
Okay, wait, I'll draw it :D
As an example: Image 1, 4x4 pixels, is showing my table with half of it being covered by my mousepad (black). Image 2 is showing the same scene (my table) and only 1/4 is covered by my mousepad.
I want the result to be a difference image that highlights what's different (in a binary way - 1 or 0).
I hope this was more clear. English is not my first language so sorry for the confusion!
I'm not sure if I'm in the right channel, too
 chilly compass
Hey everyone! I'm getting my Kaggle profile off the ground and just published my first notebook! It's the classic Titanic problem that so many before me have done, but I decided to treat it a little differently!
Instead of using more traditional algorithms like k-nearest neighbor and SVG, I wanted to use the opportunity to show that a well crafted small neural network can perform just as well even in a situation where the dataset is relatively small and the features are mostly categorical in nature. It's a minimalist and (to the best of my ability) clearly laid out reference for anyone who wants a simple neural net framework that they can easily tailor to other projects. If you guys and gals wouldn't mind checking it out and (if you like it) leaving a review and upvote, that would be super awesome!
https://www.kaggle.com/connorpuhala/titanic-neural-net-77-5-accurate

Explore and run machine learning code with Kaggle Notebooks | Using data from Titanic - Machine Learning from Disaster
lapis sequoia
Hi, I recently found out that almost every package for accessing Twitter data broke.
So I decided to write my own but instead of scraping the website (e.g. beautiful-soup) I reversed engineered a Twitter public API.
I am sharing it here because I saw many uses of these packages in the data-science project.
I started it today so it isn't perfect. I would love to hear what could change/add
https://github.com/magicaltoast/twitter_web_api
P.S I am pretty new to python

GitHub
Contribute to magicaltoast/twitter_web_api development by creating an account on GitHub.
 pine kernel
anyone experienced with pandas?
spring mortar
Depends on what you want to do
pine kernel
@spring mortar can you help?
 bronze skiff
not entirely sure what you're trying to do
get an hour?
split by T then split by :
pine kernel
I'm trying to get clicks per hour
pine kernel
bronze skiff
not entirely sure what you're trying to do
import pandas as pd
import argparse
df = pd.read_csv('se_click_data.tsv', sep='\t', names=[
'Timestamp', 'Advertisers', 'Clicks'], header=None)
grouped_series = df.Clicks.groupby(
pd.to_datetime(df.Timestamp).dt.hour).count()
df2 = pd.DataFrame(
{'hour': grouped_series.index, 'clicks': grouped_series.values})
print(df2)
# print(df.head())
# print(df.dtypes)
parser = argparse.ArgumentParser()
# advertiser arg as str in quotes
parser.add_argument('--advertiser', type=str, required=True)
args = parser.parse_args()
grouped_series.sort_values(ascending=False, inplace=True)
print(grouped_series[args.advertiser])```
Here's my program so far warm seal
Anyone know any geolocation packages? Tryna create a radius around a specific long/lat for prediction purposes
 grave frost
for kaggle comp.? @warm seal
bronze skiff
you did a groupby on just clicks, why do you think the adv col is still in grouped_series?
pine kernel
bronze skiff
you did a groupby on just clicks, why do you think the adv col is still in group...
ah, should I add adv col in groupby?
bronze skiff
you could
grave frost
@chilly compass Don't the people at the top of the LB use MLP's? I am surprised anyone even uses traditional algos for this task
chilly compass
grave frost
<@!432591050348167168> Don't the people at the top of the LB use MLP's? I am sur...
Well... yes. BUT most of the notebooks using Neural Nets at the top of the leaderboards are relatively complicated! When it comes to beginner level notebooks, almost all of them use traditional algos. So I was doing a basic level 1 NN notebook because I really hadn't seen any good minimal ones that were more accessible to the newbies.
tall trail
so im trying to import 1 row/columnvalue from my csv which looks like this:
53.112631,12.123448
im trying to do that with:
bounding_box_lat = df2.loc[df2['id'] == df['id'][i], 'values'].iloc[0]
instead of returning the 2 values as numbers or a string it returns it as a list with seperated characters. Is there a way to return it in another way? or do i need to join the list and do it the hacky way
 upbeat jetty
Hello! I'm building a docker image for pyspark.
The goal is to make a performant SINGLE-MACHINE setup that houses a sample data pipeline which involves several joins.
However even small, testing data takes 15-20 minutes per run.
It's a weak PC with 16gb of memory and 2/4 core/thread processor.
What settings are most important for quick runs?
spring mortar
warm seal
Anyone know any geolocation packages? Tryna create a radius around a specific lo...
Check Shapely
bronze skiff
upbeat jetty
Hello! I'm building a docker image for pyspark.
The goal is to make a performant...
default number of shuffle partitions <- tweak that
upbeat jetty
Thanks! How much do I need to use? 4 or more, if the data stops fiitting in memory?
bronze skiff
so spark sets the default to 200-- why? not sure
but in general enough that a single shuffle step doesn't murder your memory
if your dataset is small, set it smaller
serialization/deserialization to jvm objects is a huge bottleneck for you with high partition counts
upbeat jetty
Thanks! I think I still have 200 as default.
I config Pyspark session via SparkSession.builder.
I'll check what exact parameter I need to pass in .config.
 little compass
Hey all,
I am making weekly videos on intermediate/advance data science and machine learning topics. This week I filmed a video on gradients with respect to input.
I hope some of you could find it useful! I would be more than happy to get feedback and/or questions!
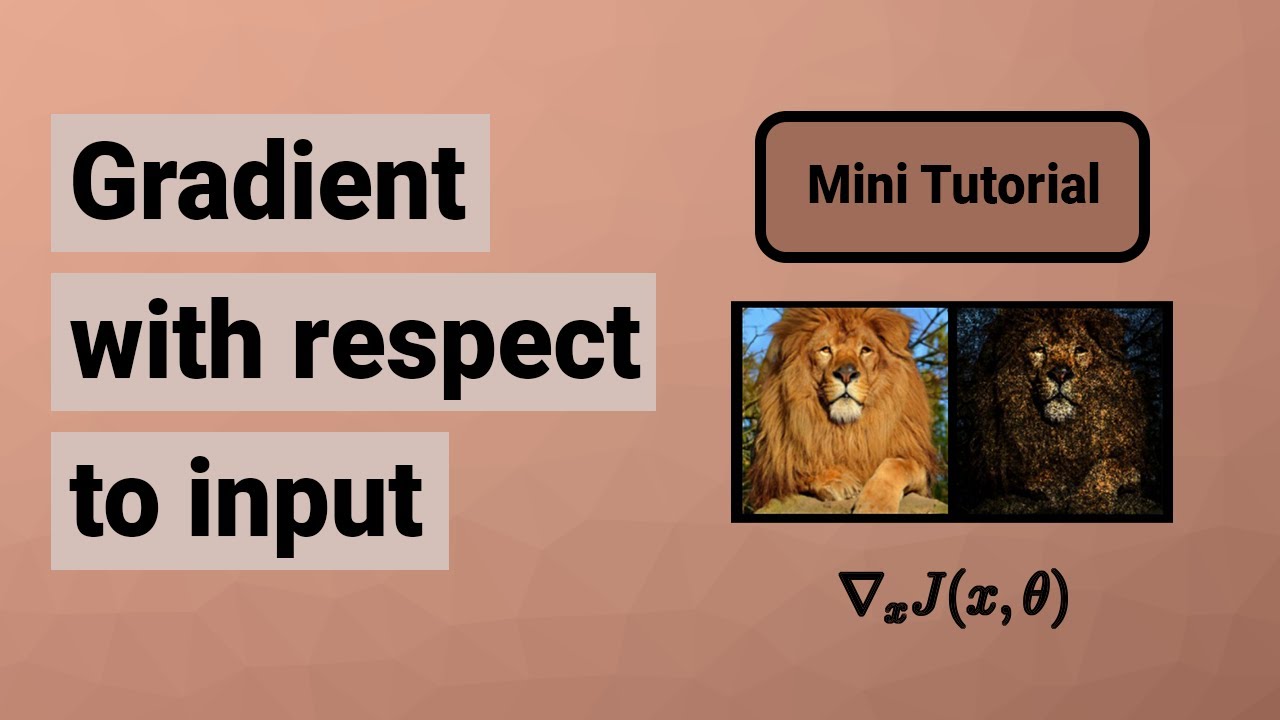
In this video, I describe what the gradient with respect to input is. I also implement two specific examples of how one can use it: Fast gradient sign method (FGSM) and Integrated gradients. The first one is an adversarial attack that perturbs the input image in a way that fools a classifier network. The second is an approach that tries to inter...
 cerulean spindle
Does anyone use VSCode insiders for Jupyter notebooks?
warm seal
spring mortar
Check Shapely
thank you@!
 pliant estuary
Hello is there somebody who is using NetCDF files and wrangling with them?
pliant estuary
cerulean spindle
Does anyone use VSCode insiders for Jupyter notebooks?
Sure! 🙂
 graceful scaffold
Hi guys
I've got a question
I want to plot this sns.heatmap(df[["Impressions","Clicks","Spent","Total_Conversion","Approved_Conversion"]].corr(),annot=True , cmap='YlGnBu')
But I want to add 'hue', by gender and age range, to create many heatmaps on the same axis
Does it make sense?
bronze skiff
step 1: get math background, step 2: learn python in a week, step3: profit
lapis sequoia
Greetings, trying to create morphological analysis for Amharic language. Amharic is a highly inflected language so super complex morphology. Anything you recommend I read up on as far stemming, lemmatization for such type of languages? thanks
 frozen jewel
bronze skiff
step 1: get math background, step 2: learn python in a week, step3: profit
frozen jewel
bronze skiff
step 1: get math background, step 2: learn python in a week, step3: profit
profit? xd
lapis sequoia
math background calc, linear, diff is it enough ? python in a week !!!!!! is that even possibile
*possible
graceful scaffold
graceful scaffold
I want to plot this sns.heatmap(df[["Impressions","Clicks","Spent","Total_Conver...
I need help pls
 potent rain
what do u guys prefer, python pandas or sql?
 raw plover
can someone help ,e?
lapis sequoia
@graceful scaffold sns.heatmap(flights, cmap="YlGnBu") ?
@potent rain for what? sql is another technology
@raw plover just ask. dont ask to ask 😉
raw plover
Consider the following code:
val = 25
def example():
global val
val = 15
print (val)
print (val)
example()
print (val)
What is output?
thats what i need help on
frozen jewel
@lapis sequoia @lapis sequoia
potent rain
lapis sequoia
<@!608063894317170688> for what? sql is another technology
for data analysis, i know for data bases sql is another level.
cerulean spindle
pliant estuary
Sure! 🙂
When I open a jupyter notebook, it doesn't work and says it cannot read a certain property. Does that happen to you?
lapis sequoia
frozen jewel
<@456226577798135808> <@456226577798135808>
yes yes
lapis sequoia
potent rain
for data analysis, i know for data bases sql is another level.
yes it's apple and oranges: panda/python vs sql.
graceful scaffold
lapis sequoia
<@!541809827177824267> sns.heatmap(flights, cmap="YlGnBu") ?
What so you mean?
potent rain
lapis sequoia
yes it's apple and oranges: panda/python vs sql.
totally agreed.
lapis sequoia
potent rain
totally agreed.
pandas is a library written for python. python is a programming language. sql is for databases.
lapis sequoia
graceful scaffold
What so you mean?
did you try the cmap parameter for colors
graceful scaffold
yeah
but the colours are not important
I want many heatmaps on same axis, showing correlation, by age and gender (Separately)
lapis sequoia
you asked about hue. hue has to do with colors, no?
@graceful scaffold can you post an image of the final result you want. hand drawn 🙂
graceful scaffold
Let's say I have 5 features (5x5 correlation matrix) and 5 age ranges (5 heatmaps)
Something like that
lapis sequoia
so its a 1x5
 nova smelt
Hey
can someone recommend a good dataset to train a neural network on? ive done the MNIST and fashion MNIST already
frozen jewel
nova smelt
can someone recommend a good dataset to train a neural network on? ive done the ...
for what
nova smelt
ivea worked my way through a neural network from scratch book and now i am looking fo some datasets to train a neural network on 😄
nova smelt
yea
just getting some experience on how to set hyperparameters and stuff to get good accuarcy etc.
nova smelt
frozen jewel
huge language datasets
uh yea i see that looks crazy
gotta take a closer look at that thanks👍
frozen jewel
no problem
grave frost
@nova smelt how much expereince do yo have?
grave frost
I know sentdex, but not his book :0
nova smelt
okay
nova smelt
grave frost
<@!432215309278117890> how much expereince do yo have?
why do you ask?
grave frost
well, have you done anything in NLP - like RNN or LSTM
nova smelt
nope 😄
nova smelt
frozen jewel
https://commonvoice.mozilla.org/en/datasets
that looks a little too crazy for me i think xD
frozen jewel
nova smelt
that looks a little too crazy for me i think xD
save it for later
nova smelt
👌
grave frost
well, I suggest you do text generation first - trying to generate Shakespeare would be a good one. https://www.tensorflow.org/tutorials/text/text_generation Simple tutorial, perfectly working code and you can ask/google anything you don't get
 nova smelt
okay thx
grave frost
np
These are pretty simple models, so you won't get much realistic looking text (I tried for Harry Potter once, but the result was ok). The more important thing is to experiment and keep learning new things
velvet thorn
just ask
 hollow sentinel
^
 woeful estuary
Hey, anybody here have experience with neural networks and pytorch?
 fluid sigil
anyone good with histogram oriented gradients?
bronze skiff
did that guy's messages get deleted?
 lapis sequoia
your own story
lapis sequoia
Hey folks, anyone knows the shortcut in lab to show completion suggestion box?
 thorn vector

Stack Overflow
Say that I have two figures in matplotlib, with one plot per figure:
import matplotlib.pyplot as plt
f1 = plt.figure()
plt.plot(range(0,10))
f2 = plt.figure()
plt.plot(range(10,20))
Then I show ...
does anyone know a more up to date solution to this issue?
or one that is more"legit"
?
misty flint
run them separately in a different cell

you can also show them as multiple plots in one figure
thats all i know within matplotlib
lapis sequoia
Hey folks, anyone knows the shortcut in lab to show completion suggestion box?
or notebook
lapis sequoia
nvm seems to be just a pandas problem..
 graceful ice
I want to change parameter selected value in tableau on filter change is that possible
 astral path
If I have a column in a DataFrame that has values that look like these, how would I change it so that instead, it has a list of sizes like ['XS', 'S', 'M'] as the values in that column?
graceful ice
we are using 2 kinds of parameters :-
- with fixed categorical levels (fixed list of values).
- String parameters where you can enter any value
But once we apply a filter globally, I want the values in both these parameters to get updated according to the selection in the filter. The filter is on a column of the dataset which has only unique values. So each value of the filter corresponds to a row in our data.
The string parameter( type 2) gets updated when we change the filter( using DataDrivenParameters Extension of Tableau), but the categorical parameter (type 1) remains static.
My objective is to show the selected value( corresponding to the row of the value in the filter column) in the 1st parameter type when we change the filter.
Let me know if this makes sense
thorn vector
misty flint
run them separately in a different cell
What do you mean by cell?
astral path
misty flint
<@!478676609914765322> hmm i can only think of using regular expressions
hmm I'll try that
lapis sequoia
Hi i want to get started with data-science. what things can I do?
grave frost
lapis sequoia
Hi i want to get started with data-science. what things can I do?
What do you find interesting about it? What motivated you to pursue it?
lapis sequoia
grave frost
What do you find interesting about it? What motivated you to pursue it?
i like math, graphs, and data. I wanted to try and use these skills in real life to help people and just learn
(i already know how to graph a little)
 twin moth
Hey guys, a friend of mine is working on a school project and he's currently stuck on choosing the ML algorithm, we'd love some help regarding it.
The data is basically a DF which contains distances between points on (70K some) human faces, and we're trying to use it in order to predict the gender and age of a person in an image.
We already tried using PCA(after scaling), linear regression, naive base, KNN, and decision tree.
The model he's currently using is SVC, we'd love to hear some better ideas regarding the model or the parameters it receives.
@jade pebble
 whole mica
@lapis sequoia hey me too man !
 light stump
Hey everyone, I'm visualizing a numpy array of grayscale image intensities using matplotlib. Inside the array, the value of the intensity is greater than 0, yet when i select that pixel on the image the intensity of that pixel seems to be 0. Could someone help me figure out why?
Code (note: r is just a pre-defined integer, temp2 is the numpy array, i + j represent indices in a for loop)
         foob = temp2[i - r:i + r + 1, j - r:j + r + 1]
         z_max, z_index = np.max(foob), np.argmax(foob) # argmax returns index of maximum value of foob
         y = np.floor_divide(z_index, spot_diameter) - r # floor division explicitly written out here
         x = z_index % spot_diameter - r

         if (x == 0 & y == 0):
                print((temp2[i, j], i, j))```
Output (sample):
```(47.70156250000003, 347, 20)```

Output image at the same location:What was the result of NN's?
 oblique thicket
twin moth
Hey guys, a friend of mine is working on a school project and he's currently stu...
oblique thicket
twin moth
Hey guys, a friend of mine is working on a school project and he's currently stu...
logistic reg, random forest, xgboost
for svc don't forget to tune C parameter with cross validation
eventually changing kernel with poly 2/3 linear etc
its often annoying to deal with svc because its slow, I'd try random forest if it was me
twin moth
grave frost
What was the result of NN's?
Are you referring to KNN?
grave frost
I mean Neural Networks
twin moth
oblique thicket
its often annoying to deal with svc because its slow, I'd try random forest if i...
On it, we'll let you know when it's done
oblique thicket
great, you can pm if you want
twin moth
oblique thicket
logistic reg, random forest, xgboost
BTW, we also tried logistic regression and it was ~0.85
twin moth
grave frost
I mean Neural Networks
We've yet to run it, which parameters would you recommend on using?
We know that decision trees is quite similar to random forest and it didn't perform so well, should we still check it?
twin moth
nvm, it performed really bad 😛 0.52
oblique thicket
for neural network look at this: https://scikit-learn.org/stable/modules/generated/sklearn.neural_network.MLPClassifier.html
weird such a low score but idk
twin moth
Yeah, we looked at it, we didn't really know which of those parameters would be ideal
oblique thicket
example of code I used to tune nn classifier
cv = StratifiedKFold(n_splits=3)

mlp = Pipeline([
    ("scaler", StandardScaler()),
    ("mlp", MLPClassifier(solver="adam",
                          hidden_layer_sizes=(16,),
                          batch_size=16,
                          max_iter=2000)
    )
])


mlp_params = {
    "mlp__batch_size": [8, 16, 32, 64, 128],
    "mlp__alpha": [1e-1, 1e-2, 1e-3, 1e-4],
    "mlp__activation": ["relu", "tanh"],
    "mlp__hidden_layer_sizes": [(16,), (32,), (16, 16,), (8, 8)]
}

mlp_cv = GridSearchCV(mlp, mlp_params, n_jobs=-1, scoring="roc_auc", cv=cv)
mlp_cv.fit(X_train, y_train)
Random forest spits out ~0.76
oblique thicket
not too bad, if its as fast as I remember, you can tune it fast
it's getting late here, good luck
twin moth
It will take forever :S
twin moth
oblique thicket
it's getting late here, good luck
Thanks mate 🙂 gn
grave frost
@twin moth Could you put a link here to explain what exactly the task is?
twin moth
Well, nothing specific
The project is an idea they chose
They weren't told to do that exact task
grave frost
I meant what exactly is the task?
twin moth
Oh, we're trying to figure out if it's possible to predict a persons gender and age using a facial image
grave frost
Could you post an example?
twin moth
Of an image or rather of the structure of the data?
grave frost
image
grave frost
Oh, that's pretty easy. What the expected output type?
twin moth
Well, let me just explain how it works
We have a dataset of a about 70K facial images, those images are classified by gender and age.
We analyze those images using OpenCV and dlib in order to find 68 unique facial points (same on every face).
We then normalize those coordinates so they can be compared to one another
grave frost
That's too ancient 😁 if the age is in range (i.e 10-20 years, 20-30years etc.) you could simply do image classification
twin moth
After that we calculate the key distances between certain points (~175 distances for every face)
grave frost
or Image regression if you want to-the-dot age approximation for each face
twin moth
And we fit that all into a Pandas DF which we run the ML against
grave frost
twin moth
And we fit that all into a Pandas DF which we run the ML against
Manually taking out feature points is a pretty bad idea as it deprives the model with key information
twin moth
grave frost
That's too ancient 😁 if the age is in range (i.e 10-20 years, 20-30years etc.) ...
While I love that feedback we really don't have time to make such huge changes since the project due date is in 3 days basically
twin moth
grave frost
Manually taking out feature points is a pretty bad idea as it deprives the model...
wdym?
grave frost
Well, the real strength of the DL model is that it can segment/identify feautures automatically thereby doing most of the work
FInding out manual interest points is inefficient and crude
A simple classification model can do that with atleast 95% accuracy
98-99 if you tune it
grave frost
Image would be converted to DF values
oblique thicket
why 175 distances and not 68?
grave frost
And why was there a restriction on DL?
oblique thicket
you might have some wacky intercorrelation there
maybe put cord 1 to 0 and every other cord is the distance between cord i and cord 1
so 67 features
per image
twin moth
oblique thicket
why 175 distances and not 68?
Welcome back!
The 68 is the amount of points in the dlib facial model
We found online a list of 175 key distances
oblique thicket
oh link?
anyway you can try implementing what I said
and compare results
should take 10min max
twin moth
grave frost
And why was there a restriction on DL?
Because they weren't thought how to use it and they are supposed to stick with stuff they learned
grave frost
Well, technically it's not very advanced math, but IDT any algo will get much good performance
grave frost
You are supposed to guess the age and gender with THAT?
twin moth
They did haha
twin moth
grave frost
You are supposed to guess the age and gender with THAT?
lol, they got quite far with it though
oblique thicket
oh well then you must try what I said above without this feature engineering
to at least have a reference point
twin moth
0.85 was the highest they got using linear regression
oblique thicket
make sure it works better*
grave frost
well, I am surprised
twin moth
oblique thicket
to at least have a reference point
Would you mind linking that message?
oblique thicket
lst = [] = list of 68 ordered features
for i in range(1,68):
   lst[i] = lst[i] - lst[0]
lst[0] = 0
if you are getting 85% with linear regression, MLP would be like 99%
grave frost
Multi-Layer Perceptron
twin moth
Perception?
twin moth
I asked if you meant Multi-Layer Perception
grave frost
What is perception?
twin moth
grave frost
Multi-Layer Perceptron
They actually tried it and it returned 0.84
oblique thicket
forgot to add lst[0] = 0 in my code
grave frost
twin moth
They actually tried it and it returned `0.84`
how many layers deep and what no. of parameters?
Either it wasn't deep enough or they didn't configure it properly
twin moth
(solver='lbfgs', alpha=1e-5, hidden_layer_sizes=(10, 2), random_state=1, max_iter=500)
Using SKLearn is usually a bad idea
But did they try increasing the no. of hidden layers>
twin moth
What would you use?
grave frost
TF+Keras all the way
twin moth
Oh, not what I meant
oblique thicket
he said he can't use deep learning
twin moth
That's what they were taught so they kinda had to use it
oblique thicket
and his features are great no need for deep learning anyway
twin moth
But I meant what's the amount of layers you'd recommend
oblique thicket
there isn't a library as good as sklearn for ml
grave frost
@oblique thicket Granted Feauture engineering is powerful, but it isn't everything
grave frost
oblique thicket
there isn't a library as good as sklearn for ml
Lol
oblique thicket
oblique thicket
example of code I used to tune nn classifier
```
cv = StratifiedKFold(n_splits=...
don't guess, gridsearch
 twin moth
oblique thicket
don't guess, gridsearch
twin moth
oblique thicket
don't guess, gridsearch
But that code doesn't run 😦
grave frost
SKlearn is for basic ML.
oblique thicket
oh boy I hope you're not a data scientist
grave frost
For actual implementations, better to use Pytorch or TF
grave frost
oblique thicket
oh boy I hope you're not a data scientist
Not a full one. yet
oblique thicket
pytorch tf is a deep learning framework
twin moth
What about Hugging Face?
grave frost
oblique thicket
pytorch tf is a deep learning framework
and its not for ML? 🙂
I take you are new to ML. SkLearn is supposed to be for people starting out making really simple models quickly and without hassle.
To scale things up, you need an actual lib that can handle everything behind the scenes
oblique thicket
oh boy
grave frost
SKlearn is more for the mathematical side
Well, then tell me what lib do published papers use?
Or any ML research org?
twin moth
So what do we do guys
oblique thicket
you use nn to get 99% accuracy

 heady hatch
Hey do you guys save the weights of the models or the models themselves?
twin moth
misty flint
nice image. looks like dlib library but with lines between points
Exactly it if I'm not mistaken
grave frost
@twin moth Its kinda late for anything special right now; best bet is to increase layers in NN or try out your traditional algo
twin moth
grave frost
<@!191683640118214656> Its kinda late for anything special right now; best bet i...
Exactly
grave frost
twin moth
```py
(solver='lbfgs', alpha=1e-5, hidden_layer_sizes=(10, 2), random_state=1, m...
Try hidden_layer_sizes=(10,5,5,2) or other longer variations
twin moth
We'll be trying now
grave frost
with greater nums
twin moth
What other variations would you use?
grave frost
H-tuning; tho I dont use SKLearn so dunno to what limit it is implemented
twin moth
What's that?
grave frost
ignore that; best way is to swap out Learning rates to see what gives max perf.
At this stage, I doubt Hyperparameter tuning would add much to such a simple linear regression problem
grave frost
Hmm.. could you share your full code
twin moth
def neural_network(x_train, y_train, parameters=None):
    clf = MLPClassifier(solver='lbfgs', alpha=1e-5, hidden_layer_sizes=(10, 5, 5, 2), random_state=1, max_iter=5000)
    if parameters:
        clf = GridSearchCV(clf, parameters, n_jobs=-1, cv=5)
    clf.fit(x_train, y_train)
    return clf

    scaler = StandardScaler()
    x_scale_train = scaler.fit_transform(x_train)
    x_scale_test = scaler.transform(x_test)
 echo bloom
hey guys, can I ask my pandas question here?
velvet thorn
echo bloom
hey guys, can I ask my pandas question here?
sure
 ebon ridge
oblique thicket
there isn't a library as good as sklearn for ml
ebon ridge
oblique thicket
there isn't a library as good as sklearn for ml
LOL seriously?? In my opinion the only good use for Scikit-Learn is building pipelines and preprocessing... Go on Tensorflow for the rest, or Pytorch what you like the most
That's the engineering level, if u want to go deeper, try building your algorithms from scratch if u are a good DS
echo bloom
so basically im trying to remove the top 5 rows of my excel file
but when I attempt to do that, it will set subject: Tourism as the column header
and the variables row will get deleted instead
how do I work around this
bronze skiff
grave frost
I take you are new to ML. SkLearn is supposed to be for people starting out maki...
well, not really-- you can use ray or dask to scale out sklearn to large datasets over large clusters
i take it you're new to ML?
bronze skiff
oblique thicket
oh boy I hope you're not a data scientist
don't gatekeep-- you don't sound that informed yourself
velvet thorn
echo bloom
how do I work around this
you're loading it into pandas?
velvet thorn
ebon ridge
LOL seriously?? In my opinion the only good use for Scikit-Learn is building pip...
classical ML defo still has its place in today's world
misty flint
twin moth
Hey guys, a friend of mine is working on a school project and he's currently stu...
||oh wait. i think your friend is in my class||

 wise root
can someone review my code
Stack Overflow
I tried to implement the perceptron algorithm from scratch but it returns all zero.Can anyone tell what is wrong.
Here are the shapes of the X_train,y_train,X_test
X_train.shape = (415, 31)
y_train.
astral path
i'm trying to use a function f for i in l type loop on a dataframe column which contains both values that exist and NaN values, and I want to apply f to all values which are not NaN, but keep the NaN values in the column. How should I do that?
sizes = [[r[1] for r in [list(d.values()) for d in list(eval(str(row)))]] for row in df1['availableSizes'] if pd.notna(row)] is what I have right now, but it just removes the NaN values
wise root
bronze skiff
can you confirm that your weights are changing
the weights after about 100 iterations converges to NaN
hasty grail
astral path
i'm trying to use a `function f for i in l` type loop on a dataframe column whic...
Don't use for-loops, as they are much slower. Use df.apply instead.
velvet thorn
astral path
`sizes = [[r[1] for r in [list(d.values()) for d in list(eval(str(row)))]] for r...
oh god
🥴
...show a small sample of the data
astral path
oh lol i'll try an apply but here i'll show the data
 celest thistle
astral path
`sizes = [[r[1] for r in [list(d.values()) for d in list(eval(str(row)))]] for r...
celest thistle
astral path
`sizes = [[r[1] for r in [list(d.values()) for d in list(eval(str(row)))]] for r...
the sheer confidence in this line of code is staggering
celest thistle
best practices are for the weak
astral path
lol it worked for the non NaN data!
velvet thorn
astral path
lol it worked for the non NaN data!
about that data...
astral path
yeah that but
in the end the goal is to make a column for each unique size value and for each item, have a 1 or a 0 to indicate if it's available in that size or not
velvet thorn
sure
 cursive wadi
wise root
https://stackoverflow.com/questions/66235638/why-does-my-perceptron-algorithm-re...
cursive wadi
wise root
https://stackoverflow.com/questions/66235638/why-does-my-perceptron-algorithm-re...
Try starting with random weights, not zeros
velvet thorn
!e
import pandas as pd

s = pd.Series([[{'size': 'M'}, {'size': 'S'}], pd.NA, [{'size': 'M'}]])
print(s)

result = s[s.notna()].map(lambda ms: [m['size'] for m in ms])
print(result)
 arctic wedgeBOT
@velvet thorn :white_check_mark: Your eval job has completed with return code 0.
001 | 0    [{'size': 'M'}, {'size': 'S'}]
002 | 1                              <NA>
003 | 2                   [{'size': 'M'}]
004 | dtype: object
005 | 0    [M, S]
006 | 2       [M]
007 | dtype: object
if this is your goal...
...then this is not that good a way of going about it
astral path
what would be a better way to do it?
velvet thorn
!e
import pandas as pd

s = pd.Series([[{'size': 'M'}, {'size': 'S'}], pd.NA, [{'size': 'M'}]])
print(s)

result = s[s.notna()].map(lambda ms: '|'.join(m['size'] for m in ms)).str.get_dummies()
print(result)
@velvet thorn :white_check_mark: Your eval job has completed with return code 0.
001 | 0    [{'size': 'M'}, {'size': 'S'}]
002 | 1                              <NA>
003 | 2                   [{'size': 'M'}]
004 | dtype: object
005 |    M  S
006 | 0  1  1
007 | 2  1  0
separator
between string values
that said
if possible I would look into changing how the DataFrame is created
astral path
ah ok
astral path
the dataframe came like that
velvet thorn
you should look into creating the one hot encoded array directly from source
astral path
it's a dataset from kaggle
astral path
my assignment in my class was to find a dataset with untidy or missing data
and boy did i find one
celest thistle
the real challenge is finding one without that
astral path
do i still need to import ast?
 opal solar
how are you going to wrangle the messy dataset?
velvet thorn
astral path
do i still need to import ast?
try it and tell me
you should strive
to understand the code I wrote above
and why
astral path
i got a TypeError: string indices must be integers
velvet thorn
astral path
i got a `TypeError: string indices must be integers`
...and what do you think that means?
astral path
that im supposed to be using integer indices instead of string indices?
astral path
at m['availableSizes'], should I be calling an integer instead of 'availableSizes'?
velvet thorn
of all the builtin Python collections, only dicts can be indexed with non-ints (excluding slices)
astral path
it looks like the m in the for m in ms is just a single char?
i tried doing just m for m in ms and it gave this:
 ripe forge
Looks like you're iterating over strings
astral path
yeah so ms is the string version of availableSizes
i think i got it
result = s[s.notna()].map(lambda ms: '|'.join(str(m.values()) for m in ast.literal_eval(ms))).str.get_dummies()
celest thistle
I'd really recommend breaking that up into multiple lines for the sake of readability
astral path
just did that
wise root
cursive wadi
Try starting with random weights, not zeros
it works now,
problem was with the activation function
opal solar
which activation function were you using?
wise root
first i was using the linear activation
def activation(self,X): return X
now i used
def activation(self,X): return np.where(X>=0 ,1,0)
astral path
im having some issues merging two dataframes
same dataset as earlier
my overall dataframe looks like this
and im working on the column availableSizes
anyways, I was successfully able to get the sizes into new columns like such with a 1 denoting that particular size is in that index's availableSizes value, but when I try to merge it with the original dataframe (df1)
figure: resultCols
df1 = df1.merge(resultCols, left_on='index', right_on='index') adds this onto the overall dataframe, which is not what it should look like
instead of every size being the exact same for several rows in a row (this occurs at the tail too with different values for each size column), each row should have the correct sizes according to the index of resultCols (1, 3, 5, 6, 7, ... 188816)
each index that doesn't appear should also have a value of NaN in each size column
What should I be doing differently?
https://colab.research.google.com/drive/1rqrDMzOosLOuImeDtRdlfynL7iuUIMfo?usp=sharing
if anyone needs the full code
thank you!
lapis sequoia
astral path
`result = s[s.notna()].map(lambda ms: '|'.join(str(m.values()) for m in ast.lite...
Wow I wish I’d be able to code like this
hasty grail
Don't.
astral path
😳
hasty grail
!zen
arctic wedgeBOT
The Zen of Python, by Tim Peters
Beautiful is better than ugly.
Explicit is better than implicit.
Simple is better than complex.
Complex is better than complicated.
Flat is better than nested.
Sparse is better than dense.
Readability counts.
Special cases aren't special enough to break the rules.
Although practicality beats purity.
Errors should never pass silently.
Unless explicitly silenced.
In the face of ambiguity, refuse the temptation to guess.
There should be one-- and preferably only one --obvious way to do it.
Although that way may not be obvious at first unless you're Dutch.
Now is better than never.
Although never is often better than right now.
If the implementation is hard to explain, it's a bad idea.
If the implementation is easy to explain, it may be a good idea.
Namespaces are one honking great idea -- let's do more of those!
astral path
hasty grail
Don't.
how would you have done this case instead?
this is just a modified version of something another helper provided
hasty grail
I would refactor the lambda function to be a regular function, giving it a name and purpose
Making the code way easier to read
velvet thorn
hasty grail
I would refactor the lambda function to be a regular function, giving it a name ...
in my defence it was shorter when I wrote it!
and there would be method chaining so the .map and .get_dummies would be on separate lines!
😔
astral path
I have a highly unhealthy addiction to one-liners
velvet thorn
ideally
it would have been like this
result = (s[s.notna()]
    .map(lambda ms: '|'.join(m['size'] for m in ms))
    .str.get_dummies())
which I think is quite readable?
hasty grail
sort of, yeah
ripe forge
Hm. I honestly still think it's a lot going on in one call.
Though sure it's not bad or anything, but I'd happily take a version that gives the lambda a proper function instead
 signal scaffold
Can someone please help me out, I want to get started to write a research paper
grave frost
bronze skiff
well, not really-- you can use ray or dask to scale out sklearn to large dataset...
ray or dask to scale MLP's? Looks like google scholars found another way to train BERT lol
 true nacelle
Any of you use Spyder to program? I'm new to this, and have managed to update all of my packages but not python itsel. I want the newest version 3.9.1 and currently have 3.8.5. I cannot for the life of me figure out how to update python to the newest version. Any help is much appreciated.
I used "conda install python=3.9.1" but that did not work
grave frost
Just asking, is there any specific feature you need in python 3.9? if not, then you can stick to 3.8
 rotund dock
Hi Guys! I'm trying to go from this data frame
to something that looks like this
any ideas how can I achieve that?
true nacelle
grave frost
Just asking, is there any specific feature you need in python 3.9? if not, then ...
I was told to update to the newest one, but I do not know why :D, I'm learning python
grave frost
3.8 is good enugh
true nacelle
rotund dock
to something that looks like this
I believe you need to do something like:
dataframe.pivot(index=[what you want the xaxis to be], columns=[what you want the yaxis to be, quite literally the columns], values=[the values to populate your new table])
true nacelle
grave frost
3.8 is good enugh
Any idea how to update if I have to though?
rotund dock
true nacelle
I believe you need to do something like:
dataframe.pivot(index=[what you want th...
yes the values I will populate them afterwards
true nacelle
Be sure to pivot the table AFTER the values, since you need to pass in said values as an argument
rotund dock
true nacelle
Be sure to pivot the table AFTER the values, since you need to pass in said valu...
Yes just realized it... but the process I need to do is on the new data frame that I will populate so I need to figure out a different way
do you know if I can count the unique values of alll the cells of the data frame and not by column? Im trying df.nunique() but it returns the unique values per column
true nacelle
rotund dock
Yes just realized it... but the process I need to do is on the new data frame th...
try axis=1 to have it apply along the rows instead
rotund dock
true nacelle
try axis=1 to have it apply along the rows instead
oh and then i can sum them all
nice thanks!
true nacelle
Happy to help!
ripe forge
true nacelle
Any idea how to update if I have to though?
The easiest thing I've found with conda is making conda environments as needed. So you can leave the existing base install as is and create a new conda environment while specifying the version of Python you want
ripe forge
Are you familiar with virtual environments?
true nacelle
Unfortunately not
ripe forge
Np. Basically python community realised that different versions of the same package don't coexist and so, it can be a pain if you need to work on two versions of the same package for two different projects for example
So the concept of virtual environments was introduced. It's simply a way to isolate your package install (like your pip installs) from each other such that you can freely install versions of the same package that cooperate with each other
true nacelle
Ok that makes sense
ripe forge
Without polluting your "base" environment, say by installing two packages that require different versions of the same thing.
true nacelle
Do you have to install python modules like matplotlib or numpy again then? For each environment?
ripe forge
With that context take a look at this link
ripe forge
true nacelle
Do you have to install python modules like matplotlib or numpy again then? For e...
Exactly. You got it. Now it won't actually re-download everything and usually uses symlinks but that's implementation detail
So it doesn't end up bloating your system either. It's a rather clever solution overall.
true nacelle
I see. Since I use Anaconda for downloading and programming in Python, more specifically using Spyder, how can I easily download all the necessary modules again, given that there are so many of them?
ripe forge
There's ways to clone the entire environment that exists, so it's generally pretty smooth
But python version can introduce breaking changes for dependencies so I don't recommend cloning when changing py version
true nacelle
Something you do in the .condarc config file, seems like from the website you linked to.
true nacelle
ripe forge
But python version can introduce breaking changes for dependencies so I don't re...
I see
ripe forge
Yes or further down the website links a conda clone command too
Btw just for your knowledge conda is only one of the many options available for creating virtual environments. Since you're using anaconda using conda env manager makes sense but it's good to know
There's venv, pyenv and probably a few others
true nacelle
Ah okay. I've only just started to learn about this, and ngl I find it a bit intimidating.
ripe forge
Don't worry, this is strictly in the "go as you need to, learn at your own pace" type of deal.
Most users don't need to worry about it while starting out.
true nacelle
All I want at this stage is to have all my packages and the latest python version.
true nacelle
ripe forge
Most users don't need to worry about it while starting out.
Yeah it can quickly get overwhelming if you try to learn everything at once.
ripe forge
It's just that since you have an environment (even base, the default, is an environment) that already has packages installed that conda checked with the assumption of using python 3.8, it can lead to complications
true nacelle
I see
ripe forge
So it's better to lock the python version for an environment first and then get packages up and running on it. Conda will then manage everything for you
true nacelle
So I'd need to create a new environment and "add" the python version I want first, and then add my packages?
ripe forge
Yep. You may also do it in a single command, but essentially yes.
true nacelle
I see. I'll have to read through the website and find the relevant commands.
ripe forge
Yep! Command 6 onwards is what you want, but I'd suggest taking some extra time and reading the highlights of the page and explanations anyways
true nacelle
Thanks a lot for help! Now I'm not as confused as I was to begin with, and have some solid material to learn from.
ripe forge
Yep, no worries :)
rotund dock
got another question... how can I drop the repeated value of this np.array (but the one from the middle and not the last one, thats what np.unique does). I have to do it systematically so I need to always drop when it first appears
 charred apex
rotund dock
got another question... how can I drop the repeated value of this np.array (but...
charred apex
rotund dock
got another question... how can I drop the repeated value of this np.array (but...
So if you have more than two same values, then you want to keep only the last one?
If I guessed it right, then what about processing the list BACKWARDS, you put every element into set, but only if its not yet there, if its a duplicate, then you just delete it or not copy into new list or whatever you want to do with the duplicates...
rotund dock
charred apex
If I guessed it right, then what about processing the list BACKWARDS, you put ev...
mmm could be let me give that a try...
yes worked like a charm...
 vestal axle
Hi guys, would anyone please webscrape this page for me, it would be awesome to gather realestate information from by country.. here you have the package

GitHub
Scrape finn.no bolig information. Contribute to qiangwennorge/ScrapeFinnBolig development by creating an account on GitHub.
 dim cloud
Guys, could you tell me what is wrong with this line of code? It is showing syntax error
[(df.loc[i,'TotalCharges'] = df.loc[i,'MonthlyCharges']) for i in df.index if df.loc[i,'tenure'] == 0]
bronze skiff
vestal axle
Hi guys, would anyone please webscrape this page for me, it would be awesome to ...
okay-- how much are you charging?
 neon grove
vestal axle
Hi guys, would anyone please webscrape this page for me, it would be awesome to ...
neon grove
vestal axle
Hi guys, would anyone please webscrape this page for me, it would be awesome to ...
Here is a tutorial https://www.youtube.com/watch?v=NNZscmNE9QI

Ever wondered how to make a sneaker bot? You should watch this video!
Check us out at:
https://pythondiscord.com
https://discord.gg/python
 hearty seal
how do i concatenate multiple columns in one column ignoring nans in the string
do i just have to make an if else statement with a for loop?
 short heart
can somebody help me with np
ig sklearn doesnt work with dtype=object so any ideas how to fix that?
ValueError: setting an array element with a sequence.
X_train=np.array([[350,400,600,350,250,275,350,350,350,350,350,450,350,250,350,350,450,450,600,700,600,525,550,600,600,600,550,575,500,600,600,600,650,650,650,550,550,650,550,550,550,550,550,550,550,550,550,550,550,550,550,550,550,550,550,550,550,550,550,550,550,550,550,600,600,650,650,650,700,700,700,750,800,800,800,800,800,900,900,900],[150,125,100,80,80,75,75,75,75,75,75,75,75,75,75,75,75,75,49,49,49,49,49,49,49,49,49,49,49,49,49,49,49,49,49,49,49,49,49,75,75,75,75,75,75,75,75,75,75,75,200,175,175]],dtype=np.int32)
Y_train=np.array([900,175],dtype=np.int32)
Have you ever wondered how to compare arrays in NumPy? Should you use "numpy.allclose", "==", "numpy.testing" or something else? (➡️ Tell me which one you are using 😀) I created a hands-on tutorial on this topics! Hope you can learn something new

In this video I describe multiple ways how one can compare NumPy arrays and check their equality.
00:00 Intro
00:29 Example start
00:47 Function generating arrays
02:29 eq
03:02 eq + all()
04:42 np.array_equal
05:56 np.allclose
06:49 np.testing.assert_array_equal
08:09 np.testing.assert_allclose
09:25 Summary
09:43 Outro
Cod...
 tidal bough
numpy.array_equal is worth a mention - it's the right way to also check the shape
little compass
@tidal bough I talk about it in the video. What I don't like about it is that by default it does not handle np.nan
 wind osprey
Hello, has anyone used statsmodels.formula.api before? I have a quick question on it and would greatly appreciate any help
 austere swift
such a nice loss curve
you can evidently see that theres no overfitting whatsoever
 heady warren
does anyone here have experience with creating custom DGL datasets?
 tall basin

What's Up? How's It going?
Are you looking for a lesson in 🎲random numbers in Python🐍? Access this notebook for free!
#Python #100DaysOfCode #30daysofcode #Python3 #ArtificialIntelligence #MachineLearning #DataScience #DEVCommunity #code #tech #Tips

 Twitter
·
dim cloud
dim cloud
Guys, could you tell me what is wrong with this line of code? It is showing synt...
Twitter
·
dim cloud
dim cloud
Guys, could you tell me what is wrong with this line of code? It is showing synt...
Guys anyone?
Yes! I have checked. They are alright.
It's not brackets, it's not spelling.
I don't know what it is.
It says syntax error. Really don't know why.
SyntaxError: invalid syntax.
austere swift
dim cloud
Guys, could you tell me what is wrong with this line of code? It is showing synt...
you're using the assignment operator within the tuple
i think you meant ==
dim cloud
It's not tuple.
austere swift
or maybe :=
dim cloud
No, I meant = only.
austere swift
you cant put = in there
dim cloud
It's just brackets, not tuple.
dim cloud
What's := ?
dim cloud
I want to assign the value of monthly charges at that index to total charges of that index, if tenure == 0
austere swift
!e
a = (b := 12)
print(a)
print(b)
You are not allowed to use that command here. Please use the #bot-commands channel instead.
austere swift
oh lol
dim cloud
What's that?
austere swift
its meant to run that code but i forgot you cant use it here
dim cloud
dim cloud
I want to assign the value of monthly charges at that index to total charges of ...
I want to do that.
So, := would do that?
austere swift
yeah, but you'd also make an unnecessary list
since what you're making is a list comprehension
why not just use a for loop?
dim cloud
Okay. Actually I did use loop after it didn't work. But was just curious why is it not working.
Since I couldn't find anything wrong in the code and yet it was throwing a syntax error.
lapis sequoia
is this a place to ask questions about python programming ?
tidal bough
lapis sequoia
is this a place to ask questions about python programming ?
This server? Absolutely. This channel in particular? If it's related to data science (see channel description), otherwise claim a channel (see #❓|how-to-get-help).
 rigid phoenix
i want to create a boxplot via pandasDataFrame.boxplot(column="dataColumnName", by="seperatingColumnName") but the data in the "dataColumnName" is a list and only the last value of the list should be used. Is there an efficient and clean solution for my problem?
with the pandas.DataFrame.groupby() method maybe
 echo orbit
Hi guys, i'm trying to calculate a likelihood maximum using a particular formula (see below), however i'm not getting the expected result (the likelihood maximum diverges although it's supposed to converge whenever i hit the theorical value). I checked the program like 10 times and i still can't figure out what's wrong with it. Do you guys perhaps can help me please ? ( the L[L>Xm] is a condition that i'm applying (and the function converges when e is above Xm )
bronze skiff
are you sure you're not just hitting numerical stability errors?
echo orbit
wdym ?
bronze skiff
diverging in what way? it blows up to infinity or nan?
echo orbit
The current values don't diverge, but if i were to increase the amount of values, it'll diverge
I think it's better if i show you the expected result & what i get
bronze skiff
lmao
tidal bough
huh, this doesn't look like a numerical problem 😅
bronze skiff
i see
tidal bough
this actually looks roughly linear, as if the sum of logarithms converged to a constant and now it's just 1 + C N
echo orbit
Indeed
misty flint
i was going to ask a question but ive forgotten it 
echo orbit
while it should be something like 1+N/[something that increase with N]
 molten bluff
hello guys, I have a question.
I have a dataset where each like is like a dictionary and file format is of csv, is there a way to convert it into json or a dataframe.
Data looks like this:
{"id": 1349506133036322818, "conversation_id": "1349506133036322818", "created_at": "2021-01-13 18:58:29 Eastern Standard Time", "date": "2021-01-13", "time": "18:58:29", "timezone": "-0500", "user_id": 733226435331162112, "username": "mickeytis", "name": "tismickey 🌑♿", "place": "", "tweet": "@AskeBay why when UK is in full lockdown and not meant to go too strangers houses are you still allowing people to list collect in person  or is this your way of saying @eBay_UK cares more about ££ than the risk of customers getting covid?", "language": "en"}

{"id": 1349506001632780288, "conversation_id": "1349506001632780288", "created_at": "2021-01-13 18:57:58 Eastern Standard Time", "date": "2021-01-13", "time": "18:57:58", "timezone": "-0500", "user_id": 1011480290013818880, "username": "priscillaavc", "name": "scilla🦋", "place": "", "tweet": "idk who needs to hear this but stop going to parties, or meetups and stop acting like this pandemic is over. wear ur mask and stay home. as someone who’s currently sick with covid and has family members sick, just stay home, it’s not hard.", "language": "en"}
as you can see each line is like a dictionary but the entire files is a csv
grave frost
misty flint
i was going to ask a question but ive forgotten it <:Clown2:793694826822107146>
Haha happens to all of us
@molten bluff just google it
echo orbit
I freaking did it
If anyone gets a similar issue : in my function, N was always the same regardless of how many values were removed because of the condition. However the sum was based on the list AFTER the values were removed. So N had to change depending on it
 nimble solar
hi i am trying to extract a date from pandas dataframe row, but there is no key for for date
what is the best way to extract the date?
misty flint
what does your dataset look like
grave frost
Anyone here experienced with ray and tune?
 ancient frost
molten bluff
hello guys, I have a question.
I have a dataset where each like is like a dicti...
ancient frost
molten bluff
hello guys, I have a question.
I have a dataset where each like is like a dicti...
This looks like .jsonl (json lines) checkout the pandas.read_json function
 carmine iron
How can i get the last date by symbol in this dict of tuples
{('2020-12-01', 'FB'): 2000,
('2020-12-02', 'FB'): -5025,
('2020-12-04', 'FB'): 1950,
('2020-12-01', 'AAPL'): 15000}
lapis sequoia
carmine iron
How can i get the last date by symbol in this dict of tuples
{('2020-12-01', 'F...
@client.command()
async def time(ctx):
    timestamp = ctx.message.created_at
await ctx.send(timestamp)```i am, whats your question
 autumn veldt
Question here:
lets say I have 500 datasets, its 350 dataset for apple and 150 dataset for orange. this kind of datasets imbalanced, so i want to take new dataset where theres only have 150 apple and 150 orange. my question is how to do that?
(without using SMOTE 'cause oversampling/overfitting case)
hasty grail
I assume by "dataset" your mean "sample"
autumn veldt
yeah...
hasty grail
You could just use random.choice (or some variant thereof) to take 150 out of the 350 apples
And then shuffle them with the 150 oranges
Of course, this assumes that your dataset is small enough to fit in memory
autumn veldt
i c... thanks
hasty grail
np
 solemn mantle
@austere swift Wow.....I joined this discord 5 minutes ago and I already found something I can use.
I just start learning 2 days ago too lol
Walrus operator
print(number_list := [1, 2, 3])
Thanks for that
solemn mantle
But if even an noob like me can find it useful it must be good right?
and its EZ to remember
hasty grail
print(number_list := [1, 2, 3])
This isn't a good use for it
If it makes your code less readable just for the sake of saving one line then don't use it
!zen
arctic wedgeBOT
The Zen of Python, by Tim Peters
Beautiful is better than ugly.
Explicit is better than implicit.
Simple is better than complex.
Complex is better than complicated.
Flat is better than nested.
Sparse is better than dense.
Readability counts.
Special cases aren't special enough to break the rules.
Although practicality beats purity.
Errors should never pass silently.
Unless explicitly silenced.
In the face of ambiguity, refuse the temptation to guess.
There should be one-- and preferably only one --obvious way to do it.
Although that way may not be obvious at first unless you're Dutch.
Now is better than never.
Although never is often better than right now.
If the implementation is hard to explain, it's a bad idea.
If the implementation is easy to explain, it may be a good idea.
Namespaces are one honking great idea -- let's do more of those!
austere swift
yeah that was the main argument
austere swift
it was making it less readable and more complicated
solemn mantle
Yep, the tutorials I am using seems to do that alot
austere swift
!pep 572 heres the pep if you wanna check it out
arctic wedgeBOT

**PEP 572 - Assignment Expressions**
Status
Accepted
Python-Version
3.8
Created
28-Feb-2018
Type
Standards Track
austere swift
it has a bunch of cases where it would be useful
solemn mantle
So its a judgement call that comes from experience correct?
I am getting that sense when it comes to lambda functions as well.
hasty grail
Yeah
If you're calling more than 3 functions in a lambda then you probably should make it a regular function
solemn mantle
3 is free 4 is more, Got it
solemn mantle
Rules of Thumb are usually like that 🙂
But if that rhyme helps me remember then its cool. Kinda like the DRY acronym.
hasty grail
If you have long function names then probably don't put them in a lambda at all
solemn mantle
That sounds like using a bunch of 6 syllable words in a sentence....
Sure it looks great to English scholars....but regular people like me just say why? You could have just written 3 sentences
But who am I, just a 2 day noobs
 quaint bloom
how can i vectorize this, maybe using map? the code below works, but i want it to be something more like x_train = get_spectrogram(metadata_train[:, 2]).
s = get_spectrogram(metadata_train[0, 2])
x_train = np.zeros((len(metadata_train), s.shape[0], s.shape[1]))
for i, track_id in enumerate(metadata_train[:, 2]):
    x_train[i] = get_spectrogram(track_id)
just for clarification, get_spectrogram takes in a string representing the name of an audio file and outputs a 2D array representing a spectrogram, and the second column of metadata_train contains all the names of the audio files. i want to generate spectrograms for all the files listed in metadata_train and store them into a 3D array
hasty grail
I don't think you can really do that since it involves reading files
x_train = np.stack([get_spectrogram(track_id) for track_id in metadata_train[:, 2]])
o
hasty grail
Is probably the best you can do
quaint bloom
ooh i forgot about stacking, thx!
hasty grail
np
hasty grail
Well, the only data structure that's being used here is the array
It's mainly through experience in optimizing/cleaning up code
misty flint

oh i meant in general bc ive seen you helping others but i see
i hope i can become as good as you one day

hasty grail
I have only done Python for around 1.5 years tbh
Granted, I had prior programming experience

 sand sluice
whats a good way to detect spikes?
 hasty grail
!docs scipy.signal.find_peaks
arctic wedgeBOT
scipy.signal.find_peaks(x, height=None, threshold=None, distance=None, prominence=None, width=None, wlen=None, rel_height=0.5, plateau_size=None)```
Find peaks inside a signal based on peak properties.

This function takes a 1-D array and finds all local maxima by simple comparison of neighboring values. Optionally, a subset of these peaks can be selected by specifying conditions for a peak’s properties.

Parameters  **x**sequenceA signal with peaks.

**height**number or ndarray or sequence, optionalRequired height of peaks. Either a number, `None`, an array matching *x* or a 2-element sequence of the former. The first element is always interpreted as the minimal and the second, if supplied, as the maximal required height.

**threshold**number or ndarray or sequence, optionalRequired threshold of peaks, the vertical distance to its neighboring samples. Either a number, `None`, an array matching *x* or a 2-element sequence of the former. The first element is always interpreted as the minimal and the second, if supplied, as the maximal required threshold.... [read more](http://docs.scipy.org/doc/scipy/reference/generated/scipy.signal.find_peaks.html#scipy.signal.find_peaks)But how else would you define a "spike"?
sand sluice
i was thinking maybe something to do with standard deviation possible
but i don't really know any statistics so wanted to ask
hasty grail
Hmm not sure, I haven't dealt with signals personally
misty flint
i feel like having a threshold value is the only way...but thats just my impression
hasty grail
Maybe you can collect all the peaks (i.e. local maxima) and only select the ones that have a peak prominence that is certain std above the mean peak prominence
sand sluice
rn what im doing is checking for values greater than avg + 3 * std which is probably not ideal but its working for now so ¯_(ツ)_/¯
 floral nova
say i wanted to put all these numbers into a graph
and i dont want to type them out one by one
how would it be done?
all the numbers are in a txt file
 hasty grail
looks like something that can be parsed as a csv
with a double* space as the separator
!d csv
arctic wedgeBOT
Source code: Lib/csv.py
The so-called CSV (Comma Separated Values) format is the most common import and export format for spreadsheets and databases. CSV format was used for many years prior to attempts to describe the format in a standardized way in RFC 4180. The lack of a well-defined standard means that subtle differences often exist in the data produced and consumed by different applications. These differences can make it annoying to process CSV files from multiple sources. Still, while the delimiters and quoting characters vary, the overall format is similar enough that it is possible to write a single module which can efficiently manipulate such data, hiding the details of reading and writing the data from the programmer.... read more
velvet thorn
floral nova
say i wanted to put all these numbers into a graph
and i dont want to type them ...
have you worked with pandas before?
 autumn veldt
Question here:
dm = data_dum.apply(le.fit_transform)
i using labelEncoder to encode my csv, but its also affect on target class. how do i make my target class not included on labelEncoder?
there's 8 features on my csv, but i want to LE only for 7 features(columns)
echo bloom
@velvet thorn hey, sorry for the late reply but i resolved the issue on my own, thanks alot though 😄
 agile wing
i need to relearn....everything
floral nova
velvet thorn
have you worked with `pandas` before?
um no sorry
spring mortar
Does anyone have any idea why the MNIST Handwriting Dataset is password protected and if it was always like that? https://yann.lecun.com/ Also where to find the dataset for trying around?
tall trail
times_df = pd.date_range(start_time, periods=duration+1, freq=f'S').to_frame(name = 'time')

endtime = times_df['time'].tail(1)
how does this return a series instead of just the last timestamp in the dataframe?!
 rose musk
Do we need to code the normal distribution pdf and cdf from the beginner level or can we use the libraries like scipy and scikit learn
For a begginer to learn things?
 nova widget
@spring mortar : from keras.datasets import mnist
 young dock
I'm trying to collect data from the chessdotcom api into jupyter but it appears to be going quite slow. Is there a way to speed it up?

is there anything i can do to my code to speed it up?
its going at only 100 users / 70 seconds, and I want to atleast 10000, which takes multiple hours at this rate
velvet thorn
young dock
I'm trying to collect data from the chessdotcom api into jupyter but it appears ...
are you rate limited
velvet thorn
well I mean
young dock
Rate Limiting
Your serial access rate is unlimited. If you always wait to receive the response to your previous request before making your next request, then you should never encounter rate limiting.However, if you make requests in parallel (for example, in a threaded application or a webserver handling multiple simultaneous requests), then some requests may be blocked depending on how much work it takes to fulfill your previous request.
young dock
well given the api limit, async wouldn't do much I guess
velvet thorn
young dock
well given the api limit, async wouldn't do much I guess
it depends
on what the rate limit is
probably at least higher than sync
but if your bottleneck is the API
there aren't really many ways to speed it up
you could thread with proxies or something
austere swift
it may just be slow because of the processing on their end
i've had experience with apis being really slow because their servers are slow
young dock
velvet thorn
on what the rate limit is
true
velvet thorn
austere swift
i've had experience with apis being really slow because their servers are slow
ye and async would probably help with this
 feral shard
spring mortar
Does anyone have any idea why the MNIST Handwriting Dataset is password protecte...
feral shard
spring mortar
Does anyone have any idea why the MNIST Handwriting Dataset is password protecte...
You could use sklearn.datasets.fetch_openml, that might be the easiest way to download MNIST
velvet thorn
unless you hit rate limits
velvet thorn
young dock
although, I'm not really sure how to make it async in jupyter
Jupyter natively supports async
well, more accurately, IPython does
 dusty anchor
hey guys, im working with a pretty large dataset, and im having many memory problems when i load my pictures, what can i do to check how much ram i should need, and if i use CUDA does it change something or its even worse?
tidal bough
CUDA involves loading (at least parts of) your dataset into your video RAM, I believe. So you'll need to manage the memory usage on your video card, too.
Basically, you might want to consides processing your dataset in parts, which will help handle memory usage of both kinds.
dusty anchor
tidal bough
Basically, you might want to consides processing your dataset in parts, which wi...
how can i do this? when i prepare it i shuffle it and i also divide it in batches (8) and then i also use the prefetch function
Im honestly not that expert of CUDA, i have 16GB of RAM and a 2080TI with 11GB of VRAM
tidal bough
Not sure what you mean. The few times I worked with Cuda (in PyTorch and a bit in MatLab) I had to load all the relevant tensors to VRAM to do operations on them.
maybe there's a way to toggle that, though - I'm reading PyTorch docs and it mentions:
Unless you enable peer-to-peer memory access, any attempts to launch ops on tensors spread across different devices will raise an error.
so I guess it's possible
dusty anchor
im using tensorflow rn, i basically did nothing to enable CUDA except installing the required libraries...
tidal bough
you don't need to enable CUDA in pytorch either, but apparently you need to configure it if you want to do mixed-device operations
and I'm honestly not sure how it does them either.
ancient frost
If you're doing NN stuff on GPU everything needs to go on VRAM- using system memory would be dreadfully slow. Tensorflow/Pytorch should handle this all for you though. Just make sure your batch size is small enough to fit
dusty anchor
tidal bough
and I'm honestly not sure *how* it does them either.
for what i know i should feed only small batches to the gpu so it doesnt overload VRAM, but i use a batch size of only 8 and i still get a lot of problems... so im wondering if im doing something wrong
dusty anchor
ancient frost
If you're doing NN stuff on GPU everything needs to go on VRAM- using system mem...
yes iv also reduced my whole dataset to be only 600MB so it should be loaded completely into my VRAM...
ancient frost
dusty anchor
yes iv also reduced my whole dataset to be only 600MB so it should be loaded com...
It also needs to fit the model into memory on it- AND all the gradients, and some other random overhead- so it will work out to lot more than 600MB
I'd try with a batch size of 1 and see if it runs- if it does then you know it's a memory problemo
dusty anchor
indeed but it still has 10.4GB free
ancient frost
Then it is not a memory problemo lol
dusty anchor
just to be sure, to feed a batch i use the .batch() function right?
dusty anchor
ancient frost
Then it is not a memory problemo lol
i mean 10.4 before load all the model and the rest, im using a U NET so maybe it is more demanding...
ancient frost
dusty anchor
i mean 10.4 before load all the model and the rest, im using a U NET so maybe it...
I'd just try a batch size of 1 to rule out memory issues then
dusty anchor
ancient frost
I'd just try a batch size of 1 to rule out memory issues then
with 1 it used 5.5GB of VRAM during training, same thing with 4, but my dataset only has 280 images rn, if i try to increase it to around 1.1GB (580 pics) and i use 1 as batch size the VRAM goes to 10.2/11 and the net not even start to train... ( exit code -1073741819)
ancient frost
dusty anchor
with 1 it used 5.5GB of VRAM during training, same thing with 4, but my dataset ...
Are you using a generator to feed the dataset, or is it all being copied over at once? (Also are you using pytorch or TF, I know a lot more about TF)
PyTorch I might not be able to help as much
dusty anchor
ancient frost
Are you using a generator to feed the dataset, or is it all being copied over at...
all at once with TF, i made a function that load all the image on my paths list with the load_img function
austere swift
could you show some of your code?
dusty anchor
austere swift
could you show some of your code?
sure, where can i post it?
austere swift
!paste
arctic wedgeBOT
Pasting large amounts of code
If your code is too long to fit in a codeblock in discord, you can paste your code here:
https://paste.pydis.com/
After pasting your code, save it by clicking the floppy disk icon in the top right, or by typing ctrl + S. After doing that, the URL should change. Copy the URL and post it here so others can see it.
ancient frost
You should check out the ImageDataGenerator stuff on TF docs
I gotta keep on some work stuff but that should have everything you need https://www.tensorflow.org/api_docs/python/tf/keras/preprocessing/image/ImageDataGenerator
TensorFlow
Generate batches of tensor image data with real-time data augmentation.
dusty anchor
https://paste.pythondiscord.com/mirumezana.properties this is what i do to load the images and create the dataset
dusty anchor
ancient frost
I gotta keep on some work stuff but that should have everything you need https:/...
im gonna try with this, if it can solve my problem, thank you
ancient frost
Oh actually sorry, that won't work for segmentation- you probably need to make a generator yourself :/
my b
dusty anchor
ancient frost
Oh actually sorry, that won't work for segmentation- you probably need to make a...
i see, it may be out of my competence tbh...
spring mortar
feral shard
You could use `sklearn.datasets.fetch_openml`, that might be the easiest way to ...
Can I download it to a specific path? I'm using PyTorch and apparently they can also download it but it doesn't work as expected for some reason
lapis sequoia
Hey has anyone been able to fix the god damn completion suggest issue with jupyter? Jedi is so annoying and can't find any alternative to it
young dock
velvet thorn
Jupyter natively supports async
Oh, like multiple cells can run parallel?
grave frost
lapis sequoia
Hey has anyone been able to fix the god damn completion suggest issue with jupyt...
Kite
 tidal bronze
PLEASE
austere swift
theres a limited amount of autocompletions
lapis sequoia
it showed me 7 day trial
austere swift
for the free version
tidal bronze
USING SCIKIT KMEANS HOW TO ACESS THE CLUSTER SIZE
lapis sequoia
and that's it
lapis sequoia
i was looking... it seems jedi or go fck yourself with completion helper
austere swift
why not use jupyter within vscode
i'm pretty sure you can use vscodes autocomplete within it
grave frost
I forgot the name.. wasn't there some competetitor to kite that used GPT2 for autocompletion?
TabNine!!
lapis sequoia
austere swift
why not use jupyter within vscode
Yeah doing that now
grave frost
I hope Tabnine is free. It was pretty great
misty flint
if youre a student you can get the pro version of pycharm
grave frost
yep, its free
grave frost

PyPI
Jupyter notebook extension which support coding auto-completion based on Deep Learning
You'd be surprised how many problems you can solve just by a simple google search 😁
lapis sequoia
yeah i tried searching "jupyterlabs jedi alternative" and was filled with kite
grave frost
Googling is an art
lapis sequoia
True
one more question anyone has a blue how come cross merge is not working?
    {'Name': 'John', 'Role': 'Accounting'},
    {'Name': 'Jake', 'Role': 'Head of operations'},
    {'Name': 'July', 'Role': 'Head of production'}
])

production_staff = pd.DataFrame([
    {'Name': 'Jake', 'Role': 'Head of operations'},
    {'Name': 'Mike', 'Role': 'Forklift operator'},
    {'Name': 'July', 'Role': 'Head of production'},
    {'Name': 'Terry', 'Role': 'Labeling'}
])```factory```tried this one and this one:
factory```worked fine yesterday :/
gives me a:
KeyError: 'cross'
young dock
@velvet thorn I tried to make a second notebook to collect data in parallel, but it stopped the first one lol
young dock
Same one
grave frost
well, if you want to do parallel jobs on the same server, just run more kernels for each jb
young dock
Okay, I'll try that, thanks
 storm lintel
im tryign to make a code that gives restock info but im having loads of toruble
if anyone knows how to lmk please
 zenith panther
hello guys can anyone explain to me this code what gives me ? data['VisitorType'].value_counts()
young dock
I think it tells you how frequently a given type of visitor appears in the dataset
so maybe 'intruder' appears 7 times, and 'friend' appears 93 times
zenith panther
that does make sense thank you 🥰
 hasty mountain
Hey guys, I've imported an excel file into a DataFrame in Python, but the excel file got some numbers as 10% instead of 0.1. because of that, they're interpreted by Python as strings, right?
 lavish swift
@hasty mountain yep, probably. Can check with df.dtypes if it says "object" that generally means strings
 charred umbra
It dosen't necessarily matter though; in theory, you could just remove the % and make a lambada function to covert it into a decimal
hasty mountain
I see. So, if I want to apply a machine learning process using that data, do I have to convert the numbers into floats?
grave frost
hasty mountain
I see. So, if I want to apply a machine learning process using that data, do I h...
What is "machine learning process"?
charred umbra
Yeah could you elaborate on what you trynna do?
hasty mountain
Machine learning model. I'm not familiar with the terms.
Like, if I want to use a Decision Tree with that data.
grave frost
And what is you data?
hasty mountain
The string numbers in the excel file
charred umbra
Ah ok so classification, what are your classes
hasty mountain
Uh, they're numbers that indicate probabilities.
charred umbra
how many classes you got?
hasty mountain
Many. The Dataframe got 228 rows x 47 columns.
charred umbra
Oh wow, thats actually alot
grave frost
hasty mountain
Uh, they're numbers that indicate probabilities.
Are those numbers discrete or are they ranged?
hasty mountain
They have a fixed value, can't assume another one.
grave frost
hasty mountain
Many. The Dataframe got 228 rows x 47 columns.
what you are looking for is regression. Usually, whenever doing regression, it is better to normalize your data. So, you should convert the integers into floats in range [0,1] so that your model converges. seeing you have percentage, it should be no problem
hasty mountain
I think that's a discrete number...
charred umbra
hasty mountain
Hey guys, I've imported an excel file into a DataFrame in Python, but the excel ...
for a pseudo code for this id do:
for value in file:
value.remove("%")
value = float(value)
hasty mountain
Hm... I see.
lavish swift
While it won't normalize your data, you can also try setting the dtype when you read in the Excel file.
It's one of the options for read_excel in pandas
hasty mountain
Thanks!
But actually, there's some strings in the data, explaining what the numbers are for.
I'll see if I can normalize the numbers without changing those words.
hasty mountain
Hm... Yeah, I'm having some problems with that.
I'm trying to do the following:
(with data = the DataFrame made from the excel file and scaler = MinMaxScaler(feature_range=(0,1)):
for i in data:
if "%" in i:
i.remove("%")
scaler.fit(i)
else:
pass
twin moth
Hey guys, I'm working on (yet another) project with friends.
We're trying predict correlations between heatmaps by checking the differences between different pixels (after normalizing them)
We are comparing ~250 maps * the number of categories we take (about 5) (350*700) pixels.
We'd love some assistance regarding choosing a fitting ML algorithm for that data type
 fleet trail
Hello, can anyone give me an idea of a machine learning project
twin moth
An example of the data:
Y,X,Year,Month,Land_Surface_Temperature Color Index,Land_Surface_Temperature Is Valuable,Vegetation Color Index,Vegetation Is Valuable
28,160,2000,3,-1,False,15.0,True
28,161,2000,3,-1,False,10.0,True
28,162,2000,3,-1,False,10.0,True
28,176,2000,3,-1,False,19.0,True
28,177,2000,3,-1,False,11.0,True
28,178,2000,3,-1,False,15.0,True
28,179,2000,3,-1,False,14.0,True
28,180,2000,3,5,True,16.0,True
28,181,2000,3,-1,False,14.0,True
28,182,2000,3,0,True,19.0,True
28,183,2000,3,0,True,12.0,True
28,184,2000,3,2,True,14.0,True
28,185,2000,3,0,True,11.0,True
28,186,2000,3,-1,False,18.0,True
28,187,2000,3,0,True,15.0,True
28,188,2000,3,-1,False,17.0,True
28,189,2000,3,-1,False,17.0,True
28,190,2000,3,-1,False,15.0,True
28,191,2000,3,-1,False,18.0,True
28,192,2000,3,-1,False,17.0,True
28,193,2000,3,-1,False,21.0,True
28,194,2000,3,-1,False,25.0,True
28,195,2000,3,-1,False,29.0,True
28,196,2000,3,-1,False,35.0,True
28,197,2000,3,-1,False,29.0,True

 bitter kayak
I have no idea what you are showing me @tribal tree
 tribal tree
bitter kayak
I have no idea what you are showing me <@!735485405327261766>
tribal tree
bitter kayak
I have no idea what you are showing me <@!735485405327261766>
the topic is application of stacks
and my teammates gave me to look for function call
bitter kayak
the time complexity of a function call is entirely dependent on what happens inside it. There's no single answer
tribal tree
ok then can you explain it to me using an example
 sacred pebble
has anyone done any NLP?
bitter kayak
if I have a function that just returns the same value I give it, then the time complexity for it is O(1). If I have a function where I supply a value and a number and want to get back n instances of that value, then the time complexity is potentially O(n).
tribal tree
would it always be in O(n) format?
bitter kayak
time complexities are typically portrayed that way
bitter kayak
that's also typically expressed in O notation
bitter kayak
that's how complexities are annotated, yes
bitter kayak
not necesarily, no
the time and space complexity of a function is going to depend entirely on what the function does.
tribal tree
ohh
my team-mates did this.

they said this one is for backtracking
@bitter kayak
Also Used a rat mage puzzle example for showcasing
bitter kayak
gotcha, but again, unless they are giving you a specific function to work with to get the time and space complexity of it, the answer is open-ended. Unless I'm completely misunderstanding the question
tribal tree
ok
tribal tree
bitter kayak
gotcha, but again, unless they are giving you a specific function to work with t...
specific function for example?
bitter kayak
that's up to them to provide. I don't know what the stipulations of the assignment are
do they want you to provide some specific function and determine the time complexity of it?
tribal tree
bitter kayak
that's up to them to provide. I don't know what the stipulations of the assignme...
ok
and is there any particular algorithm for call function?
bitter kayak
"call function"?
again, calling what function?
again, I'm not sure if I'm just not getting the whole picture here, but it sounds like the answer to such a question is going to depend entirely on what function is being called
tribal tree
bitter kayak
again, I'm not sure if I'm just not getting the whole picture here, but it sound...
funtion call
not call function
typed by mistake
bitter kayak
same thing, it's impossible to say what the time complexity is without knowing what the function does
so either they're wording the question badly or there's something else I'm not getting
tribal tree
nvm that now
 zenith nova
I think it's for a general algorithm
tribal tree
wait
zenith nova
IE: a function that does backtracking has a certain big O
like a function that does depth first search, for example, or one that does merge sort
 zenith nova
I see. Yeah, a stack
A function call adds to the stack. A return pops from the stack
python functions implicitly return None at their end
zenith nova
However, you can run any kind of code in a function, of course, so the runtime of a function is you know, flexible
tribal tree
zenith nova
However, you can run any kind of code in a function, of course, so the runtime o...
i see
tribal tree
tribal tree
like this
can u tell me this way?
zenith nova
Not really, since it's not the same thing
tribal tree
i see
with an example?
would it work then?
here is another one.

but this one is for backtracking
zenith nova
No, because they're fundamentally different concepts unless I'm misunderstanding you
An algorithm is a series of steps to solve a specific problem
A function call is executing an arbitrary series of steps
storm lintel

how would i go about transfering this to multiple websites with dif products (not done yet)
and would this give stock or would i have to specificy the in stock in the html
to where almost like if stock is true print so and so
ancient frost
storm lintel
to where almost like if stock is true print so and so
I see you writing scalper bots 👎
storm lintel
ancient frost
I see you writing scalper bots 👎
im not
im trying to make a discord bot to ping when the ps5 comes in stock lmao
im making the bot for the legit oposite reasom
im trying to learn webscrapping
im also to trying to make it for gpus too
not for scalping
ancient frost
I would try sites like
https://webscraper.io/test-sites
for learning web scraping
You need to train your web scraper? We have created simple test sites that allow you to try all corner cases and proof test your scraper. Try it now.
Won't upset any sys admins
storm lintel
ok ill try it
i was following a guy who was doin that and i was trying to alter the code for other items
@ancient frost do you have experience with docker
twin moth
WTF why does LassoLars return a negative value!?!?!?
Start at: 1613686275.1784973
Linear LassoLars
Train Score:
0.0
Test Score:
-0.03070242642243115
Finished at: 1613686275.4402394
--- Took 0.26174211502075195 seconds ---
It's strange that it doesn't work with PyTorch, maybe you don't have permission to save in the working directory or something? Anyway you could try saving the arrays with numpy.savetxt.
 velvet thorn
young dock
Would this be considered an example of heterosescdacity?
velvet thorn
young dock
Would this be considered an example of heterosescdacity?
what are x and y
heteroscedasticity btw
young dock
X is the highest tactics rating of a given user on chess.com, Y is the most recent rapid rating of said user
velvet thorn
young dock
X is the highest tactics rating of a given user on chess.com, Y is the most rece...
I mean
how do you intend to relate them
heteroscedasticity is basically
young dock
I intend to find the strength of correlation, and also create some type of regression
velvet thorn
you have y, which depends on x. for different ranges of x, the corresponding range of y has different variance.
so I would say...seems like it? to your question
but there are statistical tests for that
young dock
basically, if im understanding correctly, if the data has heteroscedasticity, then I think we use different types of regression
feral shard
young dock
Would this be considered an example of heterosescdacity?
Looks like it, but it's kind of hard to tell visually. Especially since you have a lot less data for high x.
young dock
yeah that was my concern
feral shard
I think you should do a statistical test for it
young dock
ok, ill try to look into that
velvet thorn
young dock
basically, if im understanding correctly, if the data has heteroscedasticity, th...
linear regression assumes heteroscedasticity
young dock
oh so linreg would be fine