#data-science-and-ml
1 messages · Page 284 of 1
 velvet thorn
it is true that some places use "data analyst" as "low-level data scientist"
but
it really depends.
 lapis sequoia
It sounds like data analysts are those who use models that are already built and ready to be used. And it kinda sucks if you don’t know how to build a proper model for your data analysis but have to depend on scientists
I don’t know tbh
velvet thorn
lapis sequoia
It sounds like data analysts are those who use models that are already built and...
no
not necessarily
for example
one of your main responsibilities could be building dashboards
 sage dagger
lapis sequoia
It sounds like data analysts are those who use models that are already built and...
sage dagger
lapis sequoia
It sounds like data analysts are those who use models that are already built and...
What do you mean by models? Statistical models? Because i dont think Data scientists create new statistical models that often.
lapis sequoia
I mean, machine learning models. I just have the feeling that data scientists know better than data analysts
sage dagger
Yeah well if you want to get deeper into that field you defo need to know your maths.
but as i said not impossible to learn. Just needs some time
sage dagger
I believe in you, bro
lapis sequoia
man I'm so honored
sage dagger
If you ever get greater, remember me
sage dagger
Are you trying to decide on a course of studies or why are you asking about the maths?
lapis sequoia
so I might as well start learning regardless of the concern if I'd be great or not
because I'm afraid
I'm kinda old enough and can't fall behind anymore
I want the right path
which nobody can answer
sage dagger
Yeah man, just do what makes you happy haha and if it's not it, do something else
sage dagger
I did a Bachelor's in biology before i realized i wanted to do CS and DS
i was afraid of the maths too when i started
But i passed all my exams on the first try even tho it was hard it is doable
My grades weren't great tho
velvet thorn
you might never be the best
but you don't have to be
as long as what you're doing makes you happy and fulfilled
IMO
lapis sequoia
might be a very basic question, but i have dataframes like this:
              High    Low    Open    Close    Volume    Adj Close    Dates
date
2020-09-16    116.00    112.04    115.23    112.13    155026675.0    111.769125    18521.0
2020-09-17    112.20    108.71    109.72    110.34    178010968.0    109.984886    18522.0
2020-09-18    110.88    106.09    110.40    106.84    287104882.0    106.496150    18523.0
2020-09-21    110.19    103.10    104.54    110.08    195713815.0    109.725723    18526.0
2020-09-22    112.86    109.16    112.68    111.81    183055373.0    111.450155    18527.0
...    ...    ...    ...    ...    ...    ...    ...
2021-02-02    136.31    134.61    135.73    134.99    82266419.0    134.787956    18660.0
2021-02-03    135.77    133.61    135.76    133.94    89880937.0    133.739528    18661.0
2021-02-04    137.40    134.59    136.30    137.39    84183061.0    137.184364    18662.0
2021-02-05    137.42    135.86    137.35    136.76    75693830.0    136.760000    18663.0
2021-02-08    136.96    134.92    136.03    136.91    71297214.0    136.910000    18666.0
and I need to take the last index date and add 22 empty rows
so i need 22 empty rows going into the future from 2021-02-08
nevermind
 gleaming badge
Is the issue of tensorflow fixed already? Cause couple of weeks ago the latest/later version 3.9.1 etc was not supporting Tensorflow and had to be fixed.
Is why i still using the 3.6.x and the 3.8.x Python versions.
Thx in advance
lapis sequoia
just figured it you
 ripe forge
https://paste.pythondiscord.com/povitudosu.apache take a look at this, here's the kind of solution I was thinking of. Dont have a lot of time atm to go through it though apologies.
How much time does running that code take on your machine?
 twin moth
ripe forge
How much time does running that code take on your machine?
twin moth
ripe forge
How much time does running that code take on your machine?
The code you just sent or the entire code we've been writing ?
ripe forge
The one I sent
twin moth
I'll check it in a moment
But I don't understand one thing
Let's say I have both matrices:
- distance matrix between my heatmap and the "clean" heatmap -- used to find the colored pixels, the ones which differ from the different map
- a distance matrix between each pixel and all of the pixels on the scale
What's the next step? What do I do from there
ripe forge
Why are there two distance matrix
Oh i finally see why you got the 245000, 245000 matrix. This is wrong no?
You only want the comparison 1 pixel against the same pixel on clean map, no?
A distance matrix is for each pixel against all pixel. If I understand your original intentions you only needed this against the scale
We had "solved" the problem of getting pixels that differ without any distance matrix. A direct subtraction, square, then sum along the last axis.
twin moth
My logic says:
- I should check whether the distance between the two heatmaps is 0 -> I ignore this filter
- If it's not 0 I need to check where that pixel is on the scale, so I search for the minimal distance between that single pixel from the heatmap and ALL of the pixels from the scale and the same pixel on the clean heatmap
- When I find the a match (exact or close to that as possible) I insert it into a Pandas DataFrame for each map (each map represents a single month) and I merge those after each map I analyze
twin moth
ripe forge
You only want the comparison 1 pixel against the same pixel on clean map, no?
Yeah, I already changed it to using the following:
clean_distances_mat: np.ndarray = np.sum((colored_mat - default_mat) ** 2, axis=2)
Point 1 is a pixel to pixel comparison, so no distance matrix there.
Yep. That looks fine to me
twin moth
ripe forge
Yep. That looks fine to me
Amazing
So now how to I do that all without iterating through those matrices
Because I need to check those pixels y'know?
ripe forge
Take a look at the snippet I sent
twin moth
I mean after I have those two matrices, what then?
Yes, I can use argmins() (if I'm not mistaken) in order to find the minimal distance for each pixel
But I'd still need to iterate over the matrix in order to insert every pixel
ripe forge
No iteration 😁
You can use those indexes to just select the final values
Also completely vectorized
 hasty grail
Did it work?
 acoustic roost
Hello everyone
Quick question
Do websites use datasets/data frames for storing personal user information??
 abstract zealot
Im not entirely sure @acoustic roost they use servers to potentially store data in a whole hoax of forms, usually encrypted first and then sorted as csvs, json etc If you look it up you might find that different companies store things in different ways, I’m not sure about the one ‘industry standard’
lapis sequoia
hey, i need some help with a dataframe that contains two curves. how can i find the intersections of these two curves without looping through the entire dataframe? Example data:
a = [0, 2 , 3, 5, 9, 15, 30, 40, 50, 45, 40, 35, 25, 15, 5, 0]
b = [30, 12, 10, 8, 5, 4, 3, 2, 1, 0 , 10, 12, 30, 40, 50, 60]

df = pd.DataFrame(
    {'a': a,
     'b': b,
    })
df
how can i find the two points where a and b intersect ?
what i am trying to do is actually find the last golden cross and death cross of a stock's ichimoku indicators
 steel roost
hey guys question, how would i write my date to an excel? Data : {'A17': None, 'B17': None, 'F17': None, 'G17': None, 'H17': None, 'A18': None, 'B18': None, 'F18': None, 'G18': None, 'H18': None, 'A19': None, 'B19': None, 'F19': None, 'G19': None, 'H19': None, 'A20': None, 'B20': None, 'F20': None, 'G20': None, 'H20': None, 'A21': None, 'B21': None, 'F21': None, 'G21': None, 'H21': None, 'A22': None, 'B22': None, 'F22': None, 'G22': None, 'H22': None, 'A23': None, 'B23': None, 'F23': None, 'G23': None, 'H23': None, 'A24': None, 'B24': None, 'F24': None, 'G24': None, 'H24': None, 'A25': None, 'B25': None, 'F25': None, 'G25': None, 'H25': None, 'A26': None, 'B26': None, 'F26': None, 'G26': None, 'H26': None, 'A27': None, 'B27': None, 'F27': None, 'G27': None, 'H27': None, 'A28': None, 'B28': None, 'F28': None, 'G28': None, 'H28': None, 'A29': None, 'B29': None, 'F29': None, 'G29': None, 'H29': None, 'A30': None, 'B30': None, 'F30': None, 'G30': None, 'H30': None, 'A31': None, 'B31': None, 'F31': None, 'G31': None, 'H31': None, 'A32': None, 'B32': None, 'F32': None, 'G32': None, 'H32': None, 'A33': None, 'B33': None, 'F33': None, 'G33': None, 'H33': None, 'A34': None, 'B34': None, 'F34': None, 'G34': None, 'H34': None, 'A35': None, 'B35': None, 'F35': None, 'G35': None, 'H35': None, 'A36': None, 'B36': None, 'F36': None, 'G36': None, 'H36': None, 'A37': None, 'B37': None, 'F37': None, 'G37': None, 'H37':
None}
code: ```python
for data in log_data:
site_info = data.split()[3:6]
site_info = str(site_info).replace("'","")
date_info = str(data).split()[0]
odometer_start = data.split()[-1].replace('miles',' ')
for num in cell_range:
everytime i attempt to use sheet[cell].value in the num loop, it keeps saving as the final run, i'd rather it write per row instead of cell. any ideas?
 limpid oak
lapis sequoia
```
a = [0, 2 , 3, 5, 9, 15, 30, 40, 50, 45, 40, 35, 25, 15, 5, 0]
b = [30, 12, ...
limpid oak
lapis sequoia
```
a = [0, 2 , 3, 5, 9, 15, 30, 40, 50, 45, 40, 35, 25, 15, 5, 0]
b = [30, 12, ...
please state your desired output clearly, with explains
let me try something
 nova widget
lapis sequoia
```
a = [0, 2 , 3, 5, 9, 15, 30, 40, 50, 45, 40, 35, 25, 15, 5, 0]
b = [30, 12, ...
nova widget
lapis sequoia
```
a = [0, 2 , 3, 5, 9, 15, 30, 40, 50, 45, 40, 35, 25, 15, 5, 0]
b = [30, 12, ...
if you just put a i n the df you can use df.isin(b)
 astral path
Hi all! quick question on data viz
if I'm trying to plot to change in position from one moment to the next of a point on a graph with multiple other points on it, how would I do that?
i.e.
i have this plot
and this
where each one of the first plot's points are correlated to another specific point on the second graph
what would be the most effective way to vizualise how each point changes to the next?
thanks!
nova widget
ah, this is the 2nd-shot thing?
how about a two color gradient vector? so start is green and end is red?
btw is this dataset public?
I think arrow will be too clotted
astral path
Yeah its that one!
I got it from a public place but cant remember the source
And yes like a two color gradient vector
nova widget
is it real games or computer?
astral path
Real
nova widget
cool
astral path
Like i kinda have an idea but dont know how to actually plot it, let alone with plotly
This data im plotting with right now is only the xy data and frequency of nearest neighbors
nova widget
a 2d quiver plot

Stack Overflow
I have 2 nxn matrices, 1 containing the x-component of the vector field and the other the y-component. Additionally I have 2 lists of each length n with the x, and y position respectively.
now I w...
 pine knoll
[Total noob] I'm trying to plot user ratings over time and managed to output this chart:
data.rolling('1d').mean().plot(ylim=(1), grid='true')
I have set date as index, and I also have other properties such as language
Q: is there an easy way to overlay also a line chart per language ?
astral path
nova widget
https://stackoverflow.com/questions/55317069/vector-field-plot-with-2-matrices-q...
Is there a way to weight hue or thickness of arrow by how frequently there are near neighbors?
nova widget
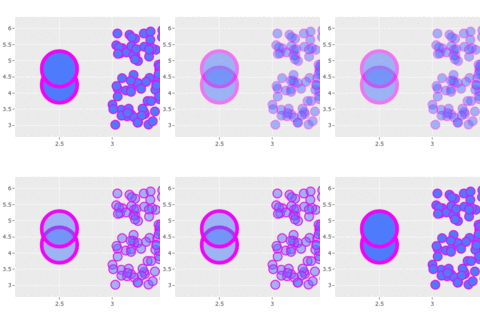
How to style markers in Python with Plotly.
 ancient frost
Hello! I'm a data scientist and I love python! Hoping to become a part of the community 🙂
ancient frost
pine knoll
[Total noob] I'm trying to plot user ratings over time and managed to output thi...
Pandas plots use matplotlib behind the scenes, and it's pretty easy to overlay things if you use that. Here's a good example https://python-graph-gallery.com/122-multiple-lines-chart/ Happy to help a little after work today if you'd like 🙂

Graphics #120 and #121 show you how to create a basic line chart and how to apply basic customization. This posts explains how to make a line chart with several lines. Each line represents a set of…
astral path
nova widget
https://plotly.com/python/marker-style/
so.... it ended up kinda looking like a mess
how could I make it more readable while still representative of the dataset?
right now it's printing out the memory address of the object
so you're going to want to loop over each element in dataloader using a for datapoint in dataset
nova widget
@astral path they don't seem to connect, every arrow shouldn't have the same length
astral path
they don't
nova widget
I would expect a lot of them more than 2m apart
astral path
with less points
astral path
no it's about location of missed shots and then location of the following shot
I'm doing this type of plot to visualize how each shot loc correlates to the next one
astral path
yeah I was surprised too
nova widget
distance between feet 😄
but, you should be able to filter them on binary axis direction
astral path
what's that
nova widget
like all arrows moving up are 1 and all arrows down are 0
astral path
ah
astral path

Plotly Community Forum
Hi ,i would like to have plot like this ,it is possible in plotly or not?
I need to get a writeup done on this but i'm just realizing this data is looking very wrong
should be a lot more random
maybe the vectors are connecting points that shouldn't be connected?
nova widget
well at least most 2nd are further out
ancient frost
You could lay-out the area into a grid, then assign each vector to a grid and average per each. Maybe with a color to indicate how many points are in that square?
astral path
i'll be back in a while, i have to get a writeup done and go to a class but I'll come back !
thanks in the meantime!
 misty flint
astral path
so.... it ended up kinda looking like a mess
misty flint
astral path
so.... it ended up kinda looking like a mess
the flat one 💀
astral path
lol
misty flint
but that last one looked dope. especially with the overlay(underlay?)
astral path
yeah but it doesn't make sense for what i'm trying to visualize
astral path
every shot and next shot shouldn't be right next to each other like the plot is implying
misty flint
hf in class btw
astral path
hf?
misty flint
have fun
misty flint
rip
astral path
¯_(ツ)_/¯
 jagged iris
@client.command()
async def graph(ctx, *, blob):
ticker = blob
yf.download(ticker)
newtime = yf.download(ticker, start = "2015-01-01", end = "2021-12-31")
number = random.randint(1, 999999999999999999)
newtime['Adj Close'].plot()
plt.xlabel("Date")
plt.ylabel("Adjusted")
plt.title("Price data")
plt.savefig(f"{number}.png")
plt.close
file = discord.File(f"{number}.png")
e = discord.Embed(title=f"{blob} Price Data")
e.set_image(url=f"attachment://{number}.png")
await ctx.send(file = file, embed=e)```
When I do this the graph keeps being used. I do for instance `$graph TSLA` and it shows data for tesla stock. Then I do `$graph AMZN` it shows data for amazon and also tesla. How do I ensure that it is a fresh graph everytime the command is run? harsh reef
Hey how do we create weights like i want to convert my data to pretrained weights any help?im new to this
 tribal ibex
I have a pandas question. Is this the right place to ask it?
astral path
yes
misty flint
ye
 clear trench
this is kind of a narrow question relating to time series analysis with pandas/sklearn: i would like to compare two time series for correlation - they both have very similar features, but one is kind of... squished. there's more noise, the time scale is compacted, and it's vertically stretched a bit. is there a method that would allow me to "normalize" the deformed one, or is there a method that could compare the two and automatically account for the deformation?
tribal ibex
If you have JSON like this
{ x: 1,
y:2,
z: [ {a: 1, b:2}]
}
and z might have zero, one or two elements
do you know how you would use json_normalize to get a dataframe with a row that has columns like this
[x, y, a1, b1, a2, b2]
where if there is zero nested items then it would have all the as and bs empty
etc.
I can't think of a way to do it
or if it's not possible would groupby be a potential way to do it?
velvet thorn
clear trench
this is kind of a narrow question relating to time series analysis with pandas/s...
vertically stretched meaning?
clear trench
increasing in value more quickly
velvet thorn
clear trench
increasing in value more quickly
what’s wrong with that
or rather
why would that affect your ability to calculate correlation
for different scale, you could resample
clear trench
velvet thorn
for different scale, you could resample
don't know how! i'm total novice D:
velvet thorn
clear trench
don't know how! i'm total novice D:
did you try searching?
clear trench
i did not! i was in a help channel, and someone suggested resampling to me, and then they had to go
clear trench
❤️
astral path
mm this plot
lapis sequoia
I did a df.groupby(["a", "b"]).col1.mean() and now I want to make each "a" a column so I have a dataframe like b, a, col1
I think right now I'm stuck with a MultiIndex of (a,b)
hmm, seems as though .unstack().T seems to work
 shadow steeple
hey I need some help with pandas
i'm a noob
I want to add tuples to a data frame by iterating through another data frame and adding the tuples which have a specific value
velvet thorn
shadow steeple
I want to add tuples to a data frame by iterating through another data frame and...
I suggest you refrain from storing tuples in a DataFrame
generally that suggests you have the wrong data model
shadow steeple
ah python tuples I see
velvet thorn
okay tell me what you're trying to do
shadow steeple
Ok I'll write some pseudocode 1 sec
newDataFrame = pd.Dataframe() for row in df.rowiter(): if row has what I need: newDataFrame.add(row)
velvet thorn
hm
use filtering
in general, iterating over a DataFrame is an antipattern
because it prevents you from taking advantage of vectorisation
shadow steeple
not familiar with those. are they python concepts?
velvet thorn
also, snake_case for Python please
velvet thorn
shadow steeple
not familiar with those. are they python concepts?
vectorisation -> parallelisation @ the processor level
have you heard of SIMD?
shadow steeple
nope
velvet thorn
basically
shadow steeple
taking my first OS class rn
velvet thorn
your CPU
has certain instructions
that allow you to operate on multiple memory addresses at the same time
which speeds them up a lot.
conversely, when you iterate, you perform sequential operations
example:
!e
import pandas as pd

s = pd.Series([1, 2, 3, 4, 5, 6])
print(s)

# I want only the even numbers
evens = s[s % 2 == 0]
print(evens)
 arctic wedgeBOT
@velvet thorn :white_check_mark: Your eval job has completed with return code 0.
001 | 0    1
002 | 1    2
003 | 2    3
004 | 3    4
005 | 4    5
006 | 5    6
007 | dtype: int64
008 | 1    2
009 | 3    4
010 | 5    6
011 | dtype: int64
Ok. Because if multiple processors were able to access the same area of memory at the same time there would be a problem basically?
velvet thorn
shadow steeple
Ok. Because if multiple processors were able to access the same area of memory a...
only if you were to write to it
but
that's neither here nor there
shadow steeple
yeah
velvet thorn
the point is that if you're trying to iterate there's usually a better way
so, in this case
what you should do is filter
shadow steeple
how is it any different than iterating
velvet thorn
like in my example
velvet thorn
shadow steeple
how is it any different than iterating
it's vectorised
like I said
an iterative solution processes rows one by one, whereas a vectorised solution processes rows in bulk
shadow steeple
hm
velvet thorn
the second reason is
the size of a DataFrame is fixed
so every time you "append" etc. you are actually creating a new DataFrame and copying memory
shadow steeple
ah
velvet thorn
which gets slow real quick
shadow steeple
immutable
velvet thorn
it's the same reason you don't perform iterated concatenation on strings
velvet thorn
shadow steeple
immutable
no
DataFrames are mutable
but of fixed size
just like C arrays are mutable, but of fixed size
velvet thorn
i.e. you can change what they contain, but not how big they are
shadow steeple
yeah that would be a waste
how do you know this about dataframes by the way?
that they're fixed size
shadow steeple
short is fine for now
I understand 2d array allocation in c
would it just be that?
velvet thorn
because DataFrames are backed by numpy arrays
which in turn
are backed by C arrays
shadow steeple
bet cool
I didn't know pandas had anything to do with numpy though. i saw there were some functions to convert though.
thanks!
velvet thorn
numpy is for general numeric computing
pandas is specifically for data analysis/data science
of tabular data
ancient frost
jagged iris
```py
@client.command()
async def graph(ctx, *, blob):
ticker = blob
yf...
U prolly already solved this but plt.show() will finalize your current plot and then the next one will be it's own
 ancient frost
I'm forever thankful that someone invented pandas so I can use python instead of R
Not that there aren't tons of cool features in R- but it ain't my vibe
 turbid minnow
Does numpy store array elements as a string???
hasty grail
Not entirely sure why it did that, but if you insist on storing different data types inside the same array you can use dtype=object
It's usually a bad idea though, in most cases you would be better off managing such data using a pandas DataFrame
 plain jungle
Guess it’s kinda data science, it’s a NN AI to play the google chromes Dino game
ripe forge
turbid minnow
Does numpy store array elements as a string???
Numpy wants homogenous dtypes. It wouldn't do this conversion if the string was not present in the list
misty flint
plain jungle
Guess it’s kinda data science, it’s a NN AI to play the google chromes Dino game
woah you made that? how did you get it to skip its jumping animation

pine knoll
ancient frost
Pandas plots use matplotlib behind the scenes, and it's pretty easy to overlay t...
Thank you! I'll have a look 👀
 vivid maple
Hello everyone, I need a few project ideas for my major University project, can anyone help me out ?
 hard canopy
Hello here. I have a text dataset that is awfully encoded. It is a mix of several encoding that ended up as bad UTF-8. in a text file. Is it possible to get this text in a somehow OK state ?
 eternal zephyr
sql
 cold gull
plain jungle
cold gull
plain jungle
@misty flint it’s the same if you hit Duck it pulls you out of a jump like the old game
ripe forge
hard canopy
Hello here. I have a text dataset that is awfully encoded. It is a mix of severa...
Nothing foolproof. Encoding problems should generally be fixed earlier upstream.
If that's not an option then you can try some rules or dictionary based approaches to try to fix the text perhaps but there will be incorrect updates
steel roost
import os
import pandas as pd
from openpyxl import load_workbook


cur_folder = os.path.dirname(os.path.realpath(__file__))
cur_folder = str(cur_folder) + "\\"
columns = ['A','B','F','G','H']
miles_log = cur_folder+"mile_log.txt"
miledge_sheet = cur_folder+'blank mileage log.xlsx'
limiter = 2


wb = load_workbook(miledge_sheet)
ws = wb['Sheet1']
df = pd.DataFrame(ws.values)

with open(miles_log,'r') as f:
    data = f.readlines()
    f.close()

for i in data:
    count = 0
    i = i.split()
    date = i[0]
    sites = str(i[3])+ ' to ' + str(i[5])
    miles = str(i[7])
    #wantto write to the rows in the range below
        df.loc[17:36,[]] = [date,sites,miles]


wb.save('test.xlsx')
print('#WORKBOOK SAVED#')
may someone advise me how to write my data from the text file to the cell range [17 to 38]? i've been stuck on this for a awhile
 fading hamlet
I wrote this to collect .csv and .excel files from current path and write into python.
My question is: is it good or bad practice to do it this way? Note that this is just a small set of data.
However, is it a inefficient way of doing it having in mind that i'm going to manipulate the data later in the next step?
    dt = os.listdir(os.getcwd())
    data = {}
    for dt, name in enumerate(dt):
        if ".csv" in name:
            k = pd.read_csv(name, delimiter=";", decimal=",")
            v = name[:-4].lower()
            data[v] = k
            print(name)
        elif ".xlsx" in name:
            k = pd.read_excel(name )
            v = name[: -5].lower()
            data[v] = k
            print(name)
        else:
            continue
    # print(os.listdir(os.getcwd()))
    return data
data = collect_data() ```Appreciate to hear some thoughts on this
 grave frost
misty flint
woah you made that? how did you get it to skip its jumping animation
grave frost
misty flint
woah you made that? how did you get it to skip its jumping animation
While it's midair, you can press down to get it to skip the animation. Just go to chrome://Dino and try it out
 maiden crag
Hi. Quickly question. I'm beginner using Python what do you recommend me for start in Data Science. 😋
 cerulean spindle
maiden crag
Hi. Quickly question. I'm beginner using Python what do you recommend me for sta...
cerulean spindle
maiden crag
Hi. Quickly question. I'm beginner using Python what do you recommend me for sta...
After learning Python, I read "Introduction to Machine Learning with Python." It talks about scikit-learn basics, but before reading this, you should do some mini tutorials on DataCamp about matplotlib, numpy, pandas... this is so you learn about basic data manipulation and how to analyze data using these tools
hard canopy
ripe forge
Nothing foolproof. Encoding problems should generally be fixed earlier upstream.
I chose to drop the badly encoded data. it was too much of a PITA to deal with
ripe forge
Good call
maiden crag
cerulean spindle
After learning Python, I read "Introduction to Machine Learning with Python." It...
Thanks It's helpful. 😀
lapis sequoia
Hey, i need help with a AI chatbot
 white gull
I need help with a scipy python program
I'm trying to import a scipy module but I get this error
Traceback (most recent call last):
  File "Char_9.py", line 4, in <module>
    import scipy.linalg
  File "/home/pi/.local/lib/python3.8/site-packages/scipy/linalg/__init__.py", line 195, in <module>
    from .misc import *
  File "/home/pi/.local/lib/python3.8/site-packages/scipy/linalg/misc.py", line 3, in <module>
    from .blas import get_blas_funcs
  File "/home/pi/.local/lib/python3.8/site-packages/scipy/linalg/blas.py", line 213, in <module>
    from scipy.linalg import _fblas
ImportError: /home/pi/.local/lib/python3.8/site-packages/scipy/linalg/_fblas.cpython-38-arm-linux-gnueabihf.so: undefined symbol: npy_PyErr_ChainExceptionsCause
btw i had built scipy from source using pip install . because i was having issues with installing it through pip install scipy
astral path
how would I cluster points in this scatterplot such that each cluster contains, say, exactly 20 points and doesn't overlap with another cluster?
 sturdy dune
Amazing Python automation with few lines of code.
https://datamahadev.com/10-amazing-python-hacks-part-2/

The main purpose of this article is to learn(or automate) a few basic things with the help of python...
 noble sand
What sort of data visualisation modules are there in Python other than Amueller's WordCloud and standard matplotlib modules?
 frozen basin
can someone dm me?
 plucky zephyr
i have dataset, classification problem
with target value 50% class 0 and 50% class 1
i'm making logistic regression, how i know my model have better prediction than random guess ?
 rotund dagger
not sure what i am doing wrong with my line of code, i have a dataframe i want to select these 5 cities specifically. and the rainfall column for these cities. anyone else see the error?
i think it may be becuase there are multiple instances and i may need to groupby first becuase it doesnt know what row for that city i want?
twin moth
Hey guys, I know that it's possible to create a boolean array in such a way:
bool_arr = arr != term
Is it possible to create one using multiple terms in a single line of code?
bool_arr = arr != term1 and arr != term2
Found a solution, feel free to make use of it
np.where((arr1 != 2) & (arr1 != 3), True, False)
 pine panther
@twin moth I think that would also work without wrapping in np.where
 umbral coral
!resource
arctic wedgeBOT
Resources
The Resources page on our website contains a list of hand-selected learning resources that we regularly recommend to both beginners and experts.
https://pythondiscord.com/pages/resources
velvet thorn
twin moth
Found a solution, feel free to make use of it
```py
np.where((arr1 != 2) & (arr...
you don't need np.where
(arr1 != 2) & (arr1 != 3) would be sufficient
twin moth
velvet thorn
`(arr1 != 2) & (arr1 != 3)` would be sufficient
Huh, so when would you use it?
twin moth
Indeed
velvet thorn
when you want to control what makes it in to the destination array based on whether the condition holds
result = np.where(cond, x, y)

# is the same as

result = cond.copy()
result[cond] = x
result[~cond] = y
basically.
twin moth
Cool, thanks 🙂
twin moth
velvet thorn
`(arr1 != 2) & (arr1 != 3)` would be sufficient
Why doesn't (arr1 != 2) and (arr1 != 3) work?
 magic flame
I'm trying to parse through a spread sheet and match the value from one sheet to another but my second iteration never runs. I'm very lost and have no clue what it going on. Pls help.
import openpyxl

removal = openpyxl.load_workbook("Device_Removal_Request_Reyes.xlsx")

sheet = removal["RFS deleted workstations"]

hostnames=[]


for row in sheet.iter_rows(sheet.min_row, sheet.max_row, min_col=1, max_col=1):
    for desire in row:
        hostnames.append(desire.value)

#print(hostnames)

exsheet = removal["Exported Data from ZS Portal"]

for r in exsheet.iter_rows(exsheet.max_row, exsheet.min_row, min_col=1, max_col=1):
    for data in r:
        print(data.value)
the for r loop at the bottom never runs and I have no idea why
 last rivet
@magic flame while you question is not entirely far away from data_science, you should open a help channel #❓|how-to-get-help for these kinds of questions... 🙂
As it's asking for help and not related to data science (e.g matplotlib)
magic flame
My mistake
 queen gorge
Can someone help me? I need to update all the values of a column to be the same as the first record for each group in a pandas groupby. The issue is I often get nan from the source but a lot of the time (not all of the time) other records in that group will have the value I need and it is universal to all records in the group so if I can just copy it to the others it would make things more accurate for me. Is there a way to do this in a groupby or should I subset out, remove dupes and left join back in? Thanks!
 visual yoke
Draw the LFSR of 1+x^2+x^5 and compute all the output sequences with start of [0 1 1 1 0].
what does this mean? my professor wants us to use pylfsr library, i dont really understand the documentation :c
velvet thorn
twin moth
Why doesn't `(arr1 != 2) and (arr1 != 3)` work?
because and is part of the native language
and always returns one of its operands (operating on an object level)
you can (kind of) think of it this way:
def and(a, b):
    if bool(a):
        return b
    else:
        return a
however, what you want is to perform a logical AND on an element level
i.e. you want neither a nor b, but rather the results of performing said logical AND on each individual element pair
something like np.array([a_element and b_element for a_element, b_element in zip(a, b)])
lapis sequoia
I’m a DataSiens
 viscid flower
can you create conda env on a new drive than default C drive?
 austere swift
last rivet
<@!151059171834331136> while you question is not entirely far away from data_sc...
austere swift
last rivet
<@!151059171834331136> while you question is not entirely far away from data_sc...
matplotlib is part of data science lol
its literally in the description of this channel
austere swift
 earnest oasis
is this the right chat to talk about tensorflo?
earnest oasis
is this the right chat to talk about tensorflo?
yes
last rivet
@austere swift if recall correctly, he / she asked for how to get data from excel, so I sent it the right way
earnest oasis
Ah sick , I'm learning python rn so I can learn tensorflo to make RuneScape ai bots
Is anyone here employed for AI? Or machine learning?
austere swift
last rivet
<@!494466018245345282> if recall correctly, he / she asked for how to get data ...
ah i misunderstood the ending of your message for you saying that matplotlib isnt part of data science lol
austere swift
earnest oasis
Is anyone here employed for AI? Or machine learning?
I'm not employed for it but I do quite a bit of it
earnest oasis
austere swift
I'm not employed for it but I do quite a bit of it
That's super cool, what type of stuff you use for it?
austere swift
it depends on the project
earnest oasis
Have you made any for games?
austere swift
no
earnest oasis
Oh 😂
austere swift
yeah lol
earnest oasis
I'm barely learning OOP in python so I have ways to go
austere swift
if its just like a simple problem i'd use some basic machine learning in scikit-learn, but for neural networks i usually either use keras or pytorch
keras if its a smaller project, pytorch if its more advanced and i need more verbosity
sometimes pytorch lightning if its in between
earnest oasis
How long have you been doing it?
austere swift
although i find pytorch lightning to be a weird middle ground lol
a few years
i started like 3 years ago
with deep learning
ive been doing data science for about 4 or so
austere swift
yeah the field is well paid
earnest oasis
Oh word so you started learning at age 12 ?
austere swift
yeah
earnest oasis
Dude that's cool
austere swift
i started out with python when i was like 9 or 10
data science at around 11, and machine learning at 12
earnest oasis
That's sick
austere swift
yeah
earnest oasis
I took the digital media route
Photoshop -11 years xp, and illustrator 1year do
Xp*
austere swift
cool
 old thorn
@austere swift is it ok if I add you, cuz im 14 and looking to get better at machine learning as well, because last year I did an app for my science fair, and then this year I did a data analytics project, and for freshman year I want to integrate deep learning with an app, and Im trying to get some advice on how to do it
Edit: had -> add
austere swift
sure
old thorn
thank u! will ask questions tomorrow though cuz I plan on going to bed soon
misty flint
earnest oasis
is this the right chat to talk about tensorflo?
yes
 brittle bolt
Hi I have a question for tf.data.datasets if I use take and skip to split the data into train and validation sets will skip and take ensure the labels are balanced ?
hasty grail
if your initial dataset is uniformly distributed then yes
brittle bolt
ok thanks 😊
 lucid girder
Ive never used Juypter but is it possible within that notebook to support normal python code? Because what if I would like to combine a web scrapper like requests with Juypters data science capabilities? Is there a possibility that could work
hasty grail
If you put everything in one cell it pretty much works like a normal python script
last rivet
Or scrape your dataset before hand or maybe even create a separate script that you import into the notebook
But ideally you would prepare a dataset then use that in the notebook
lucid girder
Also what are the advantages of using Anaconda with PyCharm
What benfits does that bring? Can I use Anaconda notebooks like Juypter In house with PyCharm?
 merry ridge
This is kind of a dumb question, but I am having a difficult time understanding why the kernel trick is helpful.
I completely understand that a kernel operator is semi positive definite iff there exists an inner product with respect to a hilbert space, and that allows you to replace operations on the inner products by evaluations on a kernel, but most kernels are most easily evaluated using the inner product definition themselves and we are back where we started no?
 carmine bough
Hello guys, I have a little programming task, it's about machine learning and pose detection in videos. Probably simple for someone who's a bit into that. I would pay you a little amount of money for doing this for me. If you are interested just message me. 🙂
hasty grail
carmine bough
Hello guys, I have a little programming task, it's about machine learning and po...
Sorry, but
!rules 6
arctic wedgeBOT
6. No spamming or unapproved advertising, including requests for paid work. Open-source projects can be shared with others in #python-general and code reviews can be asked for in a help channel.
twin moth
velvet thorn
i.e. you want neither `a` nor `b`, but rather the results of performing said log...
Thanks!
hasty grail
btw & is bitwise and rather than logical and
So you have to be careful as no error will be given if you accidentally use two arrays that are not both boolean types
Edit: Actually logical_and doesn't give an error as well
lucid girder
Is there a way in Juypter to constantly update the graphs with live Data???
 dusty anchor
hey guys how can i convert a one hot map into rgb?
 rose torrent
Hello, I'm getting started with machine learning using Keras in Python. I'm using the DCGAN code from https://github.com/eriklindernoren/Keras-GAN/blob/master/dcgan/dcgan.py and want to use my own custom images instead of a default Keras dataset. How can I load a folder of images? The set is imported on line 3 and loaded on line 109. Extra context: I'm running this in Google Colab since I don't have a good computer.

GitHub
Keras implementations of Generative Adversarial Networks. - eriklindernoren/Keras-GAN
lapis sequoia
Hey! I would like to build a GAN using Keras in Python with a random loss function but I have no idea how to implement it. In the Keras documentation I read that you can use "loss_fn(y_true, y_pred)" to customize losses. Does anyone have an idea how to program it? Thanks 🙂
 long gate
I've searched online for some on recursion but can't find anything to really explain for me how for example a function like this would be run. Anyone got any good read about it?
def foo(x):
if x == 0:
return
foo(x-1)
foo(x-1)
 serene scaffold
I have several dataframes that are the same shape and which represent the same type of data. I want a new dataframe that tells me which of all those dataframes has the highest value for each cell.
I don't think you can name entire dataframes or have 3d dataframes, so I imagine this isn't supported per se.
 violet dome
hey guys, I want to use python as a research tool, I want to use it for reasearching good articles on investment sectors, economic facts and political conditions. Does anyone reccomand an online project/tutorial where I could learn how to do that?
pine panther
serene scaffold
I don't think you can name entire dataframes or have 3d dataframes, so I imagine...
you can represent 3d data in a pandas dataframe using a multiindex https://pandas.pydata.org/pandas-docs/stable/user_guide/advanced.html#multiindex-advanced-indexing
 next garnet
guys please help me run a program from a github repo
like its essential
please
nobody is answering my helps in help channel
astral path
hey guys, so I have a scatterplot right now which I want to cluster into different locations (kind of like the circled spots on the diagram I made), but when I use kmeans like this:
kmeans = KMeans(n_clusters=12, random_state=0).fit(df1)
kmeans.labels_
``` and make the hue of the graph correlate to `kmeans.labels_`, it colors points seemingly randomly, so I either don't think it's clustering right or i'm not graphic it right.  Any ideas/suggestions for how I should go about doing this?
here's my code for how I'm plotting it:
```python
import plotly.graph_objects as go

fig = go.Figure()
draw_plotly_court(fig)
fig.add_trace(go.Scatter(
    x=missed_points['LOC_X'], y=missed_points['LOC_Y'], mode='markers', name='markers',
    marker=dict(
        size=num_neighbours, sizemode='area', sizeref=2. * 150 / (11. ** 2), sizemin=2.5,
        color=kmeans.labels_,
        line=dict(width=1, color='#333333'), symbol='hexagon',colorscale='rainbow'
    ),
))
fig.show(config=dict(displayModeBar=False))
here's the plot
nova widget
@astral path let me send you another algorithm
serene scaffold
pine panther
you can represent 3d data in a pandas dataframe using a multiindex https://panda...
Thanks, I'll look into that when I get a chance 😁
 hollow sentinel
I’m having a hard time thinking of machine learning ideas
and it’s caused me to not code for a while
how do you guys generate ideas?
I need projects to get internships and I can’t think of any
ancient frost
hollow sentinel
I’m having a hard time thinking of machine learning ideas
When I was trying to build up my resume I would go on Kaggle sometimes and browse through datasets/competitions until I found something interesting. Great website 🙂
hollow sentinel
Yeah I used lots of Kaggle
i don't know why i lost motivation
i'm trying to get it back
hollow sentinel
why is cracking the coding interview so hard to understand
i have found out the hard way that i can't do the interview questions
 north wolf
is not that hard
i think it depends on how well you manage yourself in the language you are solving the problems
grave frost
Doing Sequence classification with pretty giant sequences (~4000). Any Idea how to preprocess?
serene scaffold
grave frost
Doing Sequence classification with pretty giant sequences (~4000). Any Idea how ...
what kind of sequences, and what type of classification?
velvet thorn
hasty grail
btw `&` is bitwise and rather than logical and
indeed it is
(which I actually did not know)
I only ever use them on booleans
grave frost
hollow sentinel
Yeah I used lots of Kaggle
I think Kaggle just sucks; you have like 30 hours a week for experimentation which is ripped off by PhD's running clusters of 10 GPU's. There is a high correlation between GPU's used and CV score. The system tried to minimize this, but it just failed. Colab is maybe a bit better due to more GPU time...
hollow sentinel
why does Kaggle suck?
grave frost
I just told you above
grave frost
serene scaffold
what kind of sequences, and what type of classification?
My sequences are basically medical articles and it is to classify on one single label. The problem is that the sequences are too big and thus the model doesn't converge. How do you guys solve this?
grave frost
hollow sentinel
why does Kaggle suck?
Good for your portfolio I guess, but not the most fair competetion
serene scaffold
grave frost
My sequences are basically medical articles and it is to classify on one single ...
So the sequences are word embeddings?
grave frost
But then I don't know what else they can do, so atleast they are doing something
grave frost
serene scaffold
So the sequences are word embeddings?
No, english 🙂
serene scaffold
So this is a document classification task?
grave frost
yep
serene scaffold
can you shed more light on what algorithm you're using?
grave frost
TF
serene scaffold
transformers?
grave frost
No, LSTM
serene scaffold
I've actually never done document-level classification. Let's see
grave frost
But the sequences are just too big
grave frost
serene scaffold
I've actually never done document-level classification. Let's see
ya, me neither. That's why I am confused and google is of no help at all
hollow sentinel
Oh yeah @grave frost i asked again bc I didn’t get what you said
serene scaffold
grave frost
ya, me neither. That's why I am confused and google is of no help at all
If you're dealing with sequences of tokens, and you're using every single token in the document, so the sequences are too long. Is that the problem that you're having?
grave frost
Well, then how do I narrow done the number of tokens to use?
grave frost
hollow sentinel
Oh yeah <@738058085083381760> i asked again bc I didn’t get what you said
Oh. Well, some people have their own GPU clusters where they can experiment more than others and train models 24x7. That's a pretty big advantage
serene scaffold
grave frost
Well, then how do I narrow done the number of tokens to use?
I'm trying to figure out if this article is relevant to what you're trying to do. Let me know if you've already read it and established that it's not useful: https://towardsdatascience.com/multi-class-text-classification-with-lstm-1590bee1bd17

Medium
How to develop LSTM recurrent neural network models for text classification problems in Python using Keras deep learning library
grave frost
There is a high correlation between GPU's used and CV score
serene scaffold
grave frost
There is a high correlation between GPU's used and CV score
where have you seen this? The GPU should only affect the speed of computation, yes?
grave frost
serene scaffold
where have you seen this? The GPU should only affect the speed of computation, y...
Yes, but it also helps scale up the model that further increases capacity to generalize (after applying proper techniques too, ofc)
Which boosts scores and capacity to experiment
Though Kaggle is great for beginners and others looking to compete
It's just not an even playing field. But it is a great place to learn new things
serene scaffold
@grave frost Anyway, just a thought that I had: have you removed stop words? And have you done anything with term frequency inverse document frequency?
if you think you have everything else set up correctly otherwise, you might use that heuristic to cut some tokens out of the sequence. That could be a terrible suggestion though.
serene scaffold
Is there no way to add a row onto the end of a dataframe in-place?
serene scaffold
ancient frost
https://pandas.pydata.org/pandas-docs/stable/reference/api/pandas.DataFrame.appe...
That's not in-place.
 bold olive
Does anyone have a link to a simple (code-wise, without 100s of function definitions) tutorial on patch based CNN?
velvet thorn
serene scaffold
Is there no way to add a row onto the end of a dataframe in-place?
no, because the backing array is fixed size
why do you want to do that
okay, let me qualify that as (basically) no
velvet thorn
misty flint
what is in-place
inplace means you modify an object instead of creating a new one
velvet thorn
misty flint
also i would also like a CNN tutorial 101 please
that's a wide topic
any specific questions
misty flint
any resources you recommend for someone who has to do a project over OCR
were thinking about doing a project with the EMNIST/MNIST dataset
velvet thorn
misty flint
any resources you recommend for someone who has to do a project over OCR
hm
OCR doesn't necessarily involve CNNs
but of course you can if you want
ripe forge
serene scaffold
Is there no way to add a row onto the end of a dataframe in-place?
No. Dataframe are basically built on numpy arrays
dusty anchor
ehy guys how can i reduce the size of my model?
 hushed orchid
hey so i have this code
infact i have this psuedo code
i am trying to code this into python
def random_linear_classifier(data, labels, params={}, hook=None):
    """

    :param data: A d x n matrix where d is the number of data dimensions and n the number of examples.
    :param labels: A 1 x n matrix with the label (actual value) for each data point.
    :param params: A dict, containing a key T, which is a positive integer number of steps to run
    :param hook: An optional hook function that is called in each iteration of the algorithm.
    :return:
    """
    k = params.get('k', 100)  # if k is not in params, default to 100
    (d, n) = data.shape

    for j in range(1,k):

    # Todo: Implement the Random Linear Classifier learning algorithm here.
    # Note: To call the hook function, use the following line inside your training loop:
    #   if hook: hook((theta, theta_0))
    pass
here's the basic guideline give
just wanted to know
what is hook?
and also when data.shape is executed
what is exactly d and n?
in terms of this psuedo code
 bleak fox
d and n are no of rows and no of columns of data
bold olive
Does anyone have a link to a simple (code-wise, without 100s of function definitions) tutorial on patch based CNN?
long gate
I've searched online for some on recursion but can't find anything to really explain for me how for example a function like this would be run. Anyone got any good read about it?
def foo(x):
if x == 0:
return
foo(x-1)
foo(x-1)
ripe forge
Perhaps this is a decent read https://stackabuse.com/understanding-recursive-functions-with-python/
Stack Abuse
Introduction
When we think about repeating a task, we usually think about the for and while
loops. These constructs allow us to perform iteration over a list, collection,
etc.
However, there's another form of repeating a task, in a slightly different
manner. By calling a function within itself, to solve a smaller instance of the
same problem...
To help guide you, the main theme is this. Whenever a function is called, it gets an independent "place" to run it with its own variables and memory.
So if a function calls itself, it creates this independent place for the next call.
This "place" is known as stacks in a frame.
So, you can keep creating these places in New stacks until one of the function calls gives a return/response. Suddenly causing a chain of responses to go back up these "frames"
So thats what makes recursion work... Gosh i hope that explanation isn't as terrible as it seems to me.
dusty anchor
ehy guys how can i reduce the ram usage of my model?
 stray roost
dusty anchor
stray roost
dusty anchor
well my problem i think is a bit different.. i need to compute my model inside a microcontroller, but it only has 512KB of ram, when my model use more than 40MB
 tidal bough
it depends on what consumes the memory. If the model just weights too much, you're out of luck.
dusty anchor
its a u-net for image segmentation
tidal bough
You could potentially load it layer-by-layer or even partially each layer, but that:
- Would require writing your own forward propagation from scratch
- Would probably be immensely slower than normal
dusty anchor
whell its a micro so its compute power its not that big
do u know any simple model i can use for image segmentation?
i dont need good accuracy, only around 80%
long gate
@ripe forge Thank you, will read it!
hasty grail
dusty anchor
well my problem i think is a bit different.. i need to compute my model inside a...
I don't think you'll be able to achieve much with only 512 KB of ram... you couldn't even load a single image into memory like that (depending on its size)
Perhaps you should consider forwarding the data to a computing server
dusty anchor
hasty grail
Perhaps you should consider forwarding the data to a computing server
this is for a univeristy exam, and the objective is to create a model that can fit into a microcontroller or any embedded system based on arm, but all other students got an image classification assignment, that should be much more easy to implement... Im starting to think that i got assigned a wrong track...
velvet thorn
dusty anchor
i dont need good accuracy, only around 80%
80% is pretty high
dusty anchor
velvet thorn
80% is pretty high
u mean for image segmentation? or in general?
velvet thorn
dusty anchor
u mean for image segmentation? or in general?
when you say image segmentation...you mean like semantic segmentation?
velvet thorn
accuracy is kind of a weird metric for that
dusty anchor
yeah i feel like all the parameters that were given to me are for image classification...
velvet thorn
okay but in any case
80% could be very high for certain problems
really depends on the classes and images
anyway
trying to do edge DL on 512 KB of RAM
for semantic segmentation
is honestly quite crazy
like
dusty anchor
i use a tool to convert the model in C that has some compression features, but even with that i really cant do much for RAM usage
velvet thorn
I don't even think
you can adequately learn the problem
with that little memory to have weights in
dusty anchor
i honestly also have some problems to train the model on my pc so yeah, i guess this is not much doable... i think i have to talk again with my teachers...
dusty anchor
velvet thorn
with that little memory to have weights in
also just to be sure, the model has been trained on PC it only has to predict on the microcontroller
grave frost
dusty anchor
also just to be sure, the model has been trained on PC it only has to predict on...
Did you do quantization and distillation?
ancient frost
serene scaffold
That's not in-place.
My b, missed that part of the question
serene scaffold
velvet thorn
why do you want to do that
I want a df to accumulate certain data and the idea that I'm copying n rows every time I add a new one is unsettling
dusty anchor
grave frost
Did you do quantization and distillation?
no, i use the compression feature of the ST32 CUBE AI, that shrinked my model from 5MB to 1MB that it is still too much for my microcontroller flash memory.... alsi i can only use conolutional layers on my model cuz of microcontroller compatibility...
ancient frost
Usually I will use other data structure when I'm doing that and then just make it into a DF right before I actually need to do pandas stuff with it
serene scaffold
ancient frost
Usually I will use other data structure when I'm doing that and then just make i...
That's what I'm thinking
 rotund dock
Hi guys! I have a quick question...
I need to roll the path_1 column all the way down, in this example is only 1 row down but it could be a different number. I just need to roll all the columns down to match the longest one
Im using pandas
grave frost
Anyone know what to do in NLP when the sequences are too big?
ancient frost
rotund dock
Hi guys! I have a quick question...
I need to roll the path_1 column all the way...
Assuming they all are meant to line-up at the bottom, and there aren't NaNs or anything at the end to clog up this method- you could reverse each of the series before inserting them, then you'd have it all aligned on the opposite end. Might be a better way of doing this but this is the easiest I could think up
rotund dock
ancient frost
Assuming they all are meant to line-up at the bottom, and there aren't NaNs or a...
Thats exactly what I need... Let me give that a try
thanks
ancient frost
np 🙂
grave frost
rotund dock
Hi guys! I have a quick question...
I need to roll the path_1 column all the way...
Use excel? 🤣
 tidal bronze
df = df.groupby([df["ShipToID"],
    df["sh_ShipmentDate"].dt.strftime("%m"),
    df["sh_18_He_NetWeight"]],
    as_index=False).sum()
why is it that when I use this I lose the date column but not the other, how can I keep it?
lapis sequoia
Hello folks, I have the following dataframe. I would like to get the output file like:
["PAK","Khyber Pakhtunkhwa",1]
["POL","Kozliki",1]
["RUS","Lomakino",1]
etc. No matter what do I can't make it done ? Any tips ?
I have solved it via:
numpy_array = newdf.to_numpy() np.savetxt("test_file.txt", numpy_array, fmt = "['%s','%s',%s],",encoding="utf-8")
lapis sequoia
Dear all,
I have just finished my job as a business analyst, and I'm considering moving onto data analyst. Recently, I've done a project on stock prediction and classification of the size of a company based on fundamentals. This is a very common project and I want more impactful projects. I wanted to say that I'm willing to volunteer and help anybody with any odd projects for free (Preferably corporate or research ones)
To avoid data breach on any corporate tasks you may encode column names or data variables in the data you send.
Thanks
hollow sentinel
hey
has anyone heard of the 100 page machine learning book
i googled beginner machine learning books and it popped up
grave frost
buy it then
misty flint

 hasty mountain
Hey guys, I recently learned about hyperparameter tuning for machine learning. I've seen that there's many models for that, but I'd like to know...how do I choose the best tuning model to each situation?
grave frost
There aren't models for Htuning; you use Hyperparameter tuning in models
When fitting a Keras model, decay every 100000 steps with a base of 0.96:
Can anyone help me understand that 🧐?
twin moth
If I have a (350,700) numpy array, is it possible to insert the position of each element into a pandas dataframe without iterating through it?
hasty mountain
grave frost
There aren't models for Htuning; you use Hyperparameter tuning in models
So GridSearch, Random Search, Genetic Algorithms aren't models? How do you call them? Methods?
And how do I choose the best one?
grave frost
hasty mountain
So GridSearch, Random Search, Genetic Algorithms aren't models? How do you call ...
You can research about them, because each of them has different tradeoffs - but you should def not use GridSearch, random is better. but GA's are very computationally expensive
twin moth
twin moth
If I have a `(350,700)` numpy array, is it possible to insert the position of ea...
Basically it should contain 245000 rows - 350 * 700
hasty mountain
grave frost
You can research about them, because each of them has different tradeoffs - but ...
I see. Thanks!
grave frost
I honestly don't think that matters much in ML, onky the model seed. that said, python's random does have a way to set seed, but you would have to construct the shuffle function on your own.
you can't pause/resume model training like that. best you can do is to make checkpoints to save the progress of your model which would be saved after some user-defined number of steps have been computed. By default it saves after every epoch
cool
ripe forge
grave frost
> When fitting a Keras model, decay every 100000 steps with a base of 0.96:
this might be in the context of learning rate im guessing? if so, they're basically "reducing" the learning rate every 100000 steps
 lucid shadow
hi
velvet thorn
serene scaffold
I want a df to accumulate certain data and the idea that I'm copying n rows ever...
the common pattern is to accumulate in a list and concat at the end
 brisk sage
Someone available that could help me with an openpyxl issue?
serene scaffold
brisk sage
Someone available that could help me with an openpyxl issue?
Please be more specific about what you'd like help with. Someone might know, but they need to know your question to know for sure.
brisk sage
I'm trying to iterate over two excel tables at the same time using openpyxl (in this case both tables are on the same sheet) and paste a value of table A to the corresponding row of table B. I've tried this
current_row = 2
for row in ws.iter_rows(min_row=2, max_row=379):
    date_dissection = str(ws.cell(row=current_row, column=3).value)[:10]
    nerve_dissection = ws.cell(row=current_row, column=6).value
    id = ws.cell(row=current_row, column=1).value
    current_line = 2

    for line in ws.iter_rows(min_row=385, max_row=617):
        date_dmg = str(ws.cell(row=current_line, column=3).value)[:10]
        number_dmg = ws.cell(row=current_line, column=7).value

        if date_dmg == date_dissection and number_dmg == nerve_dissection:
            ws.cell(row=current_line, column=1).value = id
        current_line +=1

    current_row +=1
But its not doing anything or hangs. Also tried having the tables split to different worksheets, but with the same outcome.
 grave frost
hollow sentinel
https://tenor.com/view/shaq-shaquille-o-neal-wiggle-evil-smile-gif-15358842
grave frost
hollow sentinel
https://tenor.com/view/shaq-shaquille-o-neal-wiggle-evil-smile-gif-15358842
😆
 crisp spruce
Anyone professionally into data science/analysis/ML need some guidence
ancient frost
What about?
crisp spruce
Professional experince in feild also some guidence on some study stuff
grave frost
What exactly is your question??
ancient frost
General advice I'd have would be to try and get a paid internship, take some online courses. Lots of places have more of a need for data-engineering types as there's far fewer people who are excited about that stuff- so showing some skills there is a big plus for getting in the door as well.
grave frost
Just asking - would anyone happen to know some sort of nift NLP trick that helps you boost your score? Maybe some sort of cutting-edge data processing?
ancient frost
grave frost
Just asking - would anyone happen to know some sort of nift NLP trick that helps...
Will depend a lot on what your specific model/application
grave frost
ancient frost
Will depend a lot on what your specific model/application
classification of douments 🙂
crisp spruce
Done with a programming language and math(stats/probs/algeb) the more specific quesion is now what?
ancient frost
grave frost
classification of douments 🙂
If you're doing anything with BERT/transformers then choosing a good tokenizer/pretraining tasks can help.
grave frost
ancient frost
If you're doing anything with BERT/transformers then choosing a good tokenizer/p...
Hmm.. thing is, I have already got it at 98.7% but want something to break the 99 barrier
ancient frost
crisp spruce
Done with a programming language and math(stats/probs/algeb) the more specific q...
Build up a portfolio and start applying to things probably then?
grave frost
crisp spruce
Done with a programming language and math(stats/probs/algeb) the more specific q...
Just do some project you wanted to make, and keep doing projects (competition also to get your hands dirty)
ancient frost
grave frost
Hmm.. thing is, I have already got it at 98.7% but want something to break the 9...
Sounds like it's already pretty good modeling then- one thing that might help eak a little more performance is to manually inspect training data that is predicted incorrectly by the model for mislabelings if you've got a smaller dataset.
There's also the standard hyperparameter tuning/get more data.
grave frost
ancient frost
Sounds like it's already pretty good modeling then- one thing that might help ea...
Oh yeah!! When I checked in the start, it did seem a bit noisy.
Lemme see what I can do
ancient frost
Glhf! 🙂
misty flint
hasty mountain
So GridSearch, Random Search, Genetic Algorithms aren't models? How do you call ...
Yeah i would call them so since they're more AI than ML
or just general search algorithms
informed vs. uninformed search
those are the umbrella titles you see associated with them
 merry portal
In pandas, how do I do custom dot operation? In my case I have vector of words, and want to create matrix with every possible two word combination. I currently have a for loop with applymap to achieve the result I'm going for, but I think this is not the pandas style
misty flint

merry portal
As an example, from [a,b,c] I want result:
aa ab ac
ba bb bc
ca cb cc
https://docs.python.org/3/library/itertools.html prolly want the combinations function. Not sure if there's anything for this built into pandas but this is what I usually go for
velvet thorn
merry portal
As an example, from `[a,b,c]` I want result:
```
aa ab ac
ba bb bc
ca cb cc
```
hm.
that is not really a pandas operation
you could do it with numpy
but what is your end goal?
!e
import numpy as np

a = np.array(['a', 'b', 'c'], dtype=object)

print(np.add.outer(a, a))
@velvet thorn :white_check_mark: Your eval job has completed with return code 0.
001 | [['aa' 'ab' 'ac']
002 |  ['ba' 'bb' 'bc']
003 |  ['ca' 'cb' 'cc']]
that said...it's not going to be any faster than working in native Python, and probably a bit slower
(is my guess)
numpy isn't really meant for working on arbitrary length strings
 toxic thorn
does anyone have any good python hadoop advice / resources
astral path
ok so
if I have a dataframe of strings like such
and wanted to cluster the rows of each individual column (eg. 'skydiving' could be 1 for yes, 0 for maybe, -1 for no), how could I do that?
I wrote some code to use levenshtein distance but it doesnt work at all
def cluster_str(col):
    words = np.asarray(col)
    def lev_metric(x, y):
      i, j = int(x[0]), int(y[0])
      return levenshtein(words[i], words[j])
    print(type(words))
    X = np.arange(len(words)).reshape(-1, 1)
    return dbscan(X, metric=lev_metric, eps=5, min_samples=2)
 potent sinew
Hi there , pretty new here
i have a question - can i ask it here or do i need to go to a help channel
grave frost
Yeah, you can ask it here
lapis sequoia
is anyone of you familiar with saving pandas dataframes as some form of string?
like encoding an entire DF as B64 or something so that i can save it as a string and then decode it again if i need it?
ripe forge
how about a simple csv?
lapis sequoia
well the problem is, that i cannot save the dataframe in static files, because they will get deleted after 15 min
it is a complicated setting in which these DFs are used and the only way i see possible is to save the DFs in some encoded form as a string
the next issue then would be, that these encoded strings would have a 50 000 character limit....
 fallow hornet
How keeping it in string would help you? Where would you keep this string?
lapis sequoia
i will save it in a google sheet cell
unfortunately it is too many DFs to create a new sheet / workbook per DF.
I figured it out! Thanks though
i simply take the DF, turn it into a csv, i then take the csv and encrypt it with Fernet from the cryptography library
since each df has about 120 rows, the resulting string is only about 25000 characters, so way below 50000 characters and so the problem is solved
thanks again!
misty flint

 pulsar meadow
I'm fighting with sklearn's logistic regression, and feel like there's just something I don't understand. Anyone here any good with those?
misty flint
you can just ask and if someone knows, theyll answer
 jolly quiver
Can you learn stats and maths together while going thru ML?
pulsar meadow
I admit my stats are a little weak
Anyway, I'm doing a pretty classic logicist regression problem trying to determine if an object is in one of two classes (1 or 0). The sets aren't fully balanced (there's about 10x as many 0's in the training set as 1's), but the training set is large (around 600k objects)
The regression seems to work ok, and when you test it, the score seems alright (0.933)
but, when you go to actually look at the coefficients and how they stack up against the logistic function, things go a little pear shaped
jolly quiver
Soon I'll be learning ML so for now I don't know much about it. Completely blind to life atm.
pulsar meadow
If I understand the logistic regression right, when you dot the coefficients to the training vector and add the intercept, it should follow the logistic function of the odds, but it doesn't
 next beacon
Hi people. Who can ask me please, during works with pandas usually not use python classes and methods? I didn't found information about it. But now I'm learning pandas and learning OOP again.
pulsar meadow
I can manually correct the intercept and the coefficients, and if I do the score is a little higher, but I don't understand why it doesn't converge correctly in the first place
lapis sequoia
Hey folks, could someone help me out why this is happening?
house = pd.DataFrame(
    {'rooms': ['bedroom', 'livingroom', 'kitchen', 'bathroom']},
    {'bedroom': ['bed', 'chair', 'nightstand', 'clauset', 'clothes', 'shoes']},
    {'living room:': ['couch', 'TV', 'table', 'chairs']}
)
print(house)```i'm trying to build a DataFrame with missing information
 elfin sand
guys
what are numpy,opencv,matplotlib,NLTK,pandas..... i have them in notes but how r they used in python
 fierce shadow
They are libraries
abstract zealot
AR whats the problem
lapis sequoia
abstract zealot
AR whats the problem
!e
house = pd.DataFrame(
    {'rooms': ['bedroom', 'livingroom', 'kitchen', 'bathroom']},
    {'bedroom': ['bed', 'chair', 'nightstand', 'clauset', 'clothes', 'shoes']},
    {'living room:': ['couch', 'TV', 'table', 'chairs']}
)
print(house)```You are not allowed to use that command here. Please use the #bot-commands channel instead.
fierce shadow
numpy is used for handling advanced math stuff, (tensors etc..) opencv is an Image processing library, used for computer vision, NLTK is natural language processing toolkit, helping you out in natural language processing. Matplotlib is used for visualization of graphs and data. Pandas is used for handling dataframes
elfin sand
oh
fierce shadow
Basically, Data science stuff
abstract zealot
@lapis sequoia its probably because your list of values is of different lengths
lapis sequoia
yeah, but how can i make a filler for the missing values?
elfin sand
so these are python packages
fierce shadow
yip
fierce shadow
have you used import statements in your code?
fierce shadow
packages basically are set of predefined functions which you can use
or even classes
so you don't have to do everything from scratch
elfin sand
ight so ill have to download these right?
fierce shadow
for example, you can have
def add(a, b):
    return a + b
this way, you would be able to call add again on two numbers without having to perform those operations again
and if you store these in a python file, you call them python packages
elfin sand
ohhhhhhhhhhhhhhhhhhh i get it nowwwwwww
fierce shadow
elfin sand
ight so ill have to download these right?
yes you can install them using python package manager, pip
elfin sand
THANKS!
abstract zealot
@lapis sequoia maybe try something like: ```py
d = {'rooms': ['bedroom', 'livingroom', 'kitchen', 'bathroom'], 'bedroom': ['bed', 'chair', 'nightstand', 'clauset', 'clothes', 'shoes'],'living room:': ['couch', 'TV', 'table', 'chairs']}
house = pd.DataFrame(dict([ (k,pd.Series(v)) for k,v in d.items() ]))
not sure if there is a more intuitive way
twin moth
Do you guys know if it's possible to replace the NaN values on pandas.merge(how="outer")?
without using another parameter of course
lapis sequoia
abstract zealot
<@456226577798135808> maybe try something like: ```py
d = {'rooms': ['bedroom', ...
so there is no way to just keep certain things empty?
like when i import csv i see so many empty "cells"
abstract zealot
@lapis sequoia i though pandas always interpreted an empty cell as Nan, but i could be entirely wrong
lapis sequoia
yup, it is the case, i'm just very confused how does it handle those empty cells when importing from csv
:/
 vapid chasm
Hi guys, I don't mean to interrupt but have you used Bokeh?
ancient frost
lapis sequoia
yup, it is the case, i'm just very confused how does it handle those empty cells...
I believe there is an optional param you can pass to read_csv that specifies what string/strings to read as NaN
lapis sequoia
do you think it just passes empty cells as an empty string?
ancient frost
Check out https://pandas.pydata.org/pandas-docs/stable/reference/api/pandas.read_csv.html
Under na_values and keep_default_na
lapis sequoia
man.. does data science gets easier or harder from here on? XD
ancient frost
I believe by default it will read in all the empty cells as Na's
lapis sequoia
it should, i think it is just some weird thing of csv file
pandas reads empty string as NaN or leaves it as an empty string?
twin moth
twin moth
Do you guys know if it's possible to replace the NaN values on `pandas.merge(how...
Anyone?
 tall anvil
hi everyone
i'm trying to make an app to aproximate the weight of an animal via images, how would you go about it?
tall anvil
as of now im
building my dataset
with photos,race,weight,age
height
i wonder if im missing something that would help in my initial itereation
twin moth
If I have a dictionary which looks like that:
(year, month): np.array([value * 245000])
How would you guys fit it to a Pandas dataframe so it'll contain the following columns?:
X, Y, Year, Month, value
I'd rather not iterate through it if possible
grave frost
@tall anvil it's just a image classification problem if you have the weight in ranges (10-20kg, 20-30....) if not, then image regression is much more complex for getting precise weight
ancient frost
twin moth
If I have a dictionary which looks like that:
```
(year, month): np.array([valu...
I would double check that the order is correct but you can directly assign
df['year_month'] = list(my_dict.keys())
and
df['value'] - list(my_dict.values())
Then you can infer the Year/Month using apply on the year_month column
so like df['year'] = df['year_month'].apply(lambda x : x[0])
ancient frost
lapis sequoia
pandas reads empty string as NaN or leaves it as an empty string?
by default I believe it is NaN
twin moth
ancient frost
I would double check that the order is correct but you can directly assign
df['...
Wait, why create a year_month column?
And thanks for the hasty reply
 dark willow
Hey all - I've got some free time and want to start familiarizing myself with NumPy or Pandas libraries.
My comfortable Python level is probably low intermediate.
Besides the pandas or NumPy library documentation/tutorials, any recommended other good tutorials/walkthroughs to get my feet wet?
twin moth
ancient frost
I would double check that the order is correct but you can directly assign
df['...
Can't I just do the following?
df['Year'] = list(my_dict.keys()[0])
df['Month'] = list(my_dict.keys()[1])
The thing is - that won't work since there are only ~450 months and 245000 values for each
ancient frost
Wait, do you have 245000 of the same value as each array?
What are you trying to extract as the value?
twin moth
for idx, date in enumerate(my_dict):
  df["Year"] = date[0]
  df["Month"] = date[1]
  df["Value"] = my_dict[date]
  df["Y"], df["X"] = divmod(idx, 350)
Nah, basically they are all pixels
Or were pixels
Now those are just ints, 245000 ints 😛
ancient frost
If you're trying to put a bunch of images into a dataframe- I would consider just saving them all to disk and putting the file names into the dataframe- you will run out of memory really quick putting them all in there.
twin moth
ancient frost
If you're trying to put a bunch of images into a dataframe- I would consider jus...
Again, not images
Were images, made a ton of calculations and now I need to insert the data I got in to the DF
ancient frost
twin moth
```py
for idx, date in enumerate(my_dict):
df["Year"] = date[0]
df["Month"] ...
I'm very confused why you are storing years and months as size 245000 numpy arrays with just one value ?
ancient frost
What is date[0]?
twin moth
(year, month): np.array([value1,...,value245000])
It's a tuple so it should be the year
ancient frost
Got it, this is the bit that seems strange
df["Year"] = np.full(shape=245000, fill_value=date[0])
You are overwriting the full column each time with 245k of that one date
twin moth
I was just told that I could use df["Year"] = date[0]
ancient frost
Do you buid a new DF for each entry and then go to concat them?
That is true- but do you want a full column of just one date?
ancient frost
And then you have 245k values associated with that date, and just want them each as their own row?
twin moth
Because each of those tuples is basically the 245000 values of a single year,month combination
twin moth
ancient frost
And then you have 245k values associated with that date, and just want them each...
Indeed
ancient frost
I mean that should work then- you can just append each df to a list and call pd.concat on it
twin moth
That's exactly what I'm gonna do
And then just merge it with another one huge DF
Do you think that there's a way to do it in the vectorized fashion instead of iterating over that dict?
ancient frost
Since you're just doing assignment within the loop, and I would guess you don't have that many year/months- I wouldn't be too worried about just sticking with this
There isn't a clear way to vectorize it further and I'd guess you'd see a fairly minimal improvement
Actually there probably is a way with just stacking the arrays
 coral cloak
I'm trying to get the index values of a dataframe whose last column value is less than a certain float:
x = corr[corr.iloc[:,-1:] < 0.1].index
however this returns the entire index list of the dataframe. what's wrong?
twin moth
ancient frost
Since you're just doing assignment within the loop, and I would guess you don't ...
450~ in each category, we have about 2-3 categories
ancient frost
How long does it take to run?
twin moth
About 2~ seconds for each map
ancient frost
oh that's rough
twin moth
I'm checking it as we speak actually
twin moth
ancient frost
oh that's rough
We're down from 180s lol
ancient frost
You can definitely forgo the assignment of the value column and just np.concatenate those and assign as one big column
Others will be more tricky
So like np.concatenate(dict.values())
Might need to cast it to a list or something in there
Honestly- it might be taking a long time just for all the memory operations though
twin moth
True
--- 1.9954485893249512 seconds to process map https://eoimages.gsfc.nasa.gov/images/globalmaps/data/MOD_NDVI_M/MOD_NDVI_M_2000-03.JPEG ---
--- 1.9069433212280273 seconds to process map https://eoimages.gsfc.nasa.gov/images/globalmaps/data/MOD_NDVI_M/MOD_NDVI_M_2000-04.JPEG ---
--- 1.903285026550293 seconds to process map https://eoimages.gsfc.nasa.gov/images/globalmaps/data/MOD_NDVI_M/MOD_NDVI_M_2000-05.JPEG ---
--- 2.145488977432251 seconds to process map https://eoimages.gsfc.nasa.gov/images/globalmaps/data/MOD_NDVI_M/MOD_NDVI_M_2000-06.JPEG ---
Including the insertion to the df
tall anvil
grave frost
<@!421882455369187360> it's just a image classification problem if you have the ...
Great, so do you think it will be possible to train an AI to determine weight using classification, as i said im building the dataset with photos and [weight,height,race,age]?
twin moth
@ancient frost Any idea why I get Process finished with exit code 137 (interrupted by signal 9: SIGKILL) after about 800 maps?
ancient frost
Something did lol
twin moth
Unless my OS decided to kill it, twice
ancient frost
Could be something watching memory usage and killed it to avoid OOM and crashing?
twin moth
Might be the case
I'll try to check for memory consumption
If it gets too high and I'd have nothing to close I'd try to work with files
arctic wedgeBOT
Hey @ancient frost!
It looks like you tried to attach file type(s) that we do not allow (.ipynb). We currently allow the following file types: .3gp, .3g2, .avi, .bmp, .gif, .h264, .jpg, .jpeg, .mov, .mp4, .mpeg, .mpg, .png, .tiff, .wmv, .psd, .ai, .aep, .xcf, .mp3, .wav, .ogg, .webm, .webp, .flac, .afdesign, .m4a, .csv.
Feel free to ask in #community-meta if you think this is a mistake.
ancient frost
Ah I cannot upload a .ipynb but I will screenshot
There is one way to have it all vectorized
I compared that to the loop and it was about the same- for that set of year/month values it was like 2 seconds slower than the loop you posted. (5 seconds total vs. 7 seconds)
twin moth
🫀
twin moth
ancient frost
There is one way to have it all vectorized
BTW, mine is 2.5~ secs for a single month including all of the operations and including a single HTTP request
astral path
misty flint
dont you have to recode the data. thats what comes to mind
yeah i should do that for the survey questions that have discrete choices to select from
however, the survey also has questions which are open-ended and I want to cluster them together
unless there's a better way
misty flint
if theres truly open-ended ones and not just ones you can place on a likert scale, i would just pull them out and place them in a different dataset/dataframe
then you could do clustering on them
actually then youd lose the relationship with the other variables...hmm idk wonder what others think
astral path
hmm
merry portal
velvet thorn
!e
```py
import numpy as np
a = np.array(['a', 'b', 'c'], dtype=object)
print(...
This is what I was looking for, thanks. Good to know it isn't faster than native python, I'll just stick with my solution then.
velvet thorn
merry portal
This is what I was looking for, thanks. Good to know it isn't faster than native...
I'm p sure there'll be a faster way
but without knowing what your exact problem is it's hard to tell
merry portal
Was given a dictionary of words, and some hashes, and was tasked with finding out the passwords and salts corresponding to each hash. Basically check md5(word1+word2) == hash. Can do iteratively, but I've read this is not the numpy/pandas way. So was thinking to generate matrix, apply md5 on each entry, filter by matching hash and extract password+salt. Task itself is simple, was just wanting to practice with pandas
@velvet thorn ^
velvet thorn
merry portal
Was given a dictionary of words, and some hashes, and was tasked with finding ou...
wrong library for the problem
not what pandas is meant for
(generally, numeric calculations)
merry portal
Also this would be memory intensive for real world dictionary, but the one we were given was small, and the resulting matrix would fit in my system memory
There were other tasks we had to complete that pandas made trivial, but yea like I said, I wanted to use pandas just for some introduction to it
velvet thorn
I see
hm
personally I would not recommend it
you can use numpy for better abstraction
but this is quite outside the ambit of pandas IMO
velvet thorn
merry portal
Hmm ok, I'll try out numpy too sometime.
pandas is backed by numpy
misty flint
the 'records' orientation was def something to work with https://pandas.pydata.org/pandas-docs/stable/reference/api/pandas.DataFrame.to_dict.html
took a bit to figure out how to pull the values i needed and add them to another dictionary
df.to_dict('records')
[{'col1': 1, 'col2': 0.5}, {'col1': 2, 'col2': 0.75}]
my original plan was just to index the values i needed and add that to a dictionary
and ignore the headers
i still think that mightve been easier
misty flint
oh wait nvm
ive run into a problem

so i have a records array
[{'French': 'partie', 'English': 'part'}, {'French': 'histoire', 'English': 'history'}, {'French': 'chercher', 'English': 'search'}]
i made a dictionary of only the french words, and then created another to function to pull out a random french word
but now i need to write a function that displays the english counterparts...
so i guess i need to undo the dictionary of french words?
would it have been easier to just create a dataframe thats just a dictionary of " french_word : english_word" ?
and take out the index?
i guess ill just subindex
 heady pollen
 wicked mantle
why machine learning is data-science or calling ML dev - data scientist? data science looks like graphs, statistics, but not at all machine learning
ripe forge
because the purpose of machine learning is aligned with the purpose of data science: that is, to get data driven insights
whether you use an ML model to extract those insights from your data, or rely purely on insights generated by data exploration and visualization, shouldn't matter from the end goal of a data scientist
 last sierra
hey my val loss is smaller than train loss
87/87 [==============================] - 2s 22ms/step - loss: 0.1349 - accuracy: 0.9628 - val_loss: 0.0609 - val_accuracy: 0.9837
is that ok
last sierra
Ok
harsh reef
Hey how i convert int base 10 format to int array format any help?
lapis sequoia

 lilac geyser
The mean cost of a hotel room in a city is said to be $168 per night. A random sample of 25 hotels resulted in X-bar = $172.50 and sample standard deviation s = 15.40. Calculate the t statistic.
I got to know about how we can calculate t statistic
But from t statistic how can we calculate approx p value without the table help and online calculator?
@tidal bough
 twilit wind
Do anyone have experience on demand forecast using machine learning techniques
if yes can you just ping me
 slate wing
Hi everyone
I am not familiar with Python or Data Mining, however, I am interested into getting into Data Mining using Python
Little background: I know other programming languages, mainly Java and C and I am good with them on a college undergraduate level, I also have a decent Math background (Calculus, Linear Algebra, Probability & Statistics)
Is there any sources some of you would recommend? much appreciated.
grave frost
You mean scraping websites using python?
grave frost
last sierra
hey my val loss is smaller than train loss
```87/87 [===========================...
your val_accuracy is also greater
grave frost
wicked mantle
why machine learning is data-science or calling ML dev - data scientist? data sc...
Data science is actually a broad umbrella term used where a person can do muktiple things, from training models to tuning pipelines and handling/cleaning/preprocessing data. It's kinda like an all-round term. Machine Learning researcher, on the other hand may be able to do all that but he/she would be more focused on the models themselves
wicked mantle
thanks!
 clever remnant
Hey, I can't for the life of me, figure this probably easy thing out.
I have a CQL result, from a scylladb select statement. I want to load that into pandas.
The returned result, from a query, is essentially, if I unload the query using query.all() I get a list of named tuples.
Any ideas how to load, a cassandra db, result, into pandas?
 bronze skiff
pd.from_records
clever remnant
AttributeError: module 'pandas' has no attribute 'from_records'
Maybe I have an old version
'0.25.1'
clever remnant
works like a charm
thanks
one thing though, it seems, it doesn't get the column names.
They are just numbers 0 - 20
 tall basin
https://twitter.com/Br3Sc/status/1361004561855614977?s=20 - Python exercises list

Are you looking for sites to train💪🏼your Python🐍? Here is a list with exercises to ensure you'll master Python.
- 3 Bonus places
#100DaysOfCode #programming #ML #AI #Python #python #code #learning #Tips #CodeNewbies #Computer #WomenWhoCode #DataScience
 Twitter
·
Twitter
·
 nova smelt
Hey, can you recommend any nice datasets to train a neural network? i've done the MNIST and MNIST Fashion dataset
clever remnant
clever remnant
They are just numbers 0 - 20
Figured it out, solution was: x = pd.DataFrame.from_records(query.all(), columns=query.column_names)
hollow sentinel
so for data science you need a good understanding of statistics and linear algebra
can anyone recommend any good books?
I just found practical statistics for data science
 terse light
Do you wish to do stats and linear algebra in python to learn or just want to start with theory?

Quantitative Economics with Python
This website presents a set of lectures on quantitative methods for economics using Python, designed and written by Thomas J. Sargent and John Stachurski.
I would recommend QuantEcon if you wish to learn data science
this is also cool: https://datascience.quantecon.org/
 hollow sentinel
Great thank you
I just don’t think I have a strong basis and that’s why I’m struggling
terse light
just go through the material above, maybe it can help
hollow sentinel
Thank you 😃😃😃
hollow sentinel
what if i made a model that recommended new netflix shows to watch
.....
pls what
grave frost
Anyone know how to quickly remove that first row in pandas dataframe (the one that numbers the rows) and is unnamed?
I am exporting it as a csv and it is causing a problem.
Like this:-
  Column_1    Column_2
**0**  <...>       <...>
**1**
**2**
**3**
the ones in stars
 pale merlin
i think this is the index for how many element you got - am really a noob so i don't know
pine panther
grave frost
I am exporting it as a `csv` and it is causing a problem.
df.to_csv("blahblah", index=False)
grave frost
@pine panther THANX A TON!!
 eternal fog
Hi guys, I have question for regular expression
Can you guys help me with this?
re.compile(r"(?:\((\d{4})\))?\s*$")
what's the question
 nocturne plover
does anyone here know how to create a Random Forest from two or more models (XGBoost, decision tree)?
eternal fog
I just understood it
eternal fog
eternal fog
Hi guys, I have question for regular expression
Can you guys help me with this?
...
this was my question
Thanks though
🙂
 mint palm
have some doubt related to regularization by using inverted dropout..........can someone help plzzzz?
so above 3 steps(blue ink are steps) are done to implement dropout in a layer
a3 b3 are activation and bias of layer 3 respectively
so my doubt is why do you have to scale the vector a3? ...........
teacher says "its so that value of z3 which would have been decreased due to some elements of a3 becoming 0 after dropout techniques"
but .............why do we need to tweak it?
isnt it that, like in NN we are calculating a formula "wx + b" which would give us probability of trueness in test set but ............isnt it that tweaking(scaling a3) will change a3 in very unpredictable way and the final formula would be affected
and if we are compensating for reduced value a3 then why did we implement dropout in first place
hasty grail
As no dropout is applied during the test phase, rescaling the activation ensures that the magnitude of the activation during training is the same as that during testing.
Otherwise, the mean of the activation will become inconsistent.
mint palm
hasty grail
Otherwise, the mean of the activation will become inconsistent.
this makes sense to me but
mint palm
hasty grail
As no dropout is applied during the test phase, rescaling the activation ensures...
i dont get this
hasty grail
Which part of it do you not understand, specifically?
mint palm
dropout is implemented if we are overfitting(which we may have realised after testing on test set or dev set)
so what is that line ur saying that to" ensure magnitude of the activation during training is the same as that during testing"
hasty grail
mint palm
dropout is implemented if we are overfitting(which we may have realised after te...
The model is retrained (with dropout) if overfitting is discovered
mint palm
isnt dropout techniques retraining?
we are doing it again when we use dropout............right?
hasty grail
As the model is retrained, it learns to predict based on the activations w/ dropout. If the magnitude is not rescaled during training, the activations during testing will not fit the distribution during training (as mentioned above)
velvet thorn
mint palm
isnt dropout techniques retraining?
dropout is something you can include, or not include, in a model.
so, yes, if you have one with and one without, they would need to be trained separately.
mint palm
so i am gonna say a few lines and plz tell me if i am getting the concept correctly
so dropout is a regularization technique to drop few of the neuron based on probability
so if simple nn is overfitting we implement dropout
and in that we reduce some activations to 0 based on probabilty and comput z value according to new activation we got after dropout
is it right?
hasty grail
yeah
mint palm
hasty grail
As no dropout is applied during the test phase, rescaling the activation ensures...
so i did not get this...........why we need to ensure?
we get an overfitted data so we would do it again by using dropout
why rescale it
mint palm
yup yup
 charred flare
hi, I am trying to print a basic csv file with pandas but I do not know how to see the full table.
I got this:
0 1 Bulbasaur Grass ... 45 1 False
How do I expand the ... part ?
velvet thorn
mint palm
yup yup
hm
okay
you can think of it this way
dropout reduces the number of neurons that "work" during training time, but not during test time, right?
mint palm
yes
velvet thorn
remember that the output of each layer is passed to the next layer as its input
mint palm
velvet thorn
remember that the output of each layer is passed to the next layer as its input
yes
velvet thorn
mint palm
why not test time
remember that more neurons -> higher learning capacity, but also higher tendency to overfit
mint palm
yes
velvet thorn
so what you want with dropout is, basically
mint palm
hmm
velvet thorn
to retain the benefit of more neurons (higher learning capacity) while simultaneously decreasing the chance of overfitting
tidal bough
charred flare
hi, I am trying to print a basic csv file with pandas but I do not know how to s...
https://stackoverflow.com/questions/25351968/how-to-display-full-non-truncated-dataframe-information-in-html-when-convertin
You want the display options, display.max_columns in this case.
velvet thorn
and that's done with dropout - by randomly turning off some neurons during the training phase, so they don't overfit
if you used dropout in the test phase as well
then you might as well just have used a smaller network
right?
mint palm
i didnt use it yet...........just wondering why cant we use it in test set
it is because its already small
velvet thorn
mint palm
i didnt use it yet...........just wondering why cant we use it in test set
you can, but you don't want to
imagine your network has 100 neurons
mint palm
hm
velvet thorn
and it's underfitting, so you want to increase the complexity
so you add more neurons/layers, and now it has 200 neurons
which causes it to overfit
then you add dropout so that, during training, not all of those 200 neurons are learning at the same time (basically)
which means that the network is less likely to overfit
but at test time
mint palm
ok so we cant judge overfit or underfit on test set?
velvet thorn
you want to use the full power of your network
velvet thorn
mint palm
ok so we cant judge overfit or underfit on test set?
why do you say that
well, strictly speaking, you'd have a validation set