#data-science-and-ml
1 messages · Page 280 of 1
 mint palm
 woeful hamlet
whats the difference between image_dataset_from_directory and flow_from_directory?
 silent current
Anybody know how to do a pandas scatter matrix plot, but instead of scatter plots on the off-diagonal plots, it's heatmaps?
this, but with heatmaps: https://pandas.pydata.org/pandas-docs/stable/_images/scatter_matrix_kde.png

 coarse mica
Hello guys
I'm physics student of Brazil
I need projects of python for benninger
I'm begin programming yesterday
But
I don't know how developer projects for physics and math :(
 astral fox
How to make a pie chart from data in the output of a cell? Pls help
 velvet thorn
silent current
Anybody know how to do a pandas scatter matrix plot, but instead of scatter plot...
velvet thorn
silent current
Anybody know how to do a pandas scatter matrix plot, but instead of scatter plot...
what do you expect a 2-feature heatmap to look like?
1 million rows isn't that big...what are you doing?
woeful hamlet
whats the difference between image_dataset_from_directory and flow_from_directory?
 lapis sequoia
The stages of deep learning
 twin moth
Hey guys, anyone here has experience with OpenCV for image processing?
I found out that when I try to process an image some of the so-called white background is not (255,255,255) and was wondering how to professionally find colors which were changed like that because of compression (?) I guess
To the untrained eye those pixels seemed to be white were really close - (254,255,254) for example
I don't want to try and search for all colors in the following range though (250,250,250)..(255,255,255)
 cobalt jetty
https://answers.opencv.org/question/87278/estimate-white-background/ this might have your answer:
Simplest solution, convert to grayscale and do a OTSU thresholding, which will be between the letters and the background. Then simply replace the background with plain white color!
Hi, I have image with white uneven background (due to lighting). I'm trying to estimate background color and transform image into image with true white background. For this I estimated white color for each 15x15 pixels block based on its luminosity. So I've got the following map (on the right): Now I want to interpolate color so it will be more ...
twin moth
P.S. they mostly appear next to the border with other colors
twin moth
cobalt jetty
https://answers.opencv.org/question/87278/estimate-white-background/ this might ...
Thanks! I'll give it a read
But greyscaling it might be an issue since I'm trying to analyze a heatmap
cobalt jetty
but I believe your intuition is good.
twin moth
And I need the colors
cobalt jetty
I don't know much about openCV but I believe there must be something in there that would work for you.
just gotta sift the documentation.
if you grayscale to find the white background, you can extract from that the list of pixel which are considered white
then you can filter your original image with that list since pixel position would remain the same
twin moth
Let me just describe the real problem
cobalt jetty
as no sheering, flipping, etc. is involved.
woeful hamlet
okey thig
thing
doing
data = image_dataset_from_directory(data_dir, label_mode='categorical',
                                       batch_size=batch_size, image_size=dimensions[:2],
                                       seed=seed, subset='validation',
validation_split=0.2)```Where is my train data and my validation data?
twin moth
We have a heatmap, each heatmap comes with a scale
For example:
Seems like some of the colors in the map - are not to be found in the scale
cobalt jetty
ah, you're building a labeled dataset using the keras library.
twin moth
I think those issues are connected
cobalt jetty
post the error message @woeful hamlet
woeful hamlet
woeful hamlet
it sais too many values to unpackage
.
cobalt jetty
that doesn't help me. The whole error message usually has more information.
cobalt jetty
twin moth
We have a heatmap, each heatmap comes with a scale
For example:
what do you mean, not found in the scale?
twin moth
We took all the colors from the scale then traversed the heatmap and search for pixels which their color could be found in the scale
We found out that a ton of colors could not be found
cobalt jetty
can you show me an example picture?
twin moth
Even though I (a human last I checked) could distinguish their placement in the graph
cobalt jetty
are you trying to remove the wide border around the map projection, or segmenting the beige areas on the map?
twin moth
I think that a good analogy would be the following:
I have a scale of 10 integers - 1 to 10.
I have a matrix which contains numbers
If I am searching for the exact number and the number in the matrix is a float (say 3.5) I won't find it in the scale no matter how hard I try
twin moth
cobalt jetty
are you trying to remove the wide border around the map projection, or segmentin...
Well, basically both
We're trying to filter the relevant data and put it all into a dataframe
That's a better image btw
So basically remove traverse it, if it's in the scale insert it into the DF
Otherwise do nothing
cobalt jetty
I don't think your analogy works here.
You have to think about what you want to achieve with your map. For instance. Do you want to highlight the whiteish areas, or not, etc. Do you have a threshold of 'error' you'd be fine with, etc.
if you want to detect the beige area in the picture, you might want to go for a watershed algorithm: https://docs.opencv.org/3.4/d3/db4/tutorial_py_watershed.html
for example
they have a good example where they filter out a noisy white background.
from this
to that:
twin moth
Why not? I mean if what we started with (impure white pixels) other pixels might act the same
twin moth
cobalt jetty
I don't think your analogy works here.
You have to think about what you want to ...
.
And if it works the same how can I know those colors that can be found (in both the scale and) the map are the ones I think they are
cobalt jetty
You don't. Because there are 3 channels with permutations from 0,0,0 to 255,255,255 for each pixel
it's too many possibilities that looking for exact value is not efficient
if you want to segment areas, you have to implement an algorithm intended for that.
I don't think it helps your topic -- but I do think you should try not to rely on detecting shades of pixels one by one but rather work with distinguishing areas from each other via segmentation or thresholding. They have standard implementations.
Also I gotta go sleep. It's 1:30am here lmao.
twin moth
gn
twin moth
cobalt jetty
if you want to segment areas, you have to implement an algorithm intended for th...
If anyone here ever heard of one of those I'd love to know
woeful hamlet
how can i use image_dataset_from_directory with ImageDataGenerator on keras?
like, after calling image_dataset_from_directory, where are my train dataset and my validation dataset?
data = image_dataset_from_directory(data_dir, label_mode='categorical',
                                    batch_size=batch_size, image_size=dimensions[:2],
                                    seed=seed, subset='validation',
validation_split=0.2)```@velvet thorn sorry didn't see your message. I was looking for a heatmap of frequencies between two variables. Each variable was a score on a test in a different category, both scores were 1-5. Just wanted to put together a visualization showing the relationship between the two.
 austere swift
woeful hamlet
like, after calling ``image_dataset_from_directory``, where are my train dataset...
austere swift
woeful hamlet
like, after calling ``image_dataset_from_directory``, where are my train dataset...
it returns a tensorflow Dataset object
woeful hamlet
yeah i saw
i found this

Stack Overflow
I have following statement
self.__Dir_Data = tf.keras.preprocessing.image_dataset_from_directory(self.__Dir_Path ,validation_split = 0.1 ,subset="training", seed = 1, labels='inferred',
but still, i cant use image data generator with that
so i guess i have to use flow from directory
but i am stucked here
subset: Subset of data ("training" or "validation") if validation_split is set in ImageDataGenerator.
i didnt specify anything on image data gen
this is how am i doing train_gen = ImageDataGenerator.flow_from_directory( directory=data_dir, target_size=dimensions[:2], seed=seed, )
so i dont know what to do 😄
aaaaaaa ye ye i know what to do
ok ok
If on the ImageDataGenerator object i specify validation_split to 0.8
then, on flow_from_dir
saying subset training will take the 0.8 and validation will take the 0.2?
 lavish tundra
someone know how to make pandas work with pygal?
 weary crescent
`
lapis sequoia
KEK
lapis sequoia
Guys
Could someone please give me some Kaggle dataset recommendation exclusively for “data cleaning”?
 hard canopy
Hello here. I'm trying to use Tensorflow to build a markov model and generate sentences.
I'm currently computing the transition distribution with nltk, and I'm using https://www.tensorflow.org/probability/api_docs/python/tfp/distributions/HiddenMarkovModel to compute sentences
I would like to compute the transition distribution on the GPU. I will need to use this: https://www.tensorflow.org/probability/examples/Learnable_Distributions_Zoo ?
Am I headed in the right direction ?
 subtle tundra

In this article, we will be building a CNN (Convolutional Neural Networks) model and aiming to achieve 95% accuracy in Python.
hard canopy
@subtle tundra I'm not sure who you are answering to ?

 devout zodiac
is anyone aware of a discord server for the SimpleITK library? I fail to get a hang of it and could you some assitance
 left inlet
hello guys, can i ask something here?
austere swift
you don't need to ask to ask
left inlet
hehe okay ty sir, im afraid that i would breaking conduct and rules xD
so if i have 2 data frame and doing left join with pandas, it would be shown like dfmerged in the image. so my question is, there is new record data and i want to update the 'dfmerged' with the new updated data and fill the null column also update the old data without creating another column. is there a way to do that with pandas or maybe another libraries?
sorry if my english isn't good enough, and thank you in advance for everyone
woeful hamlet
Can someone tell me if this is good pls?
train_datagen = ImageDataGenerator(
    rescale=1./255,
    rotation_range=20,
    width_shift_range=0.2,
    height_shift_range=0.2,
    shear_range=0.2,
    zoom_range=0.2,
    horizontal_flip=True,
    validation_split=percentage)

valid_datagen = ImageDataGenerator(
    rescale=1./255,
validation_split=percentage)```train_generator = train_datagen.flow_from_directory(
directory=data_dir, target_size=dimensions[:2],
seed=seed, subset='training'
)
valid_generator = valid_datagen.flow_from_directory(
directory=data_dir, target_size=dimensions[:2],
seed=seed, subset='validation'
)```I dont know what is the validation_split for
lavish tundra
some1 here understand pandas librarie?
 gray storm
Hi Everyone! Is anyone got any success with euronext equities and alphavantage ? I can't find the good way to format the ticker symbol...
 white saddle
lavish tundra
some1 here understand pandas librarie?
white saddle
lavish tundra
some1 here understand pandas librarie?
Yea I use it quite a bit for work
 midnight rain
what do you guys use for package management?
I want conda for its blas installations but its kind of a pain compared to pipenv when sharing with others
lavish tundra
white saddle
Yea I use it quite a bit for work
look dm
hard canopy
@midnight rain I use poetry
 barren moat
Hello experts - How do i change just the year component from the date in R?As some years have been missed typed.
 earnest forge
quick question: should I use dummy variables for this data?
I made dummy variables out of Date and Time to let ML algorithms percept it more successfully
 vestal mirage
how do u plot a roc curve for linear regression?
 forest nymph
hi i got a question if i want to Webscriping but theres only 1 class/a/h1/tb and it has 2 commands how can i tell that i want this class not the other
 misty flint
is it true that it would be good to learn R to help with Data Science/ML?
this is in addition to python
are there certain things thats better written in R than in python?

velvet thorn
are there certain things thats better written in R than in python?
@misty flint data viz is nicer in R IMO
but I feel like Python is just a much stronger contender
vestal mirage
Guys how would u plot the goodness of a linear regression model?
Loss plot? Or wut
 tidal bough
pretty much, yes
misty flint
velvet thorn
but I feel like Python is just a much stronger contender
so like...in an ideal world (lol) you'd do your data viz in R and your ML stuff/your other algos with python?
velvet thorn
misty flint
so like...in an ideal world (lol) you'd do your data viz in R and your ML stuff/...
well
assuming there was 0 integration cost
I suppose?
like I mean
the plots LOOK nicer
not that you can do more stuff
velvet thorn
misty flint
matplotlib is kinda trash ngl
it gives you a lot of power
and you can make it look nice
but it doesn't out of the box
tidal bough
there's also seaborn for a more high-level plotting library
velvet thorn
seaborn is icky IMHO 🥴
tidal bough
of course, if you ever have to edit some detail of a seaborn plot, headfirst into matplotlib you go
misty flint
hmmm
ive only had assignments with matplotlib but ill look into seaborn
and i guess R's data viz capabilities

vestal mirage
vestal mirage
Guys how would u plot the goodness of a linear regression model?
any?
one?
 velvet thorn
vestal mirage
any?
velvet thorn
vestal mirage
any?
...why do you need to plot it
velvet thorn
define "goodness"
vestal mirage
like in classification models u have roc/aoc graphs
to measure goodness
what would be equivalent for regression model
velvet thorn
it depends.
okay so first
the ROC curve isn't just for performance
it can also be to determine an appropriate cutoff
because, assuming you have a probabilistic classifier and a decision rule
it can inform your modification of the decision rule (threshold)
on the other hand, a regression model doesn't have the same tunability in that regard
common scalar metrics are MSE and MAE
assuming you're doing linear regression
vestal mirage
ye
velvet thorn
you can, for example, check homoscedasticity
by plotting predictions against residuals
you can do a histogram of residuals to "check" normality
vestal mirage
nothing
velvet thorn
if you're going to plot that kind of thing
I would really suggest
making a SQUARE plot
your scale is obviously off
velvet thorn
vestal mirage
nothing
do you know the assumptions that linear regression makes?
vestal mirage
wut y = mx +b?
velvet thorn
no
vestal mirage
velvet thorn
making a SQUARE plot
wut square plot and wym scale is off
velvet thorn
vestal mirage
wut square plot and wym scale is off
your plot
is not square
I'm not really sure how else to say this
but it is clearly a rectangle
so like
20-30 on the X axis
is a different distance from
20-30 on the Y axis
okay
just plot a diagonal line
vestal mirage
oh
velvet thorn
y = x
velvet thorn
vestal mirage
wut y = mx +b?
hm
I would suggest
you study the theory behind linear regression
but ANYWAY
to answer your original question
for a quick answer just use MSE/MAE
velvet thorn
why do you think
you need to plot...
e.g. for classification you can come up with useful conclusions
just based on the confusion matrix
vestal mirage
ye but with confusion matrix there is also roc u can plot
tidal bough
(considering gm's mention of homoscedasticity (I had to google what that means), I presume what they're getting on is that in a linear relationship the distribution of error compared to said relationship should be about the same for all points, so by checking the residual plot and seeing that the residuals differ notably, you can come to the conclusion the model itself isn't a good fit to the data)
velvet thorn
not really sure why you're so caught up in plotting
vestal mirage
cuz plots r kool
velvet thorn
vestal mirage
is dis
but sure, just go with this
vestal mirage
is there an official plot to use for regression models though?
cuz like classification normally use roc
velvet thorn
vestal mirage
cuz like classification normally use roc
not necessarily.
vestal mirage
or liek if ur writing a paper i mean at least u should have some plots right?
to show how accurate / well ur model is
velvet thorn
vestal mirage
to show how accurate / well ur model is
not...necessarily?
depending on the use case you can just have e.g. a table for MSE
plots are defo useful for EDA
astral fox
i wrote this code: records = []
for i in range(1, 7501):
records.append([str(items_df.values[i, j]) for j in range(0, 20)])
its giving me an out of bounds error and i cant figure how to change the code to figure this out
index 11 is out of bounds for axis 1 with size 11
please help!
misty flint

 urban seal
astral fox
i wrote this code: records = []
for i in range(1, 7501):
records.append([...
urban seal
astral fox
i wrote this code: records = []
for i in range(1, 7501):
records.append([...
why hardcode the range of the first loop? can you make sure the size of your dataframe is as big
 chilly dock
 storm oak
I am a beginner data scientist hoping to find a project to work on to help guide my learning. Does anyone have any suggestions for good starter projects or open source projects I can contribute to while learning data science?
 arctic wedgeBOT
Hey @bold rune!
Uh-oh! It looks like your message got zapped by our spam filter. We currently don't allow .txt attachments, so here are some tips to help you travel safely:
• If you attempted to send a message longer than 2000 characters, try shortening your message to fit within the character limit or use a pasting service (see below)
• If you tried to show someone your code, you can use codeblocks
(run !code-blocks in #bot-commands for more information) or use a pasting service like:
 sweet moat
I am trying to install requirements.txt into my Linux (Pop!_OS) Machine via ssh. I cd into the correct folder and activated my conda env by doing conda activate virenv. Then i did pip install -r requirements.txt but when I use the env, I see that all the packages are not installed. Is there a reason to why this happens?
cobalt jetty
open a terminal and python. Try to import one of the installed library. If you see the library is not installed there, I believe it means you have two versions of Python installed.
and one has priority, and it's not the Anaconda's version.
 zinc stone
@sweet moat after activating your conda env, you can do which pip and it should show the path to where pip is installed (the which command is a general linux command so you can do that with anything)
if it shows a path that's not your current conda env, you probably need to conda install pip and then it should use that pip to install into your current conda env
woeful hamlet
Ive been following a lot of tutorials to display activation maps from a neural network, and i cant make it work with my own problem. Could someone help me pls? tf.gradients is not supported when eager execution is enabled. Use tf.GradientTape instead.
this is the colab i am trying to do
But if i change it, i get TapeGradient is not indexable
on this lane
grads = normalize(K.gradients(loss, conv_output)[0])
lapis sequoia
My tear’s gone cold I’m wondering why
lapis sequoia
Hello ! I'm completely new to machine learning and I'd love to learn it. Is Tensorflow a good tool to learn ML ? If so, do you know any (preferably text but a good video serie could do the job) good tutorials or documentation that could introduce me to the concepts of machine learning ?
Thanks a lot !
hard canopy
pickle + base64 ?
 upbeat cradle
velvet thorn
1 million rows isn't that big...what are you doing?
upbeat cradle
velvet thorn
1 million rows isn't that big...what are you doing?
Quite a few calculations, I'd basicaly describe what I'm doing as a join but with a lot more criteria and some extra calculations on top of that. I know I can use like df[df['field'] == x] but there's a bit more to it than that I think
austere swift
lapis sequoia
Hello ! I'm completely new to machine learning and I'd love to learn it. Is Tens...
for beginners tensorflow + keras is the best
its very easy to learn and is much more simple than other frameworks
hard canopy
After testing both, I find pytorch easier to use than Tensorflow. Howver, I already knew python.
Anyway, you should look for mnist examples for the framework you choose. It's the hello world of machine learning
austere swift
I dont mean like using plain tensorflow, tensorflow with keras
the keras wrapper is what makes it a lot easier
you don't need to define training loops or anything like that
or convert the data to tensors you can pass in numpy arrays
and it's just model.fit() for the training
hard canopy
Personally, I'd rather have the loop. I don't like not knowing what is going on. But each his own
it makes pytorch examples more verbose though
misty flint
lapis sequoia
Hello ! I'm completely new to machine learning and I'd love to learn it. Is Tens...
the O'Reilly series has quite a few good ML texts for beginners
woeful hamlet
Graph disconnected: cannot obtain value for tensor KerasTensor(type_spec=TensorSpec(shape=(None, 320, 320, 3), dtype=tf.float32, name='input_1'), name='input_1', description="created by layer 'input_1'") at layer "block1_conv1". The following previous layers were accessed without issue: []
help pls
lapis sequoia
Thanks for your advices ! I'm currently learning machine learning basics with the official tensorflow google collab notebook (https://colab.research.google.com/notebooks/mlcc/tensorflow_programming_concepts.ipynb#scrollTo=NzKsjX-ufyVY), but I will take a look at keras and the O'Reilly series :)

this really is hard to understand tho
I'm 16 and just have the basics of computer science, the graph, operations and tensors concepts are really abstract
hard canopy
@lapis sequoia https://course.fast.ai/

Deep Learning for Coders with fastai and PyTorch: AI Applications Without a PhD - the book and the course
lapis sequoia
hard canopy
<@456226577798135808> https://course.fast.ai/
thanks a lot ! I'm going to check this out
hard canopy
@lapis sequoia wow you re 16 ? I just checked out your github, congratulations, you ll end up an awesome développer no doubt about it
lapis sequoia
well, thanks a lot ! I hope I will manage to program for a living in a few years
hard canopy
Usually people start working at bac +5. You can find a job without, but the pay start lower. If you want to start working early, you can look for 'apprentissage'
lapis sequoia
Well I actually have very good grades for now donc go prépa hein
woeful hamlet
Graph disconnected: cannot obtain value for tensor KerasTensor(type_spec=TensorSpec(shape=(None, 320, 320, 3), dtype=tf.float32, name='input_1'), name='input_1', description="created by layer 'input_1'") at layer "block1_conv1". The following previous layers were accessed without issue: []
lapis sequoia
CPGE MP2I (la nouvelle), puis je tente télécom paris si c'est possible sinon autre chose
Sorry for the French giberrish, it's specific French School system, hard to translate
hard canopy
I wished I coded like that when I was your age haha
lapis sequoia
Lol, how old are you / wdyd now ?
I had the luck to get a computer for free when I was younger, It was a very crappy first gen pentium but it's how I learnt python (because it was basically the only thing that could run on it lol)
hard canopy
33 doing back end in python for an etl / dataviz company
lapis sequoia
this is cool actually
I would love to work as a data scientist
Do you work in France or elsewhere ?
lapis sequoia
best way to become a good programmer is to suck at video games I guess
Are there any Python packages or other software/tools that will return the discrete form of a differential equation?
 cerulean spindle
scipy?
hard canopy
Numpy
https://github.com/rapidsai/cudf anyone tried this ?

GitHub
cuDF - GPU DataFrame Library. Contribute to rapidsai/cudf development by creating an account on GitHub.
lapis sequoia
SciPy can be used to solve differential equations but I'm talking about something that will give the mathematical discrete equations of the differential equation.
midnight rain
hard canopy
https://github.com/rapidsai/cudf anyone tried this ?
yes its really nice
its also a massive pain to use if you arent already on linux haha
CUSpatial is also amazing
 solid dragon
Would this be the correct place to talk about webscraping? or would that be a different channel?
woeful hamlet
Graph disconnected: cannot obtain value for tensor KerasTensor(type_spec=TensorSpec(shape=(None, 320, 320, 3), dtype=tf.float32, name='input_1'), name='input_1', description="created by layer 'input_1'") at layer "block1_conv1". The following previous layers were accessed without issue: []
 warm moth
I have a Dual boot system with Pop!_OS and Win10. When I train an XGB Grid Search on WIndows, it only takes 2.3mins while the exact same thing takes 94mins on Linux. Any idea why this is so exorbitantly high? Its code from my repo:

GitHub
Code used for Summer Research Project . Contribute to Luberr-Dhruv/ML_Liquid development by creating an account on GitHub.
parameters = {'nthread':[4],
'objective':['reg:linear'],
'learning_rate': [0.005, 0.01, 0.03, 0.05, .07],
'max_depth': [5, 6, 7],
'min_child_weight': [3, 4, 5],
'silent': [1],
'subsample': [0.7],
'colsample_bytree': [0.7, 0.9, 1.0],
'n_estimators': [500]}
xgb_grid = GridSearchCV(xgb,
parameters,
cv = 2,
n_jobs = 12,
verbose=2)
xgb_grid.fit(X_train, Y_train)
print('XGBoost Regressor Score is {}'.format(xgb_grid.score(X_train, Y_train)))```
This is the snippet void forum
Is anybody else interested in Data Visualization using Augmented reality?

Medium
Data Visualization in Augmented Reality (or AR) made easy via iPhone and Python is now possible with the iOS App Augmented Data.
 fiery cobalt
messing around with Numpy, is there any way to reverse the axes?
like if i have py [[0 0 0] [1 1 1] [2 2 2]] and i want ```py
[[0 1 2]
[0 1 2]
[0 1 2]]
interesting diagram. idk how accurate it is but its interesting
 orchid sphinx
Hello guys i had some question.
so i had an error that says
"ConnectionError: HTTPSConnectionPool(host='finance.yahoo.com', port=443): Read timed out."
i know this happen because i tried to get all data ( 6 data ) from same IP address in short period time, is there any way to get all the data i want?
PS : i'm using pandas DataReader. Just give me the reference for this. thank you..
velvet thorn
interesting diagram. idk how accurate it is but its interesting
@misty flint why is probability distinct from statistics
messing around with Numpy, is there any way to reverse the axes?
like if i havepy [[0 0 0] [1 1 1] [2 2 2]]and i want ```py
[[0 1 2]
[0 1 2]
[0 1 2]]
@fiery cobalt transpose
warm moth
array.T right
lapis sequoia
guys
I'm doing my first Kaggle analysis project, and I'm stilling learning stuff
but could you tell me how it looks so far?

Explore and run machine learning code with Kaggle Notebooks | Using data from Daily Temperature of Major Cities
As analysis is still in progress, I have yet to make codes simple and organized, so it might look messy
 agile wing
@lapis sequoia hey this actually looks cool, i'm looking at your notebook,
misty flint
velvet thorn
> interesting diagram. idk how accurate it is but its interesting
<@!44642424847...
they separate out non-probability concepts and throw them under statistics aka the easier stuff (measures of central tendency, spread, hypothesis testing, p-values/alpha-values, etc.)
for probability, theyre including: Bernoulli distributions, Gaussian distribution, probability density function and cumulative density function ALSO Bayes theorem and Naive Bayes obv
 viral ocean
Any 3d geo map available in python?
misty flint
i guess are you using ML/DL or are you doing pure data viz
agile wing
@lapis sequoia but where is the prediction part of it? I'd like to know in the future months what the moving average temperature would be in seaborn, which would be neat though
misty flint
viral ocean
Any 3d geo map available in python?
oh idk sorry i was replying to myself lol
off the top of my head idk any libraries for what youre looking for
misty flint
lapis sequoia
https://www.kaggle.com/benalysis/daily-temperature-of-major-cities
looks nice. i upvoted it lol
and yeah
id be cool to do even some light ML
to predict trends/trajectories
lapis sequoia
agile wing
<@456226577798135808> but where is the prediction part of it? I'd like to know ...
I haven't got into prediction yet.. still in analysis part haha I'll keep digging into it. Thanks for the input man!
lapis sequoia
misty flint
looks nice. i upvoted it lol
I'll do ML part later, thank you my man 🙂
 limpid belfry
hi, i am using R programming to run some statistical analysis. any R community to join here? only saw Python..
 sterile totem
Can I ask here for machine learning for a discord bot?
Or I need to go in an other channel
?
warm moth
This is the notebook run on Pop!_OS. I made a venv and installed required packages. On windows 270 fits take only 2 mins
But the same notebook on windows
It takes only 2 mins
ANy idea why
lapis sequoia
does anyone know of or have a study guide/syllabus for self-taught data science with python? thanks
sterile totem
Srry to disturb but is it possible to machine learning for a discord bot, pls dm me for help me, or send me a link
Thx
earnest forge
could someone help me with implementation of attention mechanism on OCR task?
input_data = Input(shape=(256, 64, 1), name='input')

inner = Conv2D(32, (3, 3), padding='same', name='conv1', kernel_initializer='he_normal')(input_data)
inner = BatchNormalization()(inner)
inner = Activation('relu')(inner)
inner = MaxPooling2D(pool_size=(2, 2), name='max1')(inner)

inner = Conv2D(64, (3, 3), padding='same', name='conv2', kernel_initializer='he_normal')(inner)
inner = BatchNormalization()(inner)
inner = Activation('relu')(inner)
inner = MaxPooling2D(pool_size=(2, 2), name='max2')(inner)
inner = Dropout(0.3)(inner)

inner = Conv2D(128, (3, 3), padding='same', name='conv3', kernel_initializer='he_normal')(inner)
inner = BatchNormalization()(inner)
inner = Activation('relu')(inner)
inner = MaxPooling2D(pool_size=(1, 2), name='max3')(inner)
inner = Dropout(0.3)(inner)

# CNN to RNN
inner = Reshape(target_shape=((64, 1024)), name='reshape')(inner)
inner = Dense(64, activation='relu', kernel_initializer='he_normal', name='dense1')(inner)

# RNN
inner = Bidirectional(LSTM(256, return_sequences=True), name = 'lstm1')(inner)
inner = Bidirectional(LSTM(256, return_sequences=True), name = 'lstm2')(inner)

#Attention
attention_probs = Dense(1, activation='softmax', name='attention')(inner)
inner = Multiply()([inner, attention_probs])

## OUTPUT
inner = Dense(num_of_characters, kernel_initializer='he_normal',name='dense2')(inner)
y_pred = Activation('softmax', name='softmax')(inner)

model_attention = Model(inputs=input_data, outputs=y_pred)
model_attention.summary()
attention mechanism in my code doesn't make anything decent
practically, no impact
 late shell
Hello, I just started to learn ML, and was learning about Linear Regression.
When I create a LinearRegression object like this:
from sklearn.linear_model import LinearRegression
regressor = LinearRegression()
regressor.fit(X_train,X_test)         # fit on some data
now can someone explain me the difference between the following attributes of regressor :
regressor.coef_, regressor.intercept_, regressor.singular_
since we ultimately want the equation of the best fit line y = mx + c
ig, regressor.coef_ = m
regressor.intercept_ = c ,
but what about regressor.singular_ ?
woeful hamlet
loading a model like VGG16, for example, with imagenet weights, how can i remove and add layers manually?
 serene scaffold
sterile totem
Srry to disturb but is it possible to machine learning for a discord bot, pls dm...
serene scaffold
sterile totem
Srry to disturb but is it possible to machine learning for a discord bot, pls dm...
Yes, you can use machine learning in a discord bot. But you'll have to be more specific.
 little blade
Hello, not sure this is the correct place to ask this question, let me know if not 🙂
I have two numpy arrays (A, B) of the same length N. How can I get an array C that maps values in array A to the its closest neighbor in B.
Example input:
A = [0, 0.5, 0.8, 12, 15]
B = [0, 2, 15, 17, 18, 100]

Output:
C = [0, 0, 0, 15, 15]
oh, nice question
I'd:
- Calculate the distances between all pairs of points
- Do argmax to choose the right one
lemme write some code...
sterile totem
serene scaffold
Yes, you can use machine learning in a discord bot. But you'll have to be more s...
I want to "speak" with the bot
like when I say that he will answer something good
and if it's possible if he can learn alone the answer
tidal bough
@little blade
import numpy as np

A = np.array([0, 0.5, 0.8, 12, 15])
B = np.array([0, 2, 15, 17, 18, 100])
def map_closest(A,B):
    dists = np.abs(np.subtract.outer(A,B))
    best_inds = np.argmin(dists,axis=0)
    return A[best_inds]
map_closest(A,B)
gives array([ 0. , 0.8, 15. , 15. , 15. , 15. ])
np.subtract.outer(A,B), here, constructs a 2d array dists such that dists[i,j] = A[i] - B[j].
oh, it looks like you wanted the opposite order
little blade
ah very cool
little blade
So you create a matrix where each row corresponds A[i] and the cell is abs(A[i] - B[j])
Then np.argmin finds the smallest value for each row and returns the column indices?
@tidal bough
tidal bough
Yup
little blade
Very nice, thanks. I learned a lot 👍
misty flint
i also learned things
serene scaffold
sterile totem
I want to "speak" with the bot
it sounds like you need a goal that's more defined, but you can probably find a chatbot library to wrap in a Discord bot.
lapis sequoia
I guys, sorry for bothering you but I've to learn to use python for a exam, especially for data-science and security
can anyone give a brief guide, because I don't know where or how to start? I've already downloaded Python
little blade
!resources
arctic wedgeBOT
Resources
The Resources page on our website contains a list of hand-selected learning resources that we regularly recommend to both beginners and experts.
https://pythondiscord.com/pages/resources
misty flint
good luck with your exam
lapis sequoia
misty flint
good luck with your exam
ahahaha thanks. Could you explain me what is python pandas ?
woeful hamlet
loading a model like vgg16
how can i append more layers?
sterile totem
serene scaffold
it sounds like you need a goal that's more defined, but you can probably find a ...
mmhhh okay is it easy to put the library in the discord bot ?
serene scaffold
sterile totem
mmhhh okay is it easy to put the library in the discord bot ?
I don't know, I haven't looked for a chatbot library
sterile totem
serene scaffold
I don't know, I haven't looked for a chatbot library
ohhh okay i will check so, thx for your help
if I need your help again can I send you a message in dm ?
serene scaffold
sterile totem
if I need your help again can I send you a message in dm ?
if you have a question about a chat bot library, ask in this channel. If you have a question about how to make a Discord bot, ask in #discord-bots. We're a large community and it's easier for everyone if you ask questions here, rather than depend on single individuals to be available as you need them.
sterile totem
serene scaffold
if you have a question about a chat bot library, ask in this channel. If you hav...
okay I will do like that, thank you again
serene scaffold
sterile totem
okay I will do like that, thank you again
No problem. Good luck with your project!
sterile totem
😄
woeful hamlet
loading a model like vgg16
how can i append more layers?
cobalt jetty
earnest forge
```py
input_data = Input(shape=(256, 64, 1), name='input')
inner = Conv2D(32, (...
Your problem is that your NN starts with layers with too few nodes/neurons, only to widen later on. This means that your NN will have a hard time extracting rules from your dataset from the get-go.
Basically you want to go from large layers to smaller ones to extract out generic pattern.
Starting with a Conv2d with 32 nodes is like having a 1080p picture and resizing it to 256p and trying to train a neural network out of that.
serene scaffold
Keras question: I'm planning to train a neural network where the X data is a (x,n)-shaped array of x training instances represented by n-length arrays, and the Y data is an (x,k)-shaped array where each row is a one-hot. But the problem is that I want to learn each row of the Y data from a (k+1,n)-shaped slice of the X data matrix. I'm still digging but if anyone has encountered a similar issue (or there's some reason why this whole thing makes no sense) I'd be interested to know how you solved it.
 velvet sentinel
How to get the vertices of a 3d graph?
sterile totem
srry to disturb again but I have a code and it doesn't work cause, I think I don't say where the model is if soemone can help
arctic wedgeBOT
Hey @sterile totem! I noticed you posted a seemingly valid Discord API token in your message and have removed your message. This means that your token has been compromised. Please change your token immediately at: https://discordapp.com/developers/applications/me
Feel free to re-post it with the token removed. If you believe this was a mistake, please let us know!
sterile totem
I can't send my code 😅
but my model is a file.json in the same folder
how do I say model = file.json ?
woeful hamlet
loading a model like vgg16
how can i append more layers?
lapis sequoia
I'm trying to train an LSTM to classify sensor data but I'm running into an issue while trying to train my model which I think is due to how I'm formatting my training data, how can I fix this?
import os
import numpy as np
import tensorflow as tf


def get_data(data_name):
    training_sets = []
    for file in os.listdir(f'data/raw/{data_name}'):
        data_file = np.load(f'data/raw/{data_name}/{file}')  # Numpy data file that contains 3 data arrays (x, y, z data points over time)
        x_data_points = data_file['accel_x']  # Numpy array
        y_data_points = data_file['accel_y']  # Numpy array
        z_data_points = data_file['accel_z']  # Numpy array
        training_sets.append(np.array([x_data_points, y_data_points, z_data_points]))
    return np.array(training_sets, dtype=object)


if __name__ == '__main__':
    data = {
        'circle': get_data('circle'),
        'square': get_data('square'),
        'triangle': get_data('triangle')
    }

    # Array of labels ('circle', 'square', 'triangle')
    training_labels = np.array(data.keys(), dtype=np.str)

    # Array of data (array of arrays )  [
    #   [
    #       [[x_data_points], [y_data_points], [z_data_points]],  Note: 3 arrays of floats (3 arrays will all be of length n but n can be any integer number)
    #       [[], [], []],
    #       [[], [], []],
    #   ],
    #   [square_data],
    #   [triangle_data]
    # ]
    training_data = np.array(data.values(), dtype=np.float)

    model = tf.keras.Sequential([
        tf.keras.layers.Bidirectional(tf.keras.layers.LSTM(22, return_sequences=False, input_shape=(None, 3))),  # 3 arrays of floats (3 arrays will all be of length n but n can be any integer number)
        tf.keras.layers.Dense(3, activation='sigmoid')
    ])

    model.compile(optimizer='adam', loss='sparse_categorical_crossentropy', metrics=['accuracy'])
    model.fit(x=training_data, y=training_labels, epochs=100, steps_per_epoch=1000)
    model.save('model.h5')
Traceback (most recent call last):
  File "C:/Users/Technerder/Dev/TimeSeriesClassification/train_custom.py", line 19, in <module>
    'circle': get_data('circle'),
  File "C:/Users/Technerder/Dev/TimeSeriesClassification/train_custom.py", line 14, in get_data
    return np.array(training_sets, dtype=object)
ValueError: could not broadcast input array from shape (3,77) into shape (3)
    Args:
        x: Input data. It could be:
          - A Numpy array (or array-like), or a list of arrays
            (in case the model has multiple inputs).
          - A TensorFlow tensor, or a list of tensors
            (in case the model has multiple inputs).
          - A dict mapping input names to the corresponding array/tensors,
            if the model has named inputs.
          - A `tf.data` dataset. Should return a tuple
            of either `(inputs, targets)` or
            `(inputs, targets, sample_weights)`.
          - A generator or `keras.utils.Sequence` returning `(inputs, targets)`
            or `(inputs, targets, sample weights)`.
        y: Target data. Like the input data `x`,
          it could be either Numpy array(s) or TensorFlow tensor(s).
          It should be consistent with `x` (you cannot have Numpy inputs and
          tensor targets, or inversely). If `x` is a dataset, generator,
          or `keras.utils.Sequence` instance, `y` should
          not be specified (since targets will be obtained from `x`).
According to the fit method documentation I should be able to pass a list of arrays like I am
I am passing an array of arrays that each contain 3 arrays within them
But I'm not sure if that's supported
earnest forge
@cobalt jetty i should have clarified, passed pictures are of 256x64 shape
cobalt jetty
It's fine ^ ^. I was using a metaphor.
You have to think about what your neural network does.
i.e. it attemps at extracting rules from your dataset, here pictures.
I.e. you want a neural network that reduces in size layer after layer rather than one that grows in size layer after layers.
You are adding noise basically in this situation.
Because you NN will only be as good as what you're feeding it.
earnest forge
To the NN there are pictures given, and NN has to determine what's the word on the picture. It's OCR
https://www.kaggle.com/samfc10/handwriting-recognition-using-crnn-in-keras
I'm using original code from here

Explore and run machine learning code with Kaggle Notebooks | Using data from Handwriting Recognition
cobalt jetty
You're trying to build a feature extractor then.
earnest forge
Like that
cobalt jetty
mmhh. I have a hard time getting why the person would use a NN with a growing size if his first input is small.
earnest forge
As I know, attention mechanism rely on probabilities of particular occurences in input data and then, considering them, make an output.
cobalt jetty
Looks like it works though with 80% acc on letters and 60% acc on words.
earnest forge
cobalt jetty
Looks like it works though with 80% acc on letters and 60% acc on words.
Yeah
cobalt jetty
Given this explanation, it feels like they're trying to build a 'feature image' through a convolution, then feed that to a LSTM network.
I'd have gone the other way with the CNN, and likely smaller too at first
like 128 > 64
rather than 32 > 64 > 128
 shadow spruce
hello , i need some help . i can't open anaconda navigator
 rich silo
Hey all i need some help with Dash and HTML if anyone has few minutes.
I am trying to change the background color of the Dashboard but i am always getting a white footer beneath my Dashboard (i am no sure its a footer though).
Can anyone take a look at this please?
sterile totem
someone have a good site to learn machine learning ?
woeful hamlet
what should be the last layers to make a prediction?
x = Flatten()(base_model.output)
x = Dense(4096, activation='relu')(x)
x = Dropout(0.5)(x)
predictions = Dense(len(classes), activation = 'softmax')(x)```This is throwing me a OOM error on colab
 gritty jay
has anyone here worked with Grafana? Could use some help.
 regal sorrel
Any good resources for learning Gaussian Process Regression for Reinforcement Learning?
 tiny mauve
Allo. OpenCV question here. Im using opencv to watch a live stream (hls) and im trying to occasionally get the latest frame from the stream ... but that doesnt seem to be happening. it seems like im just crawling along frame by frame. When you call say cv2.read() does this not pick up the latest frame? Do I need to continuously walk the video to the latest point? I tried doing grab() until it didnt return anything then doing a retrieve() thinking that it would retrieve the last good grab ... but no dice.
cobalt jetty
woeful hamlet
what should be the last layers to make a prediction?
you're likely trying to load your dataset in memory and it crashes. Decrease your batch size and it should help
misty flint
regal sorrel
Any good resources for learning Gaussian Process Regression for Reinforcement Le...
idk. im assuming you already looked at scikit's documentation: https://scikit-learn.org/stable/modules/gaussian_process.html
heres like a 5 minute walkthrough https://towardsdatascience.com/quick-start-to-gaussian-process-regression-36d838810319
Medium
A quick guide to understanding Gaussian process regression (GPR) and using scikit-learn’s GPR package
 hushed swan
So I am looking to get into the Data Science field, can anyone tell me some things to practice to advance techniques?
austere swift
woeful hamlet
loading a model like vgg16
how can i append more layers?
loading it into what
austere swift
hushed swan
So I am looking to get into the Data Science field, can anyone tell me some thin...
what kind of techniques do you want to advance?
hushed swan
Analyzing data, predictive analysis
misty flint
check these skillsets out; youll be doing different ones depending on your specific position/size of company
@hushed swan
hushed swan
Okay, I’ll give it a go. Thanks!
 hoary wigeon
Any data scientist here ?
 fading sail
how do i properly load this data file into python using pandas? the data is in the from year-month-day hour:min:sec ; some reading
i tried setting sep='[-;:\s+]' but by doing so, it removes all the negative signs in some reading but gives all other datas correctly.
the problem is, data file and data has a common separator (-) . How do i get around this problem?
little blade
Do you want two or three columns?
fading sail
i want
year month day hour min sec reading
i can work if i can extract the last column too
little blade
What about splitting on spaces first? Then expanding the date column into year, month, day etc?
fading sail
that messes up with the data
let me show u one thing real quick
i am not able to grab the last column
little blade
I do not quite understand. You want athens2 to have df.columns = [year, month, day, hour, min, sec, reading]
?
fading sail
if that is possible ye
i created athens1, anthens2 because i was not able to properly read the data of the last column
so my plan was to take take time reading from athens1 and use athens2 to somehow grab the last column not worrying about other columns
little blade
But the only thing missing in athens 2 is splitting column 0 (date) and column 1 (timestamp). Correct? I do not understand what you mean that you are not able to grab the last column? 🙂
fading sail
so the column 3 has the readings i want
little blade
Can you send me a sample input?
fading sail
i tired to assign a column name to every column
ok. shall i send u the whole file? its not that big 😂
little blade
yeah sure 🙂
little blade
Yeah
arctic wedgeBOT
Hey @fading sail!
It looks like you tried to attach file type(s) that we do not allow (). We currently allow the following file types: .3gp, .3g2, .avi, .bmp, .gif, .h264, .jpg, .jpeg, .mkv, .mov, .mp4, .mpeg, .mpg, .png, .tiff, .wmv, .psd, .ai, .aep, .xcf, .mp3, .wav, .ogg, .webm, .webp, .flac, .afdesign, .m4a, .csv.
Feel free to ask in #community-meta if you think this is a mistake.
fading sail
oo lol rip
little blade
nevermind 😄
 iron mango
I wanna get started with the whole machine learning, ai, deep learning stuff and I am kinda more into deep learning and nlp, watched hours of tutorials but didn't quite get it. Any suggestion on where exactly to start and how? I am good with high school math, multivariable calculus, differentials, stats, intermediate programming, etc
 paper lake
iron mango
I wanna get started with the whole machine learning, ai, deep learning stuff and...
paper lake
iron mango
I wanna get started with the whole machine learning, ai, deep learning stuff and...
you might wanna look at
https://freecodecamp.org
and https://colab.research.google.com
they have tons of materials there

Learn to code. Build projects. Earn certifications.Since 2015, 40,000 graduates have gotten jobs at tech companies including Google, Apple, Amazon, and Microsoft.
!resources too
arctic wedgeBOT
Resources
The Resources page on our website contains a list of hand-selected learning resources that we regularly recommend to both beginners and experts.
https://pythondiscord.com/pages/resources
paper lake
an edX course for data science and machine learning is available for free
certificate is paid tho
iron mango
ah yes I have been planning to do an edX course for a well
What are the exact prerequisites to get into ai tho?
paper lake
iron mango
What are the exact prerequisites to get into ai tho?
i think AI is a subset of ML so i guess more or less the same as ML's prerequisites
Computer Science Fundamentals.
Data Structures.
Algorithm Analysis.
Calculus.
Discrete-Mathematics.
Linear Algebra including matrices, vectors and derivates.
Statistics and Probability.
Python programming.
 heady tide
Hey
Do you guys know what are some nice python modules I can use to visualise text/time
has to be time series
I have a dataframe with years and terms, each year has it's own computed TF-IDF words, I want to visualise something like progression of topics over time
or maybe do some forecasting for future years
regal sorrel
misty flint
heres like a 5 minute walkthrough https://towardsdatascience.com/quick-start-to-...
Thanks a lot!!
 cursive egret
Hi
I m unable to load as CSV file in the jupyter notebook
data = pd.read_csv("Desktop\real_estate_price_size_year.csv")
it use to load with this code now i m getting an error
FileNotFoundError: [Errno 2] File Desktop\real_estate_price_size_year.csv does not exist: 'Desktop/real_estate_price_size_year.csv'
cobalt jetty
pandas doesn't recognize the string you fed it.
try to restructure the path using the os library for instance.
filepath_or_bufferstr, path object or file-like object
Any valid string path is acceptable. The string could be a URL. Valid URL schemes include http, ftp, s3, gs, and file. For file URLs, a host is expected. A local file could be: > >file://localhost/path/to/table.csv.
If you want to pass in a path object, pandas accepts any os.PathLike.
By file-like object, we refer to objects with a read() method, such as a file handle (e.g. via builtin open function) or StringIO.
paper lake
heady tide
Do you guys know what are some nice python modules I can use to visualise text/t...
probably seaborn and matplotlib
heady tide
Yeah I will look into those, right now I'm computing the LDAs of each year based on specified topics to see their progression over time
woeful hamlet
cobalt jetty
you're likely trying to load your dataset in memory and it crashes. Decrease you...
look OOM when allocating tensor with shape[204800,2048] and type float on /job:localhost/replica:0/task:0/device:GPU:0 by allocator GPU_0_bfc [Op:Add]
woeful hamlet
austere swift
loading it into what
nah, i achieved it. i was trying to do this
                                         input_shape=dimensions,
                                         include_top=False)

x = Flatten()(base_model.output)
x = Dense(2048, activation='relu')(x)
x = Dropout(0.5)(x)
predictions = Dense(len(classes), activation = 'softmax')(x)

model = Model(inputs = base_model.input, outputs = predictions)```yep, input too chonky.
woeful hamlet
but... mmm... if i remove the Dense(2048) it works
                                         input_shape=dimensions,
                                         include_top=False)

base_model.trainable = True
inputs = keras.Input(shape=dimensions)
x = base_model(inputs)
x = keras.layers.GlobalAveragePooling2D()(x)
outputs = keras.layers.Dense(len(classes), activation='sigmoid')(x)
model = keras.Model(inputs, outputs)```It's because that's a fully connected layer that tries to build a 204800*2048 matrix to compute your input.
204800 times 2048
this is massive
woeful hamlet
This was my previous model (almost the same) and it worked
so what can i do? i was about to remove the dense
but maybe decreasing inputshape?
images are 320x320
maybe thats too big
cobalt jetty
imagine each neuron in that dense layer weights 1 byte (and it's more actually), just that layer would take up 620Mb.
Not having a dense layer at the start is a good thing.
You could start with a data_augmentation layer (to rescale, normalize, etc.) and start doing some convolution and maxpooling to reduce the size of the input being passed from layers to layers
Are you trying to do some classification?
something you can do to visualize what your model does is using:
keras.utils.plot_model(model, show_shapes=True)
woeful hamlet
cobalt jetty
Are you trying to do some classification?
ye
cobalt jetty
or the summary method in keras

for classification, you kindof only need a dense layer at the end
with a softmax activation function
woeful hamlet
image is uploading
cobalt jetty
unless it's binary
cobalt jetty
and then you can have a 1-neuron dense output layer with a sigmoid function.
for images with the resolution: 320x320 it seems like an overkill of a residual neural network.
woeful hamlet
100x100?
cobalt jetty
no, in terms of layers.
cobalt jetty
all that repeated set of residual layer blocks
you could cut to 1 at first to try the NN out
cobalt jetty
how many class do you have to predict?
woeful hamlet
almost 1000
cobalt jetty
I see
woeful hamlet
I am just opened to opinions. What ever u think will fit better tell me
cobalt jetty
https://openaccess.thecvf.com/content_cvpr_2017/papers/Chollet_Xception_Deep_Learning_CVPR_2017_paper.pdf the Xception is meant to run on massive datasets. You're basically hitting a hardware limitation here.
You indubitably have to reduce the nn you're trying to implement because your computer is, of course, not a Google cluster lol.
woeful hamlet
yeah, i saw like Xception is 40 times bigger than VGG16
cobalt jetty
so yeah: try shortening the number of layers, reduce the size of your layers after your loop of residual layer blocks.
I'd start there
cobalt jetty
This was a similar attempt I did a few months ago on a binary classification task for instance
not very potent but it gives you an idea.
binary classification on 256x256 images
cobalt jetty
half-half. I reused some of the info from the Keras documentation.
woeful hamlet
mmm
one thing nothing to do with models. Having highers resolution makes it eassier to succeed on predicitions?
or just waste of time while training?
cobalt jetty
This guide should be a good starting point
it's basically what I used as a starting point for the schema above
woeful hamlet
okey, thanks. Will take a loot
 wanton lynx
Excuse me sir , Ma'ams , I am stuck with an assignment can you help me .
cobalt jetty
woeful hamlet
okey, thanks. Will take a loot
np
wanton lynx
from torch.distributions import MultivariateNormal
def covariance_matrix_from_examples(examples):
    """
    Helper function for get_top_covariances to calculate a covariance matrix.
    Parameter: examples: a list of steps corresponding to samples of shape (2 * grad_steps, n_images, n_features)
    Returns: the (n_features, n_features) covariance matrix from the examples
    """
    # Hint: np.cov will be useful here - note the rowvar argument!
    ### START CODE HERE ###
    import numpy as np
#     np.cov(B, y=examples.n_features, rowvar=True)

    return(examples)
    ### END CODE HERE ###
import torch
import torchvision

mean = torch.Tensor([0, 0, 0, 0])
covariance = torch.Tensor(
    [[10, 2, -0.5, -5],
     [2, 11, 5, 4],
     [-0.5, 5, 10, 2],
     [-5, 4, 2, 11]]
)
samples = MultivariateNormal(mean, covariance).sample((60 * 128,))
foo = samples.reshape(60, 128, samples.shape[-1]).numpy()
assert np.all(np.abs(covariance_matrix_from_examples(foo) - covariance.numpy()) < 0.5)
print("covariance_matrix_from_examples works!")
It's on constructing COVARIANCE MARIX, could please anyone help me figure out
cobalt jetty
what's the error message?
Also this looks like a Coursera assignment
anyway, gotta go.
wanton lynx
cobalt jetty
what's the error message?
The input for the predefined construct func in numpy should be of 2 parameter but here itis 3 parameter
I don't know What to do
woeful hamlet
wanton lynx
I don't know What to do
pass 2 parameters instead of 3 to the numpy function u are getting the error on
foo = samples.reshape(60, 128, samples.shape[-1]).numpy()
change it to (60,128)
 ember dust
who know mmfc
woeful hamlet
is there any AI that builds the best model possible to 1 problem? o.o
cobalt jetty
x = [-2.1, -1,  4.3]
y = [3,  1.1,  0.12]
X = np.stack((x, y), axis=0)
np.cov(X)
#array([[11.71      , -4.286     ], # may vary
#       [-4.286     ,  2.144133]])
np.cov(x, y)
#array([[11.71      , -4.286     ], # may vary
#       [-4.286     ,  2.144133]])
np.cov(x)
#array(11.71)
here is the example from https://numpy.org/doc/stable/reference/generated/numpy.cov.html
try passing examples as the first parameter such as np.cov(examples) in your function.
The function is trying to make a matrix out of your first and second parameters. The matrix shape of the first parameter implies the function will not await a second parameter y, however.
lapis sequoia
counters = [Counter({'name': 'Test', 'amount': 1}), Counter({'name': 'Test', 'amount': 2})]
sum(counters, Counter())
how can I make it ignore "name" keys so it doesn't give this error
TypeError: '>' not supported between instances of 'str' and 'int'
or is this error not related to string values?
in the end I want to get a single dict like this:
{'name':'Test', 'amount': 3}
 rigid phoenix
Hey I am searching for an introduction guide or an example for high- and lowpass filtering in python. I don't need something immense complex I just want to filter the high frequencys out of my data and i am stuck
 late jackal
I want to merge 4 pandas dataframes but I want to merge them in the order of the first column of each data frame then the second columns and so fourth for an arbitrary amount of columns is there a clean way to do this?
it looks like merge or join just appends the columns onto the end
(maybe this belongs in #databases ?) i wasn't sure which was more fitting
woeful hamlet
'''
MODEL A
'''
base_model = keras.applications.Xception(weights='imagenet', input_shape=dimensions, include_top=False)

x = Flatten()(base_model.output)
x = Dense(2048, activation='relu')(x)
x = Dropout(0.5)(x)
predictions = Dense(len(classes), activation = 'softmax')(x)
model = Model(inputs = base_model.input, outputs = predictions)

# Total params: 442,133,930
# Trainable params: 442,079,402
# Non-trainable params: 54,528

'''
MODEL B
'''
base_model = keras.applications.Xception(weights='imagenet', input_shape=dimensions, include_top=False)

base_model.trainable = True
inputs = keras.Input(shape=dimensions)
x = base_model(inputs)
x = keras.layers.GlobalAveragePooling2D()(x)
outputs = keras.layers.Dense(len(classes), activation='sigmoid')(x)
model = keras.Model(inputs, outputs)

# Total params: 22,701,482
# Trainable params: 22,646,954
# Non-trainable params: 54,528
Why is there such a huge difference on the total params?
cobalt jetty
because you removed the dense model.
layer*
dense layers just have a shitton of parameters because everything is connected to everything.
woeful hamlet
a dense(2048) makes it 20 times bigger???
There is something weird on the summary of Model B, look
cobalt jetty
recall
204800 times 2048
woeful hamlet
_________________________________________________________________
Layer (type)                 Output Shape              Param #
=================================================================
input_2 (InputLayer)         [(None, 100, 100, 3)]     0
_________________________________________________________________
xception (Functional)        (None, 3, 3, 2048)        20861480
_________________________________________________________________
global_average_pooling2d (Gl (None, 2048)              0
_________________________________________________________________
dense (Dense)                (None, 898)               1840002
=================================================================
Total params: 22,701,482
Trainable params: 22,646,954
Non-trainable params: 54,528
_________________________________________________________________```that's 419430400 by itself.
cobalt jetty
You imported a pretrained model, so my guess is that it will appear as a single layer, yes.
but you should look into transfer learning at this point.
woeful hamlet

these are the last layers from Xception, like, original Xception
Doing nothing
Why it doesnt have More than 1 Dense layer?
And this is my model without adding layers at the end

Is the same, just missing Pool and last Dense layer
@cobalt jetty any possible ideas? i promise i leave u alone after xd
cobalt jetty
woeful hamlet
Why it doesnt have More than 1 Dense layer?
You don't need a dense layer at every step in a image classification problem
you just need a dense layer at the end so you can run a softmax activation and perform the detection
1-dense layer with 1000 neurons because you want, in the end, to detect 1000 classes.
woeful hamlet
so follow original xception and add just a global averga pooling 2d and a dense?
well, look the last layers from VGG16
 cobalt jetty
you should fix the Xception import (there is a function in Tensorflow/keras to do that but I don't have it in mind) i.e. you don't want to retrain those layers. At the end slap a new dense layer with one neuron per class you want to detect in your own dataset.
And you will have to train just that last layer
(with its own activation layer ofc)
https://medium.com/analytics-vidhya/dense-or-convolutional-part-1-c75c59c5b4ad <- a good read for you.

Medium
When it comes to designing a deep neural network (DNN), there are a few top-level architecture choices, one of them is should I use a…
woeful hamlet
i tried freezing the model and training only the last layer
but it didnt worked for me. Maybe i was doing it wrong
woeful hamlet
woeful hamlet
https://gyazo.com/92171fcb3aff7e2326704e3e0af505c6
but look. Why vgg16 has 3 denses?
cobalt jetty
because it's what the researcher that created it eight years ago went for. It doesn't mean you should reproduce it to the letter.
Dense layers become expensive as your dataset increases.
Also VGG used 224p images
when you're at 320p
this was vgg
woeful hamlet
okey, i will go for pooling and last dense, since my architecture is xception basically
and i dont think i can perform better xd
thanks for ur help
cobalt jetty
I doubt anyone can outperform Xception on their own rig. But it's a good starter for transfer learning.
and np
rigid phoenix
 nova widget
@Seppl check pandas filtering
nova widget
@Seppl check pandas filtering
I am sorry i don't get your solution
isn't it something completly different to high and low pass filtering? where are the similaritys
 severe valve
Can anyone guide me a bit on what model i should use/how i should do it? I'm currently trying to make a sort of wildfire risk assessment thing with ML. Basically, I'd like it to work on based off of weather factors. E.g high wind, low relative humidity, high temps, high pressure = high risk of wildfire. and the opposite. However, I'm not really sure how to do this. So far all I have is a ton of weather data ( which includes what I need ), and a model for fire growth. I've heard that a decision tree with sklearn would suit me, however, I'm not sure how to use it and customize it for my needs. ( also btw this whole thing is in python ) Thanks for reading this, I hope you have a good day.
nova widget
rigid phoenix
isn't it something completly different to high and low pass filtering? where are...
pandas is just a library (arguably the library) for handling dataframes, if you want relative high-low pass filtering you can use some standard diviation to filter, if you want it fixed you just set your high and low in the filter. For example on value filtering in pandas, see this yt video https://www.youtube.com/watch?v=2AFGPdNn4FM&t=2s&ab_channel=DataSchool
Let's say that you only want to display the rows of a DataFrame which have a certain column value. How would you do it? pandas makes it easy, but the notation can be confusing and thus difficult to remember. In this video, I'll work up to the solution step-by-step using regular Python code so that you can truly understand the logic behind pandas...
 bitter fiber
does anyone know a bit about neural networks?
rigid phoenix
nova widget
pandas is just a library (arguably _the_ library) for handling dataframes, if yo...
An actual high pass filter is possible... Thanks for the link
rigid phoenix
nova widget
pandas is just a library (arguably _the_ library) for handling dataframes, if yo...
That's an Trashhold function I guess but not a high pass filter

A high-pass filter (HPF) is an electronic filter that passes signals with a frequency higher than a certain cutoff frequency and attenuates signals with frequencies lower than the cutoff frequency. The amount of attenuation for each frequency depends on the filter design. A high-pass filter is usually modeled as a linear time-invariant system. ...
That's what I am searching for in python
bitter fiber
Does any1 know how to handle sequential data as input to a neural network?
@rigid phoenix
rigid phoenix
?
misty flint
severe valve
Can anyone guide me a bit on what model i should use/how i should do it? I'm cur...
id say remember to clean up your data beforehand. then start here:
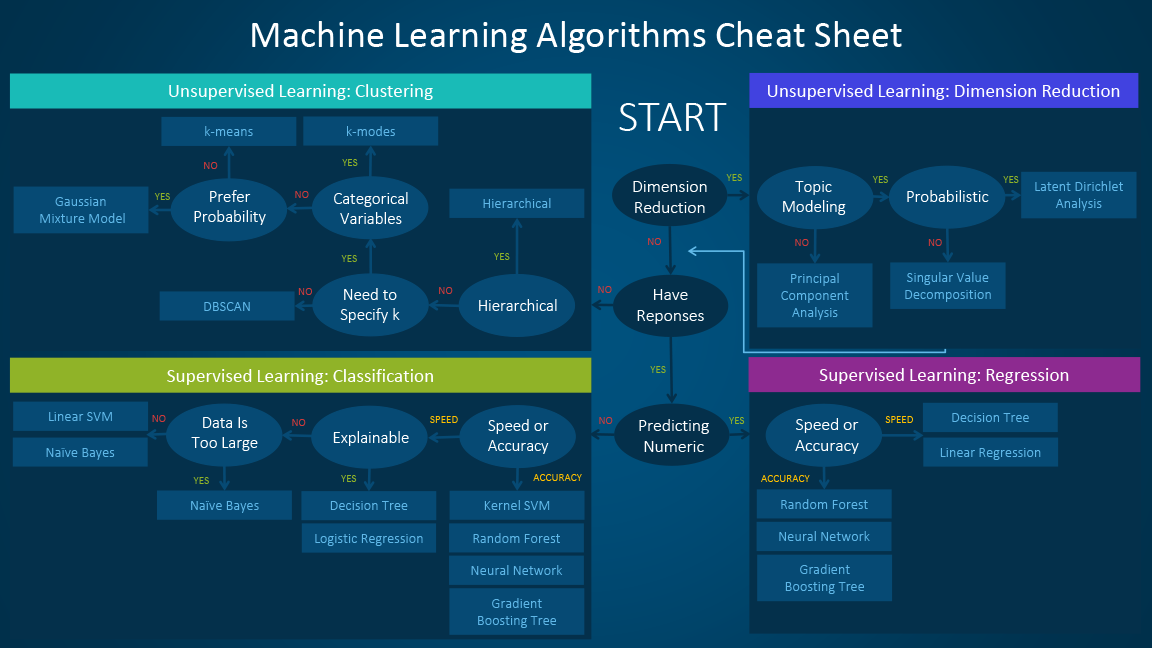
The SAS Data Science Blog
This resource is designed primarily for beginner to intermediate data scientists or analysts who are interested in identifying and applying machine learning algorithms to address the problems of their interest.
if your wildfire risk assessment output is a percentage, you'll probably want a regression model
if its more like, high risk, medium risk, low risk, you'll be doing one of the classification models
just follow the nifty diagram they have. that should fit your simple needs
 nocturne parrot
Hi, I have a newbie pandas question. If I have a dataframe like this, how can I show a 3-bar stacked graph by date of all the Num values separated by each user in a different color >>> df Date Name Num 0 2020-01-01 Bob 1 1 2020-01-01 Linda 3 2 2020-01-01 John 2 3 2020-01-02 Bob 4 4 2020-01-02 Linda 2 5 2020-01-02 John 3 6 2020-01-03 Bob 3 7 2020-01-03 Linda 1 8 2020-01-03 John 7. Thanks!
Something like this where A,B,C are the Names
 prime dust
I'm trying to scrape the live data out of my experiment java page I'm 1 min intervals so I can work on the data. How do I use selenium with pandas to do this please?
 odd lion
nocturne parrot
Something like this where A,B,C are the Names
odd lion
nocturne parrot
Something like this where A,B,C are the Names
You want matplotlib: https://matplotlib.org/3.1.1/gallery/lines_bars_and_markers/bar_stacked.html
odd lion
prime dust
selenium seems like an overcomplicated way to handle this. That sensor data is being transmitted somewhere by something. Being able to access it directly would be much more efficient
nocturne parrot
I feel like my original data is not suitable for the matplotlib's graph. Perhaps I need to transpose it and have the Names as Columns and the Nums be the intersection of Name and Date
odd lion
Possibly, ultimately matplotlib is the way you're going to want to make that
 copper ridge
@bot.command()
async def data(ctx, date: str):
    open(Log)
    df = pd.read_excel(Log)
    df.set_index(date, drop = False)
    dembed=discord.Embed(description = df, color=0x6b1aea)
    await ctx.send(embed=dembed)
error: discord.ext.commands.errors.CommandInvokeError: Command raised an exception: ValueError: The truth value of a DataFrame is ambiguous. Use a.empty, a.bool(), a.item(), a.any() or a.all().
discord.py sent me here
 echo storm
!traceback
arctic wedgeBOT
Please provide a full traceback to your exception in order for us to identify your issue.
A full traceback could look like:
Traceback (most recent call last):
    File "tiny", line 3, in
        do_something()
    File "tiny", line 2, in do_something
        a = 6 / 0
ZeroDivisionError: integer division or modulo by zero
The best way to read your traceback is bottom to top.
• Identify the exception raised (e.g. ZeroDivisionError)
• Make note of the line number, and navigate there in your program.
• Try to understand why the error occurred.
To read more about exceptions and errors, please refer to the PyDis Wiki or the official Python tutorial.
copper ridge
help in #databases ?
nocturne parrot
Regarding my original question. I could not get it to work with pyplot. But I did get it working with plotly express. ```import pandas as pd
import plotly.express as px
arr=[['2020-01-01','Bob',1],
['2020-01-01','Linda',3],
['2020-01-01','John',2],
['2020-01-02','Bob',4],
['2020-01-02','Linda',2],
['2020-01-02','John',3],
['2020-01-03','Bob',3],
['2020-01-03','Linda',1],
['2020-01-03','John',7]]
df = pd.DataFrame(arr, columns=["Date", "Name", "Num"]).reset_index().pivot('Date','Name','Num')
px.bar(df,x=df.index,y=["Bob","Linda","John"]).show()```
prime dust
Awesome . Thank you so much for you responses! I'll try this out as soon as I get the chance
severe valve
Thank you for the response! @misty flint This really helped. My intention is to create something like the former. Where it spits out a percentage based on environmental factors. How would I apply a regression model to this?
misty flint
did you follow the chart
are you doing linear or logistic regression
also does your data already have "the answers" aka your y-value/dependent variables (%risk of wildfire)
if not this makes it a little more complicated
@severe valve here follow this link step-by-step: https://towardsdatascience.com/machine-learning-with-python-regression-complete-tutorial-47268e546cea

Medium
Data Analysis & Visualization, Feature Engineering & Selection, Model Design & Testing, Evaluation & Explainability
you can skip "feature engineering" and "feature selection" steps bc it seems like its your first time doing ML stuff
remember to clean your data up first
like i said earlier
the quick and dirty way is to just remove the instances where youre missing values
 lime saddle
hello
can someone tell me what is the difference between np.array([1,2,3]) and np.array([[1,2,3]])?
the shape is different, the first (3,) and the second is (1,3)
ember dust
who know mmfc
lapis sequoia
I know mmfc
ember dust
how to classic the feature
 swift basin
Hi, I've got a philosophical DS question. My company asked me to create a model to predict future stockouts at our stores, but I was thinking: if my model tells them we need more stock in a certain store and we prevent the stockout, how would I even measure the accuracy of the model? I know I could do back testing to measure it, but it troubles me that once my company starts using my model, the stockout patterns will change. How would you guys approach this?
Assuming I'm using ML, the best I've got is to update the predictions on a daily basis to take into account any changes in input variables.
velvet thorn
swift basin
Hi, I've got a philosophical DS question. My company asked me to create a model ...
backtesting, yes, but also
is the demand at each store independent?
lapis sequoia
how to convert pandas datafram column to all ints?
currently i read from csv but for some reason is converting the ints to double
swift basin
velvet thorn
is the demand at each store independent?
Not really fully independent, but let's assume it is. We have demand forecasts already, but it's a big company so lots of things can go wrong in the supply side of things.
velvet thorn
swift basin
Not really fully independent, but let's assume it is. We have demand forecasts a...
that's one thing you can do
deploy the model only for some stores
and compare over/undersupply
swift basin
There's many variables I know play a role, but wouldn't know how to integrate in a non ML model (ig distribution center issues)
nova widget
lime saddle
can someone tell me what is the difference between np.array([1,2,3]) and np.arra...
the double outer brackets makes it two dimensions. you could also had put np.array([[1,2,3],[3,2,1]]) this would yield shape 2,3
velvet thorn
can anybody help me?
@fresh jasper spelling
 hollow scarab
how can I display a chart I made with pandas in excel?
I put dfs to excel like this, can I just add the chart this way or it has to be different?
 fresh jasper
oh man
 fading hamlet
swift basin
Hi, I've got a philosophical DS question. My company asked me to create a model ...
fading hamlet
swift basin
Hi, I've got a philosophical DS question. My company asked me to create a model ...
Stockout is pretty expensive, so the companies object would be to always have stock available. Could you just model it based on a stock threshold ?
Look into how the supply chain works, how long it takes to stock up and somehow compare it to the expected demand of the store - if the store is about to hit the threshold then resupply.
This would be different for each store however, but If the company have already know expected demand for each store I guess you could use that somehow?
When it comes to measuring accuracy you could look at where you end up around that threshold at end of period - and since there is always excess stock it should be safer with regards to not stocking out.
Don't know if that makes sense.
swift basin
fading hamlet
Look into how the supply chain works, how long it takes to stock up and somehow ...
We have a software solution that does this already, but it assumes our suppliers won't have any issues, that our distribution center's capacity is infinite, and many other things that happen in real life that are hard to quantify, but that we could surely add as a binary variable in an ML model or that could be captured by seasonality
So basically I'm being asked to make a model that will alert us in case our inventory management system isn't handling our future inventory correctly, if that makes sense
But like not wait for it to happen
misty flint
swift basin
So basically I'm being asked to make a model that will alert us in case our inve...
what ML model are you using
for classification models (order of importance), look at:
Accuracy.
Logarithmic Loss.
ROC, AUC.
Confusion Matrix.
Classification Report.
regression models:
Mean Absolute Error.
Mean Squared Error.
Root Mean Squared Error.
Root Mean Squared Logarithmic Error.
R Square.
Adjusted R Square.
if you need the how: https://www.kaggle.com/vipulgandhi/how-to-choose-right-metric-for-evaluating-ml-model

Explore and run machine learning code with Kaggle Notebooks | Using data from multiple data sources
youre going to be using a lot of sci-kit learn
good luck
 hard flax
Hey, is https://realpython.com/python-matplotlib-guide/ a good place to learn matploit or do you guys advice another ??

This article is a beginner-to-intermediate-level walkthrough on Python and matplotlib that mixes theory with example.
swift basin
misty flint
good luck
Yea I'm quite familiar with ML itself... it's more of a "how to deal with people reacting to my prediction and influencing the target variable's value" question
Like you could have a model that predicts stock prices and that is 100% accurate... but if you make the predictions public and people buy or sell according to what the model says and thus affecting prices, wouldn't that lower its accuracy?
That's my issue with making a model to predict stockouts, people in charge of supplying stores would be able to see my prediction and avoid the stockouts
misty flint
theres going to be an adjustment period
as people start to decide whether to make decisions based on your model or not
then a good model would pick that up as well
this is getting into MLOps stuff
cant give you any good answers
guess youll have to retrain the model during/afterwards..?
nova widget
Seems like you see the algorithm as the goal, and not the means of the solution to this optimization problem.
hard canopy
Is it me, or is Azure a dumpster fire ? I have been totally unable to create a new resource for bing search :/
tiny mauve
Hello.
 rotund umbra
hi
tiny mauve
Im trying to figure out if there is a way to run analytics on the machine learning data stream coming out of aws rekognition (though it could be any AI service). Outside of manually parsing the the json and having fixed rules... is there a better way to generate specific insights?
 hard canopy
so, what do people use to search images programatically on the web ?
misty flint
it worked fine for us yesterday
hard canopy
I keep being hit by 'bla bla could not create resource'
hard canopy
Why are all cloud providers have absolutely shitty UI ?
tiny mauve
misty flint
rip azure
what happened to azure?
hard canopy
Microsoft happened to it
misty flint
tiny mauve
hard canopy
Why are all cloud providers have absolutely shitty UI ?
I actually think the order from worst to best is google, microsoft, aws.
hard canopy
I haven't tried AWS yet
tiny mauve
But overall its hard to make a configurator look pretty.
hard canopy
the naming of their service never attracted me
tiny mauve
a configurator with a billion switches to be clear.
misty flint
why is gcp the worst
hard canopy
like, how the f do you know what a service does with its name ?
misty flint
hard canopy
like, how the f do you know what a service does with its name ?
i found a funny list making fun of that
tiny mauve
Yeah the naming is the worst part. But there is a translator site that you can use. https://expeditedsecurity.com/aws-in-plain-english/
It's named what? Figure out what Amazon Web Services should actually have been called.
misty flint
It's named what? Figure out what Amazon Web Services should actually have been called.
we pulled up the same link

hard canopy
haha
tiny mauve
Brilliant minds think alike. Hello fellow genius.
tiny mauve
I think the worst part of the aws names are that so many of them have the prefix "cloud". Cloudfront. Cloudwatch. cloud9. cloud search. cloud map. LIke first of all - we know its the fucking cloud you clowns. Its like calling a car a road car. And second ... making a bunch of similiar names for things that have nothing to do with each other is stupid.
misty flint

tiny mauve
tiny mauve
Im trying to figure out if there is a way to run analytics on the machine learni...
So anyone have thoughts on this? Are there existing ways to extract data you care about from rekognition inference streams?
tiny mauve
yeah
misty flint

tiny mauve
i want a simple AWS Cloud JSON Autoparser that give me the things I want easily and also maybe finds other interesting things.
misty flint
like
a method to reverse-engineer their algorithm
by looking at the outputs

idk my dude. my brain just broke
tiny mauve
For example ... face reco gives you a bunch of responses about emotion. so some emotion with a probability. I'd like to see if some analysis widget exists that can process that. So 80% of faces across the video spent most of their time happy. 20% were angry. etc.
No no ... im not looking to reverse engineer anything. I want analysis on the output data.
tiny mauve
It spits out a bunch of junk. I can parse said junk myself and find what Im looking for ... but i want to see if there is already more intelligence already available.
misty flint
kinda like a meta-analysis
i see
not any big stuff im aware of but im sure people have made stuff like that for small projects
 dusty temple
Hey everyone. I'm trying to use KalmanFilter from pykalman to predict the sample mean for a linear trend but it is resulting in the following graph
hard canopy

GitHub
Image Dataset Tool (idt) is a cli tool designed to make the otherwise repetitive and slow task of creating image datasets into a fast and intuitive process. - deliton/idt
this seems cool
if this does not work, then fuck it, i'll do it with selenium.
dusty temple
dusty temple
I thought the orange line should eventually coincide with the blue line. Why are they just becoming parallel
 gilded narwhal
Hi everyone I was wondering if anyone has tried using the pandas HTML table and run into an issue with the styler?
It seems like it puts all the cell id's on a single row, which breaks on Chrome when exceeding 4096 cells
hard canopy
oh god it seems to work ❤️
 livid cradle
hi i need help with my code and probably almost everyone in here knows how to solve please come help me to #help-honey thanks
 slim phoenix
Hello, I want to do feature engineering on my data.
My data is both numerical (~60 columns) and categorical (~60 columns).
Half of the column have 50% of NaN.
I only want to keep important columns.
So I need Imputation (IterativeImputer), but it requires no NaN nor Categorical columns I guess.
I need LabelEncoding (LabelEncoder and OneHotEncoder for columns with lot of variables), but it requires to NaN.
I need Selection (RFE), but it requires no Categorical columns.
My notebook is such a mess right now. I wonder how to do it properly and which step first.
I feel like my only solution is to do a basic imputation like most frequent, than encoding, then selection. But I really don't like basic encoding
Maybe someone have an idea on how I should proceed ? Many thanks
livid cradle
livid cradle
hi i need help with my code and probably almost everyone in here knows how to so...
....
 tepid grail
Hello there, I'm looking to recognise this Town hall https://i.imgur.com/FLCksaK.png
On images like this https://i.imgur.com/SX2kAFs.png
When I search for Image Finder or proccesing they gave me library that do a goodle image search
I'm more looking for "where is wally" and finding the position of the building, what term or library I should search to get my project done?

 tidal bough
tepid grail
Hello there, I'm looking to recognise this Town hall https://i.imgur.com/FLCksaK...
tidal bough
tepid grail
Hello there, I'm looking to recognise this Town hall https://i.imgur.com/FLCksaK...
computer vision or image recognition would be the right(er) search. There's the cv2 library for it. Specifically, I think you want this guide: https://docs.opencv.org/master/d4/dc6/tutorial_py_template_matching.html
tepid grail
tidal bough
`computer vision` or `image recognition` would be the right(er) search. There's ...
Hmmm really great link, look like Template matching was the keyword I was looking for, thansk you!
@tidal bough Have you already done something similar?
tidal bough
Hmm. Actually, yes, but in my task, I went with a slightly different way
tepid grail
Cuz when I search for Image processing or IA in general, 99% of guide speak about training while I have nothing since the image while not change, the only difference is that image can be covered partialy 🤔
If you have any more ressources name, libs I take it!
tidal bough
Context: I was, for nothing at all but to try out a real automation task, automating the process of mining in the game Galaxy Of Fire 2 Full HD. The process in question looked like this:
tepid grail
Oh I played the first one a lot 😆
tidal bough
and the goal was to keep the rotating crosshair in the middle even as the circles shrink and the crosshair occasionally experiences random jerks
So I needed to get the crosshair position.
I didn't go with the convolution method because the crosshair is rotating, and so I didn't really see a nice way (maybe construct a kernel from the "average" of rotating an image of the crosshair all possible degrees would have worked)
Basically, I just ended up using the color of the crosshair. If you crop the right part of the image, it'll be the only pixels of about the right color there.
tepid grail
You used OpenCV right?
tidal bough
Nope, just working with the image directly as a numpy array.
tepid grail
I'm looking to map the layout from a screen like this https://i.imgur.com/avR4mws.jpg

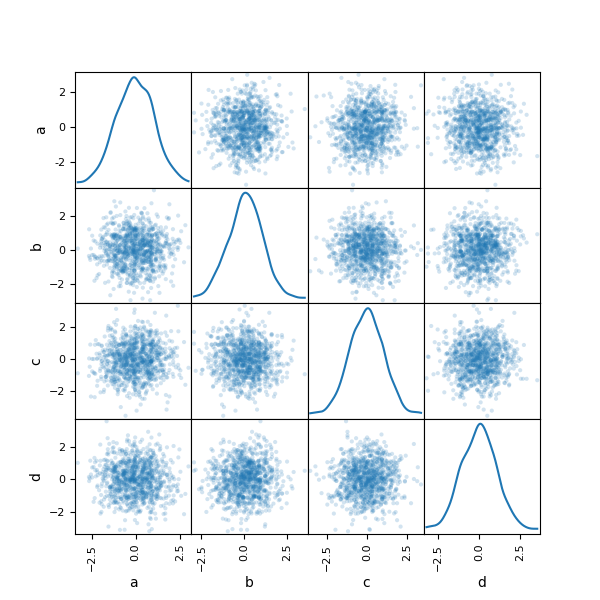


 tidal bough
My detection code was basically:
def get_drill(self, arr): #that was in a class
    dists = np.linalg.norm(arr-self.target_color,axis=2) # find the deviation from the target color of every pixel
    inds = (dists<=self.tolerance) # find the pixels that are close enough
    y_points,x_points = np.where(inds)
    if len(x_points)==0:
        return None
    x_centre,y_centre = np.mean(x_points),np.mean(y_points) # find the center-of-mass of all such pixels
    return x_centre,y_centre
it worked well enough for me.
tepid grail
I get it
I will try your link above to see if I can map the layout
PyCharm is updating and a give a try, thanks for the help
misty flint
tepid grail
Hello there, I'm looking to recognise this Town hall https://i.imgur.com/FLCksaK...
look up object detection
oh someone already answered
oops

oh opencv is good
tepid grail
The only downside is ressources are not availaible on the example
misty flint
?
tepid grail
From the opencv example he linked me
I would like to see how he put the mario coin as a image
misty flint
you upload it into the template...
template = cv.imread('mario_coin.png',0)
this part of the code
you choose the image there
if i wanted mario i would upload a picture of mario
instead
tepid grail
I'm not that dumb 😛
I wanted to see how he cropped the mario coin, I think it's already RGB, or if he already process this image before
tepid grail
Any output is right
Now I need to figure what I have to tweek 🤔
The example just try every methods, I have no option or thing I could tweak 🤔
My input image is not that good for the program, I'm already stuck
Does OpenCV handle image transparency?
tidal bough
Hmm, I'm not sure why it's not detected on your image. Your template looks nice, even if it's partially hidden by other buildings
tepid grail
I have this result numero2
misty flint
tepid grail
Result 1
Result 2
I can find it if I crop it directly
I mean all building are pretty different, even with a large error marge that should be possible?
The thing is what I can do at this point? tweak the input image? training something?
I have no clue to what I should look into 😦
hard canopy
Transfer learning is awesome 😄
woeful hamlet
@hard canopy how did u do it?
 rough mountain
Can someone please help me I've been dealing with this for weeks. I'm using tensoflow-gpu and keras. I'm working on a binary classification problem. I'm saving the model with model checkpoint, but even if I use model.save it still does not work. I don't really care about the efficiency of my model, I can deal with that later.
Every time I load the model and evaluate it, it get's 50% Acc, and only predicts 1s.
I could be wrong but this appears to be related to a still open issue form 2016: https://github.com/keras-team/keras/issues/4875
There are no errors and the model more or less works when in the same session, but it completely breaks in cross-session. I've tried h5 and hdf5. I'm rather new to this, but it seems no-one can help me with this issue. 😦
Model: https://pastebin.com/9DujAf33
Data Prep: https://pastebin.com/eNFRSNCR
Test Script:
CATEGORIES = ["Dog", "Cat"]

pickle_in = open("X.pickle", "rb")

X = pickle.load(pickle_in)

pickle_in = open("y.pickle", "rb")
y = pickle.load(pickle_in)

model = tf.keras.models.load_model("model.h5")

model.evaluate(X, y)```https://pytorch.org/tutorials/beginner/transfer_learning_tutorial.html I used this tutorial and adapted it
midnight rain
anyone here used FAISS?
serene scaffold
   precision    recall        f1
A   0.500000  0.500000  0.500000
B   0.333333  0.200000  0.250000
C   0.454545  0.384615  0.416667
(Pdb) new_row
precision    0.429293
recall       0.361538
f1           0.388889
dtype: float64
I'm trying to append new_row as a row with the name macro
why is this not straightforward
serene scaffold
 austere tapir
anybody here
austere tapir
anybody here
Well, you have to tell us what you want to talk about 👀
serene scaffold
serene scaffold
```(Pdb) df
precision recall f1
A 0.500000 0.500000 0.500000
B ...
looks like I just needed to use loc
serene scaffold
austere tapir
still nobody here
I'm right here. This channel is for talking about data science as it pertains to Python. Let me know what with respect to data science you'd like to discuss.
serene scaffold
austere tapir
i want to be smarter
This is quite vague. Would you like to see our Python resources page?
austere tapir
ok sure?
serene scaffold
!resources
arctic wedgeBOT
Resources
The Resources page on our website contains a list of hand-selected learning resources that we regularly recommend to both beginners and experts.
https://pythondiscord.com/pages/resources
serene scaffold
austere tapir
ok sure?
Just so we're clear, are you aware that this is Python Discord, and that this is a place where you can talk about and learn the Python programming language?
serene scaffold
austere tapir
i want to learn ten
Great, take a look at our resources 
There's a video in #welcome that explains how all this works.
 high badge
are hyperparameters independent of one another?
if i fine tune one hyperparameter, then i fine tune another would it potentially yield suboptimal results
i feel like this is true
but im still not sure
austere swift
some of them are dependent on each other
for example if you have a hyperparameter which is the amount of a certain type of layer, and another one which is the number of nodes in that layer, those will affect each other
or if you tune the learning rate and the optimizer, those will affect each other as well, etc
a lot of tuning frameworks will tune multiple parameters at a time however
high badge
would i just have to tune all my hyperparameters at once
or is it possible to know which ones are dependent and which one are independent
velvet thorn
high badge
or is it possible to know which ones are dependent and which one are independent
it depends.
some are clearly dependent
but they may interact in unforeseen ways
high badge
oh
velvet thorn
however, if you're just starting out, I suppose you can assume independence
velvet thorn
austere swift
for example if you have a hyperparameter which is the amount of a certain type o...
this?
and also
regularisation type and regularisation strength
austere swift
usually anything that has to do with tuning one parameter and then tuning the parameters of that parameter, those are clearly dependent
like in the case of the layers, tuning the amount of layers and then the parameters of the layers would be dependent
or tuning the optimizer then the parameters of the optimizer are dependent
stuff like that
high badge
i see
im using keras tuner to tune my sequential model
do you guys have any recommendations on hyperparam tuners
austere swift
you mean the framework or the tuning algorithm?
velvet thorn
ML in a nutshell: take something boring (trial and error) and give it a cool name (hyperparameter tuning)
🥴
high badge
framework
austere swift
velvet thorn
ML in a nutshell: take something boring (trial and error) and give it a cool nam...
something boring: draw a line through dots
give it a cool name: linear regression
austere swift
high badge
framework
i recommend raytune
tidal bough
velvet thorn
ML in a nutshell: take something boring (trial and error) and give it a cool nam...
In numerical initial value/boundary problem solution the same thing is called "shooting method", so it's a pretty common pattern 🙂
austere swift
raytune is framework agnostic meaning it can be used with any deep learning framework
and also its more advanced
high badge
oh
austere swift
than something like keras tuner
high badge
i see
high badge
what tuning algorithms do you usually use
austere swift
ASHA which is basically just a modified hyperband
austere swift
i just chose hyperband out of trial and error, and ASHA (which literally just means async hyperband) is a modified version that is better for parallelism
high badge
ah so its for faster computing/fine tuning
austere swift
I haven't tried all the algorithms, but out of bayesian optimization (that i used in kerastuner), hyperband, and grid search, hyperband did the best
austere swift
usually i just put a boundary that would be possible in a reasonable manner
for example don't set your max number of layers to 1000000 thats not really a good idea
high badge
ah i see
i heard about running a coarse search then following up with a finer search
what does a coarse search mean
austere swift
make it search in a very broad search space, then once you start seeing it lean towards a certain area, follow up with a more precise search space based on what the outcomes of the previous coarse search were
high badge
ok im going to try to do that
i have a lot of questions
tuner = kt.Hyperband(model_builder,
objective = 'val_accuracy',
max_epochs = 10,
factor = 3,
directory = 'my_dir',
project_name = 'intro_to_kt')
for a hyperband in kerastuner, how would i set parameters like max_epochs or factor
austere swift
I usually keep the default factor, and for max epochs set it to slightly above the number of epochs it takes to converge
that way if it takes a bit longer for some other parameters to converge it won't stop it early
high badge
are these parameters technically hyperparameters and should they be tuned as well?
austere swift
not really
well, you can get a bit better optimization by tuning them ig, but it won't be really important to tune
velvet thorn
high badge
are these parameters technically hyperparameters and should they be tuned as wel...
they're hyperhyperparameters
a hyperparameter is anything that affects the derivation of parameters
austere swift
^
high badge
ahhh i gotcha
high badge
okay
austere swift
yeah because if you really wanted to tune that, then you'd also need to tune the hyperhyperhyperparameters, the hyperhyperhyperhyperparameters, and it just becomes unreasonable
austere swift
i guess you might be able to get better results by testing different optimization algorithms though
like bayesian optimization, hyperband, etc
high badge
would it be heavily advised to test out different optimization algorithms
velvet thorn
huh
didn't we just say that
although I would defer to @austere swift I haven't worked with DL in a while
austere swift
high badge
would it be heavily advised to test out different optimization algorithms
yeah i'd recommend you at least try it out, but it's not completely necessary
misty flint
velvet thorn
ML in a nutshell: take something boring (trial and error) and give it a cool nam...
💀
why is this so accurate
austere swift
Like you shouldn't really need to do it every time you optimize something