#data-science-and-ml
1 messages · Page 279 of 1
 earnest forge
 mellow pumice
I use WSL-2 over windows to use TensorFlow GPU on my I figure most of the contents will be similar even if you are using Ubuntu. There's this video by Jeff Heaton -> https://youtu.be/mWd9Ww9gpEM

The Windows Subsystem for Linux (WSL-2) allows you to run a complete command-line Linux operating system under Windows. Now that NVIDIA offers a passthrough drive you can access the GPU from the Linux system in WIndows. In this video I show how to install a prerelease version of windows that allows this functionality, which allows you to run t...
You can use the jupyter notebook to check whether the gpu is available or not
You would want to stick to the same versions though @earnest forge
earnest forge
thanks
 hollow scarab
how do I multiply columns in pandas without column names? because this one did not work
so I mean I want to refer to the 2. and 3. column
by 1 and 2
okay so the issue might be that the first 2 rows have texts in them, is there any way I can make it so it only does that formula for the 3.-x rows?
 woeful hamlet
my colab sessions resets because i exceed the ram limit. Is there any other platform where i have a bit more ram? or way i can do what i want using that ram? basically is because i am appending many images to a list for my train data
like... appending only half of all the images, train the model, save it, load the other half, overwritting the previous ones, and train again
will this work? or something?
 high lion
hollow scarab
how do I multiply columns in pandas without column names? because this one did n...
high lion
hollow scarab
how do I multiply columns in pandas without column names? because this one did n...
Check out the pandas documentation.
But as far as I am concerned the appropriate method is DataFrame.iloc[]
https://pandas.pydata.org/pandas-docs/stable/reference/api/pandas.DataFrame.iloc.html?highlight=iloc
@hollow scarab
woeful hamlet
what is the most efficient way to loop over all image pixels with numpy?
high lion
Depends on what you want to do. Numpy has built-in functions to perform certain operations such as thresholding @woeful hamlet
I guess if you want to perform an action like this it would be most efficient to use those.
 sour beacon
why does my database keep locking
 late shell
hello everyone, I just started learning ML a few days ago, and am confused in the data preprocessing section, especially feature scaling. Can someone clear this up for me: If I'm scaling down/normalizing my data (which I don't clearly understand why), then, while providing unseen/test data to my trained model, wouldn't I have to scale that down as well, and then scale up the predictions back up again in order to make sense out of it?
 high badge
it depends on what models you are working with
for decision trees, they just find points to divide the data to minimize an impurity score, meaning they dont rely on scaling
however if you look at linear regression, they you can think of wx + wx + wx... + b as a linear combination of sums
if an input x_k (k going from 1 to n where your dataset is m instances by n features) is a large number, then it would naturally contribute to a larger output y = wx + wx + wx... + b
and a larger output when measured in the loss function would produce a greater loss
and because you minimizing the loss with respect to the weights, you must compensate for the large values of x_k by reducing the weight for x_k to near 0
thus your optimization would pay more attention to one feature above another
where, ideally, you want your optimization to give equal attention to all features
yes, you would have to scale not only your training and validation data but also unseen data
but you dont have to scale the predictions back up again
late shell
oh okay. Thankyou very much @high badge
I cant say I understood 100% of what u said, but i see some reason now. thanks for the input
high badge
ah
well the simple idea behind feature scaling is just to give equal attention to all features so that when you optimize it with an algorithm, it wont pay more attention to one feature above another
 ripe forge
I'd also like to add, that you "learn" how to scale down the data using training data, and then you "implement" it on the training data, and you also "implement" it at the time of predictions. However, it is important you don't "re-learn" a scale on the test/prediction data
late shell
yes, I just encountered this problem rn,
from sklearn.preprocessing import StandardScaler
sc = StandardScaler()                # Standardization
X_train[:, 3:] = sc.fit_transform(X_train[:, 3:)  # I want to scale only from column 3 onwards
X_test[:, 3:] = sc.transform(X_test[:, 3])
Why do I have to scale the test data according to the parameters (mean & S.D) of my train data. Why am I not calling sc.fit() on the test data as well?
 lapis sequoia
Hi, is there someone who could help me with linear regression? I am still a little bit unsure of which model I should make based on my data
ripe forge
late shell
yes, I just encountered this problem rn,
```py
from sklearn.preprocessing impor...
because a scaling operation is like a "Transformation" that you decided on. the specific values were learnt from the train data, but that's just a finer point compared to the broad picture of what it actually is. Now, your model is trained based on inputs that have been scaled a certain way. So the weights this model learnt are tied to the scales at which the inputs were fed to it. Now, if you keep changing the scales for every prediction/test data, then your model's weights would be wrong corresponding to the modified scales.
so, logically, changing the scale after locking down a model makes no sense, and would harm your performance
The other version of explaining this is much simpler though: at training time you have the information of a dataset, at the time of live predictions you may only have 1 row of data at a time or something, and can't know the properties of the distribution of unseen data.
However, i think the first style of explaining is more technically precise
 shell wing
Anyone have insight into Folium, I have been struggling with this for a while https://gis.stackexchange.com/questions/384248/folium-and-timestamped-geojson-issue-not-reading-the-data-correctly

Geographic Information Systems Stack Exchange
I am having issues with Folium and using TimestampedGeoJson. I have the following dataframe structure below. I am trying to display this data with Folium and a time slider to be used on the date fi...
hollow scarab
@high lion i did check it, didnt find anything:/ doesnt iloc just remove part of the df?
high lion
hi again @hollow scarab
hollow scarab
hello, sorry my discord was being weird, only saw the ping now
hollow scarab
yeah, and I used iloc before in the code, but my issue is that if I remove that row with text with iloc is that I need that row back later
 velvet thorn
high badge
however if you look at linear regression, they you can think of wx + wx + wx... ...
velvet thorn
high badge
however if you look at linear regression, they you can think of wx + wx + wx... ...
...are you saying that scaling is necessary for linear regression?
high lion
iloc should not remove anything from your df
import pandas as pd

mydict = [{'a': 1, 'b': 2, 'c': 3, 'd': 4},

          {'a': 100, 'b': 200, 'c': 300, 'd': 400},

          {'a': 1000, 'b': 2000, 'c': 3000, 'd': 4000 }]

df = pd.DataFrame(mydict)
print(df.iloc[1])
print(df)
output: ```
a 100
b 200
c 300
d 400
Name: 1, dtype: int64
a b c d
0 1 2 3 4
1 100 200 300 400
2 1000 2000 3000 4000
 loud marlin
Question about Spark...
I have the impression that spark is widely use and it’s fast
Today I took the spark course, and learn it’s build on RDD blocks, where RDD is much slower than data frame
————————————
Then it come across my mind... is spark really helps us to process the data faster?
Yes, the data separate into partitions, and able to cache them definitely helps the speed.
However, with so many modules optimize dataframe, is spark really needed?
Please help me understand it 🙂
velvet thorn
loud marlin
Question about Spark...
I have the impression that spark is widely use and it’s...
when you say "dataframe"
what kind of dataframe do you mean?
high lion
hollow scarab
yeah, and I used iloc before in the code, but my issue is that if I remove that ...
@hollow scarab maybe your dataloss comes from something else?
hollow scarab
so I can iloc, do the operation and then 'remove' the iloc to get all the data back? @high lion
velvet thorn
hollow scarab
so I can iloc, do the operation and then 'remove' the iloc to get all the data b...
.iloc is purely a data accessor; it does not modify your dataframe.
velvet thorn
in fact, in general, pandas methods do not perform modification
velvet thorn
hollow scarab
but how do I put the df back to its original size
can you explain what you want to do + show your code
loud marlin
velvet thorn
what kind of dataframe do you mean?
It’s like the dataframe create from pandas I assume.
Sorry that I am new to Python and spark. Yet the instructor keep mention data frame is faster than RDD. So that I ask
hollow scarab
I need to add a new column by multiplying 2 other columns but the first 2 rows have text so I get an error @velvet thorn
velvet thorn
loud marlin
It’s like the dataframe create from pandas I assume.
Sorry that I am new to Py...
okay, so first, Spark has dataframes too
but anyway
pandas and Spark serve fundamentally different needs
hollow scarab
so I got suggested to use iloc to remove those text rows so I could add the new column
velvet thorn
pandas is for data that can fit in memory
hollow scarab
but I will need those rows with texts in them later
velvet thorn
hollow scarab
so I got suggested to use iloc to remove those text rows so I could add the new ...
what are the columns called
so in general, with pandas the biggest dataset you can work with will be a few GB?
hollow scarab
I can show it better tomorrow, issue is its on work pc
velvet thorn
on the other hand, through distributed processing, Spark can handle datasets that are much bigger (say, hundreds of GB)
however, distribution of work has overhead.
so for small datasets, pandas will more or less always be a lot faster.
hollow scarab
well I transposed the df, so the columns just have the index number as name
but if its okay I can tag you tomorrow with screenshots, should be easier to explain that way I think
hollow scarab
I meant pics of the df in excel
hollow scarab
I cant send the code sadly, not allowed to send stuff like that to external emails:/
velvet thorn
!e ```py
import pandas as pd
df = pd.DataFrame([['text', 2], [3, 4]], columns=['a', 'b'])
print(df)
df['result'] = pd.to_numeric(df['a'], errors='coerce') * pd.to_numeric(df['b'], errors='coerce')
print(df)
 arctic wedgeBOT
@velvet thorn :white_check_mark: Your eval job has completed with return code 0.
001 |       a  b
002 | 0  text  2
003 | 1     3  4
004 |       a  b  result
005 | 0  text  2     NaN
006 | 1     3  4    12.0
So if the data is small, it’s better to use pandas
If data is large to some point, or perform something that’s is highly time consuming tasks, spark is the way to go?
velvet thorn
@hollow scarab I would suggest somehthing like this
so you don't need to remove the rows and add them back
velvet thorn
loud marlin
So if the data is small, it’s better to use pandas
If data is large to some poi...
more the former
large data
loud marlin
And even RDD is slow, it will not significantly impact spark’s overall performance ?
hollow scarab
I will try that tomorrow, thanks a lot! @velvet thorn
velvet thorn
loud marlin
And even RDD is slow, it will not significantly impact spark’s overall performan...
"slow" is relative
hollow scarab
that works if I just use df[1] and df[2] referring to the 2. and 3. colums right? @velvet thorn
instead of their name in string
velvet thorn
hollow scarab
that works if I just use df[1] and df[2] referring to the 2. and 3. colums right...
if those are their names
velvet thorn
columns can have numbers as names
but if you want to refer to a column by position you need iloc
hollow scarab
pd.to_numeric(df.iloc[2:,:]) so like this?
hollow scarab
well I will try to use the name the index has
my main problem is that the original excel file I have to work in is garbage
so the df is not clean at all
loud marlin
@velvet thorn thanks for your explanation
I was confuse because there are contradict idea come to me together...
Where spark is the leading way to distribute data and process
Yet it’s processing RDD in the background, which is slower compare to process with dataframe
I guess I shouldn’t worry about it too much at this point 🧐
velvet thorn
loud marlin
<@171929073063297024> thanks for your explanation
I was confuse because there a...
think about it this way
pandas is like a single sports car
Spark is like a fleet of trucks
if you just need to transport one box
the sports car is faster
but if you have 10,000 boxes
even if the sports car individually can make a trip quickly
you have so much stuff that the fleet of truck's capacity more than makes up for their lack of speed
loud marlin
That helps 🙂
 woeful snow
Hi everyone
I'm wondering if somebody could help me out on some pandas functionality that I'm sure must be there - I just don't know it. I want to generate a Pandas series that starts with a seed value and then cumulatively adds a value each time for n times.
velvet thorn
woeful snow
I'm wondering if somebody could help me out on some pandas functionality that I'...
show an example so I am sure what you mean
woeful snow
For example seed=21.35, addval=0.1, length=200 [21.35, 21.45, 21.55 ..... ] till length = 200
velvet thorn
ah
simple
!e
import numpy as np
import pandas as pd

seed = 21.35
step = 0.1
count = 200

print(pd.Series(np.arange(seed, seed + step * count, step)))
@velvet thorn :white_check_mark: Your eval job has completed with return code 0.
001 | 0      21.35
002 | 1      21.45
003 | 2      21.55
004 | 3      21.65
005 | 4      21.75
006 |        ...
007 | 195    40.85
008 | 196    40.95
009 | 197    41.05
010 | 198    41.15
011 | 199    41.25
... (truncated - too many lines)
Full output: https://paste.pythondiscord.com/azevojoneq.txt
velvet thorn
woeful snow
For example seed=21.35, addval=0.1, length=200 [21.35, 21.45, 21.55 ..... ] t...
is this what you were thinking
woeful snow
Just running it now, but it looks like exactly what I want!
Thank you that is exactly what I needed
I'll go away and read the documentation to figure out how it works
I'm trying to learn by converting a basic excel sheet -> python to get the hand of basic data building and conversions 🙂
 digital crescent
I'm thinking about doing a lot of realtime data analysis that will probably involve recalibrating forecasts based on new data points as they arrive. I have no formal machine learning background, but I know a bit about stats and feel like I can build a logical system to classify data and model and analyze and find ways to optimize this process. Am I missing something by not knowing what to do with the "machine learning" topic? Is it perfectly okay to just work on a project like this, do your own stats, program your own logic to reconfigure your models and reevaluate, etc
Or am I missing some kind of special "machine learning" sauce?
 desert parcel
percentages = []

for pred, target in zip(preds.t()[0], testTargets.t()[0]):
    percent = pred / target * 100
    percentages.append(percent)

sum = 0
for percent in percentages:
    sum += percent

accu = sum / len(percentages)
accu
Is this a good way to calculate average accuracy?
 midnight widget
@desert parcel You can do the *100 at the end somewhere to make it a little more efficient
 misty flint
digital crescent
I'm thinking about doing a lot of realtime data analysis that will probably invo...
misty flint
digital crescent
I'm thinking about doing a lot of realtime data analysis that will probably invo...
i dont understand the question. if the analysis youre doing works just fine for your needs, then that is okay, no?
what machine learning is good at is using certain types of algorithms to get really, really good at predicting values
sometimes it works well, sometimes it doesn't. the best models use mixed models
digital crescent
I guess I just need to read more about it. I don't understand why it exists as a kind of separate topic if we are all using the same stats, math, and logic
misty flint
@digital crescent these are the kind of algorithms im talking about.
digital crescent
So roughly speaking "machine learning" is kind of a catch-all term for basically everything in your pic and related topics? @misty flint
misty flint
it technically also includes deep learning and a whole brand of other subfields
neural networks, computer vision, natural language processing, etc.
let me find a diagram my prof showed us
it will make more sense than me

Data Science shares some techniques with Machine Learning
but theres also many standalone techniques
different tools you can use depending on your circumstances
and then Deep Learning is a subset of Machine Learning that is growing in popularity
AI is the umbrella/parent field
midnight widget
@misty flint Does data science include traditional nonparametric statistics?
Cuz I noticed it doesnt overlap AI completel
y
digital crescent
Thanks for the explanation and diagrams, @misty flint
misty flint
midnight widget
<@!446424248479645706> Does data science include traditional nonparametric stati...
i would say that falls under both. here's another venn diagram from the same presentation
misty flint
digital crescent
Thanks for the explanation and diagrams, <@446424248479645706>
no problem my friend. i would at least take a look at some introductory material. see if their techniques/the algorithms would be better or worse than what youre already doing
digital crescent
I will do that, thanks. I want to find a balance between not being egotistical and acting like I know everything (which I absolutely do not) but also not acting like ML is some kind of magic technology from the gods
And somewhere I want to learn what I need to learn for my uses cases and then apply it
midnight widget
Hi all! What are some super interesting data science projects I can do to learn concepts? I love math and building things from scratch as much as I can.
hollow scarab
is it possible to change the value of one cell with pandas?
because I created a new column, but the name of the column went in the index, and after tranposing the df it got lost..
 red briar
In this guide, I'll show you how to replace values in Pandas DataFrame. I'll review several examples for demonstration purposes.
 wise garden
Does anyone use nbopen.exe to open their ipynb files? I can't get it to work on Windows 10.0.19041.746
 tawny pivot
Hello friends, I have this data with columns which you can see in photo. There are duplicates in ID columns.
I need a loop for same ID(in some places it may be duplicated 10 or more.) have occured in different dates; than take difference
of amounts that placed in third column according their dates. I mean I need difference of observation in t+1 minus t's amount.
 hollow void
An ML newbie wanting to implement licence plates detection on images in python, any considerations or tips for choosing between pytorch and tensorflow?
 warm seal

Stack Overflow
The script has two losses, the squared loss L_a = (y-F(x))^2 and the same loss but with a 0.5 factor: L_b = 0.5*(y-F(x))^2. Using L_a gets me trees with one splits (even if max_split is set to >...
Any help would be appreciated :))
woeful hamlet
hi
i wanna use this
Jacob Gildenblat
Github project for class activation maps Github repo for gradient based class activation maps
But keras is saying "better use tf.GradientTape"
instead of K.gradients
But if i do that, then it sais GradientTape cant be indexed
Can someone help me?
woeful hamlet
Graph disconnected: cannot obtain value for tensor KerasTensor(type_spec=TensorSpec(shape=(None, 100, 100, 3), dtype=tf.float32, name='input_3'), name='input_3', description="created by layer 'input_3'") at layer "block1_conv1". The following previous layers were accessed without issue: []

 stark orchid
Hey All,
Here's a cool opportunity to contribute to an awesome open source tool, https://github.com/great-expectations/great_expectations, and gain some great experience. The Great Expectations Team is hosting a series of hackathons, there will be three different event times and two of them are for current university students. Expect swag, doordash credit and cash prizes. You will be joined by the core team to help you contribute!
Dates:
Student Hackathon 1/23 5-9pm PST (students only, must be currently attending a university)
Data Professionals Hackathon 1/28 5-9pm PST
Student Hackathon 2/6 2-6pm PST (students only, must be currently attending a university)
Sign up here: https://www.surveymonkey.com/r/great-expectations-hackathon-3
We blogged about it here: https://greatexpectations.io/blog/great-expectations-hackathons/
 misty slate
Hi, I need some help with Tensorflow/TensorBoard
I made a chatbot using TensorFlow. I changed it for a discord bot and flask. But for my project I want to somehow show ANY DATA, but in visual form, graphs, pie charts, bars. I don't know how to use TensorBoard to visualize my chatbot data.
This is my code: https://github.com/hootloot/Tensorflow-Question/blob/main/main.py
Thank you

GitHub
Contribute to hootloot/Tensorflow-Question development by creating an account on GitHub.
velvet thorn
hollow void
An ML newbie wanting to implement licence plates detection on images in python, ...
IMO there isn't enough of a difference in that case to matter
hollow void
velvet thorn
IMO there isn't enough of a difference in that case to matter
Thanks @velvet thorn
 hasty dagger
Hi guys, I created a question in one of the help channels but it doesn't seem like anyone there is able to help me. Is it alright for me to ask the question in here?
velvet thorn
hasty dagger
Hi guys, I created a question in one of the help channels but it doesn't seem li...
if it's a DS question, sure
hasty dagger
I'm working through a project where I'm using matplotlib but I'm having a weird issue where I'm being returned "<Figure size 1440x720 with 0 Axes>" even though it renders the graph correctly, however it is not being scaled with figsize.
velvet thorn
hasty dagger
I'm working through a project where I'm using matplotlib but I'm having a weird ...
huh
what are you trying to set figsize to
🥴
@hasty dagger don't do that
don't create your own figure
just pass figsize to test.plot
if you want to use pandas's plotting interface
hasty dagger
@velvet thorn cheers, I'll keep that in mind, works perfectly
velvet thorn
hasty dagger
<@!171929073063297024> cheers, I'll keep that in mind, works perfectly
yeah, what's happening is
you're creating one Figure manually
but pandas is creating its own Figure and Axes and plotting on that
which is what you see
velvet thorn
velvet thorn
you're creating one `Figure` manually
but this is what is shown in the text output after plt.show()
if you want to do that
you can create a Figure and Axes manually with plt.subplots
and then pass the Axes to the plot method of the DF
hasty dagger
Thanks very much! I knew it would've been something silly. I'm still fairly new to python data science type stuff and I've very grateful you where able to help!
velvet thorn
hasty dagger
Thanks very much! I knew it would've been something silly. I'm still fairly new ...
yup no worries!
 rich slate
Hello I am in need of assistance. I am going to sleep right now so if you can dm me with possible solutions that would be great!
I want to know how to make a script that can solve math equations, like complex ones, not things such as 5 + 2 = c or stuff like that. I want to know how to have things such as 5x + 4y = 200 or something and it have another equation such as -5x +2y = 300 or something, and it use elimination processes to find it.
velvet thorn
rich slate
Hello I am in need of assistance. I am going to sleep right now so if you can dm...
hm.
depends on how complicated and flexible you want to make it
need to know more
 vivid maple
Anyone know where i can learn hadoop and its ecosystem
any course or mooc that is fast paced?
 rapid wraith
I have a dataframe of stock prices with individual stocks as columns and the index is a datetime index. The data is padded so when there is no longer any observations for a stock the last value keeps repeating until the end. I am trying to remove this padding so that when the price stops changing the remaining values are converted to NaN. I tried to do this by creating a boolean mask by (df == df[::-1].expanding().mean()[::-1]) however something is not right and the returned boolean mask is not correct. Does anyone know what is going wrong or of a better solution?
 mortal trout
is there any trained model for image spam/ham detection if not how cld i make one
rapid wraith
rapid wraith
I have a dataframe of stock prices with individual stocks as columns and the ind...
The issue seems to be that the values don't match because the mean value has more decimals, rounding the figures fixed the issue for now
 lavish tundra
someone help me pls? i have a json files with a lot of 'prices' per 'dates'='timestamp" and i was trying to create a XY graphic about it, but idk how i make the 'timestamp' have a id for i can put it in order on the X graphic
 stray ivy
anyone know how to use a levenstein distance matrix to determine how "similar" one word is to another? the algorithm to generate the matrix is easy, but idk how to utilize the metric
 shut valve
Wouldn’t it just be the one with a low distance you can probably set some threshold and filter with that
 fading sail
so i have uploaded a data file using pandas. I want to extract a specific column but the column starts with a number. How do i extract this colummn?
stray ivy
shut valve
Wouldn’t it just be the one with a low distance you can probably set some thresh...
define "the one with a low distance". it's a matrix with a similarity metric for each char between the 2 words
 pure pond
Anyone know much about pyroot?
shut valve
Well I’m picturing it being each col is a word and each row is the distance for every word so like the diagonal is zero because the distance from itself is zero but then you could find all occurrences where the distance is 1 and the find the corresponding row and col of it to get your two words with a distance of 1
lapis sequoia
I'm trying to find a Python implementation of Matlab's ode23tb solver. It is an implementation of the TR-BDF2 algorithm. SciPy doesn't offer a solver for this algorithm. Are there any other Python packages that have this type of solver? https://www.mathworks.com/help/matlab/ref/ode23tb.html
This MATLAB function, where tspan = [t0 tf], integrates the system of differential equations y'=f(t,y) from t0 to tf with initial conditions y0.
 deft harbor
So, I guess people are reverse engineering the training data. Something to keep in mind if you are training on private data and releasing the model to the public.
 main quest
i have this groupby which gets every row by date:
by_day = df.groupby(['Date'])```

how would i go about filling missing days? i'm not really sure how resample works correctly, if i try:

```py
by_day.resample('D')```

it errors with:
TypeError: Only valid with DatetimeIndex, TimedeltaIndex or PeriodIndex, but got an instance of 'RangeIndex'```
 digital timber
I know this is last minute but I have a presentation in an hour but I think Binary search tree is not being created correctly, could someone help me take a look thanks in advanced
Im getting the error
AttributeError: 'NoneType' object has no attribute 'balanceFactor'```
in my code

https://paste.pythondiscord.com/pefakivode.rb
this is my code, it is supposed to be using the binary search tree to search for the title but I think the construction of my Binary search tree is messed upi need to fill the missing date holes but i have no idea how to calculate them without using heavy iterations and checks
and this is a result of a groupby('Date')
 silver venture
main quest
i need to fill the missing date holes but i have no idea how to calculate them w...
silver venture
main quest
i need to fill the missing date holes but i have no idea how to calculate them w...
Check for date format, it should automatically format correctly
rich slate
@velvet thorn
The thing i'm trying to figure out is like if I got 2 equations
Would there be a way for it to solve for a variable using the 2 equations
rich slate
true dat
 abstract zealot
Hi guys random question hope you’re all keeping well - it’s about estimating mean and sd from a normal distribution. Right now I’m using maximum likelihood estimations, but was wondering if there are any methods you guys know of that I could also try and then compare the results
velvet thorn
@velvet thorn
The thing i'm trying to figure out is like if I got 2 equationsWould there be a way for it to solve for a variable using the 2 equations
@rich slate in the special case of two linear equations in two variables, easily
rich slate
@velvet thorn could you explain?
velvet thorn
@velvet thorn could you explain?
@rich slate which part
rich slate
the way it would get the variables by itself to find out the value @velvet thorn
 sharp raft
hello. I have a project due tonight and i was wondering if someone can help me with it. To better understand it
you're not necessarily giving me the answer, i'm just very stuck
velvet thorn
the way it would get the variables by itself to find out the value @velvet thorn
@rich slate you need to parse the string
you can look into regular expressions
hello. I have a project due tonight and i was wondering if someone can help me with it. To better understand it
@sharp raft you should just ask
and anyone who comes by might be able to help
sharp raft
thanks for that
 twin moth
Do you guys know if SKLearn can work with tuples?
We have a Pandas dataframe which contain a ton of points and we want to let SKLearn analyze it all.
When we try to get SKLearn to use it, it tries to convert the tuples to floats.
We can split each tuple to 2 columns -- X and Y but we want them to be correlated.
lapis sequoia
is there any particular reason for not using numpy arrays?
 errant rivet
@twin moth What model are you trying to apply using sklearn? There's no reason different features (columns) can't still have some correlation or relationship.
 solemn helm
hey guys!
anyone here use TensorFlow?
does anyone have some experience with TFX (TensorFlow Extended) or TensorFlow Serving?
I'm working on project and now I need to train my models in my front-end application and until now I did not found some tutorial that helps me to do that.
PS. My front-end application was developed with ReactJS and i'm looking for the better solution to create the back-end.
errant rivet
@vocal kettle Generally if performance is a big concern, you're better off using numpy over normal lists. One situation that would fail when using numpy arrays that I can think of is if you wanted to mix datatypes in the same array. Consider this example.
np_array = numpy.array(['abc', 123, 0.595])
print(np_array[1] + 50)
>>> TypeError: Cannot add int to str
Numpy arrays can only hold one datatype, this is one of the keys to their efficiency. You could also cast to the correct type, but it feels like a poor use of np arrays to me.
main quest
i'm having a few problems plotting a grouped dataframe in an iteration. that orange line seems to go crazy back and forth
code: https://paste.ee/p/CLWtf
expected result: multiple different colored lines, each representing row count by date
what actually happens:
errant rivet
@main quest on mobile and not able to view your code easily, but one thing that can cause this is if your values aren't sorted on the x axis.
 hallow harness
Hello i have this example json and code here
{"text_sentiment": "positive", "text_probability": [0.33917574607174916, 0.26495590980799744, 0.3958683441202534]}
input_c = pd.DataFrame(columns=['Comments','Result'])
for i in range(input_df.shape[0]):
    url = 'http://classify/?text='+str(input_df.iloc[i])
    r = requests.get(url)
    result = r.json()["text_sentiment"]
    proba = r.json()["text_probability"]
    input_c = input_c.append({'Comments': input_df.loc[i].to_string(index=False),'Result': result, 'Probability': proba}, ignore_index = True)
st.write(input_c)
This is what the result look like
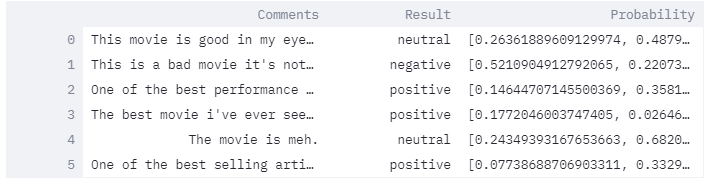
Is there a way to make it like:
If the value in Result is "positive" then I want the proba to index to 2, and if its "neutral" index to 1, "negative" index to 0
Like this:
https://i.stack.imgur.com/aM8SA.png
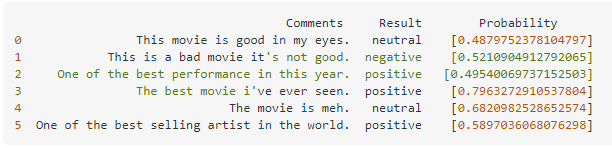 errant rivet
@hallow harness, maybe try something like this
df['New Probability'] = np.where(df['Result'] == 'positive', df['Probability'][2], df['Probability'][1])
ok lemme try it
errant rivet
Wait, there is a third option, negative. My bad
main quest
errant rivet
<@!256460316660072448> on mobile and not able to view your code easily, but one ...
i'm pretty sure the dataframe is sorted by date even before trying to do anything else
errant rivet
@hallow harness Not the most efficient but I got this to work
df['New Probability'] = np.where(df['Result'] == 'positive', df['Probability'][2], np.where(df['Result'] == 'neutral', df['Probability'][1], df['Probability'][0]))
I assumed that the first index of the probability column is for negative values
hallow harness
yes
errant rivet
I also assumed that there are only three possible options for result: positive, negative, neutral
hallow harness
first index = negative, 2nd = neutral , 3rd = positive
errant rivet
@main quest Really double check because if it's a line graph, it doesn't make sense that it would jump forward ~6 days, then go backwards 3 days.
hallow harness
errant rivet
I also assumed that there are only three possible options for result: positive, ...
got this error
 steady wigeon
Can tweepy captured tweet that is not truncated?
hallow harness
tried making it [:,2]
errant rivet
can you actually post the error so that I can read it Cloz?
hallow harness
ok ok
File "c:\users\jetri\appdata\local\programs\python\python37\lib\site-packages\streamlit\script_runner.py", line 332, in _run_script
    exec(code, module.__dict__)
File "C:\Users\Jetri\Documents\StreamLit\senv\iflects\iflectsstreamlit.py", line 112, in <module>
    input_c['new probability'] = np.where(input_c['Result'] == 'positive', input_c['Probability'][2], np.where(input_c['Result'] == 'neutral', input_c['Probability'][1], input_c['Probability'][0]))
File "c:\users\jetri\appdata\local\programs\python\python37\lib\site-packages\pandas\core\series.py", line 882, in __getitem__
    return self._get_value(key)
File "c:\users\jetri\appdata\local\programs\python\python37\lib\site-packages\pandas\core\series.py", line 991, in _get_value
    loc = self.index.get_loc(label)
File "c:\users\jetri\appdata\local\programs\python\python37\lib\site-packages\pandas\core\indexes\range.py", line 357, in get_loc
    raise KeyError(key) from err
One quick question... The result column is always the value in the array with the highest Probability? correct?
hallow harness
yes sir
errant rivet
Ah, didn't realize it earlier
twin moth
lapis sequoia
is there any particular reason for not using numpy arrays?
Sorry, missed your message, we were instructed to use Pandas dataframes - it's for a college course
twin moth
errant rivet
<@!191683640118214656> What model are you trying to apply using sklearn? There's...
Sorry, missed your message.
I guess that's right but it sounds more reasonable to just have it all in a single column
 brittle cedar
can i ask my question here? actually i m new so dont know ..where to ask
twin moth
We're trying to find out whether it's possible to guess someones age and gender from an image
We have a dataset of about 24K pics with age, gender and nationality
We use OpenCV in order to analyze faces and get 68 points from each
Then try to find correlations between details, mostly regarding the spacing between eyes etc.
 chilly geyser
errant rivet
One quick question... The result column is always the value in the array with th...
chilly geyser
errant rivet
One quick question... The result column is always the value in the array with th...
This is the most common way of assigning values. Technically you could re-do a simulation on your probabilities
I.e. if you get scores that correspond to 90% 10%, you would roll a uniform random variable and assign one value 90% of the time and the other 10% of the time
twin moth
Never used it but you could try multithreading
errant rivet
@hallow harness Sorry for the delay, this should do the trick!
input_c['New Probability'] = input_c['Probability'].apply(max)
Thank you! It works ❤️
steady wigeon
Can tweepy captured tweets that is not truncated? I was assigned to collect tweets which is not truncated or "truncated"=false.
i try to use
def on_status(self, status):
with open('truncFalsetweet.txt','a') as tf:
if not status.truncated:
tf.write(status)
print(status)
else:
None
return True
but it returns error: TypeError: write() argument must be str, not Status
so i change to
def on_data(self, data):
#ques 3.2: only collect data when truncated=false
with open('truncFalsetweet.txt','a') as tf:
if not status.truncated:
tf.write(status)
print(status)
else:
None
print(data)
return True
and my prompt send me this error. AttributeError: 'str' object has no attribute 'truncated'.
this is the example of data that i get if there is no condition.
{"created_at":"Fri Jan 15 03:15:54 +0000 2021",......,"truncated":false,.....}
{"created_at":"Fri Jan 15 03:15:54 +0000 2021",.....,"truncated":true, ......}
errant rivet
@twin moth I don't understand why it's more reasonable to have it in one column. What are the two values in the tuple representing? The x, y position of the pixel?
twin moth
errant rivet
<@!191683640118214656> I don't understand why it's more reasonable to have it in...
Exactly
hallow harness
@errant rivet one more thing... is it possible to do math using the json values?
i tried doing
proba_test = proba*100
but it only request proba 100 more times
twin moth
P.S. the dataframe has 68 columns - all are tuples.
If we decide to convert the tuples to xs and ys we'd have 136 columns
And we'd need to somehow specify that each of those are a pair
So the model will know how to use them both together
twin moth
chilly geyser
But would not recommend py `tuple`
How come?
chilly geyser
And yes that means I do think it's better to be 136
twin moth
chilly geyser
And yes that means I do think it's better to be 136
Would we need to instruct SKLearn to view them as pairs though?
chilly geyser
Because py tuples aren't very common, and for others to interact with your thing (especially when it comes to non-python) it'd be hard
chilly geyser
twin moth
Would we need to instruct SKLearn to view them as pairs though?
For this I'm not too sure
You know the np general builtin types right? Like float32 and so on
twin moth
I guess
chilly geyser
Those would be 'fast' and also easy to work with for other programs, because the datatype is common
twin moth
I also write C and other langs so sure
twin moth
chilly geyser
Those would be 'fast' and also easy to work with for other programs, because the...
Makes sense
chilly geyser
Well if you are doing this level of analysis only in py it doesn't matter I guess
But I'm sure there's a way for it to be stored fully as np-nice datatypes
and have it talk nicely
errant rivet
@hallow harness ```python
proba_test = [i*100 for i in proba]
While I do understand the mindset we don't really need it here since it's just a project that we won't be integrating to anything
twin moth
chilly geyser
But I'm sure there's a way for it to be stored fully as np-nice datatypes
Do you think that there are downsides to using Pandas dataframes though?
chilly geyser
That's a question too hard for me to answer haha
errant rivet
@twin moth I don't think the machine learning algorithm will know/care. It will find its own associations. It won't be upset that you didn't represent pixels in a tuple value. It has no idea these numbers represent pixels in the first place.
chilly geyser
But I have seen online comments where basically if it's not stored as some dtype numpy recognises, it's not advisable
steady wigeon
i got this error
UnicodeEncodeError: 'charmap' codec can't encode character '\u2728' in position 251: character maps to <undefined>
chilly geyser
Essentially if it's dtype=object then it's a Py-based object
twin moth
errant rivet
<@!191683640118214656> I don't think the machine learning algorithm will know/ca...
So basically double up the amount of columns and let it rip?
chilly geyser
errant rivet
<@!191683640118214656> I don't think the machine learning algorithm will know/ca...
Yeah it's a coding thing more than anything
errant rivet
It really won't matter, you can name the columns whatever human-readable thing you need to keep them straight. It's still the same amount of data whether the numbers are in tuples or exploded into their own columns
chilly geyser
errant rivet
It really won't matter, you can name the columns whatever human-readable thing y...
Computationally unlikely, because I would assume that a py-base object has more bells and whistles than raw numerics
As in you would get the same result mathematically/with software designed to read tuples
errant rivet
Yeah, so why go through all the additional trouble?
chilly geyser
But I would think it's faster with double the columns, where columns have fixed datatypes
Because fixed datatypes are machine friendly
errant rivet
Yeah, we're in agreement here 😛
chilly geyser
Well tbh, pointless with <100k rows
More important once you handle >100k rows, where every single bit of speed is like anything from minutes to hours
errant rivet
There might be some sort of feature engineering you could do to condense the x, y tuples into a single value to use in your model. Not sure personally what it would be
chilly geyser
errant rivet
There might be some sort of feature engineering you could do to condense the x, ...
If you're looking at this it's probably some (optimality-unknown) non-linear function of x,y. I wouldn't recommend it
hallow harness
errant rivet
<@!286452183380131840> ```python
proba_test = [i*100 for i in proba]
```
Got it! Thank you for helping bro! 😄
errant rivet
@hallow harness No worries, best of luck!
chilly geyser
in general I don't recommend anything that isn't simple unless you are prepared to accept black boxes, like dense neural nets with number of layers >2
errant rivet
I really don't even understand what he's trying to do
68 columns of coordinates?
Predicting age?
chilly geyser
the coordinates are probably images
 hushed wasp
Can anyone help me please, telling me why only the last part of the code raises an error and not the top part?
Thanks 🙂
chilly geyser
wait actually IDK lool
chilly geyser
hushed wasp
Can anyone help me please, telling me why only the last part of the code raises ...
Did you run anything on 122, 123 that erased Segment?
hushed wasp
nope just the following...
errant rivet
Could you just rerun all three in order to make sure?
twin moth
errant rivet
68 columns of coordinates?
Sorry, guess I wasn't clear.
We have a dataset of 24K images faces.
Each of those vary in age, gender, and nationality
We have all of those details attached to each image so we can train the algorithm using it
chilly geyser
Why would datatypes be paired thoough
if you have 68 specific special pixels in 2D space then it'd make sense
twin moth
Then we go over all of the images with OpenCV, trying to fetch all the face structure and insert all of the details we found (68 points) in to a Pandas dataframe
chilly geyser
But I wouldln't know of how storing just 68 specific special pixels could tell you anything
errant rivet
Yeah but then the values he'll be representing won't actually be the pixels, it will be whatever is stored at that pixel e.g. color value?
So just the column names would be tuples
twin moth
It might be able to tell us if for example there's a correlation between the age and the distance between the eyes
Or maybe the size of the eyes
errant rivet
Ah, so you want a distance metric between pixels?
twin moth
errant rivet
Ah, so you want a distance metric between pixels?
Basically
errant rivet
But that's always the same... hmm
twin moth
That's why we save the coordinates
hushed wasp
Ok so now, even the first part doesn"t work 😦
chilly geyser
hushed wasp
Ok so now, even the first part doesn"t work 😦
You likely redefined df_rm_segmentation
errant rivet
@hushed wasp Just try to restart your notebook and run all
If there's an error earlier, you can catch where it breaks down 🙂
hushed wasp
errant rivet
<@697072102431522826> Just try to restart your notebook and run all
just rerun all the cells above and error raises at the top of my code i showed you now
chilly geyser
twin moth
It might be able to tell us if for example there's a correlation between the age...
Ah so the coordinates are coordinates of eye features?
twin moth
chilly geyser
Ah so the coordinates are coordinates of eye features?
Sec, I'll send you the placements of the points
chilly geyser
TBH it seems odd you would even have this kind of data
hushed wasp
chilly geyser
I thought image data would be rawer....like jpg-raw
errant rivet
Ahhhh, wow... I* thought you were working with raw images just labeled by age, nationality, etc.
chilly geyser
twin moth
This is 1 data point yes?
Not fixed across all faces?
This means you had people label 68 points for 24K images, that's a lot of data, that's amazing
Either that or a prior algorithm found those ridges of faces
That's amazing * amazing
chilly geyser
hushed wasp
Earlier what did you do to add Segment as an attribute of the df_rfm_segmentation objects?
twin moth
chilly geyser
This is 1 data point yes?
That's a single face out of 24K, yes
hushed wasp
chilly geyser
Earlier what did you do to add Segment as an attribute of the `df_rfm_segmentati...
nothing, I am trying something i found on the web but you are making me realize it should not work without segment being defined before
errant rivet
is #22 always the right-most edge of the left eyebrow?
twin moth
Yup
hushed wasp
chilly geyser
Earlier what did you do to add Segment as an attribute of the `df_rfm_segmentati...
Sorry I am not very good a at coding and not good in explaining as well I guess
chilly geyser
hushed wasp
nothing, I am trying something i found on the web but you are making me realize ...
Well at least now you know the issue
chilly geyser
hushed wasp
Sorry I am not very good a at coding and not good in explaining as well I guess
Everyone is always learning
chilly geyser
twin moth
Yup
How do you handle image scales though... like big face, small face, etc
if the dataset is all same-scale a la same-distance-from-camera I wonder if that's a hard engineering constraint that would prevent usefulness in reality
errant rivet
@twin moth Maybe you could add a new feature that measures the distance between all points, such as 22 and 23 (eyebrows), then perform some sort of dimensionality reduction to discover which features account for the highest variance
twin moth
chilly geyser
How do you handle image scales though... like big face, small face, etc
Lol, just sent a message about it to my friend who's working on it
I guess you could scale them
chilly geyser
Sounds interesting at least
lapis sequoia
Is there an R equivalent discord?
twin moth
lapis sequoia
Is there an R equivalent discord?
I'd check if they have a subreddit, and if so check the sidebar
Or past messages
chilly geyser
lapis sequoia
Is there an R equivalent discord?
There is a discord for R lang, but it is a lot smaller than this Py discord
lapis sequoia
I'll have a quick look lads, cheers
twin moth
chilly geyser
There is a discord for R lang, but it is a lot smaller than this Py discord
Are you really surprised? 😛
chilly geyser
Nope, Py is really popular
lapis sequoia
I'm baffled, more love for R
chilly geyser
I don't see how status is defined
hushed wasp
chilly geyser
Well at least now you know the issue
I have an other error now...
Thanks for the help I gonna try to figure out why it worked and why it doesn't now..
chilly geyser
IMO Julia is a lot less friendly to new coders
lapis sequoia
Bioinformaticians
chilly geyser
lapis sequoia
Do we have any Bioinformatians here
Not sure, when I pop in this discord, there's varying levels of mathematical maturity
I think big names don't lurk here though, as usual
Discord isn't a 'big name' thing haha
 mint palm
i am new in the course of deep learning and last week i wrote about 150 lines to implement logis regression
chilly geyser
It fits a logreg classifier onto the dataset
mint palm
how is it doing all that in one line lol
chilly geyser
Because someone else wrote it
To do so
Essentially it solves the logreg optimization problem
Find some coefficients beta to minimize loss on some P(Y=1) and P(Y=0) as a function of exp(X)
mint palm
so i am right thinking that "there is actually this function to do logistic regression like problem in one step like this"
mint palm
wow great function right here then
chilly geyser
Well the thing is someone else wrote it for you, but can you verify it does what it claims to do?
mint palm
concept building i guess
steady wigeon
chilly geyser
I don't see how `status` is defined
when there is no if- condition, i used this and it successful retrieved
def on_data(self, data):
with open('data/tweet.txt','a') as tf:
tf.write(data)
print(data)
return True
so for if the tweet is not truncated, i modify them into this
def on_data(self, data):
#ques 3.2: only collect data when truncated=false
with open('truncFalsetweet.txt','a') as tf:
if not data.truncated:
tf.write(data)
print(data)
else:
None
print(data)
return True
chilly geyser
Yup essentially
I don't see how data is an object with a truncated attribute but ok.....
steady wigeon
chilly geyser
I don't see how `data` is an object with a `truncated` attribute but ok.....
i did some research before, if i want to use entities in the tweet, must use def on_status. so i come out with
def on_status(self, status):
with open('truncFalsetweet.txt','a') as tf:
if not status.truncated:
tf.write(status)
print(status)
else:
None
return True
but still get error
mint palm
i also wanna ask that like in logistic regression we got optimised variable at last(for prediction), would i be able to see those using this function as well?
chilly geyser
mint palm
i also wanna ask that like in logistic regression we got optimised variable at l...
You mean beta? Yes I'm pretty sure the coefficients can be retrieved
errant rivet
In sklearn, you can get them for each feature via LogisticRegression.fit(X, y).coef_
mint palm
chilly geyser
You mean beta? Yes I'm pretty sure the coefficients can be retrieved
in my course the goal of logreg(as told by instructor) is to compute a function Y = WX + B so that Y is the chance that X is 0 or 1..................so i wanna retrieve W and B
errant rivet
yeah and great enough, sklearn's LogisticRegression class has a .intercept_ variable too
chilly geyser
oo ok
mint palm
w is weight and b is bias.............both are parameter instructor said
errant rivet
Other names for a coefficient and intercept
 weak sentinel
does anyone remember the name of that app that allows you to track the progress of your ML training remotely
woeful hamlet
Hi guys. I am using colab to train a model, but my image set exceeds the RAM limit from it. So do u know anyway i can use half of the images on a first run, and after that train use the left half?
lapis sequoia
Hey guys just a question about data science
Does anyone know which framework for building a site and displaying live plots from matplotlib or other guis and libraries
Because I've seen streamlit and its seem to be pretty nice but I don't know if there's other effective ones like django seems to be to much work rn
Just any recommendations would be nice thanks
hushed wasp
Can someone help me to be able to execute this part of code please?
 thin remnant
Made a multi variable regression model which predicts sale prices
the Error functions look redonculous
anyone an idea what is going wrong / what im not understanding about these numbers xd
woeful hamlet
Hi guys. I am using colab to train a model, but my image set exceeds the RAM limit from it. So do u know anyway i can use half of the images on a first run, and after that train use the left half?
 serene scaffold
woeful hamlet
Hi guys. I am using colab to train a model, but my image set exceeds the RAM lim...
serene scaffold
woeful hamlet
Hi guys. I am using colab to train a model, but my image set exceeds the RAM lim...
what kind of model?
 fleet heath
thin remnant
fleet heath
thin remnant
Since eval is a keyword in python, try naming your variable something else, so as to not cause any confusion for the compiler
lapis sequoia
Does anybody know why it takes forever to execute?
it's stuck on executing...
without showing any error
nvm I got that
main quest
https://ghostbin.co/paste/yj6q7
my code seems to hang while trying to calculate min and max. the intended result is to create a range of dates to use as xticks but with multiple plots in a loop that do not have necessarily the same size. how could i fix this, or is there a better approach to my desired effect?
lapis sequoia
Hey I got a csv file which I'm using to plot some data with matplotlib (I'm quite new to it.)
Here is my code :
import matplotlib.pyplot as plt
import csv
import datetime


usercount = []
time = []

with open('stats.csv') as csv_file:
    csv_reader = csv.reader(csv_file, delimiter=',')

    for row in csv_reader:
        usercount.append(int(row[1]))
        time.append(datetime.datetime.utcfromtimestamp(int(row[0])))

    print("Finished loading csv file.")

plt.xlabel('time')
plt.ylabel('users')
plt.title('mmobot users over time')
plt.plot(time, usercount)
plt.show()
But the time displays badly, how can I rotate it on the x axis ?
as you can see we can't see the dates properly and I would like to rotate them vertically or at a nice angle, but I can't figure out how to do it
main quest
lapis sequoia
as you can see we can't see the dates properly and I would like to rotate them v...
you can rotate them with xticks
plt.xticks(rotation=angle)```

angle is in degreesThanks ! It works fine but I can't see the dates either this way :
Is there a way I could expand the size of the window by code ?
main quest
what are you using to make the window?
main quest
does this help?
https://stackoverflow.com/questions/28575192/how-do-i-set-the-matplotlib-window-size-for-the-macosx-backend?rq=1
Stack Overflow
I have a python plotting function that creates a grid of matplotlib subplots and I want the size of the window the plots are drawn in to depend on the size of the subplot grid. For example, if the
lapis sequoia
Oh yeah thanks a lot !
I could have find it by myself I guess, sorry for wasting your time
main quest
np
 frank acorn
How should I approach this problem statement:
We have a set of bedroom images with a standard bed and two pillows.
Input: Bedsheet cloth patterns.
The goal
- To overlap the bedsheet pattern on the entire standard bed image. Bedsheet should be shown
as neatly wrapped up with the bed with the corners properly tucked in. - To overlap the bedsheet pattern on the two pillows placed on the bed.
Sample images are shown on the next page. Training data can be downloaded by scraping
images from the following URL - https://www.myntra.com/bedsheets

Myntra
Buy bed sheets online at Myntra. Choose from the vast collection of linen, cotton bed sheets in India at best rates. ✯ Free Shipping ✯ COD ✯ 30 Day Returns
 quiet patio
Hey everyone I ve a matrix of distances and i want to generate a list of coordinates (x, y) i tried Mij=(D[1][j]**2+D[i][1]**2−D[i][j])**2/2.
and i want to know S and W with M=U S U**T
and X = U * sqrt(S)
main quest
how would i make it plot dots to 0 in dates where there is no data? this is coming from a pandas dataframe, unsure of what to google to get an answer
 subtle tundra

In this article, we will build a CNN (Convolutional Neural Networks) model and aim to achieve 95% accuracy in Python.
twin moth
Heya guys
I noticed that when I append a lot (~55M) dictionaries into a Pandas DF each and every append gets slower
Any idea how to optimize it?
I can try to create 240~ DFs and append each of them to the main DF if it helps
hollow void
velvet thorn
IMO there isn't enough of a difference in that case to matter
Bit of a late followup, but are there any major difference in ease of setup if one is using AMD GPU and ROCm?
(Tensorflow vs PyTorch debate)
twin moth
It started by taking about ~0.0009489059448242188 seconds for each append.
After about 1.5M appends, each append now takes ~0.0035037994384765625 seconds
 hard hound
Hey does anyone know any site like kaggle?
mortal trout
can someone tell me if the model is overfitting or not can someone tell if its overfitting loss: 0.0151 - accuracy: 0.9925 - val_loss: 0.1158 - val_accuracy: 0.9923
lapis sequoia
Which channel can I use to ask a non-python question?
 molten hamlet
can I simply find boxes with equal numbers? 🤔
I tried scipy.signal.correlate but...
 odd lion
mortal trout
can someone tell me if the model is overfitting or not can someone tell if its o...
odd lion
mortal trout
can someone tell me if the model is overfitting or not can someone tell if its o...
What are the proportions of your classes?
steady wigeon
hello, I try to save tweet_text from .txt into csv file, which is collected using tweepy. Before this, i only take the string from “text” using this code and it is successful retrieve .
for i in range(len(tweets_data)):
        tweet_text=tweets_data[i]['text']
        idstr = tweets_data[i]['id_str']
        idarr.append(idstr)
        tweetarr.append(tweet_text)
But when I start to make the preprocessing for sentiment analysis,I realized that the “text” i took , some of them are truncated. the full text for the truncated is at {......,"extended_tweet":"full_text":"...."..} so, I come with this code to filter if there is extended_tweet, the tweet_text will take string from full_text, else tweet_text take string from text.
for i in range(len(tweets_data)):
        '''
        example of data:
        https://gist.github.com/igorbrigadir/614625e27fe400f86fdf29bdd0c1857f
        '''
        if ('extended_tweet' in tweets_data[i]):
            tweet_text=tweets_data[i]['extended_tweet']['full_text']
        else:
            tweet_text=tweets_data[i]['text']

        idstr = tweets_data[i]['id_str']
        idarr.append(idstr)
        tweetarr.append(tweet_text)
but the tweet_text still take the string from “text” even though there is "extended_tweet".
 proven plinth
Does anyone here do bioinformatics? And if so, do you have any resources apart from rosalind.info
lapis sequoia
write a test @steady wigeon
and you dont have to iterate over indices in python
and is it really ideal to save id's and texts in different list?
 plain parrot
Hi Guys, if any one has experience with SIR modelling of pandeming, could you please DM me, just got a couple of simple questions, thank you
woeful hamlet
serene scaffold
what kind of model?
aaaaah does it matter? i mean, it is a convolutional neural network
serene scaffold
woeful hamlet
aaaaah does it matter? i mean, it is a convolutional neural network
It might be that you only have to pass one training instance through the network at a time
woeful hamlet
wdym?
velvet thorn
It started by taking about ~
0.0009489059448242188seconds for each append.
After about 1.5M appends, each append now takes ~0.0035037994384765625seconds
@twin moth each append creates a new object. don’t append, concatenate.
woeful hamlet
@serene scaffold
serene scaffold
@woeful hamlet depending on how the network is designed, it might be that only one training instance has to be in memory at a time. So you could load the training instances into memory in batches. If the network might need to look at multiple instances for one operation, I'd have to know more about why that is.
woeful hamlet
why? how "why"?
serene scaffold
@woeful hamlet I'd need to know what kind of neural network you're using and what it's meant to do.
serene scaffold
@woeful hamlet so it's a cnn. And what does it do?
woeful hamlet
predict classes
serene scaffold
What classes
woeful hamlet
why does it matter?
serene scaffold
Because there might be a reason that it does and I can't rule that out without knowing what it's for.
woeful hamlet
??? do u know whats my issue?
velvet thorn
woeful hamlet
why does it matter?
...more pertinently, why aren't you willing to divulge that information?
woeful hamlet
cuz top secret (¿)
cuz i dont see the relation between type of classes and RAM usage from colab xd
velvet thorn
woeful hamlet
cuz i dont see the relation between type of classes and RAM usage from colab xd
okay then
I mean, if you wanna get help + gatekeep simultaneously...
woeful hamlet
i mean, u could explain why the classes matter xd
velvet thorn
ye
and you could stop being passive aggressive
anyway, the classes in an abstract sense might not matter
but, for example, there are networks which train based on some difference metric between input
so batch size is, minimally, the number of images being compared
in your case, however...
...you sound like you're loading all the images eagerly
so some sort of lazy loading would be a good start
woeful hamlet
same set as Imagenet from keras.datasets
Like, i really dont see how the info u are asking will help. My question was if i could load like half of my data set, train with that, and then load the rest, and train again
velvet thorn
mortal trout
can someone tell me if the model is overfitting or not can someone tell if its o...
show recall/precision/f1 score and confusion matrix
but such high accuracy is generally a bit weird
velvet thorn
woeful hamlet
Like, i really dont see how the info u are asking will help. My question was if ...
yes
velvet thorn
lapis sequoia
Which channel can I use to ask a non-python question?
there are off-topic channels
velvet thorn
hollow void
Bit of a late followup, but are there any major difference in ease of setup if o...
hm. I'm not experienced enough in DL with AMD GPUs to be able to tell
woeful hamlet
okey. what i am trying is called fine tuning?
velvet thorn
but I don't think so?
velvet thorn
woeful hamlet
okey. what i am trying is called fine tuning?
no.
finetuning has multiple meanings, but the most relevant one, I'd think, is in further training only the upper layers of a pretrained model
serene scaffold
!code
arctic wedgeBOT
Here's how to format Python code on Discord:
```py
print('Hello world!')
```
These are backticks, not quotes. Check this out if you can't find the backtick key.
woeful hamlet
velvet thorn
finetuning has multiple meanings, but the most relevant one, I'd think, is in fu...
ah so like adding 1 ore 2 layers to learn from the already trained weights for ur dataset?
velvet thorn
woeful hamlet
ah so like adding 1 ore 2 layers to learn from the already trained weights for u...
no
you don't add layers
you freeze the lower ones
well, you can add layers
depends on your problem
woeful hamlet
the first layers know about edges?
velvet thorn
minimally you'd probably change the topmost layer if, for example, you were doing classification and wanted to change the number of classes
velvet thorn
woeful hamlet
the first layers _know_ about edges?
loosely speaking, kind of?
woeful hamlet
ok ok
velvet thorn
more generally, patterns in the image at a lower level of abstraction
woeful hamlet
so u freeze liek half and let the other half fit ur dataset?
velvet thorn
not necessarily half
but
I don't really see how that's relevant to your problem
🥴
woeful hamlet
just to know terms
velvet thorn
top secret xd
woeful hamlet
in case i have to google for them
hushed wasp
serene scaffold
!code
didn't I use the ` correctly?
velvet thorn
hushed wasp
didn't I use the ` correctly?
you were missing syntax highlighting
x = 3
print(f'x is {x}')
x = 3
print(f'x is {x}')
top is without, bottom is with
serene scaffold
@velvet thorn the only used one backtick rather than three
hushed wasp
velvet thorn
you were missing syntax highlighting
I don't even find how to highlight... sorry 😦
velvet thorn
hushed wasp
I don't even find how to highlight... sorry 😦
dw about it just use !code
hushed wasp
velvet thorn
dw about it just use !code
ok understood thx
velvet thorn
hushed wasp
ok understood thx
yup that looks good
hushed wasp
dico = { 'order_id': 'count', 'price' : 'sum', 'review_score' : 'mean', 'payment_type': lambda x: pd.Series.mode(x)[0], 'payment_installments' : 'mean', 'product_category_name_english': lambda x: pd.Series.mode(x)[0], 'customer_state' : lambda x: pd.Series.mode(x)[0],  'delivery_status' : lambda x: pd.Series.mode(x)[0], 'day_of_week' : lambda x: pd.Series.mode(x)[0], 'period' : lambda x: pd.Series.mode(x)[0]}
customers = df_part_of_day.groupby('customer_unique_id',as_index=False).agg(dico)
Can I make my code shorter by "grouping" my lambda x: pd.Series.mode(x)[0]
velvet thorn
hm.
@hushed wasp how about df_part_of_day[['customer_unique_id', 'payment_type', 'product_category_name_english', 'customer_state', 'delivery_status', 'day_of_week', 'period']].groupby('customer_unique_id').agg(lambda x: x.mode()[0])?
then combine it with the rest
hushed wasp
ok gonna try thks @velvet thorn
woeful hamlet
ive read docs but i dont know the difference between image_dataset_from_directory and flow_from_directory
is the second one the same as the first one but doing data augmentation as well?
mortal trout
@velvet thorn it was because the dataset was imbalance
velvet thorn
@velvet thorn it was because the dataset was imbalance
@mortal trout ye that’s why I asked about other stats
mortal trout
@velvet thorn will tensorflow work on gif images because they mentioned only a few extensions like jpg,png,bmp etc
lapis sequoia
guys im getting value error while fitting my randomforestregressor
i split it into training and testing data
tried both manually and through train_test_split
but it shows the error that input variables are not the same
how to deal with this?
mellow pumice
Have you tried reshaping? Sure if the data is of required shape. If so then do check the data set and the way you're assigning them.
Putting up the code might help to point out the thing causing problem more precisely.
@ShadowRanger5#3348
mellow pumice
mortal trout
<@!171929073063297024> will tensorflow work on gif images because they mentioned...
Gif are just a collection of images, so decode them after reading and store those shards. If the decoding goes well I can't see why tf will not work on it.
I might be a bit off on the shards part so make sure to check it online.
As for gif being diretly used in tf, hmm... , I seriously doubt that it'll work. Encodings are PITA sometimes... 😥
mortal trout
@mellow pumice thanks for the info
subtle tundra
In this article, we will build a CNN (Convolutional Neural Networks) model and aim to achieve 95% accuracy in Python.
lapis sequoia
i have 2 columns with float data in pandas with same value, on doing difference between 2 column i get a difference of 1, although both values are same
how to fix this ?
velvet thorn
lapis sequoia
i have 2 columns with float data in pandas with same value, on doing difference ...
show code
twin moth
velvet thorn
> It started by taking about ~`0.0009489059448242188` seconds for each append.
>...
That's exactly what I ended up doing, thanks 🙂
lapis sequoia
velvet thorn
show code
df['diff'] = df['a'].astype(int) - df['b'].astype(int)
fleet heath
@lapis sequoia can you show some sample values of a and b?
lapis sequoia
@fleet heath @velvet thorn
a = exchTrade, b =Trade
fleet heath
lapis sequoia
df['diff'] = df['a'].astype(int) - df['b'].astype(int)
And can you show your actual code snippet instead of a and b?
Because from this row, it seems like you are taking the difference between the int columns
Which is 1
lapis sequoia
@fleet heath
lapis sequoia
btw i am using python2 and pandas 0.19
hollow scarab
is it possible to concat 2 dfs into on, and only selecting a few columns from each?
or I would have to concat and then create a new df with the colums i want?
fleet heath
lapis sequoia
<@!700590266658193476>
@hollow scarab see the first line
That should give you an idea about how to approach your problem
And as far as @lapis sequoia is concerned, i don't see any issue with the code
You might wanna check the version specific details for your code
lapis sequoia
Thanks for checking this out @fleet heath i'll see if it is some bug or version issue
 winged jasper
Hello guys, I have recently started learning RASA, but it's been upgraded to 2.0 and I have found no single course that would cover developing, testing and deploying a chatbot/assistant using that framework. Does anybody have any resources on that? Or should I start with rasa 1.8 and later migrate to 2.2 when I've learned the concepts?
lapis sequoia
fleet heath
And as far as <@456226577798135808> is concerned, i don't see any issue with the...
also that thing happen sometimes with different dataset same column values, not always
fleet heath
!e
import pandas as pd
df = pd.DataFrame({'a' : [-2100078.0, 2.34], 'b' : [-2100078.0, 2.34]})
df['diff'] = df['a'].astype(int) - df['b'].astype(int)
print(df)
You are not allowed to use that command here. Please use the #bot-commands channel instead.
hollow scarab
thanks, I will try it with merge @fleet heath
fleet heath
fleet heath
!e
```py
import pandas as pd
df = pd.DataFrame({'a' : [-2100078.0, 2.34], 'b' : ...
@lapis sequoia what is the output of this?
lapis sequoia
fleet heath
<@456226577798135808> what is the output of this?
will try, and let u know👍
molten hamlet
how can I extract numbers from image? 🤔
 knotty bay
Machine Learning
 devout zodiac
Hi, I'm working with a (non-medical) CT dataset and have some fundamental question about it, mostly regarding processing and resolution. If anyone has experience with that, please dm me!
hollow void
Is licence plates detection going to be the best using deep learning? Compared to simple image operations, EAST and haar cascades?
woeful hamlet
I am training a model on colab, but i cant load all my data set at once due to RAM limit. How can i load it on 2 parts to train the model?
 hard canopy
Hi, i am trying to train a NN fort the MNIST dataset using pytorch. Basically, I am trying to replicate https://www.tensorflow.org/tutorials/quickstart/beginner with pytorch.
This is what I got: https://gist.github.com/luc-leonard/bf395ed87063941502030ec22e1ead89
It seems to be working, but my output seems weird... with TF I have probabilities between 0 and 1. Here I have negative values, and the result seems to be the 0.0 value in the output.
Did I do something wrong ?



 molten hamlet
knotty bay
Machine Learning
molten hamlet
knotty bay
Machine Learning
😐
hard canopy
it's not that hard to train a neural network to read numbers
molten hamlet
there should be some simple models for it
abstract zealot
guys, methods for estimating mean and variance apart from using maximum likelihood?
or different methods to calculate mean and variance using max likelihood?
hard canopy

Cross Validated
I must clarify immediately that I am a practicing software developer, not a statistician, and that my college stats class was a very long time ago…
That said, I would like to know if there is a me...
lapis sequoia
hello ian new here anyone know something about ant colony optimazasion?
lapis sequoia
fleet heath
<@456226577798135808> what is the output of this?
Can I loop through rows in a dataframe and split the data into other dataframes based on the value in a specific column?
Eg, I have one column of Events, there are 4 types of event and I want to create a new df for each event type
Just figured that out actually. I didn't realize you can grab a column and split based on value using df[df['col_name']=='value_i_want']
Cool stuff 😁
abstract zealot
you can also use .loc i think @lapis sequoia
 austere latch
were you to assign a DataFrame object as a subset using df[df['col_name']=='value_i_want'] would this be a new object or continue referencing the original?
dont know if .copy() would be prudent in this case
arctic wedgeBOT
Hey @wintry nacelle!
It looks like you tried to attach file type(s) that we do not allow (.ipynb). We currently allow the following file types: .3gp, .3g2, .avi, .bmp, .gif, .h264, .jpg, .jpeg, .mkv, .mov, .mp4, .mpeg, .mpg, .png, .tiff, .wmv, .psd, .ai, .aep, .xcf, .mp3, .wav, .ogg, .webm, .webp, .flac, .afdesign, .m4a, .csv.
Feel free to ask in #community-meta if you think this is a mistake.
 wintry nacelle
gdmit .ipynb are jupyter notebook files...
Anyway
I'm trying to learn cGANs and my current implementation is not working. The functions all work without raising errors, including the training loop. However, the generator does not seem to be learning anything. Oddly enough, the loss values do change over time (thanks tf.print), albeit slowly.
I would like to mention that this was hacked together using code from the tensorflow official website and machinelearningmastery. I'm still learning at this stage, so I suppose it's fine.
Also that file is meant to be an .ipynb but because this discord doesn't allow attaching .ipynb files I have to make do
Also I'm using tensorflow-gpu 2.4.0. I have put together a VAE and DCGAN before so I know my installation of tensorflow is fine
 thick sphinx
molten hamlet
I just need rewards ;/
thick sphinx
molten hamlet
I just need rewards ;/
unless you build the game yourself, extracting the rewards from just reading the screen like this will be a difficult task in itself
 dapper hatch
I'm practicing with Pandas and I need to make a group of 10 cases from a dataset
someone who knows Pandas and can help me
 gleaming gull
Do you need a subset of 10 random rows? or rows that fulfill a condition? or manually select 10 rows?
arctic wedgeBOT
Hey @gleaming gull!
It looks like you tried to attach a Python file - please use a code-pasting service such as https://paste.pythondiscord.com
 vague vector
I am from iOS native development background, switching towards Data Science and ML/DL. I've started my Masters and I have to choose 3 optional courses out of 5. The options I have are:
1- Data Visualisation and Dash-boarding,
2- Business Optimisation,
3- Simulation
4- Web Analytics
5- Data Warehousing.
Which one is better for becoming a Data Scientist. I have attached the course contents of these 5 course.
Regards
1- Data Visualisation and Dash-boarding
2- Business Optimisation
3- Simulation Modeling
4- Web Analytics
5- Data Warehousing
ripe forge
None of these. I assume you have some other core ds subjects, because these all would be supplementary to it
If you do have core ds subjects besides these, then I'd say pick based on which ones interest you most here
If I had to pick 3 for ds, I would have picked 1, 3, 4. But this is subjective.
vague vector
Yes I have core subjects of DS. Im trying to choose the best optional ones for my career in Data Science.
hard hound
Hey has anyone used logistic regression model here?
Should i use it for my classification model i am confused
ripe forge
Yes, you can use logistic regression for classification
lapis sequoia
I have a question
for learners, as long as the code works as intended, no matter how obfuscated or inefficient it is coded, it doesn't mater
for example
It works as intended but I'm kind of worried
 eager heath
lapis sequoia
for learners, as long as the code works as intended, no matter how obfuscated or...
eager heath
lapis sequoia
for learners, as long as the code works as intended, no matter how obfuscated or...
I disagree, writing readable and efficient code is an important skill to learn
 granite narwhal
Hi Donna, I can help you out in what you need. Please let me know if we can discuss. I can help you out in any ML, AI, data science and python development work.
lapis sequoia
eager heath
I disagree, writing readable and efficient code is an important skill to learn
how do I learn to write an efficient code
and I forgot to put a question mark on that
eager heath
Usually trough practice, and reading code or having your code being judged
lapis sequoia
Could you judge my code
eager heath
For the last two, participating to open source projects is a good idea
lapis sequoia
Any input is highly appreciated
eager heath
Hmm... I don’t know this library (is that pandas?) but I can give you feedback on the rest of the code
lapis sequoia
yes it is pandas
eager heath
One of the first thing I notice is that your fucntion are in camelCase, shich is against PEP8
lapis sequoia
uhm I'm literally a beginner for everything, so I don't understand what camelCase or PEP8 is
arctic wedgeBOT
PEP 8 is the official style guide for Python. It includes comprehensive guidelines for code formatting, variable naming, and making your code easy to read. Professional Python developers are usually required to follow the guidelines, and will often use code-linters like flake8 to verify that the code they're writing complies with the style guide.
You can find the PEP 8 document here.
eager heath
This document defines the code style recommended when coding in Python
For example, function names are usually written with underscores in them, like def my_function_name
lapis sequoia
oh
eager heath
Also adding some blank lines in your code could help
appart from that, it looks pretty good
lapis sequoia
so like corr_data_frame rather than corrDataFrame
nice, thanks man
glad it looks at least okay
eager heath
lapis sequoia
so like corr_data_frame rather than corrDataFrame
Yep!
arctic wedgeBOT
:incoming_envelope: :ok_hand: applied mute to @broken crater until 2021-01-19 13:07 (9 minutes and 58 seconds) (reason: duplicates rule: sent 4 duplicated messages in 10s).
red briar
lapis sequoia
uhm I'm literally a beginner for everything, so I don't understand what camelCas...
hello, do you mind sharing the source you used in studying on visualization/plotting graph. im trying to study this area.
lapis sequoia
red briar
hello, do you mind sharing the source you used in studying on visualization/plot...
the whole source I wrote?
ohhh
nvm you meant the raw data

Daily average temperature values recorded in major cities of the world
red briar
thanks!
lapis sequoia
you're welcome 🙂
 old meteor
Any idea why suddenly this plotting code just gets stuck and not showing?
 slender notch
@lapis sequoia ekans?
dapper hatch
gleaming gull
Do you need a subset of 10 random rows? or rows that fulfill a condition? or man...
thanks for the answer
I have to set up those groups for a condition
 azure leaf
does anyone know what this for loop means
for tag, topic_df_en in
i dont get why there is a comma
i only ever seen one word then in
for x in y
never seen for x,y in z
i dont get it
slender notch
Yea
 pulsar jetty
Can someone help me here with OpenCV?
hollow scarab
if I created a df combining 2 other dfs
and like both dfs have the same column names
is there any way i can differentiate between them?
dapper hatch
Can I upload an example in xlsx directly here?
lapis sequoia
hollow scarab
if I created a df combining 2 other dfs
check the columns while combining to avoid this issue
df.columns
add a suffix like xyz_df1 and xyz_df2 to avoid the problem
hollow scarab
is it a pd.concate function the columns? or should i rename the column names before concat? @lapis sequoia
 bright meadow
How would I update a certain int value by 1 in sqlite?
 burnt prawn
Meta Kaggle / Kaggle Global outreach analysis
https://www.kaggle.com/neomatrix369/kaggle-global-outreach-analysis/

Explore and run machine learning code with Kaggle Notebooks | Using data from multiple data sources
lapis sequoia
hollow scarab
is it a pd.concate function the columns? or should i rename the column names bef...
change the name before concatenating
create a function to take care of those cases.
red briar
bright meadow
How would I update a certain int value by 1 in sqlite?
are you looking for an answer using python or sql query?
bright meadow
Python
lapis sequoia
Python
lapis sequoia
bright meadow
How would I update a certain int value by 1 in sqlite?
something like this:
UPDATE Orders SET Quantity = Quantity + 1 WHERE ...
I found this on stackoverflow
bright meadow
lapis sequoia
something like this:
UPDATE Orders SET Quantity = Quantity + 1 WHERE ...
I foun...
Ok
hollow scarab
oh..is that the only way? im doing this for a weekly report and they might not want the names to change @lapis sequoia
lapis sequoia
hollow scarab
oh..is that the only way? im doing this for a weekly report and they might not w...
if those columns are the have the same name and same contents (values) then you may want to join them instead of conctenating
pd.merge()
I don't know what is your use case so you have to figure that out
hollow scarab
basically the date is the same, and there are like 5 other colums with the same name in both but different values
so I could join on the date, but that wouldn't solve the issue of the other columns having the same name
I need to do this to make a chart, I guess if it joins the date that would be fine for one of the charts
lapis sequoia
i don't know what is the final result that you are looking for
hollow scarab
pd.merge can be done for one column only right?
lapis sequoia
hollow scarab
pd.merge can be done for one column only right?
no it can be done on multiple too

hollow scarab
basically this is week1 and week2, same column names
and I need a chart like that at the end
lapis sequoia
hollow scarab
and I need a chart like that at the end
wait they are not of the same date?
red briar
hollow scarab
basically this is week1 and week2, same column names
You need to different char for week 1 and 2?
hollow scarab
the date column is the same
red briar
Before concat make new column for each df
 sand hamlet
Use iloc then
hollow scarab
@sand hamlet the week1 and week2 were 2 different dfs, I got this by a pd.concat
well it should be on one chart @red briar
the jan13 is week1 and jan14 is week2 on the pic
do I need to combine the 2 dfs at all if I want them to be on the same chart?
or I can do that if they are separate dfs?
sand hamlet
Try to append
lapis sequoia
hollow scarab
or I can do that if they are separate dfs?
yeah you could do that without concatenating if they are some size.
sand hamlet
Instead of concat
lapis sequoia
lapis sequoia
yeah you could do that without concatenating if they are some size.
just read each row using .loc for both the df
hollow scarab
they are the same size
lapis sequoia
and use columns of df1 and df2 as indexes
hollow scarab
I will try that and append as well, see which is easier, thank you !
red briar
sorry i dont have experience with chart but
if i were to compare them via table
df1['week'] ='week1'
df2['week'] ='week2'
df = pd.concat([df1,df2])
then groupby via column week
hollow scarab
hmm, that could work as well
 fathom seal
def square_rooted(x):
return round(sqrt(sum([a*a for a in x])),3)
def cosine_similarity(x,y):
numerator = sum(a*b for a,b in zip(x,y))
denominator = square_rooted(x)*square_rooted(y)
return round(numerator/float(denominator),3)
print cosine_similarity([3, 45, 7, 2], [2, 54, 13, 15])
anyone know how to used this algorithm?
gleaming gull
azure leaf
does anyone know what this for loop means
I'm not sure if you got an answer for this, but here's a few use cases for why I use the "for x,y in n:" syntax in my day to day work as a data scientist
gleaming gull
I've used it in the past, do you have a specific question about it?
also, there was a slight error in that code, I updated it! my bad!
azure leaf
yes
and ok thanks
                        cloud_url = ""

                    else:
                        cloud_words = " ".join(words_ns_en)
                        img = io.BytesIO()
                        wordcloud = WordCloud(background_color='white', max_font_size = 100, width=600, height=300).generate(cloud_words)
                        plt.figure(figsize=(10,5))
                        plt.imshow(wordcloud, interpolation='bilinear')
                        plt.axis("off")
                        plt.show()
                        plt.savefig(img, format='png')
                        plt.close()
                        img.seek(0)

                        cloud_url = base64.b64encode(img.getvalue()).decode()
plt.clf()```so this is my code to generate a wordcloud
but sometimes i get this error on page load: File "/app/by_page.py", line 320, in bypage plt.imshow(wordcloud)
ValueError: Argument must be an image, collection, or ContourSet in this Axes```It only happens sometimes which is really weird
and sometimes if i refresh the page
it works
i have no idea why
    from pandas.plotting import register_matplotlib_converters
    register_matplotlib_converters()
    matplotlib.use('agg')
    import matplotlib.pyplot as plt
    import io
    import base64
    import matplotlib.ticker as plticker
    import datetime as DT
    from wordcloud import WordCloud``
these are my import statements
been trying to debug for the past day, can't find many resources online to this error
gleaming gull
do you have this deployed on a web page somewhere? It looks like some type of error with the ax parameter in matplotlib
azure leaf
yes its on my flask container
im running it in a docker container
I can screenshare and show you, not sure if you're up for that. No worries if not lol I getit
gleaming gull
I'm not too sure what's going on but it seems like something on the matplotlib side. If that helps lol
azure leaf
so
like an import statement?
  File "/usr/local/lib/python3.6/dist-packages/flask/app.py", line 2447, in wsgi_app
    response = self.full_dispatch_request()
  File "/usr/local/lib/python3.6/dist-packages/flask/app.py", line 1952, in full_dispatch_request
    rv = self.handle_user_exception(e)
  File "/usr/local/lib/python3.6/dist-packages/flask/app.py", line 1821, in handle_user_exception
    reraise(exc_type, exc_value, tb)
  File "/usr/local/lib/python3.6/dist-packages/flask/_compat.py", line 39, in reraise
    raise value
  File "/usr/local/lib/python3.6/dist-packages/flask/app.py", line 1950, in full_dispatch_request
    rv = self.dispatch_request()
  File "/usr/local/lib/python3.6/dist-packages/flask/app.py", line 1936, in dispatch_request
    return self.view_functions[rule.endpoint](**req.view_args)
  File "/app/app.py", line 21, in bypage
    return by_page.bypage()
  File "/app/by_page.py", line 320, in bypage
    plt.imshow(wordcloud)
  File "/usr/local/lib/python3.6/dist-packages/matplotlib/pyplot.py", line 2731, in imshow
    sci(__ret)
  File "/usr/local/lib/python3.6/dist-packages/matplotlib/pyplot.py", line 3102, in sci
    return gca()._sci(im)
  File "/usr/local/lib/python3.6/dist-packages/matplotlib/axes/_base.py", line 1856, in _sci
    raise ValueError("Argument must be an image, collection, or "
ValueError: Argument must be an image, collection, or ContourSet in this Axes```this is the full traceback
gleaming gull
My guess is something is going wrong when matplotlib is trying to draw the figure, just a guess though
gleaming gull
what happens if you remove the plt.figure() call and only use the wordcloud parameter to define the size?
azure leaf
not sure, ill comment out the plt.figure line and see what happense
ye, doesn't do anythin still points to this line plt.imshow(wordcloud, interpolation='bilinear')
gleaming gull
hmmm. I'm not sure.. I have a couple mins, I'm going to see if I can reproduce the error
azure leaf
Okay, thanks!
I don't know if you will get the error though, it only happens sometimes on my end and it could be to do with my flask environment
i honestly have no ideas
gleaming gull
That could be it too. I've deployed some apps to heroku and they're glitchy af. I tell my colleagues to refresh it if it doesn't pop up right away lol
azure leaf
ya cant resolve why this line causes error plt.imshow(wordcloud, interpolation='bilinear')
 buoyant phoenix
hello guys
please any link for tutorials in data science using machine learning
- using Python
molten hamlet
@native lark Yo check my progress :D,
Now I got rewards and can proceed to build actual model 😄
https://youtu.be/3_9oRuYH_UE

Script reading which box is most valuable to click. Purpose was to generate samples for machine learning, but small tuning and this is decent bot.
repositories: https://github.com/GrzegorzKrug/
 native lark
molten hamlet
<@!151347084602245120> Yo check my progress :D,
Now I got rewards and can procee...
native lark
molten hamlet
<@!151347084602245120> Yo check my progress :D,
Now I got rewards and can procee...
again, it would be faster to just recreate the game in python
molten hamlet
but it would be much easier!
i can't work with vision if all is in list and matrices 😄
native lark
yea i know, im just the type of person that would only care about the model if i was doing sth like this
molten hamlet
I just want start on this, and jump to euro truck simlator 😄
native lark
thats online tho, right?
molten hamlet
single and multi yes
native lark
wouldn't that be cheating?
molten hamlet
probably yes, as I remeber I think u can just load singleplayer save to multi 🤔
but it does not matter really 😄
native lark
yes, as per rule 5 it does
not gonna lie tho the clickr thing is really mesmerizing to watch
molten hamlet
I gonna do ai In single obviously, people are sometimes maniac in it 😄
haha yes it is 🤔
 twilit pilot
I am trying to do model.fit(X, y) where X is a bunch of 1-d arrays and y is a number 0 or 1. this is what my dataframe looks like ```
image result
0 [177, 177, 177, 177, 177, 177, 177, 177, 177, ... 1
1 [177, 177, 177, 177, 177, 177, 177, 177, 177, ... 1
2 [177, 177, 177, 177, 177, 177, 177, 177, 177, ... 1
3 [177, 177, 177, 177, 177, 177, 177, 177, 177, ... 1
4 [177, 177, 177, 177, 177, 177, 177, 177, 177, ... 1
... ... ...
995 [175, 175, 175, 175, 175, 175, 175, 175, 175, ... 0
996 [173, 173, 173, 173, 173, 173, 173, 173, 173, ... 0
997 [171, 171, 171, 171, 171, 171, 171, 171, 171, ... 0
998 [169, 169, 169, 169, 169, 169, 169, 169, 169, ... 0
999 [168, 168, 168, 168, 168, 168, 168, 168, 168, ... 0
1000 rows × 2 columns
and when i do thispy
model = sklearn.linear_model.LogisticRegression()
model.fit(df['image'], df['result'])
i get an error that looks like this
TypeError Traceback (most recent call last)
TypeError: only size-1 arrays can be converted to Python scalars
The above exception was the direct cause of the following exception:
ValueError Traceback (most recent call last)
<ipython-input-62-0feffeb8d1c0> in <module>
1 model = LogisticRegression()
----> 2 model.fit(X, y)
ValueError: setting an array element with a sequence.
 midnight rain
if i have a numpy array of numpy arrays of dtype float, shouldnt the dtype of the outer array be float as well?
x = np.array(np.array([....., ],dtype=float32), np.array(...), ...)

x.dtype = ? #np.float?```nope, its object most likely, cause you got arrays not floats inside
molten hamlet
🤔
molten hamlet
midnight rain
```python
numpy.stack(x, axis=0)``` or similar?
what u want to do? your previous examples was more like list or arrays
midnight rain
im dumb that worked
molten hamlet
you can np.concatenate or np.stack
midnight rain
im using the faiss database
molten hamlet
stack creates new axis, if needed
midnight rain
and the documentation is lacking
so im not even sure what it wants, but it didnt like having an array of objects
so im assuming maybe a multi dimensional array of floats is closer to what it wants

molten hamlet
you want to merge to arrays?
midnight rain
i guess i wanted a multidimensional array
a (rows, columns) array
the documentation didnt specify though so i thought it wanted an array of arrays for some reason 
 vestal mirage
hello
when comparing 2 datas what do u decide to put on the x and y axis
like for example i want to compare points vs assists, should points be on the x or it should be on y?
midnight rain
vestal mirage
like for example i want to compare points vs assists, should points be on the x ...
i think it depends on how you are doing your comparison. if you do the comparison over time, then i use x for the time and y for the values
vestal mirage
its more of like
a correlations between these two
like im more of trying to figure out the relationship between these 2 points
@midnight rain
currently its sumething liek dis
midnight rain
oh i see
midnight rain
id say thats more of a narrative thing
vestal mirage
in this case what wud u do? for setting x n y
midnight rain
what are you wanting the graph to show? That players with lots of assists are more/less likely to score points? Or players that score points are more/less likely to assist others?
i'd say your x is more likely to be what you want your narrative to be around, but you might be best off asking someone in UI/UX design
vestal mirage
midnight rain
what are you wanting the graph to show? That players with lots of assists are mo...
well its more of just data analysis rn
like figuring out those questions
vestal mirage
midnight rain
i'd say your x is more likely to be what you want your narrative to be around, b...
but ye the main narrative is around points
how different stats influence points
abstract zealot
Hey is covariance the same as variance if im only looking at one univariate normal distribution? asking this because im trying to model my normal distribution as a GaussianMixture on sklearn and this class only has the attribute .covariances_. Any help appreciated thank you 😄
lapis sequoia
Numpy.matrix is depracated and discouraged. Is there some alternative to implement an api that supports classic syntax like (A * B, A ** 3) for matrixes etc
 sturdy dune
10 python hacks you must know : https://datamahadev.com/10-amazing-python-hacks-with-cool-libraries/

In this article, we will learn some amazing python hacks with some rare yet cool libraries. The main purpose of this article is to learn(or automate) a few basic things with the help of python. So, let us begin.
velvet thorn
lapis sequoia
Numpy.matrix is depracated and discouraged. Is there some alternative to impleme...
is that supposed to be elementwise multiplication
velvet thorn
abstract zealot
Hey is covariance the same as variance if im only looking at one univariate norm...
Var(X) = Cov(X, X), yes
velvet thorn
midnight rain
the documentation didnt specify though so i thought it wanted an array of arrays...
there is no ML case I can think of which requires an array of arrays
it's always a multidimensional array
this has to do with efficiency in reading/writing data
velvet thorn
twilit pilot
I am trying to do `model.fit(X, y)` where X is a bunch of 1-d arrays and y is a ...
you need to turn your X into a 2D array
right now it's a 1D array of arrays
midnight rain
velvet thorn
there is no ML case I can think of which requires an array of arrays
it is for indexing into a database so both cases seemed like they made sense
wasnt sure how it transactionally does indexing.
velvet thorn
midnight rain
it is for indexing into a database so both cases seemed like they made sense
there are few cases general where one should be using some collection of arrays
because you lose vectorisability over the outer collection
midnight rain
@velvet thorn well all im doing is inserting those arrays into a database for however it wants to keep them stored
velvet thorn
midnight rain
<@!171929073063297024> well all im doing is inserting those arrays into a databa...
hm. that sounds somewhat like an antipattern to me
but if it doesn't matter to you we can just leave it
midnight rain
@velvet thorn well its an embedding database so i wasn't sure if it wanted individual embeddings or a ndarray of embeddings.
for a more traditional db you'd probably give a list of tuples like [(col1, col2, col3), ...]
velvet thorn
midnight rain
<@!171929073063297024> well its an embedding database so i wasn't sure if it wan...
depends on the spec I guess
but yeah generally in that case you'd want a list of arrays
midnight rain
right, but this particular library wanted an ndarray
the documentation is extremely lacking so i didnt know haha
 ancient galleon
Hi uh, is anyone familiar with multi-indexing with matplotlib?
velvet thorn
ancient galleon
Hi uh, is anyone familiar with multi-indexing with matplotlib?
just ask your question
ancient galleon
How would you graph a multi-indexed series into a grouped bar chart?
I thought something like this in seaborn would do the trick:
sns.barplot(x="Age Cohort", y=(?), hue="Ethnicity")
But if you're not familiar with seaborn then a way of creating a grouped bar plot in native matplotlib would be great as well.
velvet thorn
ancient galleon
How would you graph a multi-indexed series into a grouped bar chart?
I thought ...
paste the Series
as text
ancient galleon
Sure thing
Age Cohort  Ethnicity
0 to 5      Hispanic               44
            White not Hispanic     20
13 to 17    Hispanic              103
            White not Hispanic     67
18 to 21    Hispanic               78
            White not Hispanic     69
22 to 50    Hispanic               43
            White not Hispanic    133
51+         Hispanic               17
            White not Hispanic     66
6 to 12     Hispanic               91
            White not Hispanic     46
Name: Age Cohort, dtype: int64
thx
ancient galleon
Ideally I would be able to convert this into a chart like this:
velvet thorn
@ancient galleon df.unstack().plot.bar()
ancient galleon
I'll give it a shot right now, thanks gm
velvet thorn
ancient galleon
I'll give it a shot right now, thanks gm
actually, apply that to the series
not the DF
ancient galleon
Yeah it provides the graph, thank you. I was experimenting with unstack() to change it back to single indexing but I was just translating that directly into seaborn instead of using pyplot
This solves the issue, I appreciate the help!
velvet thorn
yw
shut valve
Hello i was wondering if any of yall use a real time collaborative notebook with your team? We tried using VS code live share but it didnt work with notebooks. I'm currently just port forwarding my jupyter notebook which works but i don't like having an open port and sending my ip to strangers on the internet. Wondering if others had a solution? I'm currently thinking about trying to host a notebook on elastic beanstalk or something like that as that would be most ideal for when we start training models as I'm on a small laptop. Cheers
 sly hinge
Hi, I'm trying to implement a CNN with an LSTM layer but I don't know how LSTM works very well and I haven't been able to connect the two layers, does anyone know how I can pass the parameters?
velvet thorn
sly hinge
Hi, I'm trying to implement a CNN with an LSTM layer but I don't know how LSTM w...
I suggest you read up on what a LSTM does first
it's better to understand the nature of the basic layers before trying to do this kind of thing
sly hinge
I have a general knowledge, I don't think the layer is necessary for the project I want to do, but it is a requirement. I'll keep investigating thanks.
vestal mirage
can anybody help me speed this code up? its verry slow
basically what it does is takes in an initial dataframe with metrics column containing json data, then it normalizes that json and returns a new data frame with the json flattened
 agile wing
nice
lapis sequoia
nice
lapis sequoia
vestal mirage
Your code looks gorgeous sir
velvet thorn
vestal mirage
can anybody help me speed this code up? its verry slow
can you give a short sample
of your data
also, post code/data as text instead of images please
vestal mirage
velvet thorn
can you give a short sample
def _expand_json(metric: Any) -> pd.DataFrame:
    try:
        return pd.json_normalize(metric)
    except AttributeError:
        return pd.DataFrame(metric)


def _expand_metrics(dframe: pd.DataFrame) -> pd.DataFrame:
    dfs = []
    for _, row in dframe.iterrows():
        df = pd.DataFrame({"entity#id": [row["entity#id"]]})
        expanded = _expand_json(row["metrics"])
        dfs.append(pd.concat([df, expanded], axis=1))

    df = pd.concat(dfs, ignore_index=True)
    return df
of data
vestal mirage
1 sec
pycharm froze -.-
csv file big
parent,metrics,entity#id,latest,lastUpdatedEpoch
game#bos-dal-20190824,"{""playerStats"":{""onePtGoals"":0,""shotsOnGoalPercentage"":null,""penalties"":0,""reboundSaved"":0,""penaltyMins"":0,""twoPtGoals"":0,""causedTurnovers"":0,""interceptions"":0,""points"":0,""runOuts"":0,""shotsOffTarget"":0,""cleanSaved"":0,""assists"":0,""shotPercentage"":null,""shotsOffGoal"":0,""turnovers"":0,""shotsOnGoal"":0,""shotsTotal"":0,""shotsPipe"":0,""shotsDeflected"":0,""groundballs"":{""retain"":0,""rebound"":0,""total"":0,""turnover"":0,""faceoff"":0}},""faceoffStats"":{""total"":0,""faceoffGroundball"":0,""percentage"":null,""wingGroundball"":0,""won"":0,""wingProcedure"":0,""faceoffProcedure"":0,""outOfBounds"":0},""goalieStats"":{""cleanSaves"":0,""onePtGoalsAllowed"":0,""reboundSaves"":0,""savePercentage"":null,""saves"":0,""goalieShotsOnGoal"":0,""goalsAgainstAverage"":null,""minPlayed"":null,""twoPtGoalsAllowed"":0,""totalGoalsAllowed"":0},""jerseyNumber"":99,""link"":""/game/bos-dal-20190824/player/13367"",""name"":""John Daniggelis"",""_id"":13367,""position"":""DM"",""team"":{""name"":""Boston Cannons"",""link"":""/team/bos"",""id"":""bos""}}",game#bos-dal-20190824#player#13367,false,1566678278806
@velvet thorn dis is 1 line of the csv file
basically ,etrics col is json
velvet thorn
then why do you have a try-except
vestal mirage
oh dat cuz the original dataframe is kinda messed up
so liek 99% of metrics col is json but there are a few exceptions
velvet thorn
df['metrics'].map(pd.json_normalize)?
vestal mirage
@velvet thorn any ideas?
lapis sequoia
velvet thorn
is that supposed to be elementwise multiplication
No, thats matrix multiplication (product sums of columns by rows)
 compact matrix
Is there a way to reverse one hot encoding and get the original categorical variables.?
velvet thorn
No, thats matrix multiplication (product sums of columns by rows)
@lapis sequoia @ with 2D arrays
vestal mirage
pycharm pro scitools r dope
 upbeat cradle
hey all, would dask be worth using over pandas for large groupby sets?
would there be a noticable difference in speed? bare in mind my current operation takes around 60 minutes and I have ~1mil rows
 austere swift
You could use cudf if you're on linux
since cudf is linux only iirc
its essentially just gpu-accelerated dataframe operations
so it should make it a lot faster since it's on gpu

GitHub
cuDF - GPU DataFrame Library. Contribute to rapidsai/cudf development by creating an account on GitHub.
as for dask I'm not sure how much the performance increase would be
upbeat cradle
thanks, seems like a really useful tool. Using servers at my work for this though, GPU is a bit pants on it
austere swift
dask is meant to be really scalable
so if you have a lot of servers at your work you can use it to have it run on clusters
pure pond
Hey, how do I make an empty numpy array? I need an object to store values, then I'll iterate over files and append to the same array, so I need it to start with no values
I can only find things about making arrays with 0's or whatever already in. I just want it like how you can make an empty list a = []
its just a 1d array
 ashen sable
guys i am getting this error
AttributeError: module 'tensorflow' has no attribute 'reset_default_graph'
any help ?
 iron aspen
pure pond
Hey, how do I make an empty numpy array? I need an object to store values, then ...
iron aspen
pure pond
Hey, how do I make an empty numpy array? I need an object to store values, then ...
just pass the empty list into np.array() like you would do with nonempty ones. But considering that you are to append elements, I think built-in list will be a better choice. Convert it to numpy array afterwards if you want numpy features.
pure pond
I have to extract numpy arrays from the files I'm working with, theres an i/o package handling that. I found what to do though, I was doing np.empty(1) thinking it would give me a 1d array, but apparently you're supposed to do (0).
iron aspen
cool
hollow scarab
i have a 260 row data, and I want to plot it into a barchart, but my issue is that I need the number in the 1. row and then from the 2. row to the x. row (variable) grouped up
is this possible?
so like 1. row and then 2-x. row grouped stacked on each other as a bar chart
and that for 2 different columns
kinda like the excel chart
mint palm
Has deep learning already in it peak or is there still time in it to go boom or is it somewhere in between...........What do you guys think??
 nova widget
@mint palm it holds an eternal amount of potential and most is yet to come. But, it's not a "magic solution", and no singularity event, yet. You can solve a lot of problems in a more efficient way than using deep learning.
mint palm
it just a beginning i think
lapis sequoia
Hello guys,