#data-science-and-ml
1 messages · Page 275 of 1
 dapper karma
 lapis sequoia
Did you use groupby method
 heady hatch
Glad to hear that. When you say it works do you mean it's able to reach the same score?
 twilit pilot
Lets say i have this pandas DataFrame c h l o t v 0 119.839996 124.370003 119.010002 123.849998 1559520000 37983636 1 123.160004 123.279999 120.650002 121.279999 1559606400 29382642 2 125.830002 125.870003 124.209999 124.949997 1559692800 24926140 3 127.820000 127.970001 125.599998 126.440002 1559779200 21458960 4 131.399994 132.250000 128.259995 129.190002 1559865600 33885588 5 132.600006 134.080002 132.000000 132.399994 1560124800 26477098 6 132.100006 134.240005 131.279999 133.880005 1560211200 23913732 7 131.490005 131.970001 130.710007 131.399994 1560297600 17092464 8 132.320007 132.669998 131.559998 131.979996 1560384000 17200848 9 132.449997 133.789993 131.639999 132.259995 1560470400 17821704 10 132.850006 133.729996 132.529999 132.630005 1560729600 14517785 11 135.160004 135.240005 133.570007 134.190002 1560816000 25934458 12 135.690002 135.929993 133.809998 135.000000 1560902400 23744440 13 136.949997 137.660004 135.720001 137.449997 1560988800 33042592 14 136.970001 137.729996 136.460007 136.580002 1561075200 36727892 15 137.779999 138.399994 137.000000 137.000000 1561334400 20628840 16 133.429993 137.589996 132.729996 137.250000 1561420800 33327420 17 133.929993 135.740005 133.600006 134.350006 1561507200 23657744 18 134.149994 134.710007 133.509995 134.139999 1561593600 16557482 19 133.960007 134.600006 133.160004 134.570007 1561680000 30042968 20 135.679993 136.699997 134.970001 136.630005 1561939200 22654160 And i want to get all the information where 't' is in the range of 1559865600 to 1560988800, how would i do that?
 storm gate
df = df[(df["T"] > some_val) & (df["T"] < some_other_val)]
storm gate
you can chain as many conditions like that as you want on but they need to be in ()
gonna start using foo and bar next time so I feel professional hahahaha
 hushed wasp
heady hatch
Glad to hear that. When you say it works do you mean it's able to reach the same...
hushed wasp
heady hatch
Glad to hear that. When you say it works do you mean it's able to reach the same...
Yes indeed!! It looks like it's the manhattan parameter in the grid creating this...
heady hatch
hushed wasp
Yes indeed!! It looks like it's the manhattan parameter in the grid creating thi...
Ahh okay, if I were to guess it might have something to do with the scoring. Maybe previous gridsearch was tuned towards some other metric like mse isntead of r2.
If you still wanted to do a gridsearch with all those previous parameters, try do it with scoring = r2.
hushed wasp
heady hatch
Ahh okay, if I were to guess it might have something to do with the scoring. May...
It was already on the R2 metric... Don't really have explanation except the fact that the cross validation make too small folds and then the model can't converge (I have few data)
hushed wasp
heady hatch
Ahh okay, if I were to guess it might have something to do with the scoring. May...
Thanks a lot for taking some time for me nine!
 muted sapphire
Guys, can someone who is experienced with cross_val_scores and kfold help me a bit?
I want to use 10-fold cross validation for 2 different machine learning algorithms. I will do it using cross_val_scores(). However, I want the method to perform the exact same splits and train/test on the exact same sets both times.
I assume I can maybe do this somehow using kfold class, but I dont know for sure and searching online did not help. Can someone experienced give me a hand?
heady hatch
muted sapphire
Guys, can someone who is experienced with cross_val_scores and kfold help me a b...
If you want to use your own split, you'll need to write your own cv function to generate the split.
https://scikit-learn.org/stable/modules/generated/sklearn.model_selection.cross_val_score.html
cross_val_score takes a cv parameters.
muted sapphire
I know. Can kfold() do this? If I pass in both cross_val_score the same thing for cv
So, both times, cv = kf. Does this mean that the exact same train/tests sets will occur?
heady hatch
I haven't used sklearn in a while, but you can test the split yourself to see if it's what you wanted.
I think there's a method from the fold object that allows you to get the split.
muted sapphire
I see. I dont find anything like that sadly, but I think that what I posted makes the job correctly. Tyvm for the help in any case :^)
 trim oar
muted sapphire
Guys, can someone who is experienced with cross_val_scores and kfold help me a b...
trim oar
muted sapphire
Guys, can someone who is experienced with cross_val_scores and kfold help me a b...
What you want to use is grid search
muted sapphire
Thanks for answer. Why? Im not looking for any parameters
muted sapphire
Ok 🙂
I think what I posted right above, the line of code, does the job though. Feel free to confirm if you know 😄
trim oar
I'm sure the randome_state would do it
You may also want to stratify however
If it's classification
muted sapphire
Thank you. Yeah it's classification with 9 possible classes. Im not aware of stratified kfold but I will look it up 😄
 livid quartz
Hey, I'm trying to do PCA manually and was wondering if anyone could help
Im Using numpy.linalg.svd to make the PCA, and I was wondering which variable is storing the principal components, is it Vh?
So if I choose the first two rows of Vh that would equate to the first two principal components right?
and if i choose the first three rows that is 3 principal components?
trim oar
livid quartz
Hey, I'm trying to do PCA manually and was wondering if anyone could help
It's probably easier just go for sklearn. https://scikit-learn.org/stable/modules/generated/sklearn.decomposition.PCA.html
livid quartz
Oh I know that haha, I'm just trying to teach myself data science
 civic fractal
x['db'] = pd.to_numeric(x[db])
NameError: name 'x' is not defined
civic fractal
civic fractal
x['db'] = pd.to_numeric(x[db])
NameError: name 'x' is not defined
I've read in a db and when I try to make them all numbers I keep getting a x is not defined error? would appreciate some helkp
livid quartz
is x the name of your dataframe?
trim oar
civic fractal
I've read in a db and when I try to make them all numbers I keep getting a x is ...
Your code is converting a column named ‘db’ in dataframe named x to numeric. By the way, you need to keep the column name in string still at the end of the line
heady hatch
livid quartz
Hey, I'm trying to do PCA manually and was wondering if anyone could help
I don't know if they are direct equivalent, but the s is the eigenvalue/singular value of svd.
If you want to achieve pca from svd, you just really need the last 2 parts, the Vh and S.
Oh actually refreshing my understanding of svd, I think you're right. It is V that stores the principal components.
But Vh * S by itself is not enough to reach pca.
livid quartz
heady hatch
Oh actually refreshing my understanding of svd, I think you're right. It is V th...
Thanks for the confirmation!
livid quartz
heady hatch
But Vh * S by itself is not enough to reach pca.
I thought V * the centered matrix gives pca?
CenteredData * V[:2] should give pca of the first two principal components if I'm correct?
lapis sequoia
greetings, for NLP should I go with tflow or spaCy? anyone has experience in these?
heady hatch
livid quartz
I thought V * the centered matrix gives pca?
So I think this is where my lack of certainty comes in regarding principal components.
From my understanding, pca is achieved via X * X.T * normalization factor turning into W * delta * W.T * normalization factor.
Ignoring the normalization factor.
X can be decomposed via svd into U * S * V.T
If you substitute U * S * V.T into the above equation, you should reach your pca.
heady hatch
lapis sequoia
greetings, for NLP should I go with tflow or spaCy? anyone has experience in the...
It depends on what you're trying to do. The two don't completely overlaps nor are they mutually exclusive.
Are you just starting out in NLP and ML?
lapis sequoia
@heady hatch yes I am just starting out with NLP and ML for Amharic. thanks
and hard to find resources in either for አማርኛ. So I am having to start a lot of things from scratch.
heady hatch
lapis sequoia
<@!542872811245666305> yes I am just starting out with NLP and ML for Amharic. t...
I would suggest to start with SpaCy. It's more NLP focused and it allows you to understand the different components of NLP.
Tensorflow is more like a general tool to do graph computation with components to help with NLP.
lapis sequoia
@heady hatch thanks so much, in fact I was leaning more towards spaCy and I am glad I spent more time on it. you rock!
heady hatch
Good luck.
 ripe lintel
i have trainset with timestamp index,
                        close
timestamp
2020-12-15 04:40:00  12523.25
2020-12-15 04:50:00  12528.25
2020-12-15 05:10:00  12516.25
2020-12-15 05:20:00  12516.25
2020-12-15 05:30:00  12517.50
                      ...
2020-12-16 18:00:00  12688.75
2020-12-16 18:10:00  12688.75
2020-12-16 18:20:00  12686.50
2020-12-16 18:30:00  12684.00
2020-12-16 18:40:00  12684.00

[200 rows x 1 columns]
when i get prediction, i don't get timestamp on it?
pred_close = pred_uc_close.predicted_mean
i got with number index
pred_close
Out[135]:
200    12683.760581
201    12687.613078
202    12695.151453
203    12695.672616
204    12695.672616
205    12705.053540
dtype: float64
how can i solve it?
 tardy condor
Hello, is anyone familiar with the concept of Euler's angle?
Is Euler's angle basically yaw, roll and pitch?
 serene scaffold
tardy condor
Hello, is anyone familiar with the concept of Euler's angle?
serene scaffold
tardy condor
Hello, is anyone familiar with the concept of Euler's angle?
idk what that is, but go ahead and ask the question that you would ask if someone said they knew the answer. That's ultimately the best way to get help.
tardy condor
Alright, thank you! @serene scaffold
serene scaffold
you might also ask if it fits under this channel's topic. But idk what it is, so maybe it does.
 orchid delta
tardy condor
Is Euler's angle basically yaw, roll and pitch?
orchid delta
tardy condor
Is Euler's angle basically yaw, roll and pitch?
Also wikipedia has some answer: https://en.wikipedia.org/wiki/Euler_angles#:~:text=yaw
tardy condor
Alright, thank you! @serene scaffold @orchid delta
 azure stump
https://medium.com/dev-genius/advantages-of-julia-over-python-6fa8eab56d1d
https://asr373.medium.com/traditional-techniques-followed-by-every-data-scientists-4f2677e830da

 trim oar
ripe lintel
i have trainset with timestamp index,
```
close
timesta...
trim oar
ripe lintel
i have trainset with timestamp index,
```
close
timesta...
Is your index in datetime data type?
trim oar
ripe lintel
i have trainset with timestamp index,
```
close
timesta...
What you can do is turn it into a pd.dataframe, so y_pred = pd.DataFrame(data = .predict(X_test), index = X_test.index)
something like taht
 boreal summit
ripe lintel
i have trainset with timestamp index,
```
close
timesta...
boreal summit
ripe lintel
i have trainset with timestamp index,
```
close
timesta...
You first need to be certain that your index is in timestamps, check it using df.index.dtype
If it's in timestamps, it should return a datetime64 dtype, else you should manually set the index to timestamps.
 bright burrow
Hello I have a concern about the seaborn module. Can someoe tell me what is the difference between hist and kde because I get confused all the time, sometimes it shows me a curved line and pixelated curved graph and sometimes a bar graph.
Thank you
 velvet thorn
bright burrow
Hello I have a concern about the seaborn module. Can someoe tell me what is the ...
velvet thorn
bright burrow
Hello I have a concern about the seaborn module. Can someoe tell me what is the ...
histogram = counts
KDE = estimate of the continuous probability distribution
basically
livid quartz
How do I fill the first two diagonal elements of this array with a 1 and 2 ?
so it looks like this?
preferably without using for loops
livid quartz
Never mind, np has a function that fills diag values
 indigo garnet
is there a way to run jupyter notebook as a virtual env?
with the same interpreter as the virtual env?
 real wigeon
hey guys
im hoping for some advice on jupyter notebooks
im having some issues understanding the concept
am i supposed to start a new project in my ide every time i want to run a new jupyter notebook
or is this just to be run from the CLI
and how does it handle imports like pandas for example, if it's just a standalone browser app, then how does it handle depencencies
and do i need a venv
 teal sluice
Anyone got any links/documentation which could tell me how I could plot 2 dataframes on the same line graph?
As well as be able to control the axis in terms of where it starts/ends and the intervals?
trim oar
teal sluice
As well as be able to control the axis in terms of where it starts/ends and the ...
plt.plot() has x and y argument, what you want to do is make sure the x is the same for both lines
xlim to control
teal sluice
trim oar
plt.plot() has x and y argument, what you want to do is make sure the x is the s...
Any chance u could give a piece of example code?
trim oar
As long as you have packages installed on base or whichever environment you want to work on. You can switch the kernal, or basically the environment, that the notebook is working on. But yeah, you can just call on the terminal and jupyter notebook, and it'll run on your browser
trim oar
teal sluice
Any chance u could give a piece of example code?
Such as:
x = range(0,5,1) plt.figure() plt.plot(x, df1['One']) plt.plot(x, df2['Two']) plt.show()
teal sluice
trim oar
Such as:
`x = range(0,5,1)
plt.figure()
plt.plot(x, df1['One'])
plt.plot(x, df2[...
for the x axis, if it was dates would I put the starting date,ending date and then 1?
trim oar
is it on index?
you can do slicing instead
plt.plot(df1.index[:125], df1['One']) something like that
As long as they're in datetime type then you'd be able to do so
 verbal osprey
Hi, I'm trying to solve differential equations but I'm a bit lost. Can someone help me understand some things?
lapis sequoia
Does anybody use Kaggle for Machine Learning and Data Science?
 ashen berry
got a tensorflow question up in #🤡help-banana if anyone knows their way around tf graphs
civic fractal
Is it possible to use conditions inside of loc?
heady hatch
civic fractal
Is it possible to use conditions inside of loc?
Depending on the conditions but I believe so.
df.loc[df[col] == value, col2]
I might have misunderstood. When you say conditions do you mean boolean indices?
heady hatch
lapis sequoia
Does anybody use Kaggle for Machine Learning and Data Science?
Kaggle is a good place to quickly iterate and understand ds and ml concepts, but it also has caveats.
lapis sequoia
My task is to parse emojis to words, so given a text I was🥇 place at volleyball last year I need to parse it to I was 1st_place_medal at volleyball last year.
{
'🥇': ':1st_place_medal:',
 '🥈': ':2nd_place_medal:',
 '🥉': ':3rd_place_medal:',
 '🆎': ':AB_button_(blood_type):',
 '🏧': ':ATM_sign:',
 '🅰': ':A_button_(blood_type):',
}
Given the UNICODE_EMO dictionary above I tried the following but I ended up with error: nothing to repeat at position 1. NOTE: I m running my code on a jupyter notebook
def convert_emojis(text):
    for emot in UNICODE_EMO:
        text = re.sub(u'('+emot+')', UNICODE_EMO[emot].replace(':', ''), text)
    return text
 elder nymph
I am working on a project where I want to update the Wordnet using NLTK by adding my own list of synsets. If anyone has worked on it and guide me, it would be very helpful.
 tropic nest
Anyone here familiar with plotnine? I keep getting a MemoryError: Out of memory despite Pycharm having >8gb memory remaining... before SSD pagefile...
Would apply to matplotlib also, I suppose
Reducing DPI a lot lets me get past it, but I'd like to use >300 dpi...
Resulting images are <2mb
lapis sequoia
@heady hatch making great progress with NLP with spaCy for Amharic/አማርኛ
 astral path
Hi all,
I have a list of arrays of size 5 featureSet to represent my features, and I'm trying to use scikit-learn to scale these features:
npSet = np.array([np.array(xi) for xi in featureSet])
min_max_scaler = sklearn.preprocessing.MinMaxScaler(feature_range=(-1, 1))
features_scaled = min_max_scaler.fit_transform(npSet)
however, I'm getting the following error:
TypeError: only size-1 arrays can be converted to Python scalars
The above exception was the direct cause of the following exception:
ValueError: setting an array element with a sequence.
I can paste more of the error if needed
Anyone know how to get the scikit-learn minmaxscaler to work?
tropic nest
Not familiar with the package Jodastt, are you trying to linearly map values from one range to another? If so, you might be able to work around-- assuming input min a0 and max a1, and output min b0 and max b1, a given value b = b0 + (b1-b0) * ((a - a0) / (a1 - a0))
astral path
I'm not, I'm just trying to input my numpy array npSet (npSet is just the list converted to a numpy array) into the min max scaler, and fit_transform() is what actually scales it
tropic nest
OIC, probably it only accepts one array per call, you may have to iterate. And check the docs if you haven't.
astral path
ah that makes sense
I'll prolly have to change it to an array of 5 vectors for each feature rather than n vectors for the features of each example
 opaque stratus
Help --> in need of guidance: I am majoring in Applied Mathematics and am really looking to pursue a career as a data/machine learning scientist... For almost a year and a half now I have been trying to dive into this vast, ever-expanding world of "data science/machine learning", but right now, I feel like a legitimate failure. I've read/followed along to multiple books, tried Kaggle competitions, tried to stay up-to-date with towardsdatascience on medium, etc. I then turned toward my professors for advice, in which they told me to embark on my own projects, which I spent all last summer doing. I did 3, and was proud of them at the time... but now I look back at them as more shameful wastes of time (I can show you them if you'd like -- on my github). I am proud of myself for trying, but I feel like I've learned nothing... I tried to dive into this world of "data science/machine learning", but i've just been trapped in the shallow end, swimming around and around with no direction in sight... So my question is to you: How did you break this cycle? How did you cut deep, past the skin, through the muscle, and into the bone... how did you really start learning, gaining ground, and moving forward about all this in a meaningful way? I feel lost. I need help. Please @ me if responding, thanks <3.
 prisma crow
Getting this year:
'''
con_grp = drinks.groupby(['continent'])
AttributeError: 'DataFrameGroupBy' object has no attribute 'groupby'
'''
trim oar
opaque stratus
***Help --> in need of guidance***: I am majoring in Applied Mathematics and am ...
Unless your projects are very mundane and basic, I don't think it's your capabilities. As long as your portfolio has that one or two projects that you can be really proud of, then you're good. You should instead be more active on reaching out on LinkedIn and meeting other people especially.
You can still spend time on your projects, but you're already getting diminishing return on that.
 strange coral
I need some help with confusion matrix, ,anyone up?
strange coral
I used this guide to write a small sentiment analysis program. I need to plot the confusion matrix, but I'm not able to since the data format is wrong

GitHub
Project for DO tutorial on Sentiment Analysis. Contribute to sdaityari/sentiment.analysis.tutorial development by creating an account on GitHub.
if you have the time, just read it up and let me know
trim oar
How did you try to plot the confusion matrix again?
strange coral
just tried the nltk.ConfusionMatrix() function but it won't work mostly because of the data format. I think it accepts a list or a set
strange coral
is X the same as y_pred?
trim oar
Hmm I'm reading up on this. I honestly haven't worked with sentiment analysis with nltk.naivebayes so I was just making assumption that it can create the model.predict(X_test)
Which right now reading the documentation I'm not that sure of
but y_pred would have been model.predict(X_test) to find the predicted label, and put that against y_true which is basically y_test, so that you get true/false positives/negatives for each class
strange coral
I just think I've chosen the wrong guide to understand this 😆
strange coral
nope, it's a guide from digitalocean
I've read a couple of others and they seem better now. This method seems rather unconventional
trim oar
you mean using the naivebayes?
strange coral
nope, the dictionary thing
classifier.classify(dict([token, True]
                    for token in remove_noise(word_tokenize(custom_tweet))))
this method in particular
trim oar
Sorry that you had to figure it out yourself
strange coral
I wrote up a small function to test if I understood what Confusion Matrix meant. So in it, I just loop over the positive tweet dataset (the one provided in nltk.corpus) and then I classify each tweet using .classify() method. It returns the prediction and since I know it is the positive dataset, I just check if the result returned is positive, if yes, then that becomes a True Positive, else it's a False Negative.
Did this for the negative tweets dataset as well and stored the results.
Out of 5k positive tweets, 4225 were TP, and 775 were FN.
Out of 5k negative tweets, 4131 were TN and 869 were FP.
Using the accuracy formula ( TP + TN / all) I get an accuracy of 84, however the model's inbuilt accuracy function describes it as 99. Is this normal?
trim oar
Uh first of all
Shouldn't it be False Positive?
You're right it's weird
No you're right it's FN. Sorry it's late. Without looking at the codes, hard for me to think.
strange coral
yeah I am confused myself
trim oar
My hunch is either the model was refitted or you passed through sets of data you didn't intend to
verbal osprey
I'm trying to solve ODE with the method RK4
Should I make different classes for each?
 cosmic glacier
strange coral
I wrote up a small function to test if I understood what Confusion Matrix meant....
cosmic glacier
strange coral
I wrote up a small function to test if I understood what Confusion Matrix meant....
Why only on positive dataset? Model does not aim to separate positive from negative?
livid quartz
In a covariance matrix, what shows the direction of variability and what shows the scaling/ratio factor?
 brazen owl
Hi everyone
I need to derivative norm.cdf(y)
how can i do that actually ??
thanks for your reply
here my code
from scipy.stats import norm
import matplotlib.pyplot as plt
import numpy as np
import pandas as pd
import sympy as sy

#df_data = pd.read_csv('a09.csv', sep=';', decimal=',')


df_dat = pd.read_csv('a09.csv', sep=';', decimal=',')

df_data=np.loadtxt (fname=r"C:\Users\Amine13\Desktop\COURS 3I\math maintenance\a09.txt")
#df_data[['duree_de_vie']]
#y = np.array(df_data[['duree_de_vie']]).reshape(-1)


#question 1
plt.figure(1)
x=df_data[:,0]
y=df_data[:,1]
plt.plot(x,y,'.')

#question 2
m=np.mean(y)
print ("moyenne =",m)

e=np.std(y)
print ("Ecart type =",e)

#question 3
plt.figure(2)
plt.plot(y, np.ones_like(y), "|")
plt.hist(y, bins=30)

df_data[0:30]


plt.figure(3)
y = np.linspace(norm.ppf(0.01,loc=m, scale=e), norm.ppf(0.99, loc=m, scale=e))
plt.plot(y, norm.pdf(y))
plt.title("densité de probabilité")
plt.xlabel("x")
plt.ylabel(" probabilité ")
plt.xlim(-3,4) #sert a zoomer sur la pdf


#question 4

plt.figure(4)

x = np.sort(df_dat['duree_de_vie'])
y = np.arange(1, len(x)+1)/len(x)

#_ = plt.plot(x,y,marker='.', linestyle='none')
_ = plt.plot(x, y)
#marker='.', linestyle='none'
plt.margins(0.02)
plt.show()

plt.figure(5)

y = np.linspace(norm.ppf(0.01,loc=m, scale=e), norm.ppf(0.99, loc=m, scale=e))

yo = 1 - norm.cdf(y)
x = y

plt.plot( x, yo)
#plt.plot( y, 1 - norm.cdf(y))
#plt.plot(plt.semilogx(y), 1 - norm.cdf(y))
plt.xscale("log")
plt.title("Distribution Normale (R(x))")
#set(gca, 'XScale', 'log')
plt.xlabel("x")
plt.ylabel("fiabilité")


# Question 5


# etant donné que la dérivée de 1 - norm.cdf(y) est ln (norm.cdf(y))
'''
sy.init_printing()
y = sy.symbols("y")

dy = sy.Derivative(yo)
dy = dy.doit()
dy
'''

deriv = np.diff(wei.cdf(x))/dx
print(deriv)


plt.show()
 atomic dome
if I am defining three vectors 1, 2 and 3 with co-ordinates x1,y1,z1, x2,y2,z2, x3,y3,z3.
Should I do this or the other one?
vectors = numpy.array([x1,y1,z1],[x2,y2,z2],[x3,y3,z3])
vectora = numpy.array([x1,x2,x3],[y1,y2,y3],[z1,z2,z3])
all the co-ordinates are integers
anyone?
 austere moth
Hi! I have a very unbalanced dataset for which I intend to apply/evaluate several balancing techniques (ex. oversampling, undersampling, class weighting, etc.) for a list of models. I was trying to do that in a pipeline, but I keep collecting errors. Does anybody can help me?
bright burrow
Hello please explain to me what is lam? Because I cant get to see what it its use.
the result is at the last part
 chilly geyser
Do you understand what the documentation is saying?
https://numpy.org/doc/stable/reference/random/generated/numpy.random.poisson.html
bright burrow
i mean it said that rate or know number so...
chilly geyser
Do you know what's a Poisson distribution?
bright burrow
or number or occurences
bright burrow
chilly geyser
Do you know what's a Poisson distribution?
Im studying it
bright burrow
im using w3schools.com
chilly geyser
That parameter is lam in numpy.random
bright burrow
okay...
chilly geyser
The greater the rate, the greater the mean
chilly geyser
If you have lam=100, the random number you get will be average around 100
bright burrow
wait leme try it
atomic dome
bright burrow
hold on I dont get it @chilly geyser
atomic dome
can anyone please help me?
i've been trying to google the query.
and have been waiting for 90 min since i posted this on this server
bright burrow
what time is it for you @atomic dome ?
bright burrow
oh
mine is 12:40 PM (PST)
im pretty sure that these other guys live on the other side of the world so they probably at school or something
trim oar
atomic dome
i've been trying to google the query.
Each list is an array/vector. So first one. But this could have been checked on Numpy documentation. I encourage doing that instead of waiting.
atomic dome
I did, but I didn't understand it exactly.
That's why I asked here.
Thanks for your help!
😄
austere moth
Hi! I have a very unbalanced dataset for which I intend to apply/evaluate several balancing techniques (ex. oversampling, undersampling, class weighting, etc.) for a list of models. I was trying to do that in a pipeline, but I don't know how to link them (technique + sklearn model). Does anybody can help me? Just let me know, then I share the code I've written.
 high badge
im still learning in this field and im pretty new but you can write your own custom transformers and place them in a pipeline
you can have your model as the last estimator in the pipeline
or you could have it separate from the transformation pipeline
what do you mean by unbalanced?
@austere moth
 fallen plume
I know this question isn’t elaborated as much but if anyone knows how to add a flag to a list that increments it by +1 for each flagged value. Like [1,1,2,1,2] changes to [1,1,2,2,3]
austere moth
@high badge, 98,6% of goods, 1,4% of bads...
high badge
goods as in?
austere moth
The majority class... it's a binary classification problema. These are the non delinquent ones and I want to predict the delinquents
high badge
oh i see
austere moth
First, I created a list of dictionaries to gather the method name, the method itself and some parameters, like you will see below:
techniques = [{'label': 'Random Under Sampling (RUS)',
'technique': RandomUnderSampler(random_state=42),
'grid_params': {'sampling_strategy': [1, 2, 3, 4, 5, 6 ,7, 8, 9, 10]}},
          {'label': 'Repeated Edited Nearest Neighbours (ENN)',
           'technique': RepeatedEditedNearestNeighbours(random_state=42),
           'grid_params': {'sampling_strategy': list(range(1, 9, 2))}},

          {'label': 'Random Over Sampling (ROS)',
           'technique': RandomOverSampler(random_state=42),
           'grid_params': {'sampling_strategy': list(np.arange((counts[1]/counts[0])+0.01,1.21,0.25))}},

          {'label': 'Synthetic Minority Over-sampling Technique (SMOTE)',
           'technique': SMOTE(random_state=42),
           'grid_params': {'sampling_strategy': list(np.arange((counts[1]/counts[0])+0.01,1.21,0.25))}},

          {'label': 'Adaptive Synthetic (ADASYN)',
           'technique': ADASYN(random_state=42),
           'grid_params': {'sampling_strategy': list(np.arange((counts[1]/counts[0])+0.01,1.21,0.25))}},

          {'label': 'SMOTE+ENN (SMOTEEN)',
           'technique': SMOTEENN(random_state=42),
           'grid_params': {'sampling_strategy': list(np.arange((counts[1]/counts[0])+0.01,1.21,0.25))}}#,

          # {'label': 'Class weighting',
          #  'technique': ...(random_state=42),
          #  'grid_params': {'t__sampling_strategy': class_weights}}
          ]
Afterwards, I did something similar to each sklearn model:
models = [{'label': 'Logistic Regression',
'clf': LogisticRegression(random_state=42),
'grid_params': {'C': np.logspace(-3,3,7),
'penalty': ['l1', 'l2']}},
      {'label': 'K-Nearest Neighbors',
       'clf': KNeighborsClassifier(),
       'grid_params': {'n_neighbors': np.arange(8)+1}},

      {'label': 'Decision Tree',
       'clf': DecisionTreeClassifier(random_state=42),
       'grid_params': {'criterion': ['gini', 'entropy'],
                       'max_depth': [4, 5, 6, 7, 8]}},

      {'label': 'Random Forest',
       'clf': RandomForestClassifier(random_state=42),
       'grid_params': {'n_estimators': np.arange(10, 100, 10),
                       'criterion': ['gini', 'entropy'],
                       'max_depth': [4, 5, 6, 7, 8]}},

      {'label': 'SVM',
       'clf': SVC(probability=True, random_state=42),
       'grid_params': {'C': [0.1, 1, 10, 100, 1000],
                       'gamma': [1, 0.1, 0.01, 0.001, 0.0001],
                       'kernel': ['rbf']}}
      ]
!code
 arctic wedgeBOT
Here's how to format Python code on Discord:
```py
print('Hello world!')
```
These are backticks, not quotes. Check this out if you can't find the backtick key.
chilly geyser
I think class weighting is the most general of the methods you described
austere moth
I ran all of them, but through a very repetitive approach; the class weight method didn't performed well...
chilly geyser
fallen plume
I know this question isn’t elaborated as much but if anyone knows how to add a f...
Just use another list?
austere moth
How can I share in the code format?
I tried !code before the code, but it didn't work...
(Sorry, it's my first time here)
austere moth
techniques = [{'label': 'Random Under Sampling (RUS)',
               'technique': RandomUnderSampler(random_state=42),
               'grid_params': {'sampling_strategy': [1, 2, 3, 4, 5, 6 ,7, 8, 9, 10]}},

              {'label': 'Repeated Edited Nearest Neighbours (ENN)',
               'technique': RepeatedEditedNearestNeighbours(random_state=42),
               'grid_params': {'sampling_strategy': list(range(1, 9, 2))}},

              {'label': 'Random Over Sampling (ROS)',
               'technique': RandomOverSampler(random_state=42),
               'grid_params': {'sampling_strategy': list(np.arange((counts[1]/counts[0])+0.01,1.21,0.25))}},

              {'label': 'Synthetic Minority Over-sampling Technique (SMOTE)',
               'technique': SMOTE(random_state=42),
               'grid_params': {'sampling_strategy': list(np.arange((counts[1]/counts[0])+0.01,1.21,0.25))}},

              {'label': 'Adaptive Synthetic (ADASYN)',
               'technique': ADASYN(random_state=42),
               'grid_params': {'sampling_strategy': list(np.arange((counts[1]/counts[0])+0.01,1.21,0.25))}},

              {'label': 'SMOTE+ENN (SMOTEEN)',
               'technique': SMOTEENN(random_state=42),
               'grid_params': {'sampling_strategy': list(np.arange((counts[1]/counts[0])+0.01,1.21,0.25))}}#,

              # {'label': 'Class weighting',
              #  'technique': ...(random_state=42),
              #  'grid_params': {'t__sampling_strategy': class_weights}}
              ]
Yes
austere moth
So, this is the first list of dictionaries. For each balacing method/technique I have these parameters
models = [{'label': 'Logistic Regression',
           'clf': LogisticRegression(random_state=42),
           'grid_params': {'C': np.logspace(-3,3,7),
                           'penalty': ['l1', 'l2']}},

          {'label': 'K-Nearest Neighbors',
           'clf': KNeighborsClassifier(),
           'grid_params': {'n_neighbors': np.arange(8)+1}},

          {'label': 'Decision Tree',
           'clf': DecisionTreeClassifier(random_state=42),
           'grid_params': {'criterion': ['gini', 'entropy'],
                           'max_depth': [4, 5, 6, 7, 8]}},

          {'label': 'Random Forest',
           'clf': RandomForestClassifier(random_state=42),
           'grid_params': {'n_estimators': np.arange(10, 100, 10),
                           'criterion': ['gini', 'entropy'],
                           'max_depth': [4, 5, 6, 7, 8]}},

          {'label': 'SVM',
           'clf': SVC(probability=True, random_state=42),
           'grid_params': {'C': [0.1, 1, 10, 100, 1000],
                           'gamma': [1, 0.1, 0.01, 0.001, 0.0001],
                           'kernel': ['rbf']}}
          ]
Cause I have a binary problem that is usually solved with logistic regression
Now I'll share the "main" code and the desired output in the sequence...
chilly geyser
Honestly
No need
Basically, are you measuring the methods by AUC?
If you still get poor AUC
Then well there's not much you can do
austere moth
I couldn't paste them here because it has more than 2000 characters
chilly geyser
Sometimes the data simply does allow you to solve a problem 'better' than a certain score
austere moth
I'm using different measures
austere moth
It calculates everything, the problem is how to link the methods with the sklearn models. If I try manually, with no automation, works. Otherwise, it returns errors, but actually, I don't know exactly how to fit them
chilly geyser
That sounds like a coding issue than a DS issue
You only need to code it out once anyway
austere moth
Yes, and I have no clue how to do it...
chilly geyser
Instead of trying all methods
I recommend you try to solve it with RF with AUC aka AUROC
Then you progressively try the other methods
It's better to have one thing working first
Than to try everything
 sand crane
I can't seem to get my regression line to show using plotly
I believe I have plotted everything correctly yet when I run and show my figure the regression line isn't plotted (yet it shows in the legend)
austere moth
chilly geyser
Than to try everything
I agree...
But my concern is how to link them
If I try through a pipeline, I got an error...
If I try through a for loop, I can't apply the parameters for the unbalancing method
austere moth
sand crane
I believe I have plotted everything correctly yet when I run and show my figure ...
Try using seaborn regplot
sand crane
# Open and read the training .csv file
data_frame = pandas.read_csv('data\\pre-processed\\total_number_of_crashes_yearly.csv')

# Set train, test split on dataset and randomize data
X_train, X_test, y_train, y_test = train_test_split(data_frame['Year'], data_frame['Crashes'], test_size = 0.2, random_state = 42)

X_train_data_frame, X_test_data_frame = pandas.DataFrame(X_train), pandas.DataFrame(X_test)

# Set polynomial degree to 3
poly = PolynomialFeatures(degree = 3)

X_train_poly, X_test_poly = poly.fit_transform(X_train_data_frame), poly.fit_transform(X_test_data_frame)

poly.fit(X_train_poly, y_train)

model = LinearRegression()

# Fit training data
model.fit(X_train_poly, y_train)

prediction = model.predict(X_test_poly)

# Print r-squared score of model (determines the models accuracy)
print('R2 Score: ', metrics.r2_score(prediction, y_test))

# Print mean-absolute error (determines models average predication error)
print('MAE:', metrics.mean_absolute_error(prediction, y_test))

# Plot model and training data
fig = px.scatter(data_frame, x = 'Year', y = 'Crashes')

# Add to plot predicted values
fig.add_traces(go.Line(x = X_train_poly, y = prediction, mode = 'lines', name = 'Model'))

fig.show()
Here is my code, I can't seem to understand where I have gone wrong
chilly geyser
austere moth
If I try through a for loop, I can't apply the parameters for the unbalancing me...
Why not?
austere moth
sand crane
Here is my code, I can't seem to understand where I have gone wrong
I don't know if it could help you, but once worked for me: https://seaborn.pydata.org/generated/seaborn.regplot.html
chilly geyser
austere moth
If I try through a for loop, I can't apply the parameters for the unbalancing me...
You can try a wrapper with optional kwargs of some kind
austere moth
chilly geyser
Why not?
'cause I only know how to instantiate the method and to apply the fit_resample, but no how to pass it hyperparameters
chilly geyser
from statistics import variance as var
data = [2.75, 1.75, 1.25, 0.25, 0.5, 1.25, 3.5]
var(data)  # gives 1.3720238095238095
d = {"xbar": 1}
var(data, **d)  # gives 1.8020833333333333
var(data, 1)  # gives 1.8020833333333333
^That assumes they accept the same kwargs though
You might want to do something more fancy
to handle if things don't accept the same kwargs
chilly geyser
It's basically just a coding thing
You might want to try the advent of code
To improve your general python skills
austere moth
Is it a channel?
chilly geyser
austere moth
Yep, just found it
chilly geyser
It's puzzles
Lots of people will post their solutions
Anything fancy or short, you could check out
Anyway, code improvement is continual
It generally doesn't 'stop'
austere moth
I see that heheh
For me, mainly when it comes to visualization
My plots were the poorest
Now they have improved a bit hehe
Thanks for the attention
I'll keep trying
chilly geyser
Yeah basically I think for you, the biggest improvement you could consider is **args and using dict or namedtuple to put into arguments of functions
then a lot of generalisation and looping can be done
austere moth
I'll make a try
fallen plume
chilly geyser
Just use another list?
I’ve been looking at that. I just need to understand how to increment after the first flagged value. I feel like I’m so close 😅
chilly geyser
'First'?
lapis sequoia
Greetings, I am stuck on NLP for Amharic using spaCy. Looking at Thai for example, I notice they use their own tokenizer. How can I go about creating one for Amharic?
https://github.com/PyThaiNLP/pythainlp
Thanks
noob to the NLP world
 daring crag
im using selenium and i have a problem with it, if someone is able to help me at zinc i would be very grateful
 languid dagger
numpy newbie looking for help on indexing. I have an array of shape (m, n, 3) which represents an (m x n) array of 3d points. I want to create a boolean array of shape (m, n) which is true whenever the vector at that position is (0,0,0). I understand how arr == val gives a boolean array indexing the elements that are equal to val, for scalar values. But I'm having trouble generalizing it to finding vector values. The naive thing I tried, arr == [0,0,0], gives me an array of shape (m, n, 3) with true everywhere any coordinate is zero.
velvet thorn
languid dagger
`numpy` newbie looking for help on indexing. I have an array of shape (m, n, 3) ...
(a == 0).all(axis=2)
languid dagger
Thank you!
astral path
I have a quick question about feature scaling
if one of my features is something like the loudness of an audio file at different frames, it would be represented as an array of integers
The arrays are already somewhat scaled because the audio files which I am using as examples have all been limited to peak at 6db, so do I need to scale the features again?
opaque stratus
Hey guys --> I bought this SSD for storage, and so now I have a separate harddrive on my laptop called D: --> BASICALLY what I want to do is to create a deep learning environment on it, where I can download CUDA, the necessary python libraries, and Anaconda --> is that possible to have it all setup on this separate drive?
 shy star
what do you guys think of this concept?
AI o11y
For monitoring real-time metrics from models over time
 shell berry
Anyone good at pytorch/pytorch lightning?
serene scaffold
I'm rewriting an OOP-approach I made to storing binary classification scores to just use dataframes. So I have a dataframe with the columns (class, tp, fp, tn, fn). It should be pretty to translate that into a dataframe of (class, precision, recall, f1), but I feel like that must already be a thing?
serene scaffold
import pandas as pd

data = [['bob', 4, 5, 6, 7], ['jane', 1, 4, 7, 8]]
data = pd.DataFrame(data, columns=['tag', 'tp', 'fp', 'tn', 'fn'])

def calculate_scores(counts: pd.DataFrame) -> pd.DataFrame:
    scores = counts.apply(
        lambda x: [
            x['tag'],
            x['tp'] / (x['tp'] + x['fp']),  # precision
            x['tp'] / (x['tp'] + x['fn'])  # recall
        ],
        axis=1
    )
This appears to be creating a dataframe with lists in each row. So I clearly don't understand how apply works
velvet thorn
uh.
@serene scaffold you don't need apply
precision = df['tp'] / (df['tp'] + df['fp'])
same for recall and f1, then pd.concat
or do you want to do it within one call...?
serene scaffold
@velvet thorn it doesn't need to be one call, no. I was already planning to do f1 as a separate calculation
Well, a separate statement, I should say
velvet thorn
if you want to use apply
check out the result_type parameter of apply
that should answer your questions
serene scaffold
@velvet thorn this does what I wanted
def calculate_scores(counts: pd.DataFrame) -> pd.DataFrame:
    precision = counts.tp / (counts.tp + counts.fp)
    recall = counts.tp / (counts.tp + counts.fn)
    f1 = 2 * (precision * recall) / (precision + recall)
    df = pd.concat((counts.tag, precision, recall, f1), axis=1)
    df.columns = ['tag', 'precision', 'recall', 'f1']
    return df
thanks!
serene scaffold
Is there a procedure for documenting what properties a DataFrame needs to have to be a valid input for a function?
astral path
when using numpy
I'm trying to use k-means clustering on a dataset using this code
model = sklearn.cluster.KMeans(n_clusters=2)
labels = model.fit_predict(featureSet)
now, featureSet is a numpy array of n lists where n is the # of features, and each list contains feature n for m examples. Some features are lists themselves, but I don't know if that's a problem in and of itself. after running this code, I get the error:
ValueError: setting an array element with a sequence.
Is this because I'm trying to run k-means with list features? how should I fix it?
 shy ember
if i have a scatter plot like this with 36 points is it possible to group them into 4 new points based on how similar they are to eachother e.g. the bottom left would become a single point something close to x = 490, y = 205
velvet thorn
serene scaffold
Is there a procedure for documenting what properties a DataFrame needs to have t...
not really AFAIK
velvet thorn
astral path
I'm trying to use k-means clustering on a dataset using this code
```python
mode...
...why do you have an array of lists?
why is your dataset like that, actually?
velvet thorn
shy ember
run clustering
and plot the result
with the new x and y being the centroids
velvet thorn
astral path
im new to python
what does array.dtype say?
astral path
featureSet = [[[] for i in range(5)] for j in range(1)]
this is the initialization, and then i have a diff section that adds data to them
lemme check
AttributeError: 'list' object has no attribute 'dtype'
maybe i used it wrong?
velvet thorn
yes
shy ember
@velvet thorn is it possible if i dont know the number of clusters beforehand?
velvet thorn
shy ember
<@!171929073063297024> is it possible if i dont know the number of clusters befo...
yes, why no
t
use a clustering method that doesn't require you to specify that
 burnt island
i have a (1,18) shaped tesnor and the next line on the example uses tensor.shape(1) and i dont understand what it achieves really
versus flatten which again id assume would just make it 1D so why use shape(1) versus .flatten anyone know?
hushed wasp
Can someone please help me just configuring xlim and ylim in this graph please :
# Instantiate the linear model and visualizer
model = Ridge()
visualizer = ResidualsPlot(model)
visualizer.fit(X_train_std, y_train) # Fit the training data to the visualizer
visualizer.score(X_test_std, y_test) # Evaluate the model on the test data
visualizer.show() # Finalize and render the figure
``` slim glen
I'm not sure if this is the right channel. But what is the best library for visualizing graph
 languid tide
how to connect kali linux to wiifi using dual boot?
 toxic fiber
@slim glen I don't know about best, but matplotlib is the standard
languid dagger
In numpy, if i have two arrays whose elements are 3-vectors, say both have shape (100,3), how do I ask for the pairwise dot products? Like what [np.dot(array_1[i], array_2[i]) for i in range(100)] would give, but efficiently?
toxic fiber
that's technically matrix multiplication at that point unless you do as you've done and just treat it as a list of dot multiplications
you can use matmul
languid dagger
The output should have shape (100,) or (100,1). Maybe it's the diagonal of the matrix product of one array with the transpose of the other, but that seems wasteful. And it seems like there must be a way to tell numpy to this with any old function of two 3-vectors and I'm just too new to know it.
 odd yoke
that'd be the diagonal of matmul actually with [np.dot(array_1[i], array_2[i]) for i in range(100)]
using * and np.sum would probably be more efficient than np.diag(x @ y.T)
languid dagger
I had hoped I could just pass axis=1 to np.dot but that's not a thing.
 dense viper
Hello anyone can suggest me the library of python for image processing in which algorithm should remove backgroung of image
odd yoke
you could also use np.einsum but I find it a bit cryptic tbh
nvm i can't do it using np.einsum, too hard for me
languid dagger
Okay, so it looks like np.sum(array_1*array_2, axis=1) does the trick for this specific case, but is there no general vectorized way to do this? Let's say I have two arrays with shape (a,b,c,d), and I have a function F(u,v) which takes arguments of shape (c,d), and I want an array of shape (a,b) whose elements are the values of F(A[i,j], B[i,j])?
serene scaffold
    return reduce(
        lambda x, y: x.add(y),
        (measure_ann_file(gold, system, mode=mode)
         for gold, system in zip_datasets(gold_dataset, system_dataset))
    )
I'm looking into how to do what I'm trying to separately, but if anyone wants to give me a hint, I have a dataframe of (str, int, int, int, int) and I want to add the numeric columns along the string column. So if two dataframes have a matching string column, add all the integer cells in that row in the new dataframe. Or append the row underneath if it isn't in the left dataframe.
I could probably throw something together but I assume there's an idiomatic solution.
might just need to be x.add(y, axis='tag') where 'tag' is the name of the string column.
toxic fiber
I guess I would have used a dictionary with the str as the key
lapis sequoia
Hello
 warm bridge
Any idea why this code is giving me this error
 lament fjord
Anyone any idea how to fix this? 'Kan opgegeven module niet vinden.' means cant find module you entered
I get this when I try to run my project, it uses speech_recognition and pyttsx3, been trying to fix this for a couple hours now
toxic fiber
@lament fjord do you use pip?
lament fjord
yes
toxic fiber
try pip (or pip3) install win32api ?
toxic fiber
you may have to install something from the OS side so that the appropriate DLL (a windows thing) is in place
lament fjord
Where/How do I do that?
toxic fiber
what version of python are you on?
lament fjord
requirement already satisfied, so should be installed
toxic fiber
there's also pypiwin32
lament fjord
also already satisfied
toxic fiber
so probably conflict with 64 bit python
lament fjord
I guess
toxic fiber
I had a lot of issues with that using python on windows until I switched to windows subsystem for linux
or you can install 32 bit python and use that for any 32 bit modules
I also found using anaconda was helpful for windows before WSL
toxic fiber
you can double click install anaconda than use anaconda to manage modules, that may not overcome this issues though.
but Anaconda provides all the basic modules you need for most data science stuff in python
lament fjord
Yeah I'm trying to build my own assistent
like Alexa
but with commands like Turn the lights off
toxic fiber
Yeah, I'd totally consider something like WSL or a pure linux box
lament fjord
Alright
 torpid cave
warm bridge
Any idea why this code is giving me this error
torpid cave
warm bridge
Any idea why this code is giving me this error
Hi, it is because how you assign values. It is not an error itself but you should be using .loc to assign data
astral path
im trying to use kmeans to cluster together different audio files. However, some of my features are arrays and the scikit-learn kmeans clustering appears to be having issues with that given the error I get:
ValueError: setting an array element with a sequence.
Any ideas how to get around this ???
model = sklearn.cluster.KMeans(n_clusters=2)
labels = model.fit_predict(featureSet)
I get the error at model.fit_predict(featureSet)
and featureSet is a numpy array with the features in it
warm bridge
Thank u
astral path
do I need to have each frame element in the array features as its own feature??
or make new, say, 10 new features containing the mean for each 1/10th of the array features?
heady hatch
astral path
do I need to have each frame element in the array features as its own feature??
How are you representing each audio file? What are you trying to cluster about the fields?
Are you clustering the actual sequence of sounds or the fields about the file?
astral path
heady hatch
How are you representing each audio file? What are you trying to cluster about t...
i have 5 features: zero-crossing rate (integer), energy (sequence, correlates with loudness), spectral centroid (sequence, basically the mean pitch of a specified frame), spectral bandwidth (sequence, spread of harmonic content at a frame), and file name
im trying to cluster based on those 5 features
this is the full code
heady hatch
astral path
https://hastebin.com/imekoneqom.properties
Can you show me a slice of the data?
astral path
sure, it's long though
heady hatch
Like a row.
astral path
yeah ik
heady hatch
Hmm it’s long?
Are you doing any kind of transformations? Because it doesn’t sound like any kind of suitable format for models unless you have transformation in your models.
astral path
the bandwidth, energy, centroid arrays are long
heady hatch
You’re going to need to break those arrays apart.
Each of your feature needs to be some kind of numeric representation.
astral path
so it doesn't automatically compare two arrays?
[0.0 1730
 array([1.02634067e+02, 1.01491240e+02, 6.75483104e+01, 7.73604139e+01,
       7.22419384e+01, 3.90480937e+01, 1.11578859e+01, 7.45664096e-01,
       2.33533706e-02, 1.24861376e-03, 3.61131703e-05, 1.69974795e-06,
       5.94364416e-07, 5.08971402e-07, 4.64314489e-07, 3.16401867e-07,
       2.39241838e-07, 2.42190340e-07, 2.32921902e-07, 1.99231399e-07,
       1.85335933e-07, 2.24643105e-07, 2.32323980e-07, 1.91145060e-07,
       1.85058005e-07, 2.14211695e-07, 2.05985613e-07, 2.00248483e-07,
       2.26897786e-07, 1.69324112e-07, 4.96620149e-08, 0.00000000e+00,
       0.00000000e+00, 0.00000000e+00, 0.00000000e+00, 0.00000000e+00,
       0.00000000e+00, 0.00000000e+00, 0.00000000e+00, 0.00000000e+00,
       0.00000000e+00, 0.00000000e+00, 0.00000000e+00, 0.00000000e+00,
       0.00000000e+00, 0.00000000e+00])
 array([[ 816.46548346,  724.68007371,  579.75804218,  269.14919941,
         204.66365525,  320.47656745, 1142.15960187, 3829.36544861,
        3951.21016313, 4001.53996045, 3922.89961858, 3822.382902  ,
        3924.94568584, 3861.05755276, 2869.55637201, 1898.91621979,
        1735.39316981, 1845.43534705,    0.        ,    0.        ,
           0.        ,    0.        ,    0.        ]])
 array([[1495.34796295, 1658.36720063, 1681.28799868,  920.08623524,
         741.14717472, 1125.73886711, 2377.73600903, 3312.22624616,
        3293.82863475, 3337.23004716, 3304.67269661, 3281.90606313,
        3342.88321138, 3430.96725631, 3234.78106361, 2632.53224225,
        2493.48818132, 2535.06120148,    0.        ,    0.        ,
           0.        ,    0.        ,    0.        ]])
 b'Yoko Kick.wav']
here's some of the data, its not as long as I thought
lapis sequoia
Is it only me or you guys also google codes all the time
astral path
codes?
lapis sequoia
like for when you forgot or don't know how to write something e.g., ([col for col in profit.columns if col in profit.columns blah blah
because I'm so poor at remembering shit
 feral spoke
Guys I have tried self learning but sometimes it feels like I keep getting stuck and not moving forward or finding people to ask real questions/doubts.
I think like if there was some sort of Mentor or someone to guide me throughout it,it would be really useful.
Not to sound selfish but I'm looking for a mentor and we can exchange our knowledge.
If someone is interested in this kindly tag or dm me.
My background is in Mechanical Engineering. We can talk and see where it goes from there.
trim oar
lapis sequoia
Is it only me or you guys also google codes all the time
Even the top does it. So don't worry.
lapis sequoia
thanks I'm relieved xD
 wide cape
hey
hey, how do I do to make a model that also takes colors with tf?
I'm already doing a Sequential() model but it only takes b&w data
 molten hamlet
I can't change Axis colors in matplotlib 3d plot :/
lapis sequoia
You can
molten hamlet
lapis sequoia
You can
How?
wide cape
wide cape
hey, how do I do to make a model that also takes colors with tf?
please ping me if you answer
molten hamlet
wide cape
please ping me if you answer
what
what do you mean colors?
add nodes to input
or make tensorboard
wide cape
molten hamlet
what do you mean colors?
yeah sorry I was not precise enough
I'm doing a model that takes a 28*28 black & white image
no each pixel value is between 0 and 255
but now each pixel is a RGB tuple, how do i do?
 weak solstice
hwelp does anyone know what a continuos action space is vs a discrete action space for rl
 hollow scarab
anyone knows how I could plot this to a histogram where the A-B-C-D-E-F are on the x axis, and the total_cases on the y?
df6.plot.hist(y='total_cases')
this is what I get using this code
this is what I want to get at the end
trim oar
hollow scarab
You're not looking for a histogram, but a bar graph. A histogram is used to find distribution.
hollow scarab
ah, I will try it with a bar, thank you @trim oar
this one worked, thanks a lot
I have no clue why I wanted a histogram lol
serene scaffold
I want to do this addition-like operation between an arbitrary number of dataframes:
     A     B
x    1     2
y    3     4
z    5     6

     A     B
x    7     8
z    9    10
p    11   12

Combine these into...
     A     B
x    1+7   2+8
y    3     4
z    5+9   6+10
p    11    12
The order of the rows doesn't necessarily matter as long as addition is only performed along like rows.
It doesn't seem that pandas natively supports this. The best solution I've found so far is to do a database-style join operation to create one table and then do a pivot operation.
odd yoke
@serene scaffold df1.add(df2, fill_value=0) does that not work ?
serene scaffold
odd yoke
<@!253696366952316929> `df1.add(df2, fill_value=0)` does that not work ?
I tried that and I think it was doing string concatenation along the left column. Which also means it wasn't paying any attention to what the left column is when deciding which rows to add.
odd yoke
oh you have stuff other than ints
wait no, you have x y z as a column ?
not as indices ?
I'm not sure I get what you meant
import pandas as pd
df1 = pd.DataFrame({'A':[1, 3, 5], 'B':[2, 4, 6]}, index=list("xyz"))
df2 = pd.DataFrame({'A':[7, 9, 11], 'B':[8, 10, 12]}, index=list("xzp"))
print(df1.add(df2, fill_value=0))
```this code gives me``` A B
p 11.0 12.0
x 8.0 10.0
y 3.0 4.0
z 14.0 16.0``` noble summit
Is there anyone who had some experience with confirmatory factoring analysis? I have been getting this error and could not fix it due to lack of experience: ValueError: shapes (59,59) and (51,51) not aligned: 59 (dim 1) != 51 (dim 0)
serene scaffold
!e
import pandas as pd
df1 = pd.DataFrame({'A':[1, 3, 5], 'B':[2, 4, 6]}, index=list("xyz"))
df2 = pd.DataFrame({'A':[7, 9, 11], 'B':[8, 10, 12]}, index=list("xzp"))
print(df1.add(df2, fill_value=0))
@serene scaffold :white_check_mark: Your eval job has completed with return code 0.
001 |       A     B
002 | p  11.0  12.0
003 | x   8.0  10.0
004 | y   3.0   4.0
005 | z  14.0  16.0
@odd yoke so it does! Thanks for writing that out.
 rich reef
Hi, I have a pretty specific question about Gurobipy if anyone's available and familiar with the program. Normally I'd ask in one of the help channels but I figure this is too specific for those channels to be helpful.
I have a objective function sum(A[i,j]+B[i,j] for all i in V for all J in V).
A[i,j] and B[i,j] are both defined using a pretty similar third linear expression Ci,j, which behaves more like a function. I just want it to simplify the other linear expression.
How could I define such a 'helper function' in a way that Gurobipy actually accepts it?
trim oar
hollow scarab
I have no clue why I wanted a histogram lol
You're welcome! I used to mix them up, so I definitely can feel you.
 earnest forge
so cost and loss are the same in most Gradient Descent algorithms? as I saw, different people like to also refer to it using different names: loss either cost. So i feel confused is it actually the same?
 versed reef
hello all, I have two csv files and I want to combine them in pandas.
 stray owl
Combine them like a join or like a union?
versed reef
I have pd.read_csv('filename.csv_1') and the same for filename.csv_2 and they both look fine rows/column wise
I am sorry for the lack of context, long day with extra curriculars but I want to append the two
lapis sequoia
you just said "I am sorry for the lack of context, long day with extra curriculars but I want to append the two"
stray owl
You are going to want to use the pandas library. Are you familiar with that library?
versed reef
This is what I have, I just want to know if I can combine them to the same name like 'jobs_github.csv'
versed reef
ok so it looks like I am on a similar track.
stray owl
but you're missing a step
df1 = pd.read_csv(/filepath)
df2 = pd.read_csv(/filepath2)
newdf = pd.concat([df1,df2])
versed reef
I don't know why I get so confused when they talked about file paths but.. I had at one point "import glob" path = r'My-Project'/
I am going to work with it a little thanks irgids.
stray owl
It looks like your read_csv lines have the correct relative filepaths.
versed reef
I have to more research on the relative file paths and such. It seems like I jumped down a rabbit hole with UNIX stuff when I did. lol
just out of curiosity if in the before my above screen shot.. I had result = pd.Dataframe(all_data)
result.to_csv('Jobs_gitHub.csv')
wouldn't I have to place the concat before my screenshotted stuff?
stray owl
Do you want the answer or do you want to work on it some more.
versed reef
lol with the amount of time invested I feel like I almost almost there but the long wait for Covid test wore me out today ... and I am mentally out of it.
 unique viper
I feel like this should be an easy thing to do, but I can't for the life of me figure out how to plot 4 plots on top of eachother with matplotlib/seaborn. My goal is to have 4 line graphs fit to a 480x800 screen with no decorations, and swap out there data with updated data quickly. So far I've gotten...I think all of these working on their own at some point but changing any one arbitrary thing seems to break the entire plotting library. Starting with stacking them, I'm making a subplot with _, axs = plt.subplots(4,1) for 4 rows and making 4 plots with seaborn.lineplot(data=list(range(500)), ax=axs[i]). It seems to make the graphs if I comment everything else out, except it doesn't actually draw the data
versed reef
answer please and thank you 🙂
stray owl
import pandas as pd
df1 = pd.read_csv('Jobs_GitHub.csv')
df2 = pd.read_csv('indeed_results.csv')
bigframe = pd.concat([df1,df2])
bigframe.to_csv('bigframe.csv')
versed reef
This is what I have correct, but I feel I amwrong
stray owl
I believe this code should be everything you need.
I think you want to print(result)
not print(all_data)
versed reef
hey Irgids I am appreciative of all your help but should I have included the content from my first screenshot?
lapis sequoia
Jupyter Notebook in VSCode = 🔥
versed reef
yea I am still such a noob with it however. Especially with this project, professors have been especially hard with workload and application-->theory.
lol your name is hilarious.
versed reef
@lapis sequoia finance unfortunately lol what about you?
versed reef
ahhh I wish I would have gotten into engineering, my math base wasn't that strong however.
lapis sequoia
tbh I barely know anything lol
stray owl
@versed reef sorry, I don't know what you mean, "should I have included the content from my first screenshot?" My major was Finance as well.
 jade walrus
Are there scalability problems like if too many people, say more than 100, people access the Jupyter website at the same time, the website will slow down to become unusable?
It is much easier to use Jupyter as front-end app than writing ReactJS, Angular web app.
versed reef
I figured it out @stray owl I believe lol..
 deft harbor
@jade walrus use binder or colab
velvet thorn
jade walrus
Are there scalability problems like if too many people, say more than 100, peopl...
honestly I've never heard of anyone doing this
I...don't know TBH
but there must be some reason, right
I mean...I don't think it's meant to be used as a webserver
jade walrus
deft harbor
<@439794653030514688> use binder or colab
do I need to pay to use binder or colab? Are they free?
stray owl
if you are ok with google having your code, colab is free
jade walrus
I'm nobody. Google won't be bothered with my code. If they do, it's my honour. 😋
deft harbor
You can use up your time on colab
Its like $9 a month for the premium plan though
Unless you are sharing a notebook where everyone is retraining a CNN, I wouldn't worry about it
 upbeat storm
I dont think there is a time limit on colab
Everything is free
Upgrades just give you more of what is already given
like more ram
and better gpu
more runtime
jade walrus
Can R language be used on Jupyter? Is Jupyter only for python?
https://docs.anaconda.com/anaconda/navigator/tutorials/r-lang/
Seems like possible but not sure how easy it is to use R
versed reef
is concatenating lists the same as pd.dataframes?
toxic fiber
@jade walrus I remember something called Sage a while ago that could adapt a lot of the scientific programming languages and it looked a lot like a jupyter workbook.
https://www.sagemath.org/

SageMath Mathematical Software System
SageMath is a free and open-source mathematical software system.
But it seems Jupiter has broader language support nowadays too:

The Jupyter Notebook is a web-based interactive computing platform. The notebook combines live code, equations, narrative text, visualizations, interactive dashboards and other media.
 lilac ferry
is this the correct place of latex related questions?
deft harbor
@jade walrus just use r studio
Umm, you can ask about latex, but its a python server

lilac ferry
xD
deft harbor
for person on phone:
    conversation.map(idontknowhatsgoingon)
 lone drum
Hello
Is there any server for , opencv?
lapis sequoia
Is that even a code lol
lapis sequoia
pip uninstall life
 nova lagoon
You probably have seen websites that generate html/css code or regex patterns, based on natural-language english input, using GPT2. GPT2 just gets an input text and generates text based on that, it doesn't map words to code or anything like that, it's basically just guessing the next word, so the questions is, how do they do that?
lapis sequoia
conda install universe
velvet thorn
nova lagoon
You probably have seen websites that generate html/css code or regex patterns, b...
long story short?
there's an internal state
that represents what has been seen
then each input word updates this state
eventually, when you want output...
...what is the most likely word, given the current state?
BASICALLY.
 verbal light
Do i need to add some non object areas in object detection program like Rcnn or leave it with just object images?
nova lagoon
velvet thorn
long story short?
that would be the explanation for gpt, but how this mechanism is used to map english text to things like code? like this: https://twitter.com/sharifshameem/status/1282676454690451457
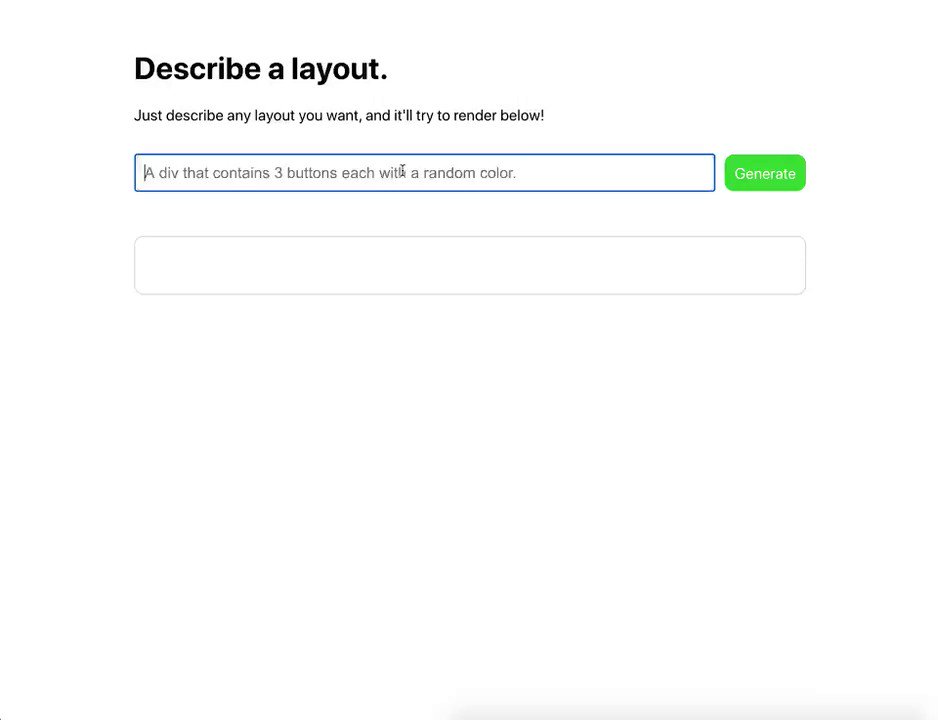

This is mind blowing.
With GPT-3, I built a layout generator where you just describe any layout you want, and it generates the JSX code for you.
W H A T https://t.co/w8JkrZO4lk
Retweets
11344
Likes
42319
 Twitter
·
lapis sequoia
Twitter
·
lapis sequoia
Real world project is so fun
velvet thorn
nova lagoon
that would be the explanation for gpt, but how this mechanism is used to map eng...
okay
so the thing is
text generation is basically a mapping of current state to token, right
you can think of translation as a mapping from state to state
 eager heath
I'd think that this one use a proper parse tree, otherwise it would be pretty hard to do that
velvet thorn
eager heath
I'd think that this one use a proper parse tree, otherwise it would be pretty ha...
probably
but then again...
Musings of a Computer Scientist.
this was done with just a character-level RNN (LSTM, specifically)
eager heath
Well, I'm pretty sure this hasn't been done with ML, there are way too many different possible outputs
 bronze skiff
@toxic fiber sage is a programming language for number-theoretic calculations (elliptic curves, etc)
 lament loom
have anyone heard about RASA-python library?
bronze skiff
you might be referring to cocalc, which is by the same company
toxic fiber
@bronze skiff you mean symbolic math?
Matlab and Mathematica can do symbolic math too, but afaik it's not all Sage is for (you can do anything you can do in scipy/matplotlib in Sage)
it's been about ten years since I've used it though
bronze skiff
i'm just saying that sage is mostly used in the number theoretic community vs the others
i.e i remember using it to compute group structures on hypoelliptic curves sometime back
toxic fiber
What I liked about Sage (10 years ago) is it took any syntax I was familiar with (e.g. matplotlib/python, MATLAB, R) so I could use properties from multiple languages.
I'm 100% python nowadays tho, so no need
bronze skiff
regardless, they have a jupyter fork called cocalc, which has a lot of support for multiple languages
but its killer app is it can do real time collab (something that's yet to come to jupyter)
toxic fiber
Yeah, I think that's new since my time
bronze skiff
even though cocalc is wonky in other ways
toxic fiber
ahh
looks like they got with jupyter
instead of wrestling with their own notebook
bronze skiff
yeah
i remember last year setting it up on kubernetes like jupyter hub and our ds teams ended up using it
it was not straightforward
though RTC was nice
toxic fiber
Yeah, I find notebooks a bit clunky in sensitive in general
they like to fail during their show time: live demos
my eng team won't even let us use CLI code on prod instances any more
bronze skiff
lol that sucks
i do wish notebooks auto-removes cell numbers after the kernel shuts down
so that i don't stupidly run a cell in the middle thjnking it still works
lapis sequoia
When can you use df.item vs df['item']?
 shut apex
Hi, I'm trying to change the scales of a catplot graph of seaborn to millions. I've been trying to use these examples from stackoverflow:
plt.yticks(fig.get_yticks(), fig.get_yticks() * 100)
plt.ylabel('Distribution [%]', fontsize=16)
or
plt.xticks([0, 200, 400, 600])
plt.xlabel('Purchase amount', fontsize=18)
But I get the following error:
AttributeError: 'FacetGrid' object has no attribute 'get_yticks'
I'm currently using python btw
serene scaffold
Are there any obvious circumstances that would cause a dataframe of int64s to become a dataframe of "objects" at the end of a longer process?
heady hatch
serene scaffold
Are there any obvious circumstances that would cause a dataframe of int64s to be...
Is it changing types at any point of the transformation?
ie
turn into string? Going through another dataframe where the feature is not set as int64, etc.
serene scaffold
heady hatch
Is it changing types at any point of the transformation?
ie
turn into string?...
It shouldn't be. Each dataframe is all int64, and then DataFrame.add casts everything to a float for some reason. Then later on I do this function where counts is the sum of all those dataframes:
    precision = counts.tp / (counts.tp + counts.fp)
    recall = counts.tp / (counts.tp + counts.fn)
    f1 = 2 * (precision * recall) / (precision + recall)
    df = pd.concat([precision, recall, f1], axis=1)
    df.columns = ['precision', 'recall', 'f1']
and by then the dtypes are "object" and not a numeric type.
I added a call to "as_type" and that fixes it. I think. https://github.com/swfarnsworth/bratlib/blob/dataframes/bratlib/calculators/relation_agreement.py#L70

GitHub
Contribute to swfarnsworth/bratlib development by creating an account on GitHub.
 warm moth
Any good tuts on how to read correlation heatmaps and matrices? Like the one in ProfileReport from pandas_profiling
warm moth
Is there a way to save the checkpoints created using keras in a folder? rn its just filling up my working dir
boreal summit
I'm so sad right now.
I'm currently reading a book that's divided into two modules. The second module has to do with Neural networks and Deep learning, which means I have to install Tensorflow.
Just found out after trying to install tf that I require a GPU on my PC. This was after reading up stuffs online.
Guess I'd have to pause for now and move on with scikit.
bronze skiff
you don't need a GPU for tensorflow
just pip install tensorflow and you're good to go
boreal summit
@bronze skiff I already tried to Pip install it, but it didn't work out which was why I went to read up the docs.
It also stated in the docs that you need a GPU.
boreal summit
Tensorflow official website.
Hold on, lemme screenshot
My laptop doesn't even have a GPU to begin with.
bronze skiff
i mean... tautologically, GPU support requires a GPU...
but tensorflow doesn't require a gpu...
you can install tensorflow without a gpu
do you know how to use virtualenv?
create an isolated virtual environment and pip install tensorflow there
boreal summit
I've also tried to install it in a virtual environment but it's not working. @bronze skiff
At first, I thought it was cause I had python 3.9 installed. So I downloaded 3.8, created a venv and tried installing but it's still not working. That was when I checked out the GPU and stuff.
bronze skiff
what was the error you're getting
none of your errors should have anything to do with a lack of gpu
boreal summit
I've gone outing ATM, I'll update you when I get back home.
opaque stratus
Hey guys. I plan to scrape a bunch of tweets for a machine learning project, though, the only direction I have in mind is sentiment analysis. Does anyone else have any cool suggestions or topic ideas? I am having trouble thinking of an adequate project. Please @ me 🙂
bronze skiff
@boreal summit you fix it yet
boreal summit
Lemme run it now.
@bronze skiff Error: could not find a version that satisfies the requirements of Tensorflow.
Error 2, no matching distribution found for Tensorflow.
I downloaded py version 3.8, still same thing.
I've installed stuffs using pip so it's not new to me.
I'll just save some money and get a new laptop late January which has a good GPU model that tf supports.
Thanks for your time.
bronze skiff
?? are you using a 64-bit version of python?
boreal summit
Yea
bronze skiff
you don't need a gpu for tensorflow
velvet thorn
what command are you running to install
bronze skiff
not sure how many times i gotta say this
boreal summit
Pip install Tensorflow.
I've also tried the installation method on the site thats long, still same thing.
velvet thorn
Windows?
boreal summit
Yea, I have version 3.8 installed already which I downloaded cause of this.
I also created a venv.
The laptop is HP elite book 8440p
boreal summit
Okay, lemme try it. I'll get back to you guys. Thanks.
 wintry olive
@velvet thorn whoa that's old school. I've figured out how to approach the idea already but yoo what a madman creating character dialog before Amazon Lex, wit.ai or google dialog. I've also figured out emotional states too.
wintry olive
The Unreasonable Effectiveness of Recurrent Neural Networks
Musings of a Computer Scientist.
 lean cobalt
is there a python equivalent of ggplot2 in R? i find matplotlib a bit confusing
boreal summit
@bronze skiff thanks man. I checked and noticed the interpreter was seeing Python 3.9 instead of 3.8, so I uninstalled it and left the 3.8.
I've installed tf on my PC. Once again, thanks.
@velvet thorn thanks man.
lapis sequoia
Greetings, anyone here using spaCy? I needed to add a new language to their model. But not sure how I can test my changes before submitting PR?
upbeat storm
Can a array of shape [1, 1, 1] be squeezed into [1]?
 tulip glen
I guess not
upbeat storm
Really?
tulip glen
You can do it using numpy
upbeat storm
That what i was asking : |
 hasty grail
upbeat storm
Can a array of shape [1, 1, 1] be squeezed into [1]?
hasty grail
upbeat storm
Can a array of shape [1, 1, 1] be squeezed into [1]?
You can
!e
import numpy as np
a = np.asarray([[[1]]])
print(a.shape)
b = np.squeeze(a, axis=(1, 2))
print(b.shape)
@hasty grail :white_check_mark: Your eval job has completed with return code 0.
001 | (1, 1, 1)
002 | (1,)
thanks
lapis sequoia
Hey There! I'm trying to use Selenium to select a radio button. But I'm having no luck. All other selectors have been completely fine.
driver.find_element_by_xpath('//*[@id="content_grid"]/div[1]/div[2]/div[4]/div[2]/div[3]/label/div[1]/input').click()
Any ideas? pls and thanks
lapis sequoia
hmm - I gave that a try but had no luck. I might be doing something wrong since I don't use the css_selector option often. Can I send you the page in question?
 torpid cave
Hmmm do you have inspector gadget?
lapis sequoia
yup!
torpid cave
Or how are you getting the xpath code?
lapis sequoia
Using the Chrome Inspector tool
lapis sequoia
Yup!
torpid cave
That's odd
Try going up one level
In the xpath
Or check if you are actually selecting the button that activates the request
One last thing is, if you are doing this for web scrapping then you might not need to recreate the webpage, just get the relevant query/request it sends and reproduce it from your side
lapis sequoia
Dang still not working
torpid cave
Damn
lapis sequoia
I wonder what's wrong...
torpid cave
Sorry that is as far as I go, I use Splah instead of Selenium
lapis sequoia
All good man, appreciate you trying to help anyways!
Might be better off going to SOF
astral path
I have a dataset that looks like:
[[0.0 1 1 ... 1 1 1]
 [0.0 list([10, 20, 30, 40]) list([10, 20, 30, 40]) ...
  list([10, 20, 30, 40]) list([10, 20, 30, 40]) list([10, 20, 30, 40])]
 [0.0 list([50, 60, 70, 90, 90]) list([50, 60, 70, 90, 90]) ...
  list([50, 60, 70, 90, 90]) list([50, 60, 70, 90, 90])
  list([50, 60, 70, 90, 90])]
 [0.0 4 4 ... 4 4 4]
 [0.0 b'11 - Kick.wav' b'808 super saturated.wav' ...
  b'US1 P Kick 001.wav' b'US1 P Kick 002.wav' b'Yoko Kick.wav']]
Earlier in the code, I looped over the data to attempt to change some of those features from, say, [...other data... [0.0 list([10, 20, 30, 40]) list([10, 20, 30, 40]) ... list([10, 20, 30, 40]) list([10, 20, 30, 40]) list([10, 20, 30, 40])] ...more data...] to [...other data... [10, 10, 10, 10] [20, 20, 20, 20]) ... [40, 40, 40, 40] ...more data...]
using
for element in featureSet:
    if type(element) is np.ndarray:
        element = np.transpose(element)
        element = *element,
However, this does absolutely nothing to the data, and I have no idea why this does nothing. Can anyone please help me figure this out?
Here is the full code: https://ideone.com/cQ2vJj (hastebin isn't working rn)
Cheers!
hasty grail
don't use type for type-checking
instead, use isinstance
but coming to your problem, in your for loop, you are overwriting a reference to element with a new reference
rather than overwriting the actual data referenced by element
astral path
i'll switch to isinstance
hasty grail
for loops should not be used to modify the sequence being looped through in question
astral path
that makes more sense
hasty grail
it would be better if you just constructed a new list along the way
astral path
hasty grail
`for` loops should not be used to modify the sequence being looped through in qu...
what should i use instead? some sort of map? im relatively new to python
how so?
hasty grail
new_lst = []
for orig_e in orig_lst:
    ...
    new_lst.append(new_e)
new list, yes
astral path
thank you, i'll go try it out
arctic wedgeBOT
Do you ever find yourself writing something like:
even_numbers = []
for n in range(20):
    if n % 2 == 0:
        even_numbers.append(n)
Using list comprehensions can simplify this significantly, and greatly improve code readability. If we rewrite the example above to use list comprehensions, it would look like this:
even_numbers = [n for n in range(20) if n % 2 == 0]
This also works for generators, dicts and sets by using () or {} instead of [].
For more info, see this pythonforbeginners.com post or PEP 202.
astral path
what if i'm looking to still add every element but only change certain ones?
hasty grail
in your case it would be [np.transpose(e) if isinstance(e, np.ndarray) else e for e in featureSet]
astral path
ah
hasty grail
np.transpose(e) if isinstance(e, np.ndarray) else e is one statement
then this result is appended to the list in each iteration of featureSet
astral path
could I just do *np.transpose(e), to unpack it too?
hasty grail
if you need to unpack then you can't use a listcomp
you'll need to build the list dynamically using a for loop as above
listcomp only allows you to add one element at a time
astral path
ok, i'll keep doing that then
is there a better way to do what i'm trying to do (making n arrays with the nth element of existing arrays within a given feature, and then making the n arrays features of the whole dataset)?
hasty grail
it would be better if your data was organized such that you wouldn't have to do this check in the first place
astral path
how should I organize it better?
hasty grail
can you explain why are some of the data lists while others are single elements?
astral path
sure
what i'm trying to do is loop through a folder of audio files and create a dataset containing different features of those audio files. The single element features are for features that are analyzed for the entire audio file(zero-crossing rate (integer), and file name (string)). The data list features are for features where I need to keep track of what the data point is through multiple time intervals (energy, spectral centroid, spectral bandwidth) similar to if I had an array keeping track of the loudness of each audio file at multiple different instants
what i'm doing the transposition for is to change from an array of arrays representing, say, the energy over time to an array of arrays representing the energy for each example at a specified time so I can analyze each frame's energy as a feature
hasty grail
You might want to look into pandas if you're looking to manage datasets that have different data types inside them, and your dataset isn't huge
astral path
does pandas have a k-means algorithm built in? or will I need to still use scikit-learns?
hasty grail
pandas is just for data organization
you'll need other libraries to run machine learning / regression algorithms on the data
astral path
ok, i've heard about pandas but i'll need to look more into it
thank you! I really appreciate the help with this
hasty grail
no problem
 tight torrent
Guys how do i make my python package install some other modules as well?
For example My Module has the discord module, when the user installs my MODULE it will also install the discord Module if its not there.
just an example dont really mean it
 twilit arch
How can I make a function based on sample data? I want it so that when I give a list of dict values like so: [{0.5: 15}, {0.7:20}], it would draw a graph based on that
lapis sequoia
use for loop
twilit arch
but I don't have the graph formula
warm moth
I just spent 2 hrs tryna install graphviz and it worked after i restarted my pc.
lapis sequoia
When do you use 'name' and .name? Is 'name' only used for columns?
 potent ravine
Can anyone help me with Pysyft ?
 lofty musk
What is the latest version on python
 jade chasm
Does anyone know what bias incurs when just imputing missing data by mean before using randomForest?
My google + stats skills fall short to answer this by comprehensive reading only 😉
 glacial rune
with a dataframe like this, how can I apply operations to columns num0 through to num4 if I only want to do it if the column 'txt' isin a list of strings e.g. ['xxx', 'yyy']
the output would be the original dataframe, but some rows (where 'txt' is in that list mentioned above), but with some rows modified based on that condition
df['num0'] = (df['txt'].isin(conditions)).apply(lambda x: x + 1)``` doesn't quite workit adds 2 to every column where the condition is met and 1 to every other column if the condition isn't met
glacial rune
figured it out:
conditions = ['xxx', 'yyy', 'zzz', 'total']

mask = df['txt'].isin(conditions)
df.loc[mask, 'num0'] = df.loc[mask, 'num0'].apply(lambda x: x + 1)
 scarlet mesa
Hello!
Does anyone have recommendations on how to parse video transcript data into digestible paragraphs? Input is a 400+ lines of conversation in a string, that want to show on a front-end and trying to figure out what packages might already exist to handle this kind of problem. This is not a summerization, just trying to find natural breaks to chunk out the text.
If needed, I can include a snippet of text - it is just large and don't want to disturb the overall chat.
 ocean dawn
Hey guys, is this channel a good choice to leave it here? https://dasha.ai/en-us/blog/python-and-pandas-the-faster-way

Python and Pandas: the faster way
lapis sequoia
glacial rune
```python
df['num0'] = (df['txt'].isin(conditions)).apply(lambda x: x + 1)``` do...
Nice code, glad you figured it out on your own!
 karmic ore
is there something like cv2.hconcat() but so i can overlap the images
example of a concat
but i want them to have a slight overlap\
teal sluice
if someone could help in #help-mango Id appreciate it
opaque stratus
Question: I am doing a twitter sentiment analysis project ---> How many tweets should I scrape? I've heard 1,000 is okay, but also 50,000? I mean obviously just enough to properly prove my research question, but how do I find that magic number?
velvet thorn
opaque stratus
Question: I am doing a twitter sentiment analysis project ---> How many tweets s...
depends on what your question is
but I'd say at least a few thousand
velvet thorn
glacial rune
figured it out:
```python
conditions = ['xxx', 'yyy', 'zzz', 'total']
mask = df...
you can just use += 1
lapis sequoia
i have a question owo
call() got an unexpected keyword argument 'training'
x = base_model(inputs, training=False)
velvet thorn
lapis sequoia
When do you use 'name' and .name? Is 'name' only used for columns?
I generally prefer [] access because it's more flexible and doesn't conflict with method names
lapis sequoia
 lapis sequoia
velvet thorn
I generally prefer `[]` access because it's more flexible and doesn't conflict w...
lapis sequoia
velvet thorn
I generally prefer `[]` access because it's more flexible and doesn't conflict w...
Is [] only for columns?
velvet thorn
lapis sequoia
Is [] only for columns?
as opposed to?
lapis sequoia
 lapis sequoia
velvet thorn
as opposed to?
lapis sequoia
velvet thorn
as opposed to?
I thought df.thing was only for rows
velvet thorn
...no
lapis sequoia
Vs df[thing] is columns
velvet thorn
both are for columns
velvet thorn
[] lets you get columns that are named the same as existing methods or are invalid Python identifiers
e.g. say you have a column named "bio data"
you can't do df.bio data, but you can do df['bio data']
.iloc can be used to index on both rows and columns
 spark dirge
lapis sequoia
https://gyazo.com/0ec2aedd2ed9b0f7c219066cc9d76ab3
spark dirge
lapis sequoia
https://gyazo.com/0ec2aedd2ed9b0f7c219066cc9d76ab3
looks like base_model is a function, can you find its implementation? the url of what you are looking at?
lapis sequoia
lapis sequoia
https://keras.io/guides/transfer_learning/
.
base_model is xception
if anyone knows any good python course on mathematical computation dm please
spark dirge
lapis sequoia
base_model is xception
thats not much to go on. just delete training=False. maybe print(base_model.__doc__) will show you the docstring?
spark dirge
lapis sequoia
if anyone knows any good python course on mathematical computation dm please
why not pick a project and work on it? demonstrate your understanding, dont expect reading or watching to be the same as coding.
lapis sequoia
just, one thing, before we go with this xd cuz even without the training it wont run
ValueError: Convolution kernel shape inconsistent with input shape: (3, 3, 3, 32) (rank 2) v Shape(dtype=<DType.FLOAT32: 50>, dims=(<tile.Value SymbolicDim UINT64()>, 80, 80)) (rank 1)
What does this mean?
Like, i was using 64x64 images. But model said minimun is 71x71, so changed images to 80x80
spark dirge
lapis sequoia
ValueError: Convolution kernel shape inconsistent with input shape: (3, 3, 3, 32...
you need the model input shape to be the same as cnn layer params.
lapis sequoia
okey i know what may be. I stored my 64x64 images on npy file, then i told nn shape is 80x80, but the images from npy still 64x64
spark dirge
lapis sequoia
Like, i was using 64x64 images. But model said minimun is 71x71, so changed imag...
why not just scale your images to 71x71
lapis sequoia
@spark dirge I get what you mean thing is most of them I numpy courses
remaking the npy files hihihi
and I'm really really interesting in visualizing the math
And I'm also confused how I can make a application like desmos clone
I was thinking of using Qt but I don't exactly know haven't had experience with it and don't know which is actually best to use
spark dirge
lapis sequoia
okey i know what may be. I stored my 64x64 images on npy file, then i told nn sh...
this might help: https://towardsdatascience.com/a-guide-to-an-efficient-way-to-build-neural-network-architectures-part-ii-hyper-parameter-42efca01e5d7
gotta do some multiplication to make the parameters match up. also print('img', img.shape) and print(model.summary()) to make sure layers match up.
 spark dirge
lapis sequoia
I was thinking of using Qt but I don't exactly know haven't had experience with ...
spark dirge
lapis sequoia
I was thinking of using Qt but I don't exactly know haven't had experience with ...
qt is a beast, why not start with a simple graphing calculator? and go from there?
lapis sequoia
Really
Appreciate it
the image shapes are 80,80,3
@spark dirge btw Qt ok for starting
as a first major GUI
Or should I learn other because I hate learning one thing then never using it for something else you know
  [0. 0. 0.]
  [0. 0. 0.]
  ...
  [0. 0. 0.]
  [0. 0. 0.]
  [0. 0. 0.]]

 [[0. 0. 0.]
  [0. 0. 0.]
  [0. 0. 0.]
  ...
  [0. 0. 0.]
  [0. 0. 0.]
[0. 0. 0.]]] (80, 80, 3)```Layer (type) Output Shape Param # Connected to
==================================================================================================
input_1 (InputLayer) (None, 80, 80, 3) 0
ValueError: Convolution kernel shape inconsistent with input shape: (3, 3, 3, 32) (rank 2) v Shape(dtype=<DType.FLOAT32: 50>, dims=(<tile.Value SymbolicDim UINT64()>, 80, 80)) (rank 1)```qt is ok. just that gui libraries are a lot to learn. focus on the single thing you are most motivated to do. the list of things you could learn is infinite.
lapis sequoia
that's the annoying part 😆
Thanks though rn
I just wanna improve on my maths do some data visualization then see how I can implement that into a gui to make it interactive.
Thanks a lot man take care
spark dirge
lapis sequoia
```raise ValueError('Convolution kernel shape inconsistent with input shape: ' +...
this page makes it work with a reshape. don't why that works though.
https://datascience.stackexchange.com/questions/85608/valueerror-input-0-of-layer-sequential-is-incompatible-with-the-layer-expected

Data Science Stack Exchange
I am trying to use conv1D but getting that error.
My dataset's is batched and has a shape of [None, 25, 25, 1]
I am using input_shape=(25,25)
I am not able to figure out what should I change so I c...
lapis sequoia
nvm i found it
inputs = keras.Input(shape=(150, 150, 3)) here i had a (71,71)
i was missing the channels
spark dirge
lapis sequoia
nvm i found it
nice. what does your model do?
lapis sequoia
idk yet, i got another error xd fixing 😄
nop, it isnt working @spark dirge loss: 0.1144 - acc: 4.7019e-05 - val_loss: 0.4646 - val_acc: 1.9091e-04
spark dirge
lapis sequoia
nop, it isnt working <@!494915938836021248> loss: 0.1144 - acc: 4.7019e-05 - val...
is your project hosted online? a million different problems could be causing that. got enough data? accurate labels?
lapis sequoia
probably the data. And no, it was on my local machine, but i will move to colab
and accurate labels? i mean, keras forces me to have labels as integers
lapis sequoia
dafuq
astral path
if I have a python dataframe like this, how would I make it so that the arrays in column 1 are split up into even more columns? so each index in an array would have its own column, and for each row, the element that belongs in the index for that row's data would go there. anyone know how to do this?
cheers and thank you!
 chrome barn
@astral path I don't know what your source data is, but it looks like some kind of nested JSON, if that is the case you could look into json_normalize: https://pandas.pydata.org/pandas-docs/stable/reference/api/pandas.json_normalize.html
 old pendant
@astral path check pandas.pivot, pandas.pivot_table and pandas.melt, maybe it is what u are searching
 stone notch
Hi, I have a pandas series that I would like to apply scikit learn's MultiLabelBinarizer which happens however, it seems to miss the first item in the list
it seems the first item it encounters (action) is not there anymore
and also the encoder doesn't seem to encode the first value in the columns
Please ping me if you reply
 chrome mantle
I think your index is missing
stone notch
chrome mantle
I think your index is missing
index?
stone notch
yeah that's one of the problems I have
chrome mantle
what do u mean by encode?
stone notch
I don't know the proper term
But what I meant by that sentence was that the first item in each list, the subsequent column will always have a value of 0 instead of 1
Like the [drama, music] row has music as 1 which is correct but drama is 0 etc
lapis sequoia
hey guys can anyone suggest any cool ideas for the major project of college's last yr?
 dreamy barn
lapis sequoia
hey guys can anyone suggest any cool ideas for the major project of college's la...
dreamy barn
lapis sequoia
hey guys can anyone suggest any cool ideas for the major project of college's la...
youtube 🙂 theres a lot of examples
stone notch
@chrome mantle Never mind I figured it out. It was just badly formatted data.
chrome mantle
I wonder what are u going to do with this data?
stone notch
Just a simple recommendation system
chrome mantle
CF?
stone notch
I dont even know what that is lol
stone notch
I'm still new to data science and programming so those are too advanced for me
chrome mantle
espically the RSVD it greatly improve the SVD process
stone notch
Oh ok
dreamy barn
lapis sequoia
hey guys can anyone suggest any cool ideas for the major project of college's la...
This video will showcase two impressive, yet fast to make python resume projects. These projects demonstrate programming ability and computer science knowledge and are great padding on your programming resume.
⭐️ Thanks to Kite for sponsoring this video! Download the best AI automcolplete for python programming for free: https://kite.com/downlo...
glacial rune
I have a tests directory like:
tests
tests/tool1
tests/tool1/data (testing code on some dummy data)
tests/tool2
tests/tool2/data
and tests within the tool1 and tool2 folders. If I want to run all of my code from tests how can I do that? As my tests are failing due to not being able to find the /data folder I've referenced in my test files under the tool1 and tool2 folders
 slow haven
ValueError: year 10000 is out of range```
im working on pandas Dataframe n i want to plot date in X axis and market cap in y but i get this error.
Another question, how do i group it based on year? finite wasp
My time series neural network tuner with cross validation in action 🙂
 somber bane
does anyone have an idea on how to make python run faster when reading and writing large number of json files? In my case, about 18000?
warm moth
In Keras.load_weights, is there a way to automatically select the best weights file? I am using loss as MAE and optimizer as adam. File saving format is Weights-{epoch:03d}--{val_loss:.5f}.hdf5
Right now I have to manually go through the saves and change the name of the weights file to load in the notebook
ping me if you have a solution, thanks
 tepid pewter
@somber bane Well a trivial way to get some speed increase is to go parallel. Basically divide the workload to N packets, then:
for n in range(N): job = multiprocessing.Process(target=json_job_func, args=(batches[n],)) job.start() jobs.append(job) for j in jobs: j.join()
Otherwise, if most of the time is spent inside the json library functions (not your own functions), there is little you can do, unless you could somehow recycle files from previous writing sessions
somber bane
@tepid pewter ,so here is my code, so how should I modify the function?
animeId = 1
for row in mf.Q:
#print(row)
path = os.path.join(os.getcwd(), "anime_data",
"{}".format(animeId), "data.json")
with open(path, "r") as file:
fileInfo = json.loads(file.read())
        # the id start counting from 1, but index start count from 0, so minus 1

        # skip the bias part
        rowIndex = 0
        for key in fileInfo.keys():
            if key != "bias":
                fileInfo[key] = row[rowIndex]
            rowIndex += 1
    #print(fileInfo)
            # dump the info
    with open(path, "w") as file:
        file.write(json.dumps(fileInfo))
    animeId += 1
Thanks
tepid pewter
Hmm
 proper tendon
using python i mean
somber bane
Well, I think you can ask, (personal opinion)
tepid pewter
If I understand correctly, what you are doing, is:
For each row, update a specific json file, and insert data from the row object
somber bane
yes, that is correct
tepid pewter
Are any oof the files opened more than once?
proper tendon
how can i assign a variable's value to an object in a dict, then read it
noting i have 2 objects only
channel1 and channel2
somber bane
no, only once during iteration
tepid pewter
How long would this take to run? I mean, if it's only done once, does it matter if it takes a minute?
I can't see how this could be made any faster, other than by spawning a few parallel jobs
somber bane
well, I am building a recommendation system base on each different factor of the show,
tepid pewter
You must have a respectable database of anime....
somber bane
Okay, thanks. I think I might consider putting all of them into one file, then use pandas to convert into numpy
I am still new to this concepts of databse, so my teacher suggest me not to touch the database
This is my freshmen winter project, so
tepid pewter
well generally 1000s of individual files sounds like a bad idea unless there is a specific reason for that
are you familiar with pickle?
somber bane
eh, not
tepid pewter
Oh, that might be what you are after
pickle is a way of storing python objects into files
somber bane
@proper tendon I do not think is possible, if the object a class written by your own
Okay, thanks, I will take a look at pickle library
tepid pewter
you can pickle a dict()-object (or numpy array, or anything really) into a single file. It can be gigabytes big.
proper tendon
basically they both r"0"
i would like to change em to other numbers
to save the ID's
somber bane
do you have the code, may I take a look
tepid pewter
basically:
`import pickle
D = dict()
D["1"] = 123
D[44] = 456
f = open("storage.dat", "wb")
pickle.dump(D,f)
f.close()
...
f = open("storage.dat","rb")
D= pickle.load(f)
return(D["1])`
proper tendon
i made it for a discord bot
somber bane
what is the diffference between rb, wb with r and w?
tepid pewter
"rb" returns raw bytes, "r" reads like text
somber bane
oh, so do pickle require me to do it in raw bytes?
tepid pewter
"rb" is what pickle (and most other libraries) use
well pickle does it all for you. You are not required to look into the file yourself. You can, but it's a wonderful mess of python object represented in byte format
proper tendon
yeah np
tepid pewter
So you would now store all of your anime data into a single humongous dict, or even self made Class, and then once that's all done, stuff it into a single file with pickle.
somber bane
Thanks your help
tight torrent
guys im new to sql so just forgive me for being dumb but please help me why is this erroring.
here are the columns
here is my test code
@client.event
async def on_message(message):
    if message.author.bot:
        return
    cursor = db.cursor()
    cursor.execute("SELECT id FROM user WHERE id =" + str(message.author.id))
    result = cursor.fetchall()
    if len(result) == 0:
        print("Nope")
        cursor.execute("INSERT INTO user VALUES(" + str(message.author.name) + "," + str(message.author.id) + ")")
        db.commit()
print("Added User To DB")```doesnt work.
livid quartz
How can I calculate the mahalanobis distance for each school in my code?
Pastebin
Pastebin.com is the number one paste tool since 2002. Pastebin is a website where you can store text online for a set period of time.
 red pumice
livid quartz
red pumice
livid quartz
manually preferably