#data-science-and-ml
1 messages · Page 274 of 1
 olive lichen
 fiery fossil
works fine on my side..are you sure liberalMindZScores is a list only?
 austere swift
do you happen to have a conflicting round() function?
 lapis sequoia
oops
 azure stump

 ocean pumice
this stuff is insane https://alien-project.org/ i let it run all night long 🙂
ocean pumice
damn... i need to downgrade to cuda 10.1 to use tensorflow~~ ?~~
ocean pumice
nvm, it's not a downgrade, both can be installed independently
 soft dock
I don't know how many people know about this, but you guys should try checking out Cython with JAX. Training has never been quicker.
 worthy scarab
Does anybody know how to do a chi square distribution on python? I have my chi square value and data points with a curve of best fit in the form of an exponential but dont know how to make the pdf
lapis sequoia
worthy scarab
Does anybody know how to do a chi square distribution on python? I have my chi s...
is scipy an option? https://docs.scipy.org/doc/scipy/reference/generated/scipy.stats.chi2.html
anybody know why log scale ticks in matplotlib only give 8 ticks between each power of ten? shouldn't it be 9? how should i read these values otherwise?
 normal sinew
hey
who can help me with some practice questions for mathematics for computer science
 kindred valley
yes i need some help with some questions too
 split eagle
I am working in Jupyter notebook and trying to filter a dataframe of medical studies to only include those focused on cancer. I have created a list of 31 cancer-related strings (which I made into a list I called cancer_mesh) and want to filter the df to only include studies for which at least one of the strings in this list appear in the column "mesh_terms". Here is the problem: when I used .isin(cancer_mesh), the output is too restrictive because only studies where the string in "mesh_terms" match the strings in "cancer_mesh" exactly are included. When I try to use .str.contains(cancer_mesh), I get TypeError: unhashable type: 'list'. If I try to use .str.contains() with all the cancer strings inside the parentheses I get TypeError: contains() takes from 2 to 6 positional arguments but 31 were given. I have searched multiple sources online, but haven't found a solution that has worked. Any ideas what I could do to filter this df to include studies where the smaller strings in cancer_mesh appear in the larger strings in the "mesh_terms" columns? I can provide the full list of cancer_mesh strings if you'd like.
worthy scarab
When i have an xarray and yarray that plots a curve, how can i find the area under that curve?
split eagle
split eagle
I am working in Jupyter notebook and trying to filter a dataframe of medical stu...
FYI: I resolved this problem with the following solution: pattern = '|'.join([f'(?i){x}' for x in cancer_mesh])
df_browse_conditions ['cancer_trial'] = np.where(df_browse_conditions.downcase_mesh_term.str.contains(pattern, na=False),1,0) I will drop all rows where "cancer_mesh" = 0
 livid quartz
How do you get the shap values for Adaboost?
 crisp crypt
@worthy scarab integration
 rustic dew
livid quartz
How do you get the shap values for Adaboost?
rustic dew
livid quartz
How do you get the shap values for Adaboost?
https://github.com/slundberg/shap works with scikit-learn and you have adaboost in sklearn I believe

GitHub
A game theoretic approach to explain the output of any machine learning model. - slundberg/shap
livid quartz
I've tried that package but I get an error when Applying it to my adamodel
But it works for a standard decision tree model
 tiny rain
In a hackathon, how can I implement some Predictive analysis on my data fast ..?
Google colab ..?
 brazen owl
Hi everyone
 outer fulcrum
Hey guys
 twilit pilot
Does anyone know an API or anything that will give me the support and resistance lines for a stock if I give it the candlestick data?
 torpid cave
H guys
Do you know any easy way of handling missing index information?
e,g,
info[3] when index 3 does not exists
 lilac raven
Hello, in relation to :
fig, ax = plt.subplots(2, figsize=(x,y)) fig.canvas.manager.window.move(x,y)
. Is there a command that would let me see the current fig size and screen position if I want to manually move it after starting the code?
torpid cave
@twilit pilot if you have the data, then you can create the graphs yourself
Good example: https://plotly.com/python/candlestick-charts/

How to make interactive candlestick charts in Python with Plotly. Six examples of candlestick charts with Pandas, time series, and yahoo finance data.
twilit pilot
torpid cave
<@!747458337511047179> if you have the data, then you can create the graphs your...
i did but after i also want to get the support and resistance lines of a stock
torpid cave
What are the formulas behind support and resistance/
?
You could add them manually
 frosty flare
hey guys , its about " OPENCV "
twilit pilot
torpid cave
What are the formulas behind support and resistance/
idk i might have to create my own logic if there is nothing out there
frosty flare
so i wrote the code to detect and extract faces into new windows , and made it save the detected face when i press i button
my problem is if theres multiple faces it does only save the last one which has been detected
torpid cave
@twilit pilot I am thinking that they are set-up randomly
Just saw a quick explanation on them
twilit pilot
torpid cave
<@!747458337511047179> I am thinking that they are set-up randomly
yea because not all stocks are the same, so there is not real formula, but there is some kind of logic behind it
twilit pilot
yea im pretty sure fidelity has their own support and resistance algorithm, which i have used before
i am trying to create a stock trader, so i want to know how to find the support and resistance
 south brook
We are 3 girls meet every week and exploring the Kaggle titanic competition.
We relay on this notebook : https://www.kaggle.com/arg0n007/titanic-80-accuracy-top-14-random-forest
We need a little mentoring help because we got stuck in Confusion Matrix and Kfold Validation phase.
All we need from you(Mentor) is one hour only ,please who ever can come up forward to help us we will be very happy , thankful and appropriated to him\her.
twilit pilot
well ik how to find support and resistance, but i dont know how to code it lol
twilit pilot
well step one is to find the turning points of a graph - i did that
torpid cave
Ok delta
twilit pilot
step two is to filter those points to get only the relevant points
that pretty much it lol, but idk how accurate this will be thats why if there is an api already, i would rather use that
twilit pilot
haha yes ik. perhaps i will have to create my own logic
torpid cave
If you are interested, there is this nice article in Medium:
https://towardsdatascience.com/programmatic-identification-of-support-resistance-trend-lines-with-python-d797a4a90530

Medium
Automated trend line analysis using Python done comprehensively and properly using different methods and tools.
twilit pilot
thanks for this article
 twilit brook
Hey guys
lapis sequoia
is it possible to write a very very simple SIR disease model in vanilla python
twilit brook
Are there any professional data scientists on this channel? Wanted to ask a few career questions. If I can steal some of your time pls PM me 🙂
 fading wigeon
lapis sequoia
is it possible to write a very very simple SIR disease model in vanilla python
fading wigeon
lapis sequoia
is it possible to write a very very simple SIR disease model in vanilla python
Yes
I've written one in Matlab a while ago and I don't think I used anything that wasn't also available in python
Also, does anyone have any interest in data science in how it relates to neuroscience? I'm going to an online conference on the subject in 30 minutes, can send an invite if anyone is interested
fading wigeon
Sorry, it's lost to the sands of time, I'm afraid.
twilit pilot
bro @fading wigeon ur staus tripped me off 🤣
fading wigeon
🙂
 hollow gull
@twilit brook ask your questions in the chat and people will respond to them if they can. I believe the community prefers not to use PMs.
lapis sequoia
guys i have a problem
i was using paidml to use gpu from amd, but i think it wasnt working cuz
INFO:plaidml:Opening device "opencl_amd_ellesmere.0"
i think this is cpu still
I had this line on my program os.environ["KERAS_BACKEND"] = "plaidml.keras.backend"
but if i remove it
i get this AttributeError: module 'tensorflow' has no attribute 'get_default_graph'
why?
austere swift
lapis sequoia
i was using paidml to use gpu from amd, but i think it wasnt working cuz
``INFO:...
did you do the plaidml-setup that it says to do in the quickstart?
lapis sequoia
yes, i did, and it was working
if i set the environ it works
if i remove that line, i get the error
also the setup only shows this

and i think both are cpu
not sure
austere swift
llvm is cpu
so the other one is probably gpu
unless you have some other weird device or sum idk
lapis sequoia
still, thats not the point
why if i remove the os.environ everything stops working?
austere swift
can you show your code?
lapis sequoia
import os
os.environ["KERAS_BACKEND"] = "plaidml.keras.backend"
austere swift
the os.environ is what's telling keras to use plaidml
as to why it shows that error I don't know
unless you're using tf.get_default_graph somewhere
lapis sequoia
im not
austere swift
that's deprecated as of tensorflow 2.0 so it would be tf.compat.v1.get_default_graph
lapis sequoia
Traceback (most recent call last):
  File "E:/PyCharm/PYTHON projects/Pokeguesser/Pokeguesser v2/0-151/AI.py", line 109, in <module>
    model = Sequential()
  File "C:\Users\Diego\AppData\Local\Programs\Python\Python38\lib\site-packages\keras\engine\sequential.py", line 87, in __init__
    super(Sequential, self).__init__(name=name)
  File "C:\Users\Diego\AppData\Local\Programs\Python\Python38\lib\site-packages\keras\legacy\interfaces.py", line 91, in wrapper
    return func(*args, **kwargs)
  File "C:\Users\Diego\AppData\Local\Programs\Python\Python38\lib\site-packages\keras\engine\network.py", line 96, in __init__
    self._init_subclassed_network(**kwargs)
  File "C:\Users\Diego\AppData\Local\Programs\Python\Python38\lib\site-packages\keras\engine\network.py", line 294, in _init_subclassed_network
    self._base_init(name=name)
  File "C:\Users\Diego\AppData\Local\Programs\Python\Python38\lib\site-packages\keras\engine\network.py", line 109, in _base_init
    name = prefix + '_' + str(K.get_uid(prefix))
  File "C:\Users\Diego\AppData\Local\Programs\Python\Python38\lib\site-packages\keras\backend\tensorflow_backend.py", line 74, in get_uid
    graph = tf.get_default_graph()
AttributeError: module 'tensorflow' has no attribute 'get_default_graph'
it could be that plaidml isnt updated for 2.0
austere swift
are you doing import keras or are you using tf.keras instead
lapis sequoia
from keras.layers import Dense, Dropout, Flatten
from keras.layers import Conv2D, MaxPooling2D```yeah use tf.keras instead
so like
from tensorflow.keras.models import Sequential
from tensorflow.keras.layers import Dense, Dropout, Flatten
from tensorflow.keras.layers import Conv2D, MaxPooling2D
then, why did i do pip install keras?
austere swift
so do from tensorflow import keras
lapis sequoia
why tho?
austere swift
keras actually stopped using their own functions within themselves, now it's mostly pointers just to tf.keras
lapis sequoia
all the sites use keras

Keras Tutorial: Keras is a powerful easy-to-use Python library for developing and evaluating deep learning models. Develop Your First Neural Network in Python With this step by step Keras Tutorial!
they dont use tensorflow
austere swift
i mean it should theoretically work both ways
but tf.keras is "better" to use
make sure your keras is up to date as well
lapis sequoia
Keras-Applications     1.0.8
Keras-Preprocessing 1.1.2```iirc the latest version is 2.4.3
i'll have to double check
yeah it is 2.4.3
PS C:\Users\user> pip install --upgrade keras
Requirement already satisfied: keras in c:\users\user\appdata\local\programs\python\python38\lib\site-packages (2.4.3)
and yeah thats your issue
lapis sequoia
We recommend you use --use-feature=2020-resolver to test your packages with the new resolver before it becomes the default.

plaidml-keras 0.7.0 requires keras==2.2.4, but you'll have keras 2.4.3 which is incompatible.```last line
austere swift
ahh
austere swift
i tested using 2.2.4 and running the same model = keras.models.Sequential() line and it came up with the same error as you had
the tf.get_default_graph error
so it was the keras version causing that
lapis sequoia
ERROR: After October 2020 you may experience errors when installing or updating packages. This is because pip will change the way that it resolves dependency conflicts.
whats this
austere swift
there was a new dependency resolver implemented into pip in the latest update
20.3 was the version iirc
lapis sequoia
so upgrading pip will fix that?
austere swift
thats not an error
austere swift
thats just a warning saying itll change
lapis sequoia
in capitals
austere swift
it's not an actual error idk why they said that lol
austere swift
Np
austere swift
Lol
austere swift
what impressed me today was that the 3080 went in stock for a whole 52 minutes
because they released the stock at small bursts
lapis sequoia
well, what do u expect XD
austere swift
but i didnt have my money ready at the time lol
austere swift
more than 2080ti lol
lapis sequoia
ye
austere swift
3070 is the one thats comparing to 2080ti
lapis sequoia
and 60ti to super
austere swift
but yeah usually its gone within 10 minutes
lapis sequoia
ye
austere swift
yeah kinda bummed my gpu that i got 2 years ago for $750 is now beat by one thats $400
austere swift
at least i could probably get like 500 if i sold it since the 30 series ones are completely impossible to buy
lapis sequoia
hopefully
 blazing bridge
Hi guys, I am building a deep learning PC and I wanted your opinion on the parts I have chosen.
i9 9900k
RTX 3070
16 GB CL16
MSI MAG 360R AIO
MSI Z390-A PRO
1TB Western Digital M.2 NVME SSD
750 W power supply
Corsair iCUE 220T RGB Airflow ATX Mid Tower Case
This will also be used for gaming and other productivity tasks as well
lapis sequoia
ryzen is better
blazing bridge
That's what they all say but intel smacks in single core performance

Based on 470,163 user benchmarks for the AMD Ryzen 9 3900X and the Intel Core i9-9900K, we rank them both on effective speed and value for money against the best 1,276 CPUs.
lapis sequoia
iirc new 5000 series are better on single threat now
blazing bridge
yeah ik
but they are out of stock and they are a little too expensive
I am getting the i9 9900k for 440 CAD
lapis sequoia
and 3070 isnt? XD
blazing bridge
no i got it
lapis sequoia
damn u lucky
blazing bridge
yeah ik
blazing bridge
im in a hurry tbh
i need it built by this christmas break
or I would have waited
blazing bridge
It’s mixed opinions
lapis sequoia
graphs arent opinions. choose what u feel, im going sleep. gn
twilit brook
hollow gull
<@!657451103943917578> ask your questions in the chat and people will respond to...
Will do 👍
 trim oar
Hi guys, does "unit testing" have a special meaning in programming other than hyperparameter?
austere swift
blazing bridge
https://cpu.userbenchmark.com/Compare/Intel-Core-i9-9900K-vs-AMD-Ryzen-9-3900X/4...
Userbenchmark is a very unreliable source lol
austere swift
blazing bridge
Hi guys, I am building a deep learning PC and I wanted your opinion on the parts...
The 9900k is kinda outdated tbh, it would be better for you to go with a 10th gen cpu so you can also have further upgrade ability or to just go with one of the ryzen 5000 cpus, also for deep learning in my experience the gpu is much more important than the cpu and vram is one of my biggest bottlenecks so you might be better off getting a 2080ti for cheap on eBay or something because of the extra vram, or upgrading to a 3080 with some downgraded other parts. I’m assuming the ssd you’re talking about is the SN550, which isn’t really that good since it used HMB rather than a DRAM cache which makes it slightly slower, and also the AIO isn’t really a good value lol
As you might be able to tell I’m really experienced in this computer kinda stuff 🤣
Also btw single core doesn’t matter that much in deep learning, multi core matters much more
Since the main things the cpu is gonna be doing is the preprocessing, inference, and managing the data during training, all of which are highly multi threaded tasks
And you might want more ram if you’re gonna tackle larger datasets 😉
The only real performance uplift for deep learning that Intel has is AVX512, which isn’t even on the consumer chipsets only x series HEDT and the lga3647 server cpus
 final scaffold
data['A'] contains string like this
{125|abs_sjowkd,
Hdujdj_hshjs,
Abs|hdus_isos_jdisi,
}

I wanna split the string on "|" (if exists) and then extract the string before the first occurrence of "_"
In a new column```@trim oar sorry for the ping bro. Could you take a look at above? It's urgent.
trim oar
final scaffold
<@680795279758327819> sorry for the ping bro. Could you take a look at above? It...
I'm about to sleep but: https://pandas.pydata.org/pandas-docs/stable/reference/api/pandas.Series.str.split.html
This allows you to string split and
expand = True would create new columns
I suggest playing with Regex if _ is not recognized or something
That should do for you
final scaffold
Alright! Thanks man
azure stump
 cedar yacht
What model should I use for EMNIST?
I want to use Keras/Tensorflow to parse a single character
ResNet would be too overkill for this, right?
cedar yacht
Wtf
 pale thunder
!warn @dreamy wraith do not post random gifs, especially into on topic channels
 arctic wedgeBOT
:incoming_envelope: :ok_hand: applied warning to @dreamy wraith.
torpid cave
I think I will start moving towards NoSQL tables
I just did a quick course on it and they seem much easier to manage for my kind of work
 jolly zealot
Hi!
It's Akshay.
I am looking for full-time 'Python' or 'Artificial Intelligence' pair programmers. If you would like to pair-program, please message your availability and schedule.
Thank you.
Best,
Akshay.
austere swift
!rule 6
arctic wedgeBOT
6. No spamming or unapproved advertising, including requests for paid work. Open-source projects can be shared with others in #python-general and code reviews can be asked for in a help channel.
lapis sequoia
If anyone is familiar with the SciPy solve_ivp function, I could use some help on how to implement it for a system of ODEs: https://scicomp.stackexchange.com/questions/36465/solve-coupled-odes-in-time-and-space-using-python

Computational Science Stack Exchange
I have a system that is represented by the equations shown below. This is part of a larger system of equations but for the purpose of this question I have simplified things.
$$
\frac{\partial c}{\p...
 merry wadi
Is there a way to use a decision tree with a target variable that has multiple values?
Rather than predicting (0 or 1) it would predict (0,1,2,3)
 upbeat bone
i have 4 variables, "age" , "sex" , "year" and "expected" & am trying to plot a graph using only the data from "male" which is in the "sex" column in my .csv file .. I have tried lifedf.plot.bar('year','expected') , but this is just plotting it all
 sand sluice
lifedf[lifedf['sex'] == 'male'].plot.bar('year','expected') ?
lapis sequoia
I posted my question in the #help-kiwi channel.
upbeat bone
doesnt seem to work 💔
trim oar
upbeat bone
i have 4 variables, "age" , "sex" , "year" and "expected" & am trying to plot a ...
hue='sex' Edit: read it wrong. Don't have device to play right now tho
lapis sequoia
I'm trying to convert my script from tensorflow v1 to tensorflow v2.
It is a frozen_inference_model, and I managed to convert it into a saved model so far.
Now when it comes to inference, in Tensorflow V1 I had to pass the value of
{self.graph.get_tensor_by_name('image_tensor:0'):data}
I'm unsure how to do this in Tensorflow V2 with a savedmodel, on how to get the tensor by name.
Help is appreciated
 fair kernel
hello guys im new in data science and want to evolve my skils fast and good
im planning to start a twitch channel for data science learning
starting wiht 30days of code python for data science
you think tahts a good idea?
or is this what people wnat to watch ? 😄 ❤️ thanks in advance guys
and girls 🙂
fading wigeon
Anyone use databricks before? How hard is it?
trim oar
fair kernel
hello guys im new in data science and want to evolve my skils fast and good
what's your goal here... learn or get audience
 next talon
How can I reduce my validation loss ?
fair kernel
@muted thorn yu learn! best way of learning is to teach ohters while you learning
@trim oar
@trim oar think about the rubberduck method in software development
what you want to achive?
fair kernel
trim oar
what's your goal here... learn or get audience
iam just feeling that new learners have a hard time getting into things, i am enrolled in udacity nanodegree for data anylst and most guys there need to research alot on google. cuz they beginners in programming at all
fair kernel
 azure hearth
@ gzuma , im not a beginner and still search everything on google 😛
azure hearth
@ gzuma , im not a beginner and still search everything on google 😛
yes yes me too hahha, but you know how stuff can work, beginners dont konw how stuff can work and they have to search hours and hours for it
azure hearth
actually not really^^
fair kernel
i just watched yt videos and blgo post on medium for useufll trick
azure hearth
but python is really easy
fair kernel
for someone who never has programmed or know how digital stuff is working its hard to learn python!^^
fair kernel
no way 😄 haha
why i should learn c++`? im learnign data science just to get the power of data insights
and building nice products
yea youre right c++ would e helpful 😄
be*
azure hearth
what you do exactly?
fair kernel
learning python ds, ux, building companys products, marketing
everythign that is necessary to bring ideas to life!
azure hearth
cool
fair kernel
At some point is rly helpful to make a MVP of an idea or product
azure hearth
im just doing websites to earn money
azure hearth
just do it 😛
fair kernel
TiME
day only have 24 hours
im more passionate about doing my own stuff then doing clients stuff
azure hearth
money ! 😄
fair kernel
you earning millions?
azure hearth
no, but i also dont need millions
fair kernel
send me portfolio as PM
azure hearth
everything should have website for frontend stuff , i think
fair kernel
website is basic marketing stuff
azure hearth
portfolio from me ?, im not searching for jobs
fair kernel
im just an design lover ❤️ and love creative work
website portfolio just to watch what i will never can achieve : D
trim oar
@fair kernel so it’d be streaming about you going through the udacity course.
fair kernel
@trim oar i thaught about somethign like that
i have a data science project ongoing
gather spotify data
analysie it
trim oar
I’d say go for it
trim oar
I just don’t know if Twitch has the right audience
fair kernel
trim oar
I just don’t know if Twitch has the right audience
but which plattform have it, i created a tiktok accoutn already
trim oar
I don’t watch stream, so honestly no clue. Considering more people search YouTube videos, I’d imagine if not now, at least those VODs would be useful later
fair kernel
trim oar
I don’t watch stream, so honestly no clue. Considering more people search YouTub...
was thinking about yt too, maybe for udacity nanodegree tips and streams for interaction with the community ❤️
i just have no time for produce yt videos 😦
trim oar
Honestly there are plenty of unedited stuff on there that gained popularity
Your goal was to learn data science anyways
YT also has streaming function btw
Or you can stream both at the same time
If your computer can handle it
And see which one performs
fair kernel
trim oar
Honestly there are plenty of unedited stuff on there that gained popularity
youre right 🙂 i have bad habit to always want to make high quaitly work
😦
fair kernel
trim oar
Honestly there are plenty of unedited stuff on there that gained popularity
was thinkg about yt series, short clisp 1-2 minutes about easy steps for beginners like 2 minute tutorial how to plot countplots
trim oar
As long as you won’t be too hung up by the numbers
fair kernel
prjoct based learnign is a thing , so every video will connect to 1 big proeject useing the projects data to make the little videos
trim oar
Because I’ve seen great talents who later on got too caught up by the underperforming numbers.
fair kernel
you mean views
azure hearth
noone want to watch programming lessons :/
trim oar
Yup
Because for example, YouTube recommends videos based on a few metrics, and 1-2 minute would be ranked lower than 10 minute videos even if it’s the “freshness” is the same
fair kernel

Hello All,
Welcome to the Python Crash Course. In this video we will understand about Seaborn
github url : https://github.com/krishnaik06/Machine-Learning-in-90-days
Support me in Patreon: https://www.patreon.com/join/2340909?
Connect with me here:
Twitter: https://twitter.com/Krishnaik06
Facebook: https://www.facebook.com/krishnaik06
instagr...
trim oar
If it got viral for random luck however it won’t stop recommending
fair kernel
22k views 😄
trim oar
I know it’s a thing.
azure hearth
22k = 22€ ?
fair kernel
22.000 views
trim oar
But it was built over a year with the right keywords, and if you got too caught up with numbers, especially fresh channels
fair kernel
this is an data anylsi sproject guys, find out what average duration a video have in yt, realted to programming lessons videos 😄
trim oar
Then one might be very disappointed
fair kernel
its a figth
to gain views
keywods, audio quality, title and thubmnails
shoudl do the work
trim oar
And this guy has 225k subscribers with years of building the channel
No
YouTube algorithm is a thing
Same with Twitch and other platforms
azure hearth
maybe you can get informations with the youtube api
trim oar
The amount of work going into those design is insane.
fair kernel
right 🙂 youtube api then doing research
have 3 yeras of design school^^
ahhh
ahah
you meant the youtube algo
trim oar
Yes
fair kernel
yeye i know
trim oar
Its
trim oar
Yeah no what I simply meant is as long as you don’t sway your main goal of learning data science because of the numbers then I think it’s great
fair kernel
there shoudl be an webservice which is connected to youtube api to find out which things you have to do to get attraction to viewers, by category and keywords
trim oar
But if worrying about the numbers decrease your quality of learning then it’s a bad idea
No it’s more complicated than that
fair kernel
nah nohting can bring my motivation down 🙂
trim oar
You see it’s not key words based. That’s like more than five years ago
And it’s updating every year
Currently primarily based on average watch time, so even if people finish 100% of 2 minute video and 50% of 10 minute video, theirs still twice more than likely to get recommended
But there are other things, like kids related is more punished now because of the privacy issues
fair kernel
i mean a service for end users. they type in somem keywords and get recomendation data or analysis, from data of youtube api,
then they see what things succesufl videos., related to their key word search, have.
e.g like thumbnails, taging, vidoe lenght, countrys etc .....
fair kernel
trim oar
TubeBuddy more or less does it
will check it out, thx ❤️
trim oar
🥰
fair kernel
other qestion. you worked with selenium?
trim oar
No unfortunately
fair kernel
yes, did this too but beatifulsoup didnt worked for the spotify web page ,
only selenium because it works with the javascript website stuff

The most comprehensive dataset available on the state of ML and data science
everony have already a team on it ? 30,000 dollars seems attractive
blazing bridge
I don't have a team but I wouldn't mind trying if someone is interested.
 odd jackal
hii
does anyone know how do i get kaggle_secrets to work in jupyter notebook?
 ripe lion
Hello, So I'm working with this data frame:
https://cdn.discordapp.com/attachments/303906576991780866/785897567317131295/Capture2.PNG

I'm trying to compare the votes for republicans and democrats to then plot them on a map but I'm stuck.
Here's the code I came up with: https://cdn.discordapp.com/attachments/430969524011925507/786503312383148042/Capture.PNG

but here is the result: https://cdn.discordapp.com/attachments/303906576991780866/785897469098721350/Capture3.PNG

Anybody knows how I can get rid of the "NaN" thing on 'democrat_votes' and 'republican_votes' and merge them so that each state is in one row?
 sweet plaza
@ripe lion Tru using this on Pandas https://pandas.pydata.org/pandas-docs/stable/reference/api/pandas.DataFrame.dropna.html
the dropna function
ripe lion
oh thank you @sweet plaza , will try that!
 velvet thorn
ripe lion
oh thank you <@!406014882673328128> , will try that!
velvet thorn
ripe lion
oh thank you <@!406014882673328128> , will try that!
use combine_first
df['republican_votes'].combine_first(df['democrat_votes'])
velvet thorn
sweet plaza
the dropna function
dropna is going to remove everything
ripe lion
velvet thorn
`df['republican_votes'].combine_first(df['democrat_votes'])`
Oh, Thanks a lot!
velvet thorn
<@&267629731250176001> spam
 eager heath
!tempban @wanton bison 14d It seems like you're only here to spam a link to your course. Re-read our rules if you want to be part of this server.
arctic wedgeBOT
:incoming_envelope: :ok_hand: applied ban to @wanton bison until 2020-12-24 10:49 (13 days and 23 hours).
torpid cave
sup you all
 lilac kindle
what is a smart way to check if values in a list are increasing or decreasing?
lilac kindle
[1 3 7 8]  #  all 4 values increasing
[11 9 7 2]  #  all 4 values decreasing
[1 11 7 8]  # last 2 values increasing
You could use numpy to do the comparison
e.g.
import numpy as np
np.array([list0]) > np.array(list1])
And then count true/false
Use indexes if you want to know exactly what values increase/decrease
output = np.array([1, 2, 3, 4]) > np.array([2, 3, 4, 5])
print(sum(output), "values are increasing")
Something among those lines
It tells you the number
Then you could custom use the print function right
add some conditionals to get different messages
lilac kindle
I don't understand
I don't rly want to compare two lists with eachother, just find a pattern in a single list, like if the last 10 values were constantly increasing: do something
torpid cave
You need to store 2 lists...
The first list would be the old version, the second the new version
My guess is that you are doing this inside a loop/function
lilac kindle
yea
I'm constantly adding values so the dimensions are off
new list will have a new extra value
torpid cave
Try to do this... at the beginning of the loop save your list in a value, then when you transform it, at the end of the loop, run your conditional
And print what is happening
If the data is not too large
lilac kindle
ye true
torpid cave
Maybe just create a list of lists
For every iteration
And try to see it graphically
lilac kindle
thanks for the help! got plenty of stuff to try now
torpid cave
No worries!
 hasty grail
!e
def is_nondecreasing(lst):
    if len(lst) <= 1:
        return True

    prev = lst[0]
    for e in lst:
        diff = e - prev
        if diff < 0:
            return False
        prev = e

    return True

print(is_nondecreasing([1, 5, 5, 9, 2]))
print(is_nondecreasing([1, 5, 5, 9, 10]))
@hasty grail :white_check_mark: Your eval job has completed with return code 0.
001 | False
002 | True
This will work for a simple list, if you have a nested list you'll have to do it in a loop
torpid cave
Easier/cleaner solution
hasty grail
I'm assuming that you're not using numpy
!e
import numpy as np

def is_nondecreasing(lst):
    return (np.diff(lst) >= 0).all()

print(is_nondecreasing([1, 5, 5, 9, 2]))
print(is_nondecreasing([1, 5, 5, 9, 10]))
@hasty grail :white_check_mark: Your eval job has completed with return code 0.
001 | False
002 | True
Otherwise you can just do this ^
torpid cave
Any way I could make this a one-liner
data['AttractiveA'] = 8 - data['AttractiveA']
data['AttractiveB'] = 8 - data['AttractiveB']
data['AttractiveC'] = 8 - data['AttractiveC']
Using a list comp, yes, but it's bad practice to have side effects in list comps. You should use a for loop instead
for k in ('AttractiveA', 'AttractiveB', 'AttractiveC'):
    data[k] = 8 - data[k]
np
torpid cave
I am transforming a dataframe btw
I will actually just use that to transform all the columns
hasty grail
hmm you might be able to get away using multiindexing
torpid cave
data['AttractiveA'] = 8 - data['AttractiveA']
data['AttractiveB'] = 8 - data['AttractiveB']
data['AttractiveC'] = 8 - data['AttractiveC']

#Inverse Innovation
data['InnovativeA'] = 8 - data['InnovativeA']
data['InnovativeB'] = 8 - data['InnovativeB']
data['InnovativeC'] = 8 - data['InnovativeC']

#Inverse Easy
data['EasyuseA'] = 8 - data['EasyuseA']
data['EasyuseB'] = 8 - data['EasyuseB']
data['EasyuseC'] = 8 - data['EasyuseC']

# plus 8 additional variables
I was thinking using something like... starts_with (R based)
I think it is cleaner to just create a list of the columns and loop over it
hasty grail
Not that experienced in pandas, unfortunately
hasty grail
I play around with numpy a lot but not really pandas
hasty grail
Yeah
torpid cave
But I do all the matrix calculations with np though
@hasty grail want to try a slightly more challenging one? I optimized it already but maybe you could think about a different way of doing it
hasty grail
Sure
torpid cave
So I am doing this:
AppealA = np.nanmean(np.array([data['AttractiveA'],data['WowA'],data['LoveA']]),axis=0)
AppealB = np.nanmean(np.array([data['AttractiveB'],data['WowB'],data['LoveB']]),axis=0)
AppealC = np.nanmean(np.array([data['AttractiveC'],data['WowC'],data['LoveC']]),axis=0)
But like Appeal, I have about 20 other variables
My quick solution was
for factor in [A, B, C]:
  var = 'Appeal' + factor
  x = 'Attractive' + factor
  y = 'Wow' + factor
  z = 'Love' + factor

  data[var] = np.nanmean(np.array([data[x],data[y],data[z]]), axis=0)

  var2 = 'Var2' + factor
  #x = .....

#.... up to Var 20
opps
And note that some variables have 3 inputs, some have up to 8 inputs
Don't want to make it too complicated though as I have to pass this code to someone else to maintain
hasty grail
appeals = {}
bases = ('Attractive', 'Wow', 'Love')
for subcol in ('A', 'B', 'C'):
    cols = [base + subcol for base in bases]
    appeals['Appeal' + subcol] = np.nanmean(data.loc[:, cols].to_numpy())
Not entirely sure this would work but worth a try xD
torpid cave
hahahaha
Well I just realized both solutions are longer than 3 lines
I might turn yours into a function
hasty grail
We're not code golfing so usually it would be longer than 3 lines, lol
torpid cave
Oh I mena
mean
The basic solution was 3 lines
ugly but 3 lines
Is fun doing this though, I should focus a bit more on finishing my work though
hasty grail
You should try to follow the DRY principle as much as possible
Otherwise it will become more difficult to maintain the code in the future
torpid cave
true
@hasty grail
def ComputeScore(score_name, components):
        result = {}
        for prod in ('A', 'B', 'C'):
            cols = [comp + prod for comp in components]
            result[score_name + prod] = np.nanmean(data.loc[:, cols].to_numpy(), axis=0)
        return result
x = ComputeScore('Appeal',['Attractive','Wow','Love'])
nvm
Working at 90%
I get results rather than matriz
a matrix
hasty grail
you can convert that easily
velvet thorn
@torpid cave store the column names in some data structure
then you can access the subset of the DF corresponding to them directly
and you don't need to use np.nanmean
normal pandas .mean will work just fine
looping is inefficient
hasty grail
^ listen to this pandas expert xD
torpid cave
pandas takes care of NAs?
velvet thorn
!e
import pandas as pd

print(pd.Series([1, float('nan'), 2]).mean())
@velvet thorn :white_check_mark: Your eval job has completed with return code 0.
1.5
Ok it does
so I will just use this
for product in ('A','B','C'):
        data['Appeal' + product] = data[['Attractive' + product, 'Wow' + product, 'Love' + product]].mean(axis=1)
# State additional variables after this
Thanks all
torpid cave
Yep nww
I am just moving data from one place to another, every friday
For datasets that will never be considered big
You should have seen the initial R code I made for this 1-year ago
 vagrant tulip
is there an image quality metric with both rotational invariance and greyscale invariance?
 fallow rune
I was working with the Black Friday Dataset and got 64% accuracy on a Random Forest Regression model. What can I do to improve it?
 shut apex
Hi, does anyone know why there's a syntax error in this?
heat_data = [[row['Latitude'],row['Longitude']] for index, row in heat_df.iterrows()]
is there a help channel for r programming
 old thorn
@lapis sequoia don't believe so but there are many professional data scientists in the server so if you DM one of them, they could help you
 ember silo
Morning all!
Just getting into Tensorflow and was wondering if anyone had used the Raspberry Pi hat for it
 tough fiber
livid quartz
tough fiber
livid quartz
Am I using TomekLinks right ? My recall is still very low
azure stump
 lilac raven
how would I go about closing a figure after receiving no new incoming data? I tried for val in read_fname: if val is None: plt.close() inside and outside my animation loop but I don't think it's actively looking for new data even after the seperate file that outputs data is closed. I'd guess the code will analyze if it's given new data, but how would I go about adding a line to check if stream is even open
fair kernel
fallow rune
I was working with the Black Friday Dataset and got 64% accuracy on a Random For...
use xgboost?
fair kernel
streamlit?
outer fulcrum
Hey guys ! I have data from solar installations which are stored on an FTP server (csv files). I need a dashboard to visualize metrics and a way to define alerts. What kind of tools should I use ?
fair kernel
outer fulcrum
Hey guys ! I have data from solar installations which are stored on an FTP serve...
streamlit?
fair kernel
im working on one
look at streamlit homepage there are examples
Browse through some of the amazing apps that the community has created with Streamlit. If you want to have your app featured, just tweet it to us @streamlit!
 serene scaffold
Is anyone else here interested in NLP? I'm contemplating a program that, given a series of messages in a Discord-like environment, predicts which messages, if any, are being responded to by other messages.
So for example, gzuma's comment "im working on one" would be predicted as a response to ragepope's comment "you have any example projects with this?"
My colleague suggested I look into textual entailment but I doubt there's an off-the-shelf solution without making my own training data.
 sour marsh
Hey guys - anyone have experience with k-means clustering
having some difficulty using kmeans - keep getting errors
torpid cave
Hi guys
Hi do I increase a variable alphabetically within a loop... e.g.
for i in range(1,10):
  print(letter) #This should return 'A'
  #function to increase the letter, so the next iteration it prints 'B'
Somethingl ike that
DId not know about ascii_lowercase
Thank you
so much
I was googling this stuff but I didn't know how to formulate the question haha
actually that is simple
and easier
 tight torrent
I need some help with the Tweepy module
torpid cave
I am gonna vectorize it now
tight torrent
sometimes when tweepy is getting The tweet it Errors and i think its because of the characters. how do i prevent it..
torpid cave
No worries haha
lapis sequoia
lapis sequoia
is there a help channel for r programming
no but u could ask in offtopic
tight torrent
 astral pollen
@tight torrent If it is a retweet, the api returns it as truncated with ... if over a certain length. Is that what happens in your case?
tight torrent
astral pollen
<@429535933252239360> If it is a retweet, the api returns it as truncated with ....
its not the retweet
its the text
i saw stack posts and everyone said use the full_text arg instead of status.text
so i did the same
but still no work
no errrs
 heady hatch
Hello people. Question about tf.
I'm bumping into this error but I'm confused why.
InvalidArgumentError:  Matrix size-incompatible: In[0]: [100,751], In[1]: [750,32]
     [[node functional_17/dense_18/Relu (defined at <ipython-input-91-9f049ca8f25a>:1) ]] [Op:__inference_train_function_5904]
The layers in question are
______________________________________________________________________________________________
concatenate_13 (Concatenate)    (None, 750)          0           normalization_7[0][0]
                                                                 normalization_8[0][0]
                                                                 category_encoding_11[0][0]
                                                                 category_encoding_12[0][0]
______________________________________________________________________________________________
dense_18 (Dense)                (None, 32)           24032       concatenate_13[0][0]
I'm not sure what to make of this. Because I'm under the assumption that the shape would be (None, 750), but then it's outputting (None, 751) at concatenate_13?
tight torrent
astral pollen
are you just printing to stdout or how are you dealing with the tweet object?
im printing it to a stdout
yes
i have created a text file
the status will print it things
into the file
umm why u deleted the code? @astral pollen
astral pollen
I am on iphone so indentation got weird. Here it is:
if "extended_tweet" in status_json:
    print(status_json['extended_tweet']['full_text'])
elif 'retweeted_status' in status_json:
    if 'extended_tweet' in status_json['retweeted_status']:
    print(status_json['retweeted_status']['extended_tweet']['full_text'])
    else:
        print(status_json['text'])
else: print(status_json['text'])
the if x in status_json bits must be changed according to how you deal with the tweet object in your own code
astral pollen
can you show your code?
tight torrent
alr
class Tweet_analyzer():
    def tweets_to_dataframe(self, tweets):

        df = pandas.DataFrame(data=[tweet.full_text for tweet in tweets], columns=['Tweets'])

        #df['Date'] = numpy.array([tweet.created_at for tweet in tweets])
        df['Likes'] = numpy.array([tweet.favorite_count for tweet in tweets])
        df['Retweets'] = numpy.array([tweet.retweet_count for tweet in tweets])
        df['Tweet ID'] = numpy.array([tweet.id for tweet in tweets])

        return df


if __name__ == '__main__':
    command = input("Enter username: ")
    try:
        client = Twitter_client()
        analyzer = Tweet_analyzer()

        api = client.get_twitter_client_api()

        tweets = api.user_timeline(screen_name=command,count=20, tweet_mode = 'extended')

        df = analyzer.tweets_to_dataframe(tweets)
        #print(dir(tweets[0]))

        sys.stdout = open("Output.txt", "w",encoding='utf-8')

        print(df.head(10))

        sys.stdout.close()
    except Exception as e:
            print("User not found")
            print(e)
this is the main part
the others is just the auth and other boring stuff
@astral pollen
azure stump

Medium
Everyone used to neglect this.
 fading monolith
Can anyone please suggest a list of projects to do, that I can learn ML through? I’ve tried doing courses and they are boring, and I think doing projects and learning through them will be more fun...
Thank in advance!
lapis sequoia
In my pandas dataframe, a series say 'countries' have list of countries separated with dashes (-), how can I replace that with commas (,)?
 bitter harbor
fading monolith
Can anyone please suggest a list of projects to do, that I can learn ML through?...
bitter harbor
fading monolith
Can anyone please suggest a list of projects to do, that I can learn ML through?...
honestly i'd suggest learning the absolute fundamentals and building a model yourself without using a library (tf, keras, etc), it'll be a lot more work than following a course but imo you get more out of it + it makes the concepts easier to understand
 worldly palm
Anyone mind helping me out in matplotlib labeling with scatter plots? (I'm also in #help-burrito...)
 fallow prism
can someone explain me why this happened? yesterday i run my gensim TfIdf model and obtain vectors shwed in figure 1 and today i get figure 2, both codes are identical.
figure 1
ran*
 earnest forge
should I normalize/scale data for classification models?
especially, latitue and longtitute values
do they really need to be scaled?
fallow prism
yes you have
earnest forge
I suppose, it is better use StandardScaler, since there are negative values in coordinates data aswell
lapis sequoia
I'm having some issues with VSCode and Miniconda on a Mac. If anyone has suggestions, please let me know in #help-avocado
fallow prism
fig2
 molten hamlet
i know there is some geopandas module, can I use it for measuring distance between cities?
earnest forge
molten hamlet
i know there is some geopandas module, can I use it for measuring distance betwe...
did you plot geodata using pyplot?
 dense vigil
has anybody made an ai using pyttsx3, speechrecognition, wolfram alpha, and other modules?
if so dm me please
molten hamlet
earnest forge
did you plot geodata using pyplot?
???
earnest forge
i just thought that you want plot the data first and then find the distance on resulted plot
so if it is true, you can make a function that compute the distance by its own
 vocal zodiac
It’s anyone there in this channel ?
lapis sequoia
Hi
vocal zodiac
So the project that I am referring has done the project in Google Colab, while I am trying to do the same in Jupyter Notebook, can someone give me the alternative to from google.colab import files ?
So that I can have same functionality in my jupyter notebook ?
fair kernel
it runs in the browser, why u want to do this as an exe?
why not just dockerize or just share the link?
for web
thus i rly have no idea of how to make .exe files. so im out on that topic. but i wanted to do the same as u i guess and .exe easier to deliver to ppl sometims, so youre right
vocal zodiac
So no one ?
molten hamlet
earnest forge
i just thought that you want plot the data first and then find the distance on r...
I got normal test.csv not related to geopandas
earnest forge
did you use any specific features to build a plot
molten hamlet
what are you talking about?
molten hamlet
earnest forge
did you use any specific features to build a plot
plot of what?
earnest forge
like longtitude or latitude
molten hamlet
I don;t have this data, I asked if geopandas has it
earnest forge
oh
molten hamlet
earnest forge
oh
can I create geopd dataframe from magnitute long ?
and just plot it ?
earnest forge
do you have any geographical data in your dataset?
molten hamlet
no
earnest forge
hm. so how are you going to use geopandas, considering that it deals with geographical data
anyway, i'm not pro in it, so maybe there are some options that allow you to make more
molten hamlet
earnest forge
hm. so how are you going to use geopandas, considering that it deals with geogra...

Explore and run machine learning code with Kaggle Notebooks | Using data from multiple data sources
I was looking for something like this 😄
but I already got data from request 🤔
 dire comet
Hey, anyone good at pandas that could help me? I'm not a programmer.
 thin solstice
would this be an appropriate channel to ask about tensorflow ?
 vital yarrow
what are those fancy regression error lines that make graphs look more data science-y
i try replicating them by plotting the regression line but adding the errors for all of my parameters and making another regression line where i subtract the errors for all parameters
idk
 high badge
can someone explain to me why they use 1 and -1 instead of any other number?
this is for hard margin linear SVM classification
in the picture i believe it is a decision function with 2 inequalities or constraints
https://www.youtube.com/watch?v=IOetFPgsMUc&ab_channel=intriganointrigano
here is the video:
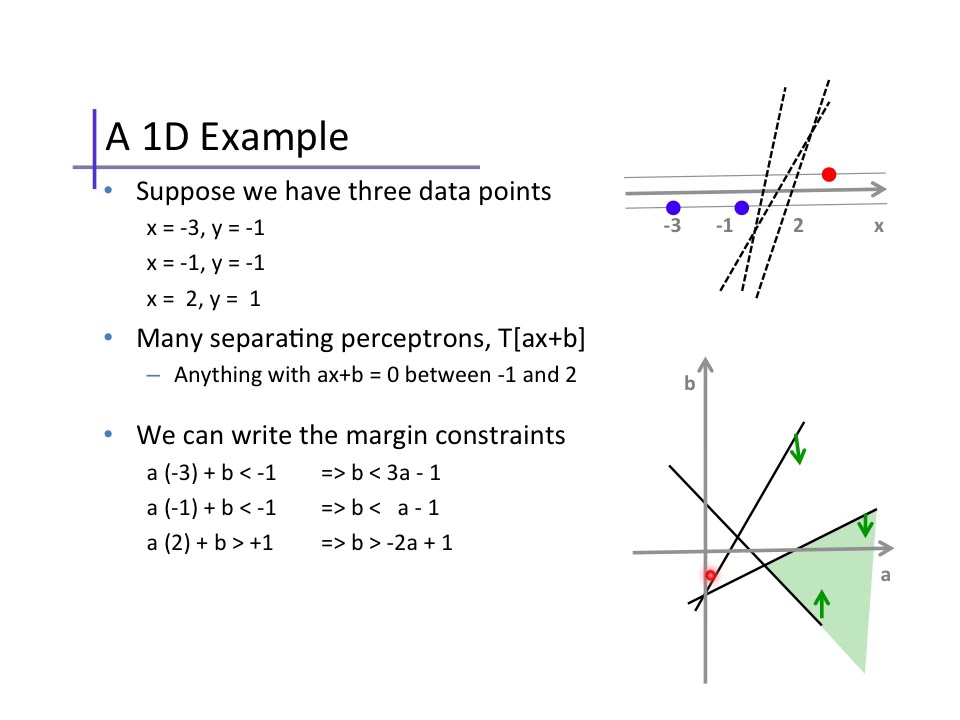
Basics of support vector machines: definition of the margin; QP form; examples
azure stump
 tight torrent
im trying to update my pypi project using twine upload dist/*
but it says twine is not recognized
its pip installed.
nvm i fixed it
 astral path
im trying to plot vertical lines over a spectogram in librosa, and i'm displaying the spectogram using librosa.display.specshow()
However, librosa.display doesn't have an option for plotting vertlines
How do I plot vertical lines placed at x values on a spectogram corresponding to a list in librosa?
e.g.
cheers!
worldly palm
Anyone know why animation works in Jupyter but not when run as .py?
Sample code: https://paste.pythondiscord.com/mugazuligo.yaml
(Trying to run in Pycharm IDE, but it only display the plt at the end, instead of frame by frame like in matplotlib)
tight torrent
i need help with PyPi, basically how do i update my PyPI project
whats the command
everyone is using twine upload dist/* but this dont work for me
it says twine is not recognized
;-;
i did pip install it
lapis sequoia
wait a minute I thought I typed
brazen owl
HI
can someone come on arsenic please ?
dat=np.loadtxt (fname=r"C:\Users\Amine13\Desktop\COURS 3I\math maintenance\a09.txt")
that the database
y=dat[:,1]
print ("Array element : ", y, "\n")

a, b, c, d = stats.cumfreq(y, numbins = 4)

print ("cumulative frequency : ", a)
print ("Lower Limit : ", b)
print ("bin size : ", c)
print ("extra-points : ", d)```


Okay so those lines are used to get the cumulative frequencies ie like what you can see on column D.

So what i want to do is plotting f(y), and i want to do this basically:

Construire la fonction de répartition F(t) en utilisant un tableau F[30], avec F[i] = P(T ≤ ti).

i don't know how but when using those lines:
```py
t = np.linspace(0, 29, num=30)
y = np.arange(1, len(t)+1) / len(t)```Someone please help me with PyPi im trying to update my existing project using twine upload dist/* and its showing this error
every one on internet saying thats the command but it dont work for me :/
please help
tight torrent
help pls
 charred obsidian
how do I combine two dataframes? The first dataframe has a index column and the other does not. How do I add the second dataframe and auto increment the index starting with the last index of the first dataframe?
molten hamlet
Hi, I got small problem, geopandas returns only one city, but there are like 10 cities with same name
from geopandas.tools import geocode

cities = geocode("Dobra Poland")
print(cities)
                   geometry                address
0  POINT (14.38475 53.48451)  Dobra, Poland, Poland
have you tried append? df1.append(df2)
charred obsidian
@molten hamlet I have not. I tried pd.concat([df1, df2]), let me give it a try now.
charred obsidian
@molten hamlet so apparently concat works but i had to pass in ignore_index=True
 somber bane
what is a suggested learning rate and number of iterations for applying sotchastics gradient descent on matrix factorization?
tight torrent
my own packagae is not being found in the site-packages hence cannot be imported
pls help
dire comet
Anyone good at Pandas that can help a noobie?
somber bane
@dire comet you can post out the problem here, may others can solve your problem too
dire comet
Ok
Why my plot shows like this?
I need it to be like this one
I dont understand the parameters of the plots
Its suposed that i'm using same values
somber bane
tight torrent
pls help
I hope this will help https://stackoverflow.com/questions/14295680/unable-to-import-a-module-that-is-definitely-installed

Stack Overflow
After installing mechanize, I don't seem to be able to import it.
I have tried installing from pip, easy_install, and via python setup.py install from this repo: https://github.com/abielr/mechaniz...
dire comet
Is there any site where I can hire a python programmer to help me with my code? is really basic
molten hamlet
somber bane
what is a suggested learning rate and number of iterations for applying sotchast...
smaller than 1 probably, well it depends, but 1e-3 ~ 1e-5 should be nice
molten hamlet
tight torrent
im but i cant help rn sorry
install it with pip, dont put it manually 😄
tight torrent
bruh
im no noob
ik how packages are made
And that is called LOCALLY installing
tight torrent
im trying to install from pypi
molten hamlet
pypi uses pip
tight torrent
thats what im using
molten hamlet
pypi has always command for instaling
tight torrent
Guys i need to create Enviorment Variables for my api keys but where do i make it
its running on pypi
i tried on desktop but it no worke..
molten hamlet
Did anybody used fuzzywuzzy?
I wonder If I can reduce 170 labesl into few
dire comet
Anyone know how to make a matrix A vs B, from a DataFrame?
molten hamlet
lapis sequoia
can somebody help me with something related to matplotlib?
ask question
molten hamlet
dire comet
Anyone know how to make a matrix A vs B, from a DataFrame?
ask question
molten hamlet
🥂
lapis sequoia
Is there a recommended tutorial for Deep Learning in python?
molten hamlet
lapis sequoia
Is there a recommended tutorial for Deep Learning in python?
no, but check pins
lapis sequoia
Thanks!
 sterile minnow
😄
 lunar bear
I wanna do data science where should I start.
 blissful merlin
I just posted in #help-cheese about a neural network problem I having - in particular to do with tensorflow input shape.
if there are any experts would hugely appreciate their help :)
arctic wedgeBOT
:x: According to my records, this user already has a mute infraction. See infraction #24333.
:incoming_envelope: :ok_hand: applied mute to @lapis sequoia until 2020-12-12 20:56 (9 minutes and 59 seconds) (reason: burst rule: sent 9 messages in 10s).
astral path
im trying to plot vertical lines over a spectogram in librosa, and i'm displaying the spectogram using librosa.display.specshow()
However, librosa.display doesn't have an option for plotting vertlines
How do I plot vertical lines placed at x values on a spectogram corresponding to a list in librosa?
e.g.
dire comet
Anyone knows what this mean?
KeyError: 139028
bitter harbor
In what context?
 idle yoke
dire comet
Is there any site where I can hire a python programmer to help me with my code? ...
idle yoke
dire comet
Is there any site where I can hire a python programmer to help me with my code? ...
I would suggest fiverr
dire comet
bitter harbor
In what context?
I was making a Matrix from a DataFrame
And used this
val = df.loc[i,"Sector"]
in a For in
Forget it, found the error. I used In the for in Range (0,len(df) +1) and was without the +1
 weak solstice
does anyone know how to set up gpu acceleration for tensorflow
 midnight crag
hello nix
 void onyx
im here to learn how to code and make bots
 lilac oasis
Anyone able to help with streamlit and creating different charts based on data from csv?
tight torrent
Guys my environ variable is printing nOne
when im trying to print it
even though its registered in my system
lapis sequoia
Who is interests by lot of knowledge ?
torpid cave
Sup
who is familiar with SeetingWithCopyWarning.. a vlue is trying to be set on a copy of a slice from a DataFrame
 hushed wasp
Hello guys,
I would like to represent my errors (y - ypred) after a pipeline.
Which is the easiest way please?
Thanks
lapis sequoia
can someone help with a big dataset, i know how to code it but it is taking me a really long time for my code to run
molten hamlet
what was the name of method to give more data to the model to prevent overfitig?
regularization
thanjks
 dapper pivot
Hi there, a BI developer here interested in applied ML, econometrics and how to use applied data science techniques in predictive analytics!
 upper schooner
Hi im trying to use images from an HDR movie (10bit depth) to train on, but i cant find a single package that can load my video without compressing the video down to 8bit. I've heard that ffmpeg can do it, but ive tried and failed, and the documentation is so confusing i don't know where to even start reading. If anyone has experience with how to do this i would appreciate the help.
upper schooner
lapis sequoia
can someone help with a big dataset, i know how to code it but it is taking me a...
Look into data loaders and generators if youre not already using them. This article explains it really well: https://stanford.edu/~shervine/blog/pytorch-how-to-generate-data-parallel
Blog of Shervine Amidi, Graduate Student at Stanford University.
 burnt veldt
Why cant I load a excel file with pandas in jupiter notebook its a xlsx file type
i know i have to use openpyxl
But even with that it sitll doesnt work
df1 = pandas.read_excel("supermarkets.xlsx", sheet_name=0, engine = openpyxl)
df1
which raises the error
ValueError: Unknown engine: <module 'openpyxl' from '/Library/Frameworks/Python.framework/Versions/3.8/lib/python3.8/site-packages/openpyxl/init.py'>
lapis sequoia
What's data science
molten hamlet
lapis sequoia
What's data science
data mining is old term
serene scaffold
lapis sequoia
What's data science
the science of data
or more specifically, how you can find insights from large amounts of data by leveraging computer science.
It's closely related to AI and machine learning.
 charred cipher
hi so ive been working on this project and the first sight errors are gone but slowly all the inner errors are coming in that come only when you execute and try
ill paste bin the program for you all to see and try
since ive imported a csv file from my files, idk if you all will be able to run this program but do let me know if you spot some errors in places like histogram, pie chart etc.
ive paste the code here
molten hamlet
no database mininig dude
data mining
Data mining, also called knowledge discovery in databases, in computer science, the process of discovering interesting and useful patterns and relationships in large volumes of data. The field combines tools from statistics and artificial intelligence (such as neural networks and machine learning) with database management to analyze large digital collections, known as data sets. Data mining is widely used in business (insurance, banking, retail), science research (astronomy, medicine), and government security (detection of criminals and terrorists).
britanica
torpid cave
Hi all
I have a pandas question for which I think I am having more problem than expected
 rich plover
Hi where is a good place, to see the analysis of a given data set
 polar charm
Hello, I'm getting py UndefinedMetricWarning: R^2 score is not well-defined with less than two samples. and very fluctuating results on my predictions.
49.49375681 this time and 1297.54128991 the next time. How do I fix it
 bold olive
How can I use the sk-learn classifiers using just a single feature?
sweet plaza
Does anyone have a good book or youtuibe video that teaches really baseline Data Literacy , I think its jsut hard to study Data Science without knowing fundamentals like these .
Much appreciated
 frozen skiff
polar charm
Hello, I'm getting ```py
UndefinedMetricWarning: R^2 score is not well-defined w...
frozen skiff
polar charm
Hello, I'm getting ```py
UndefinedMetricWarning: R^2 score is not well-defined w...
Regarding the error/warning: you seem to be calculating R^2 on less than two samples, which results in division by zero. Consider the formula in https://scikit-learn.org/stable/modules/model_evaluation.html#r2-score if you take n = 1.
What happens is that the average y̅ is equal to yᵢ, resulting in the denominator being zero and causing a divison by zero
 scarlet storm
can I ask web scrapping question here ?
polar charm
So how do I get more accuracy on my predictions? and is it ```py
r2_score
X = ['Adj Close']
y = ['Adj Close']
Edit: did  ```py
r2_Score = X = df['Adj Close'], y = df['Adj Close'] ```
got error ```py
r2_Score = X = df['Adj Close'], y = df['Adj Close']
ValueError: too many values to unpack (expected 2) ```How do i get more accuracy on my predictions?
This really depends on what problem you are solving, but a very general tip would be to just check if somebody else has done something on your specific topic of interest
polar charm
I'm trying to code a s&p500 predictor.
scarlet storm
I am trying to scrape genres and reviews out of imdb page and I am able to scrape reviews but not genre cause I think js is loading it dynamically
what can I do to scrape the genre in this case ?
frozen skiff
scarlet storm
I am trying to scrape genres and reviews out of imdb page and I am able to scrap...
If the website is dynamic, you will have to use Selenium or some alternative
scarlet storm
thanks
 flint nest
why is a conv2d 2d kernel used to convolve over rgb images?
in tensorflow
like how does it work, you would expect a 3d kernel for rgb images right?
 frozen moth
Hey guys, quick question. Say I have a dictionary:
my_dict = {'male': ['Jack', 'John', 'Bob'], 'female': ['Jane', 'Mary', 'Carolina']}
and I also have a DataFrame with a feature filled with names:
my_data = {'id' : [1, 2, 3], 'name' : ['John', 'Mary', 'Jack']}
my_dataframe = pd.DataFrame(data = my_data)
and I want to create a new feature called gender:
my_data = {'id' : [1, 2, 3], 'name' : ['John', 'Mary', 'Jack'], 'gender' : ['male', 'female', 'male']}
my_dataframe = pd.DataFrame(data = my_data)
How can I create my for loop such that for every entry of my DataFrame male or female gets added to the new column based on the names that are in my dictionary and weather or not they match the key-item pairs?
frozen skiff
you could iterate over names ("name") inside your my_data dictionary, check whether (1) the name is inside the male names' list or (2) is inside female names' list and store that inside a new list, then assign it to a new column inside your dataframe
 steep widget
hi guys, this is probably answered but i couldn't find a good way to word it on google.
say i have a list with elements structured like ['1000 +xx']
where xx is some uncertainty that changes with each element, e.g [ ['1000 +44], ['2313 +54] ]
how to i remove the +xx from each element, something like cut everything starting from +?
thank you 🙇♂️
 muted oyster
can someone help me with interpreting the result of Anova test ? like if I have to find significance between Age and Sales, and the p value is coming below Alpha(0.05)
frozen skiff
steep widget
hi guys, this is probably answered but i couldn't find a good way to word it on ...
If I understand correctly that you're dealing with strings, you could take a look at the find() function to find the starting index of "+", and then slice your string accordingly
lapis sequoia
@ me
 slim tiger
marker="."
 tepid pawn
Hey everyone, new to Discord. This place is loaded with great info and experts.
 teal sluice
I have a dataframe loaded with one column being dates, what be the best way of creating a dataframe specific to the dates for the month/year (the format of the date is year-month-day all as integers)??
lapis sequoia
any good courses to get used to working with data? @ me
heady hatch
If you’re using pandas, you can strip the dates using something like “df.dt.month”. They need to be in a date time readable format.
@teal sluice
tepid pawn
@lapis sequoia The datacamp ones seemed to be ok. I had a free subscription and we had to do a couple of them with a class I was taking. To be honest all of the ones that I've looked at online have been very regurgitative in nature. If you know Python (or R) I'd recommend finding a project on Kaggle or wherever and just go at it. You'll screw it up at first, but as you work through it you'll learn. I google the hell out of stuff that I don't know and watch different videos online for specific things.
lapis sequoia
thanks man!
tepid pawn
You're welcome
 languid dagger
Is there a faster way to turn a 2d numpy array into a 1d numpy array of tuples than numpy.array(list(map(tuple, my_2d_nparray)))? And the followup if anyone is willing to engage, is whether I'm barking up the wrong tree entirely.
heady hatch
languid dagger
Is there a faster way to turn a 2d numpy array into a 1d numpy array of tuples t...
As in you want to flatten the arrays?
languid dagger
The context is that I'm saving a point cloud as a PLY file. I have an array of XYZ coordinate and RGBA color data to pass to plyfile, but it complains if it has more than one dimension.
GitHub
NumPy-based text/binary PLY file reader/writer for Python - dranjan/python-plyfile
tepid pawn
Anyone on here tonight?
serene scaffold
tepid pawn
Anyone on here tonight?
yes
tepid pawn
I'm new here, just trying to get a feel for it.
working through a problem set for predictions right now
lapis sequoia
hey guys
I need some urgent help in pandas and matplotlib
can someone help me in the DMs?
 compact flume
Hey y'all! I'm still kinda new to python but was wondering if there are any beginner friendly data science/quantitative modeling project ideas I could start on?
velvet thorn
steep widget
hi guys, this is probably answered but i couldn't find a good way to word it on ...
regular expressions
velvet thorn
frozen moth
Hey guys, quick question. Say I have a dictionary:
```Python
my_dict = {'male': ...
are there cases where names are in neither?
velvet thorn
flint nest
like how does it work, you would expect a 3d kernel for rgb images right?
why do you say so?
because images are 3D?
 carmine bough
Hi guys, I need help with the following: I have a Video in which a person lifts her right arm, standing in different positions. I also have pictures, that show exactly this pose. Now I need a programme, that uses machine learning, saying when the pose "right arm up" is shown in the video. I already tried to find something like that but counldn't find anything. Is there any github repository or so that provides code doing exactly this? Or is someone able to write that code for me in return for a little fee?
lapis sequoia
carmine bough
Hi guys, I need help with the following: I have a Video in which a person lifts ...
Hi, why don't you check for something like gesture recognition then you can relate that to your project. Just a simple google search gave me this https://github.com/SouravJohar//handy I think it's similar to what you are trying to do!
 carmine bough
lapis sequoia
Hi, why don't you check for something like gesture recognition then you can rela...
carmine bough
lapis sequoia
Hi, why don't you check for something like gesture recognition then you can rela...
Thank you, thats not too bad, but not using machine learning. However this has to be a part of the project...
lapis sequoia
I think they are using machine learning, to determine what the gesture is, it's not possible to just do it with opencv
velvet thorn
carmine bough
Thank you, thats not too bad, but not using machine learning. However this has t...
...is this for school?
 upbeat jetty
Which free (or at least having a free tier) APIs you think are most useful to learn?
 fleet plover
For https://gist.github.com/promach/a68da1a80e84a55320e73501711618c8#file-mcts-py-L41 , how should I deal with parent_visits inside MCTS ?

Gist
A simple vanilla Monte-Carlo Tree Search implementation in python - mcts.py
 safe tapir
Is there a jargon etymology resource? Trying to understand why certain words were used to describe things so I can more easily remember them. Some things are google-able (latent -> hidden), but some are not as obvious (e.g. why are they called transformers?)
hushed wasp
Hello Guys,
Does someone could tell me why I have a worse score after a GridSearch than before?
On a KNRegressor
Here is mycode :
 lapis iris
Hi I want to remove 3rd elements from nested list
lista = [('one', 'two', ['remove this element']),
         ('three', 'four', ['remove this element'])]
any advice how to do this shortly without iterate over and over?
heady hatch
hushed wasp
Hello Guys,
Does someone could tell me why I have a worse score after a GridSea...
One score is referring to r2 and the other one is referring to mean accuracy. How do you know it has a worse score?
heady hatch
lapis iris
Hi I want to remove 3rd elements from nested list
```Python
lista = [('one', 'tw...
Is it all in one list?
lapis iris
heady hatch
Is it all in one list?
kindof, list contains around 50 records
heady hatch
Like 50 records under one list?
lapis iris
ye
heady hatch
I don’t think you need to iterate through anything at all.
If you want to delete every nth element from a list you can just use
del a[n-1::n]
Oh wait to clarify do you want to keep the removed elements?
lapis iris
elements are hardcoded si I dont care bout em
heady hatch
Then yea just delete every nth starting from n-1.
lapis iris
heady hatch
Then yea just delete every nth starting from n-1.
well,
print(lista[:-1])
doesnt work
heady hatch
lapis iris
well,
```
print(lista[:-1])
```
doesnt work
What about it doesn't work?
What are you expecting print(lista[:-1]) to do?
lapis iris
output should be like [('one', two'), ('three', 'four')]
and output is like [('one', 'two', ['remove this element'])]
lapis iris
ye
heady hatch
Then yea you're going to have to iterate.
Unless you want to flatten and zip it back up again.
new_a = [e[:2] for e in a]
Something like that should work.
hushed wasp
heady hatch
One score is referring to r2 and the other one is referring to mean accuracy. Ho...
For me my R2 went to 0.70 to 0.48
heady hatch
hushed wasp
For me my R2 went to 0.70 to 0.48
Why do you think that 0.48 is r2?
lapis iris
I went with: print([i[:2] for i in lista])
hushed wasp
heady hatch
Why do you think that 0.48 is r2?
The KNRegressor documentary
heady hatch
Ahh yea I totally misread and thought it was a classifier. my bad.
heady hatch
hushed wasp
The KNRegressor documentary
Do you mind doing cross validation on your original model? I'm trying to find some more insight about the data.
I'm wondering if there's a distribution difference or if the gridsearch is tuned towards some other goals than what you originally wanted.
hushed wasp
I guess it's something like that
I gonna try it
my original model is like an other one?
I don't have any trouble with RF or ridge or lasso only with the KN...
heady hatch
Oh as in the cv from original model match cv from gridsearch?
languid dagger
I'm trying to segment 2D points according to whether they "form a line". Like whether the local dimension is 1 or 2. I've had some imperfect success by dilating then eroding, which removes the lines and keeps the blobs. It seems like a problem that might already be solved much better though. Anybody know?
hushed wasp
heady hatch
Oh as in the cv from original model match cv from gridsearch?
I guess... Sorry I am still very new in all of this
 plain cargo
hi all. I am new to pandas and dataframes. Apparently dataframes damage the type system as it does not reveals its columns/field names until runtime. But converting between dataframes and list of model objects seems too cumbersome. Is there an elegant way to solve this issue?
heady hatch
hushed wasp
I guess... Sorry I am still very new in all of this
Heya no worries. Your situation is pretty interesting too. I'm trying to think of reasons why gridsearch might find a lower optimal point than default setting.
One basic thing you can do is add the default parameters in there too and see if gridsearch finds that. If not then I believe something is really wrong.
teal sluice
I have a dataframe (imported via csv) which consists of 2 columns, one being only 2 values ( Outgoing/Ingoing) and another consisting of an amount, I was wondering if there was a way of changing the secnd column so all the rows consisting of 'Outgoing' has a '-' in front of the amount??
heady hatch
teal sluice
I have a dataframe (imported via csv) which consists of 2 columns, one being onl...
Heya,
to clarify your dataframe has two columns, one (in/out) and the other amount?
Assuming you're working with pandas.
You can boolean index the outgoing and either multiply the column by -1 or add '-' in front if it's a string.
ie.
df
  a   b
  in  3
  out 4
  in  2
  out 5

mask = df['a'] == 'out'
neg_col = df.loc[mask, 'b'] * -1
df.loc[mask, 'b'] = neg_col
You can clean that all up in one line if you'd like. I separated it for better readability.
hushed wasp
heady hatch
Heya no worries. Your situation is pretty interesting too. I'm trying to think o...
I found some others cases on stackoverflow with the KNRegressor where there is the same issue.
Can I ask you to explain me how to do a default gridsearch please? 🙂
heady hatch
Oh by default gridsearch, I just meant using the hyperparameter you used in the original model where you just fit it on the xtrain and ytrain.
But looking over your parameter dictionary, I think I see the default hyperparameters there.
Can you try running gridsearch with nothing but 5 neighbors, uniform weights, auto algorithm, and minkowski metric?
@hushed wasp
See if gridsearch comes up with the same model as just the regular model.
oh there's probably a scoring section too in gridsearchcv.
In terms of scoring, you can put 'r2'.
So like
gridsearchcv(model, parameter, scoring='r2')
teal sluice
@heady hatch Works perfectly thnx, do u mind just explaining what the code does line by line, just so I understand what's happening 😄
heady hatch
teal sluice
<@!542872811245666305> Works perfectly thnx, do u mind just explaining what the ...
Yea of course.
To preface, how familiar are you with pandas?
teal sluice
I just know the basics essentially, so basic selecting, indexing etc
heady hatch
Ahh okay okay. Are you familiar with boolean indexing yet?
teal sluice
not really
heady hatch
If you don't mind, on the side can you pull up a pandas dataframe so you can follow along.
teal sluice
Yep will do
heady hatch
here's a quick df you can initialize.
df = pd.DataFrame({'a': list('abcd'), 'b': list('efgh')})
You should have a dataframe of shape 4 x 2, where both columns are strings.
teal sluice
yep just put it onto jupyter
teal sluice
prints a column a out with the index on the left
earnest forge
Have anyone tried to implement Linear Regression by themselves? Without using sklearn. Just in educational purposes to understand principles of model work much better
heady hatch
teal sluice
prints a column a out with the index on the left
Okay now try printing
print(df['a'] == 'c')
Let me know what you're seeing now.
heady hatch
earnest forge
Have anyone tried to implement Linear Regression by themselves? Without using sk...
Do you have any question on implementation itself?
teal sluice
prints out the index with a list of boolean values
guessing it goes through and sees which is c
and thus marks that one as true
heady hatch
Yup.
and now try printing
print(df[df['a'] == 'c'])
prints out the one row which has c in column a
heady hatch
Yup, and this is boolean indexing.
Essentially what it does is it selects indices by boolean values.
teal sluice
ohh ok
so from the code u suggested, it select all the rows which are 'out' and to those it multiplies whatever is in the second columns by -1 to give the negative of that answer
heady hatch
Now to explain what I've written.
mask = df['a'] == 'out' #get indices of rows with Output
neg_col = df.loc[mask, 'b'] * -1 #select column b from all those rows and multiply it by -1
df.loc[mask, 'b'] = neg_col #reassign those rows back into the original dataframe
Mhm.
teal sluice
thanks for the help really do appreciate it
heady hatch
Technically you can do it all in one line.
like
df.loc[df['a'] == 'out', 'b'] = df.loc[df['a'] == 'out', 'b'] * -1
But there's a lot of things going on here.
No problem, glad to be of help.
Or maybe you can just
df.loc[df['a'] == 'out', 'b'] *= -1
But I've never tried it.
bitter harbor
i'd assume it'd be pretty standard, Ive used it on pycharm but it's nothing special
vsc might have an actual linter extension tho
 rugged flame


 lapis sequoia
So I am using this software https://augcog.github.io/ROAR/ in this autonomous driving simulation game http://carla.org
I have this super annoying issue where the car stays inbetween the lanes when it drives straight
But as soon as the road curves
my program gets confused? Like it can’t see the lines properly and it keeps crossing them
It’s like it is driving between the curved lanes as if they are straight
if anyone has experience working with Carla please @ me
twilit pilot
When I am using numpy, I want to append and array to another array and get a 2d array, but this is what I am getting. Can someone help?
import numpy as np

final = np.array([])
final = np.append(np.array([1, 2, 3]), final)
final = np.append(np.array([4, 5, 6]), final)
final = np.append(np.array([7, 8, 9]), final)

print(final)
```Result :
[7. 8. 9. 4. 5. 6. 1. 2. 3.]
But I want it to be
[[1, 2, 3], [4, 5, 6], [7, 8, 9]]
You can try
l = []
l.append([1, 2, 3])

np.array(l)
concatenate lets you choose the axis as well
velvet thorn
twilit pilot
When I am using numpy, I want to append and array to another array and get a 2d ...
you want r_
or stack
!e
import numpy as np

a1 = [1, 2, 3]
a2 = [4, 5, 6]
a3 = [7, 8, 9]

print(np.stack([a1, a2, a3]))
@velvet thorn :white_check_mark: Your eval job has completed with return code 0.
001 | [[1 2 3]
002 |  [4 5 6]
003 |  [7 8 9]]
 vale rampart
hi
twilit pilot
velvet thorn
!e
```py
import numpy as np
a1 = [1, 2, 3]
a2 = [4, 5, 6]
a3 = [7, 8, 9]
print...
ah ok thanks man
earnest forge
heady hatch
Do you have any question on implementation itself?
No
livid quartz
Does anyone know what cmap this is? I'm using matplotlib
 gray tartan
@livid quartz it looks like bwr
here's the reference for all cmaps matplotlib has https://matplotlib.org/examples/color/colormaps_reference.html
btw, if someone can look at it, i'm having a problem with matplotlib subplots, im using a gridspec and shared axis for a grid of subplots, this way :
fig = plt.figure(figsize=(np.array(img.shape) / 20)[1::-1])
gs = fig.add_gridspec(5, 5, wspace=0, hspace=0)
plt.xticks(np.arange(5))
plt.yticks(np.arange(5), np.arange(1, 6))
problem is, i want the x axis ticks and labels to be at the top, so i added that to my setup :
plt.rcParams['xtick.bottom'] = False
plt.rcParams['xtick.labelbottom'] = False
plt.rcParams['xtick.top'] = True
plt.rcParams['xtick.labeltop'] = True
but only the ticks go to the top, the label stay at the bottom, do you have any idea of why ?
livid quartz
gray tartan
here's the reference for all cmaps matplotlib has https://matplotlib.org/example...
thanks
hushed wasp
heady hatch
Oh by default gridsearch, I just meant using the hyperparameter you used in the ...
Thanks a lot gonna try it 🙂
 torpid wadi
in pandas I need to filter column that contains list when I try
filtered_data.query('"a" in letters')
letters is ['a', 'b'] I get error SystemError
I found documentation only for oposite
df[df['b'].isin(["a", "b", "c"])]
 main badger
Hi.. I have a nested dictionary I want to plot. With the below code, I get the plot grouped by the inner dictionary key on the x-axis. I want the plot to be grouped by the outer dictionary key. What do I do?
df = pd.DataFrame(precision_data)
df.plot(kind="bar", stacked=False)
plt.show()
Found it. transpose() does it.
df.transpose().plot(kind="bar", stacked=False)
Hi all I keep getting the error there is no file.directory. I think Python is looking in the wrong directory but I can't seem to figure it out:
import os
import pandas as pd
path = 'D:\Python\FileForMergeExcel'
cwd = os.path.abspath(path)
files = os.listdir(cwd)

df = pd.DataFrame()
for file in files:
    if file.endswith('.xlsx'):
        df = df.append(pd.read_excel(file), ignore_index=True)
df.head()
df.to_excel('total.xlsx') ``

``FileNotFoundError: [Errno 2] No such file or directory: 'Report 1 - Copy.xlsx```why does this give me the column means? I thought axis 0 indicates rows?
gray tartan
@livid quartz it averages along the axis, it's like putting your data in a table and adding a row which has the mean of every column
livid quartz
Ah, that explains it thank you
gray tartan
@lapis sequoia you need to escape the \ because they ain't interpreted as characters
lapis sequoia
Thanks man where to put the \ ?
gray tartan
path = 'D:\\Python\\FileForMergeExcel'
lapis sequoia
You're the best Imma try it out
gray tartan
i would use pathlib for that tho, it handles paths better
lapis sequoia
@gray tartan I think it's an other problem because it is finding the files but still gives the error. I will try pathlib
lapis sequoia
Still the same error :C
hushed wasp
hushed wasp
Thanks a lot gonna try it 🙂
@heady hatch it works with a gridsearch with normal parameters!!
torpid cave
@lapis sequoia try using /
gray tartan
@lapis sequoia sry i'm working, well windows uses \ in their paths, so it should work, the problem might come from the rest of your path then
lapis sequoia
The weird thing is that the files are in the directory that I use
frozen moth
velvet thorn
are there cases where names are in neither?
nope, but I figured it out in the end using lambda expressions
but thanks guys
Guys easy and quick question:
If i have a dataFrame with duplicated names and with different values how to I aggregate them into one single entry?
df = pd.DataFrame(
    data = [
        ['John', 1, 1],
        ['Tom', 0, 1],
        ['Mary', 1, 4],
        ['Tom', 3, 1],
        ['John', 0, 3]],
    columns = ['Name', 'Dogs_Owned', 'Cats_Owned']
)
from this
to this
figured it out
solved
 storm gate
so are more people using fastAPI over flask now?? at least for model deployment?
Ive seen a few things where the code looks identical between the two
 shy moat
Can I configure the depth of profiling?
I want to analyze computation time of my own code but the default profiling is too detailed.
 dapper karma
is there a library that can locate an image on the screen quickly? The pyautogui version of this function (pyautogui.locateCenterOnScreen) takes around 1 or 2 seconds so it's pretty slow
storm gate
opencv
they have a function (blanking on what its called) where u provide a sample image and it tries to find it or all instances of it on the screen
dapper karma
alright ill check that out
hmm it doesnt say how fast that is
i think i'll manually test to see if its faster than pyautogui
storm gate
its def gonna be faster then pyautogui
rich plover
X = df[["xG","deep", "ppda_coef"]].values.reshape(-1,1)
Y = df[["scored"]].values
---------------------------------------------------------------------------
ValueError                                Traceback (most recent call last)
<ipython-input-8-96914964615e> in <module>
----> 1 X_train, X_test, Y_train, Y_test = train_test_split(X, Y, test_size=0.2, random_state=7)

~\anaconda3\lib\site-packages\sklearn\model_selection\_split.py in train_test_split(*arrays, **options)
   2125         raise TypeError("Invalid parameters passed: %s" % str(options))
   2126
-> 2127     arrays = indexable(*arrays)
   2128
   2129     n_samples = _num_samples(arrays[0])

~\anaconda3\lib\site-packages\sklearn\utils\validation.py in indexable(*iterables)
    291     """
    292     result = [_make_indexable(X) for X in iterables]
--> 293     check_consistent_length(*result)
    294     return result
    295

~\anaconda3\lib\site-packages\sklearn\utils\validation.py in check_consistent_length(*arrays)
    254     uniques = np.unique(lengths)
    255     if len(uniques) > 1:
--> 256         raise ValueError("Found input variables with inconsistent numbers of"
    257                          " samples: %r" % [int(l) for l in lengths])
    258

ValueError: Found input variables with inconsistent numbers of samples: [2052, 684]
Hi so I got this error, I understand there are more samples and I went online to try resolve it
Most solutions said add .reshape(-1,1) to fix it
But it didn't do anything
😦
dapper karma
storm gate
its def gonna be faster then pyautogui
how would i find an image on the screen though? i think the library only allows me to look for an image inside another image not on the screen
storm gate
you can screencap the screen im pretty sure
Stack Overflow
Is there a way with Python (maybe with OpenCV or PIL) to continuously grab frames of all or a portion of the screen, at least at 15 fps or more? I've seen it done in other languages, so in theory it
theres other ways to do it for sure