#data-science-and-ml
1 messages · Page 273 of 1
 cedar sun
 velvet thorn
<@534837275234795530> you need the number of channels
velvet thorn
<@534837275234795530> you need the number of channels
ValueError: Error when checking input: expected conv2d_1_input to have 4 dimensions, but got array with shape (8656, 64, 64)
model.add(Conv2D(32, kernel_size=(3, 3),
                 activation='relu',
input_shape=(*dimension, 1)))```Now if i do 1, *dimension, 1 it sais my dimension is 5
and expected 4
so i dont understand
 trim oar
Have you tried PCA instead?
https://scikit-learn.org/stable/modules/generated/sklearn.decomposition.PCA.html
If you just need to build a model / your features are many relative to your data points, you could try PCA if you don't need to explain "why". PCA basically finds the direction that explains the most variance for all your dimensions(features), which basically removes the multicollinearity.
Oh
I mean inherently fitted values / residuals don't explain "missing data" but about inherent patterns that's not explained in your model
I mean if the problem is not your dataset, then you probably have to change a model. I'm not that great with statistics, but without knowing what data you're working with and why you chose the model you did, it's hard to say already.
A possible reason tho
You're fitting a regression into a classification problem
So you may hvae a multiclass feature that's not encoded. My wild guess
velvet thorn
cedar sun
Now if i do ``1, *dimension, 1`` it sais my dimension is 5
include channels, but not batch size
cedar sun
train_data.append(new_array / 255)
velvet thorn
no...
cedar sun
model summary?
model = Sequential()
model.add(Conv2D(32, kernel_size=(3, 3),
                 activation='relu',
                 input_shape=(*dimension, 1)))
model.add(Conv2D(64, (3, 3), activation='relu'))
model.add(MaxPooling2D(pool_size=(2, 2)))
model.add(Dropout(0.25))
model.add(Flatten())
model.add(Dense(128, activation='relu'))
model.add(Dropout(0.5))
model.add(Dense(len(train_label), activation='softmax'))

model.compile(loss=keras.losses.categorical_crossentropy,
              optimizer=keras.optimizers.Adadelta(),
              metrics=['accuracy'])

history = model.fit(train_data, train_label,
                    batch_size=batch_size,
                    epochs=epochs,
                    validation_data=(valid_data, valid_label),
verbose=1)```this?
cedar sun
(64, 64)
cedar sun
ValueError: Error when checking input: expected conv2d_1_input to have 4 dimensions, but got array with shape (8656, 64, 64)
len(train_data) = 8656
velvet thorn
ah
that is
a problem with your data
use this
train_data[..., np.newaxis]
your data needs to have a channels axis too
cedar sun
wait why? i actually have 8656 images of 64x64 pixels each one
where is the problem with my data?
velvet thorn
it needs to have shape (batch_size, height, width, channels)
velvet thorn
cedar sun
where is the problem with my data?
your data does not have a channels axis
which it should
do the same thing for the validation data
cedar sun
model.fit(train_data, train_label,
for
model.fit(train_data[..., np.newaxis], train_label[..., np.newaxis],
?
velvet thorn
do you understand
cedar sun
history = model.fit(train_data[..., np.newaxis], train_label,
                    batch_size=batch_size,
                    epochs=epochs,
                    validation_data=(valid_data[..., np.newaxis], valid_label),
verbose=1)```sorry i dont understand what does the nn expect to recieve
cedar sun
yes
velvet thorn
so the thing is
even if your image is greyscale
you must still have a channels axis
just that that axis is of size 1
if you have RGB, size 3
RGBA, size 4
etc.
got that?
cedar sun
u said i need a channel dimension, which isnt there
cedar sun
i though i was adding the channels here
model.add(Conv2D(32, kernel_size=(3, 3),
                 activation='relu',
input_shape=(*dimension, 1)))```on input_shape
velvet thorn
no
okay
you need to distinguish between
your model definition and your data shape
velvet thorn
cedar sun
i though i was adding the channels here
this is telling the model what shape to expect
cedar sun
a
velvet thorn
cedar sun
```py
history = model.fit(train_data[..., np.newaxis], train_label,
...
this is changing the data you pass to the model
the two must match.
cedar sun
okey so right now, since my images are 64x64, i only have 2 dimensions
velvet thorn
velvet thorn
this is telling the model *what shape to expect*
this needs to be known to compile the model (in particular, knowing how many params are needed)
velvet thorn
cedar sun
okey so right now, since my images are 64x64, i only have 2 dimensions
yes, but because you're using 2D convolution, each image needs to have 3 axes
so you need to add the missing channels axis
cedar sun
width and height. But i understand nn needs the number of channels. so i take it as 3 dimensions
velvet thorn
which makes each image a 3D array
so
the thing is
the model doesn't need to know how many images are passed in at once
that is the batch size.
correct?
cedar sun
yes
velvet thorn
it only needs to know the shape of a single image
that is why the input_shape you pass in is 3D.
now, going back to the call to .fit
cedar sun
okey
cedar sun
an array with number of images and dimensions?
velvet thorn
but your data is currently 3D of shape (image_count, height, width)
cedar sun
to the end or the the beggining?
 midnight trench
hmm
cedar sun
(height, width, channels, batch_size)?
velvet thorn
you want to go (image_count, height, width) -> (image_count, height, width, channels)
like
cedar sun
well now i am lost
velvet thorn
your training data has shape (8656, 64, 64)
you want to turn it into (8656, 64, 64, 1)
velvet thorn
validation data too
midnight trench
cedar sun
why the [..., np.newaxis] didnt work?
midnight trench
i think it explains it .-.
velvet thorn
midnight trench
i think it explains it .-.
what?
velvet thorn
cedar sun
why the ``[..., np.newaxis]`` didnt work?
what do you mean didn't work
cedar sun
now dense is wrong owo
ValueError: Error when checking target: expected dense_2 to have shape (8656,) but got array with shape (1,)
i guess dense_2 is the last layer
midnight trench
velvet thorn
what?
as u can see in that idk why but it prints what is in list too .-.
cedar sun
model = Sequential()
model.add(Conv2D(32, kernel_size=(3, 3),
                 activation='relu',
                 input_shape=(*dimension, 1)))
model.add(Conv2D(64, (3, 3), activation='relu'))
model.add(MaxPooling2D(pool_size=(2, 2)))
model.add(Dropout(0.25))
model.add(Flatten())
model.add(Dense(128, activation='relu'))
model.add(Dropout(0.5))
model.add(Dense(len(train_label), activation='softmax'))```your dense layer is wrong too
think about this:
this is a classification problem, right?
cedar sun
yes
velvet thorn
so how many neurons should your last layer have?
cedar sun
the same amount as labels i have
velvet thorn
midnight trench
as u can see in that idk why but it prints what is in list too .-.
what?
I do not understand
velvet thorn
cedar sun
the same amount as labels i have
are you sure?
midnight trench
so
cedar sun
well, if i wanna classify car, truck, cycle, cat, and dogs
velvet thorn
how many neurons?
cedar sun
i need 1 neuron for each one
velvet thorn
cedar sun
i need 1 neuron for each one
yes
but this is not the same as what you said earlier
or your code
what is len(train_labels)? @cedar sun
velvet thorn
cedar sun
how can i get the number of labels?
🙂
velvet thorn
cedar sun
but from where can i take it?
try to figure it out yourself
if you can't get it in like half an hour then ask me again
I'll give you a hint
velvet thorn
['dog', 'cat', 'cat', 'dog', 'dog', 'whale', 'cat'] <- how many neurons?
and how did you get that number?
cedar sun
yes but
midnight trench
list = [['Aashika\n', 'Anjila\n', 'Anushka\n', 'Arahat\n', 'Bian\n', 'Bijay\n', 'Crisma\n', 'Deepika\n', 'Dinesh \n', 'Diya\n', 'Habib\n', 'Hanery\n', 'Hishi\n', 'Kusum\n', 'Milan\n', 'Phurba\n', 'Pramik\n', 'Rijan\n', 'Rikesh\n', 'Riya\n', 'Rohit\n', 'Sangeet\n', 'Sanjita\n', 'Sushant\n', 'Swornim']]

list1 = [['Sushant\n', 'Aashika\n', 'Anushka\n', 'Anjila\n', 'Arahat\n', 'Bian\n', 'Bijay\n', 'Dinesh\n', 'Diya\n', 'Habib\n', 'Hanery\n', 'Milan\n', 'Hishi\n', 'Rikesh\n', 'Kusum\n', 'Phurba\n', 'Pramik\n', 'Rijan\n', 'Riya\n', 'Rohit\n', 'Sangeet\n', 'Sanjita\n', 'Swornim']]

for i in list1:
    print([x for x in i if i not in list])
output - ['Sushant\n', 'Aashika\n', 'Anushka\n', 'Anjila\n', 'Arahat\n', 'Bian\n', 'Bijay\n', 'Dinesh\n', 'Diya\n', 'Habib\n', 'Hanery\n', 'Milan\n', 'Hishi\n', 'Rikesh\n', 'Kusum\n', 'Phurba\n', 'Pramik\n', 'Rijan\n', 'Riya\n', 'Rohit\n', 'Sangeet\n', 'Sanjita\n', 'Swornim']
aspected - Students not present today while comparing to total students
cedar sun
okey i guess i need to show u how do i create my data
velvet thorn
cedar sun
okey i guess i need to show u how do i create my data
it doesn't matter
velvet thorn
midnight trench
```py
list = [['Aashika\n', 'Anjila\n', 'Anushka\n', 'Arahat\n', 'Bian\n', 'Bija...
your lists are nested.
cedar sun
first, tell me if this is correct
midnight trench
how do i fix it tho
velvet thorn
midnight trench
how do i fix it tho
do you understand what I'm saying?
cedar sun
train_data and train_label must have the same size?
velvet thorn
cedar sun
``train_data`` and ``train_label`` must have the same size?
yes
midnight trench
velvet thorn
do you understand what I'm saying?
yea
velvet thorn
midnight trench
yea
then the answer should be clear
cedar sun
and the label i must be the label associated with image i?
midnight trench
so im reading from a file by [open("file", 'r').readlines()] will removing that [] will fix and readlines will be converted into normal list?
velvet thorn
midnight trench
so im reading from a file by [open("file", 'r').readlines()] will removing that ...
try it.
midnight trench
velvet thorn
try it.
idk gm im now getting some random shit
cedar sun
okey so i tell u what i have without showing code. I downloaded a set of images. Each image is on a folder with the name of the label that image belongs. I loop through all the folders and append the image to train data and the name of the folder to train label. So i dont have the number of classes directly. I should do something like len(os.listdir(path))?
velvet thorn
cedar sun
okey so i tell u what i have without showing code. I downloaded a set of images....
you do because you have the array train_label.
cedar sun
but the train label has duplicates
cedar sun
so the other way is making a set
velvet thorn
deal with them.
cedar sun
but is it the way to go?
velvet thorn
midnight trench
idk gm im now getting some random shit
why are you mixing for loops and list comprehensions?
I think you might want to start with something a bit simpler
probably
velvet thorn
cedar sun
but is it the way to go?
you can use a set, but there is a numpy-only way
velvet thorn
midnight trench
BCZ u are the one who suggested me this method first
I'm p sure I didn't say "mix loops and comprehensions"
velvet thorn
midnight trench
like can u give some example of a bit simplter?
start with this:
for name in names:
    print(name)
don't call your list list
bad practice
cedar sun
could u show me the numpy way? XD
velvet thorn
cedar sun
could u show me the numpy way? XD
Google it
midnight trench
velvet thorn
then understand what is happening
it's looping and printing the names
cedar sun
unique?
midnight trench
all names inside the list
velvet thorn
midnight trench
it's looping and printing the names
so how would you check if each value is in a different list?
yeah your residuals are weird
show the histogram
cedar sun
omg
ValueError: Error when checking target: expected dense_2 to have shape (151,) but got array with shape (1,)
velvet thorn
honestly I would suspect your plotting code first
velvet thorn
cedar sun
omg
do you know the difference
cedar sun
yes i do XD
cedar sun
ah
velvet thorn
go read up on that
cedar sun
not rlly
midnight trench
if i is not in anotherlist:
print(i)
velvet thorn
and you will understand more
cedar sun
but sparse seems like an average
velvet thorn
midnight trench
if i is not in anotherlist:
print(i)
that's not even valid Python
cedar sun
like sparse / spread
midnight trench
i mean if i not in anotherlist:
cedar sun
i will, let me fix this
@velvet thorn could u help me with the last thing please? and i wont bother u again hopefully
midnight trench
hmm lookes like im just dumb doing it more complex way without knowing what's happening thx gm u gave me a good knowledge
 torpid cave
Residuals might indicate values in your data and how they are limited
Which sort of make sense as you are using daily increments.... which are bounded
But you are threating ts data as if it was cross-sectional
Which will create auto-correlation between your residuals
Which will invalidate your model
Yes but panel with observations in multiple times
You can't assume gains from tomorrow are not dependent on today's gains
You should introduce the time-series approach to your analysis
Then you would use the Haussman-Wu approach
I would suggest using other type of regression though
Panel is not ideal for this... try using SVAR/VAR
cedar sun
velvet thorn
and you will understand more
xdxdxd
torpid cave
Well I am an econometrician, I would tell you that if you want to do dynamic panels you should consider timeseries
cedar sun
Alternatively, you can use the loss function `sparse_categorical_crossentropy` instead, which does expect integer targets.
torpid cave
And then approach Haussan Wu methodologies
Which get complicated quite fast
Regression can't have random gaps so don't worry... you usually look at residuals to test for correlation but as your data is bounded, I would try to focus on the distribution of the residuals rather than theirp lot
It should be normal
Yes
As you are not considering the time-series factor, then having gaps in your data (in terms of time-periods) should not be an issue from a theoretical way
Ah nww
Even in post-grad
teachers don't understand Haussman Wu
Haha nww, just keep in mind that for this data you should not be using panel
Not ideally
There are time-series models designed for this
Looks great
Panel OLS relies on OLS assumptions
Maybe do tests for autocorrelation/homoskedasticity
Residuals on vertical, independent on horizontal
Bounds are related to how your data is structured (bounds)
I understand the lower bound, as you can't have negative returns
The top bound is quite weird though, can't think why it is there
well, if you stock has a price of 100, the worst that can happen is that it goes to 0
And that is a return of 0
even 1 you get a return of 0.01
yep
- 1/100
yep
Oh ok
There you go
Mmmm... not much in Python
cedar sun
@velvet thorn if u are still here, could u tell me what is this? TypeError: Cannot cast scalar from dtype('<U14') to dtype('<f4') according to the rule 'same_kind'
torpid cave
Interact 2 variables?
Do it when you pass the fitted eq?
Just reviewed you formula...
Maybe pass it within the Exog-Variables
And see if the interactions are significant
[var1, var2, var1 * var2]
Should haha
Oh you are doing it with your categorical variables
Actually
nvm
Maybe do it in the back-end (create another column) and pass it as a parameter...
Yeah maybe create new categories and do the interaction
If it is between dummies
I can't remember doing interactions ever tbh
interactions between dummies
I do econometrics
In business environments
Haha
But models are simpler than this... or they use some sort of ML
velvet thorn
cedar sun
<@!171929073063297024> if u are still here, could u tell me what is this? ``Type...
stop pinging me please
I'm busy
cedar sun
i only pinged u once :(
 merry wadi
Are there any good resources to learn some more advanced features of pandas?
 paper stone
hist(turnover_updated$age, labels=TRUE, xlab=“Age”, main=“Random Title”,col=c(2,3,4,5,6,7))
I have a histogram where the number on top of the tallest histogram is cut off. It is for R Studio.
paper stone
Figured it out. Needed to use ylim
merry wadi
In pandas is it possible to remove x number of rows based on if it matches a condition?
Lets say I had a store dataframe with a column called "stores" that had 20 different store numbers. Each store has anywhere from 15-200 rows. If i wanted to standardize it and only keep 20 rows for all stores. Does anyone know how to do that?
torpid cave
@merry wadi define your business rules and use indexes
df = df[df['value'] == 'my_condition']
smthing among those lines
merry wadi
Could i keep a specific amount for all stores? @torpid cave
if df['store'].count > 20 then Delete extra rows
merry wadi
I mean 20 row values for each store
merry wadi
Lets say top 20. So instead of each store having a different amount, they would all have 20 rows
torpid cave
I remember this because that was the first thing I did with Python
df.groupby('Store').head(20)
Try something among those lines
merry wadi
Damn that worked @torpid cave cant believe it was that simple. I've been at this for awhile
 autumn veldt
Ask: im still beginner for data science, here I'm trying to make a classification program, using dataset that only show yes(true) or no(false) in every feature column. So i wonder, what methods that fit(best) for classification using datasets that only have index yes(1) or no(0) only?
torpid cave
@merry wadi haha nww, took me a while to do as well just bc of the syntax
merry wadi
Would it be possible to add another column as well? @torpid cave
trim oar
Has anyone worked with deeplearningj4 before? How is it?
 lapis sequoia
so tf.data.Dataset internally one-hot encodes labels and predicts that, how could i convert the predicted vector into a label?
is there a way to obtain the internal encoding?
lapis sequoia
anyone?
torpid cave
sorry never used that package
lapis sequoia
nvm, its probably gonna be the same one-hot encoding as any other encoder from keras, sklearn, etc, assuming the labels are in the same order right
torpid cave
Is there something like factors in python?
lapis sequoia
wdym
 earnest forge
I have a question related to ML: First we train our model on train_set and then test it on test_set. After we fine-tuned it - what's next? Utilize the model on new data or what?
torpid cave
Deployment
lapis sequoia
hello
when i use pandas.read_json() the index is weird
i have ~150 rows but index goes from 0 to 11
 austere swift
!d pandas.DataFrame.reset_index
lapis sequoia
alright, but what causes that?
 arctic wedgeBOT
DataFrame.reset_index(level=None, drop=False, inplace=False, col_level=0, col_fill='')```
Reset the index, or a level of it.

Reset the index of the DataFrame, and use the default one instead. If the DataFrame has a MultiIndex, this method can remove one or more levels.

Parameters  **level**int, str, tuple, or list, default NoneOnly remove the given levels from the index. Removes all levels by default.

**drop**bool, default FalseDo not try to insert index into dataframe columns. This resets the index to the default integer index.

**inplace**bool, default FalseModify the DataFrame in place (do not create a new object).

**col\_level**int or str, default 0If the columns have multiple levels, determines which level the labels are inserted into. By default it is inserted into the first level.

**col\_fill**object, default ‘’If the columns have multiple levels, determines how the other levels are named. If None then the index name is repeated.

Returns  DataFrame or NoneDataFrame with the new index or None if `inplace=True`.

See also... [read more](https://pandas.pydata.org/pandas-docs/stable/reference/api/pandas.DataFrame.reset_index.html#pandas.DataFrame.reset_index)there seems to be no pattern
trim oar
Don't think I've ever seen it
 livid quartz
Anyone know why the unnamed column is appearing when I read my csv file with pandas?
trim oar
It's usually the index
But I don't know why it's at the end
It could be an csv exported from a specific program
Just read_csv(index = False) should remove it?
Maybe the program was exporting index at the last column instead
livid quartz
It was originally an ARFF file so that could probably be why
 rustic dew
I think there is just comma at the end of each line which pandas reads as empty column, I've seen this on csv export from various programs - they would put comma at the end of a line, not sure why
 west lava
Hi - have a quick Pandas question.
What is the difference between these two lines at the bottom? They both work, but I am not sure if one is needed.
df = pd.json_normalize(urls)
df_recon = pd.DataFrame(columns=["server", "port", "full_url"])
df_recon.server = df.rdb_url
df_recon.server = df.rdb_url.to_numpy()
 serene scaffold
def plot(points: list[tuple[int, int, int]]):
    from mpl_toolkits.mplot3d import Axes3D
    fig = plt.figure()
    ax = fig.add_subplot(111, projection='3d')
    xs = np.array([p[0] for p in points])
    ys = np.array([p[1] for p in points])
    zs = np.array([p[2] for p in points])
    ax.contour3D(xs, ys, zs)
    plt.show()

# error
>>> ax.contour3D(xs, ys, zs)
TypeError: Input z must be at least a (2, 2) shaped array, but has shape (1, 1000)
why would Z need to be a different shape?
rustic dew
serene scaffold
```py
def plot(points: list[tuple[int, int, int]]):
from mpl_toolkits.mplot3...
because Z represents values on Z axis for different Xs and Ys, so 2D array
serene scaffold
But there's only one value for z for any x, y
rustic dew
ah so.. is it on a regular grid tho? or irregular?
 wild pine
hey guys, I'm trying to wrap my head around deep Q networks.
when using visual observations (pixel data), the examples i've seen defines the state/observation for each timestep as current_screen - previous_screen
i get that you can't figure out direction or velocity from a single still image, but doesn't the agent lose all information about static elements this way?
let's say i have an environment that is initialized with a random map or configuration.
how would the agent learn to generalize if it is only ever provided with data from moving elements?
rustic dew
serene scaffold
But there's only one value for z for any x, y
if it's regular, you would need to create 2D Z array yourself
rustic dew
serene scaffold
But there's only one value for z for any x, y
if it's irregular, I am nor sure mpl 3D can handle those, you'd need to interpolate
serene scaffold
so if the array is currently [1, 2, 3, 4, 5], do I need [[1, 2, 3, 4, 5], [0, 0, 0, 0 ,0]]?
something like that?
rustic dew
serene scaffold
so if the array is currently `[1, 2, 3, 4, 5]`, do I need `[[1, 2, 3, 4, 5], [0,...
mmm I dont think so.. more like imagine you have 4 points: [0, 0, 4], [0, 1, 12], [1, 0, 1.4], [1, 1, 2.85]
each is written as x, y, z
you'd need to create Z as Z = np.array([[4, 12], [1.4, 2.85]])
and x, y = np.meshgrid([0, 1], [0, 1])
that should work
but as I was saying, only if x and y makes a regular grid
serene scaffold
I don't understand how that works. What do 4 and 12 have to do with each other?
rustic dew
those were just example of 4 points, where each point is written as its x, y, and z - coordinates
so first point is [0, 0, 4] meaning its x-coordinate is 0, y-coordinate is 0 and y-value is 4
from your copy-pasted code I got the idea that the points you are trying to plot are a list of tuples like this
serene scaffold
yes
rustic dew
so, the contour3D only work with regularly sampled points on a grid, meaning you need to have values for all combinations of (x, y) points
so e.g. it will work if you have 4 points with x being 0 and 1 and y being 0 and 1
but it won't work if you have e.g. 8 random points with arbitrary x, y, z coordinates
you can use scatter3d for those
serene scaffold
Alright, Thanks @rustic dew!
rustic dew
serene scaffold
Alright, Thanks <@!783727604208369754>!
np:), sorry if I was too cryptic
lapis sequoia
hello
 leaden girder
Who knows and can give me advice with linear programming ?
 fallow prism
livid quartz
It was originally an ARFF file so that could probably be why
fallow prism
livid quartz
It was originally an ARFF file so that could probably be why
when you are saving put pd.to_csv(index=False)
 hasty orchid
Is there a way to add interactive gui filters to a jupyter notebook? Can these be easily exported to html? For notebook sharing? Trying to replicate tablaeu basically
 woven tundra
hasty orchid
Is there a way to add interactive gui filters to a jupyter notebook? Can these b...
woven tundra
hasty orchid
Is there a way to add interactive gui filters to a jupyter notebook? Can these b...
Check out plotly, it renders on a notebook
Not sure if it can be exported to html
hasty orchid
Yeah, definitely looking for something that works with the export html function of jupyter notebooks, I don't know how I can share these with end users realistically otherwise
Otherwise I might have to end up putting reports in excel which is a snore lol
fallow prism
can someone tell me their opinion about vim with python (and data science of course)?
rustic dew
hasty orchid
Is there a way to add interactive gui filters to a jupyter notebook? Can these b...
also bokeh seems to be an option: https://docs.bokeh.org/en/latest/docs/user_guide/jupyter.html
Bokeh visualization library, documentation site.
hasty orchid
@rustic dew do you know if poorly can do the same thing? Is bokeh popular? Never heard of it looks sick
rustic dew
hasty orchid
<@783727604208369754> do you know if poorly can do the same thing? Is bokeh popu...
so they both can do similar things, I was using both of them but that is some time ago and since then both of them grew... from what I remember bokeh was easier to use, but plotly is (or was...) more feature-rich, here I found some nice recent (2020) comparison: https://pauliacomi.com/2020/06/07/plotly-v-bokeh.html I think it boils down with which you'd be more comfortable
Paul Iacomi
Over the last year, I’ve worked extensively with large datasets in Python, which meant that I needed a more powerful data visualisation than trusty old Matplotlib. There are essentially only two libraries which provide the high level of interactivity I was looking for, while being mature enough: Plotly (+Dash) and Bokeh. Each has their own stren...
also, if you need export to html just because of sharing your notebook, also consider https://nbviewer.jupyter.org/ - you just host your ipynb anywhere (dropbox, drive, your webpage, keybase, anything), render it with nbviewer, and share the nbviewer link - I find it much easier than exporting
hasty orchid
Haha thanks I appreciate it- oh wow, your explanation of nb viewer makes me much more interested than what I was reading
On overflow
rustic dew
not sure what you've read, but I love it! my typical workflow is to work in jupyterlab, put the ipynb into my public keybase folder and render it with nbviewer. done in 30seconds
 waxen birch
Do you guys know any good tutorial for numpy matrix?
lapis sequoia
if the train out put is saying acc = 0.008 it sucks right? XD
 heady hatch
Hey guys couple questions about data splits.
So the ML problem is predicting political affiliation based on the metaphors authors used.
one split is
While the other one is
I'm trying to understand why the first one is bad and why we should go with the second one.
From my understanding what's happening with the first split is data from test set is being leaked into the training and validation. Which makes sense.
I think I'm stuck on the idea that how do we learn to predict the test set if the data wasn't seen. Because we're assuming that the test set is going to hold the same distribution as the training and validation, even if the authors are different.
velvet thorn
I'm trying to understand why the first one is bad and why we should go with the second one.
@heady hatch who says the first one is bad
 gray wigeon
velvet thorn
> I'm trying to understand why the first one is bad and why we should go with th...
gray wigeon
velvet thorn
> I'm trying to understand why the first one is bad and why we should go with th...
I wanna know too. Wouldn't the second one result to underfitting
heady hatch
@velvet thorn Google.
Their reasoning on why the second split is more appropriate is because the data was clustered properly while sampling.
Because in the first split, it would be hard to debug when it does badly in production, while you can find that out in the second split.
But caveat, just because it's Google doesn't necessarily mean they're correct, but I definitely see splitting being context appropriate.
gray wigeon
Oh, so you're making a clustering model?
heady hatch
Oh no this is a classification problem.
I think I unintentionally primed us too.
I might have framed the problem as the first one being objectively bad while the second one is better and etc.
I apologize. I think the problem was both are bad in production but the first split is good during experimentation and showing higher scores than the second.
gray wigeon
I think for classification models, the first split is more desirable
heady hatch
I think it's context dependent, because of the reasons stated above.
Or I guess I want to know, why do you say so?
gray wigeon
I mean what are you trying to classify anyway?
lapis sequoia
once i have my model trained, how can i predict with it?
heady hatch
@lapis sequoia are you using a library or building it from scratch?
@gray wigeon it's a case study, but they were trying to classify author political leaning from their metaphor usage.
lapis sequoia
keras
gray wigeon
heady hatch
<@!476573611768021015> it's a case study, but they were trying to classify autho...
NLP? Then the first split is still better.
How are you doing it? Do you have a set where you have identified metaphors with corresponding authors?
heady hatch
lapis sequoia
keras
You can do something like model.predict unless you're trying to evaluate it and such.
lapis sequoia
and what to give it?
heady hatch
Whatever you gave it while training.
lapis sequoia
so if it trained with black-white
i cant give a color img?
and dimensions must be the same?
heady hatch
gray wigeon
How are you doing it? Do you have a set where you have identified metaphors with...
Why do you say the first split is still better?
Sorry to clarify, I'm not experimenting or writing the code. It's a case study from Google where they were trying to debug why the model did well in experimentation but not in production.
Like in experimentation, the model did 99% or something with the first split
but in production, the model did 50%.
I'm just making up the numbers, but they saw that there was a problem where in experiment, it didn't match up with production.
gray wigeon
heady hatch
Why do you say the first split is still better?
Sorry to clarify, I'm not exper...
Ooh okay. Then there could be a lot of answers to that.
heady hatch
They did solve it. They found out the first split was not representative.
Because the data was leaking across training, validation, and test set.
gray wigeon
Still so weird to see the second set
heady hatch
Right?
I completely feel you on that, which was why I wanted to ask about it.
I was thinking that it would under fit as well.
gray wigeon
Can I see the link to the study? This is going to keep me up all day now lmao
lapis sequoia
lapis sequoia
and dimensions must be the same?
.
heady hatch
gray wigeon
Can I see the link to the study? This is going to keep me up all day now lmao
gray wigeon
Thanks
heady hatch
Let me know if I've interpreted it wrong or something.
heady hatch
lapis sequoia
.
Yes, training and inference features need to be the same.
If you want to predict it on colored images while you've trained it on black and white, you can transform the colored images to black and white and then predict.
gray wigeon
My initial guess before I read is that to account for the leakage, the suggestion might have been to implement a clustering preprocessing to define the set more properly but this is just a guess
lapis sequoia
if i load an image as np.array(img), can i do something with numpy to convert them to black white?
i do it with opencv
i would need to to the average per pixel, rigth?
image[i][j] = sum etc
?
heady hatch
I would love to give you tips and advice but you might have an easier time googling "transform colored images to black and white opencv" or something.
I mainly work in NLP so I can't say much.
lapis sequoia
lapis sequoia
image[i][j] = sum etc
this is the way
lapis sequoia
lapis sequoia
i do it with opencv
xd
torpid cave
@heady hatch is there a library I should be aware to implement NLP?
I have a project aligned for next year
And should start doing the DD in the next weeks
If you want to know more about the project, I built scrapers to get product-reviews, now I have to classify these reviews
So far I know it will be unsupervised learning
But I need to add more metrics like... sentiment on the review
if it is critical
heady hatch
torpid cave
<@!542872811245666305> is there a library I should be aware to implement NLP?
Hmm kinda lots of factors to consider to be honest.
I'm assuming you're not talking about implementing algorithms from scratch.
What size do you think your data is going to be?
heady hatch
I think I would get familiar with Spark NLP.
or the Spark family in general to work with big data.
How familiar are you with NLP?
torpid cave
Tbh I just did data manipulation
with strings
The project will take around 6 months and I will be working with another guy as well who has created NLP libraries though
But I need to catch-up with him as fast as I can before starting
heady hatch
I'd say get used to working with classical methods first, so maybe start with sklearn and whatnot.
So you understand what kind of features you'll be creating for modeling.
Don't touch NN for now.
torpid cave
I don't think we have used NN for any project in my place tbh
heady hatch
Like learn the different things about NLP such as ngrams, bow, tfidf, cleaning, tokenization, parsing, lemmatizing.
I think SpacCy and NLTK and whatever library out there will give you functions to help you learn it.
The library isn't really that important, IMO. It's more about understanding text and what happens when you transform them.
heady hatch
Yes! so bow and tfidf are two ways of transforming them. Then you'll come to learn about embeddings to deal with sparse representations.
gray wigeon
@heady hatch okay i think i got the geist of it now.
heady hatch
Embeddings are more of what today's industry use because sparse representations isn't efficient at all, space nor compute wise.
gray wigeon
@heady hatch the miscalculation was that they split the texts by sentences to determine the political affiliation. and the writers wrote in a very particular fashion that in a sentence level split, it's difficult to point out who says who. basically, the second split isn't "better" per se, it's just an alternative approach the study tried.
torpid cave
Thank you very much @heady hatch
I will update on how the project goes
I got a better idea now, I imagine I will be cleaning the dataset for about 1~2 months though and working on the data side before moving onto applying anything
heady hatch
@torpid cave oh learn to use regex to clean too and learn when not to use regex.
torpid cave
Well I hate regex just like any other normal person
gray wigeon
torpid cave
Well I hate regex just like any other normal person
i'm yet to meet a person who honest to god loves regex
heady hatch
I'm totally imagining a person in some dark hole just churning out complex regex patterns that captures essence of human language.
torpid cave
hahahaha
 marsh lantern
Have you tried using one $$ before and after your equations? I don't think I would use all of those $$ to delimit every line
lapis sequoia
Here is a mini project I worked on today to learn data mining. Feel free to add/change something. https://github.com/murathany7/scraper

GitHub
This script mines data from the biggest forum in Turkey. It gets around 150,000 questions and answers in Turkish. - murathany7/scraper
 sick skiff
hey im new to tensorflow, i made one of those ais that predict mnist numbers, thing is whenever i draw my own number it gets it completely wrong, like nowhere close, a 3 is a 5, a 3 but one pixel to the left is 0
anyone got ideas?
do i need a larger sample? maybe more epoches? or is it that its just memorising those images and not predicting anything, and when its met with something new it just throws random guesses
 halcyon vale

GitHub
I am sharing my Journey of 66DaysofData in Natural Language Processing. - ThinamXx/66Days__NaturalLanguageProcessing
sick skiff
?
lapis sequoia
When working with Keras, should I save the whole model or just the weights if I want to train new data continuously?
fallow prism
torpid cave
Quick question.... do text gets converted to a number at any point in time?

Lecture 2 continues the discussion on the concept of representing words as numeric vectors and popular approaches to designing word vectors.
Key phrases: Natural Language Processing. Word Vectors. Singular Value Decomposition. Skip-gram. Continuous Bag of Words (CBOW). Negative Sampling. Hierarchical Softmax. Word2Vec.
-----------------------...
 prime slate
What float('inf') equal to in python? is there a limit for it, since the data type float can hold 64-bit?
rustic dew
prime slate
What float('inf') equal to in python? is there a limit for it, since the data ty...
how do you mean limit for it? you can check upper limit of float64 with np.finfo("d").max and it equals to 1.7976931348623157e+308 so np.inf is a bit larger:)
funny enough, you can do np.finfo("d").max + 1 but e.g. np.finfo("d").max * 1.1 throws overflow:)
lapis sequoia
when we're getting the loss of a graph
why do we square the distance from y to the slope line/ y = mx + b version of y
why do we square that distance and sum them?
rustic dew
it's just one of the options on how to define "loss function". when you are trying to optimise something (like fit a linear regression = optimising parameters m and b of the model) you need to define some loss / fitness / objective function (it goes by many names). sum of squared distances (mean squared error, usually abbreviated as MSE) is one of the options and it is pretty popular.. you can do absolute error, or root mean square error etc. each of the fitness function has its pros and cons.. so when you're fitting a linear regression, you are trying to minimise the MSE, so that the error between your data and your linear model is minimal
lapis sequoia
Do you think it will be better if I just learn Linear Algebra
rustic dew
well, it most certainly will help;)
 indigo bronze
lapis sequoia
why do we square that distance and sum them?
indigo bronze
lapis sequoia
why do we square that distance and sum them?
We use the mean of the squared errors because it is mathematically simple to optimize, iirc
rustic dew
some slightly-related piece to error functions: https://towardsdatascience.com/https-medium-com-chayankathuria-regression-why-mean-square-error-a8cad2a1c96f

Medium
Choosing the best Loss Function for regression algorithms
 vale vector
can anyone explain how the structure naming a class with a dot? Like in the datetime module they have a "class datetime.date"
if i try and make a class with a dot, i get an error
rustic dew
not sure this is a question for data-science channel.. however all properties and attributes of a class are accessible through dot, eg.
class foo:
    def __init__(self, a=5, b=12.4):
        self.a = a
        self.b = b
    @property
    def ab_sum(self):
        return self.a + self.b
then
baz = foo(a=3)
baz.a # prints 3
baz.ab_sum # prints 15.4
the example you refer to with datetime.date is different, since AFAIK datetime is a module, there is a difference between modules and classes, but both can enjoy dot notation
prime slate
rustic dew
how do you mean limit for it? you can check upper limit of float64 with `np.finf...
I mean by limit, is for the data type itself not the inf in real life, we all know that inf is unlimited, and it's one of the attributes for the inf number, but what I meant is for the computer, by your answer I understood that if we reach to a number after that it will give an error, so the limit for the inf number in the computer is the float data type limit.
or at least for python, cuz I know that R use long double to represent the inf number
serene scaffold
Not urgent, but is there a "numpy" way to do this:
matrix = np.zeros((21, 21))
for x, y in product(range(21), range(21)):
    matrix[x, y] = func(x, y)
if your func is properly vectorized this one should do the trick
x, y = np.meshgrid(range(21), range(21))
matrix = func(x, y)
or one liner
matrix = func(*np.meshgrid(range(21), range(21)))
if you like that kind of things
serene scaffold
rustic dew
if your `func` is properly vectorized this one should do the trick
```py
x, y = ...
I like easy-to-read one-liners. like list comps. I'm not sure which I'd prefer in this case 
sick skiff
i can make it run tests, save and load a model, but no matter what i do, i just cant test it on a new set of images, it either crashes, or gives me a completely wrong answer, and ive tested it with keras and tenseofrlow, i must be loading the ima4ges wrongly or smth
earnest forge
how to keep only first character in each value of PClass so I'd further be able to convert it to numeric type of data
rustic dew
df.PClass = df.PClass.apply(lambda x: int(x[0]))
or float instead of int if you need floats...
lapis sequoia
Is it a good start to try learning data science with Python by trying to analyze random samples by googling almost every single code
earnest forge
you are late 😄
earnest forge
rustic dew
`df.PClass = df.PClass.apply(lambda x: int(x[0]))`
i've already figured it out
earnest forge
lapis sequoia
Is it a good start to try learning data science with Python by trying to analyze...
I suggest you to read 'Python Data Science Handbook' at first place. It covers essentials and a bit more. Some kind of a fast start
lapis sequoia
I’m studying with Python for Data Science, but somehow it takes too much time for me, so I was thinking maybe I might wanna skip some part and try real world project by googling stuff?
earnest forge
do you learn DS on your own?
earnest forge
how I do: after finishing chapter, go practicing what you've learned
lapis sequoia
Is “Python Data Science Handbook” some kind of short version of “Python for Data Science”?
Yea thats what I do but with this book it takes forever
Too many stuff to do
earnest forge
lapis sequoia
Is “Python Data Science Handbook” some kind of short version of “Python for Data...
It comprises of 500 pages (I'd say 300, cuz last 200s are ML and it's better to take more deep course in ML since it's essential for ds)
I have finished everything (except ML part, I didn't read it) in ~2 months
 fallen prism
hello buds, i just learned python basics , can you suggest me any books , videos to start learning DS by my own and start doing ML
earnest forge
btw, one more effective way: whenever you stumble in something unfamiliar go searching how it works and when to use
lapis sequoia
Hmm okay I gotta try that book with youtube videos then
earnest forge
sad thing, DS handbook doesn't deal a lot with numpy package, so that googling method helped me a lot
lapis sequoia
Do real data scientists in the field google a lot too? xD
fallen prism
@earnest forge @lapis sequoia
earnest forge
fallen prism
hello buds, i just learned python basics , can you suggest me any books , videos...
from my perspective, it's better to spend more time on python too. Cuz when you reach ML you'll have to deal with memory consumption and implemention your own classes
fallen prism
earnest forge
from my perspective, it's better to spend more time on python too. Cuz when you ...
i do some projects but how can i learn data structures
lapis sequoia
@fallen prism
I started learning Python and DS with the book named “Python for Data Analysis”, but seems like it consumes a lot of time so I’m thinking about switching to “Python Data Science Handbook” @earnest forge recommended
fallen prism
lapis sequoia
<@552147336592359446>
I started learning Python and DS with the book named “Pyt...
Thanks is it available everywhere?
earnest forge
Handbook covers only basics and delves a bit into complicated task. Anyway, it really goes well for the fresh start
fallen prism
earnest forge
from my perspective, it's better to spend more time on python too. Cuz when you ...
thank you <3
earnest forge
fallen prism
i do some projects but how can i learn data structures
google 'python data structures' and also find tasks related to data structures
lapis sequoia
There are free pdfs that might be piracy though
earnest forge
tbh, the most frequent for using is list, but real project demand your deep understanding of DataFrames
lapis sequoia
I know basics like pd.DataFrame, concat, whatsoever but the problem is I barely know other sub functions like inplace=True and stuff like that
so I google it all the time xD
earnest forge
handbook covers it all
lapis sequoia
Wow really
Thats good to know
so its all about memorizing xD
cant wait to start again
 azure cedar
hey y'all
I have a question about the pd.merge() function and its behavior
and I opened a help channel at the same time as someone else and they kinda took over
do you mind if I left this question here?
 tribal wind
anyone here good with NLTK? (:
 wintry olive
We show data augmentation is equivalent to an averaging operation over the orbits of a certain group that keeps the data distribution approximately invariant.
the above statement was taken from a computer vision related study attempting to establish a practical mathematical framework for understanding the effects augmenting or curating data into a datasets prior to building and tuning models with the data. I get the effect of augmentation causinginvariance but not the process which generates it. The word orbits jumped out at me.
I learned about orbits of 0 under an iteration from studying the mathematics of the Mandelbrot set
that's on the complex plane though. Intuition leads me to think that was a property of the imaginary numbers doing special things. do orbits work similarly in statistics except with both axis containing streams of real numbers? what do those orbits look like?
there was an app someone was using to show animations of orbits from hoovering mouse over the complex plane. I'll just look for that..
velvet thorn
do you mind if I left this question here?
@azure cedar just do it
azure cedar
So i have two dataframes
Three identical columns
I'm trying to make sure that the ones that match are verified that match for each row across all of the columns per row
as well as collect the ones that don't match and send that to a function
right now I'm merging on a single column and it seems to yield a "match_list" and then doing df[df[~does not contain the matchlist]]
my question is: when I do the merge, am I getting the result I have just assumed?
also is this the best way to do this?
 drifting hemlock
I'm seriously banging my head around this problem which I'm pretty sure has a simple answer, I'm using the Online Retail dataset, you can load it:
customers = pd.read_excel('https://archive.ics.uci.edu/ml/machine-learning-databases/00352/Online%20Retail.xlsx')
I have a multi-index by doing:
customers.set_index(['CustomerID', 'InvoiceNo'])
What I want to is to select the first invoice for every client. Meaning that for the client 13047 I would only see the invoice 536367 NOT the other invoices for that client.
 paper niche
@drifting hemlock You can 1. first sort customers by the "InvoiceDate" (so the earliest invoice by date would appear at the top), then 2. .groupby('CustomerID').head(1) which will select the first invoice per group.
azure cedar
any help here?
serene scaffold
nan makes me so mad.
azure cedar
I have and it seems okay and the behavior in the function seems to indicate it's able to pick up where it left off
is it okay to use merge as a "check for dataframe symmetry"?
not in terms of dimensions but in terms of row content as well
i don't want to be accidentally using it not knowing it has some under the hood function that might overwrite something I don't want it to overwrite
I'm comparing two tables in memory to make sure each Key entry has the proper metadata associated if not the list of Keys not found in both tables need to be sent to a function to remedy that difference
I had a version that merges on "Key", I'm wondering if it referenced the other columns as well when considering that intersection
and whether bad columns would have created a N/A or NAN field
lapis sequoia
anyone here have any experience with artificial neural networks and convolution neural networks in python?
azure cedar
i have experience in pandas but I didn't know how to verbalize my question enough to find a stackoverflow answer for this
so i guess to clarify: two lists, both lists have a Product Name (Key), Serial, and Quantity for example
DF 1 may have new entries but I'm checking that the serial and quantity align for existing listings in DF2
if they don't they need to be sent to a function to amend DF2 with the new entries
If merging on one key is destructive, do I merge on multiple keys?
So merging on one key will yield N/As if the other columns don't line up?
just trying to find a correct way to validate here
so if i take that a step further if I merge on more than column
it'll merge on the intersection of all 3 indicated columns?
yeah I'm also on the "i think" step so trying to confirm it somehow
okay will do
brb doing that
Sum is 0 for both merge on ['Key'] and ['Key', 'serial', 'quantity]
however the latter didn't reduce the final DF by much, infact it has the same count as the original D1 list
merging on ['Key'] alone yields a reduced "to send to function" list
which is what I'm after but back to square 1 wondering if I'm missing some knowledge about the under-the-hood function of merge
 somber bane
I have a question, why do we still need to divide by n(total number of data) even in stochastic gradient descent?
Isn't that we are iterating each individual data
azure cedar
@somber bane is this the answer you're looking for: https://stats.stackexchange.com/questions/251982/stochastic-gradient-descent-for-regularized-logistic-regression

Cross Validated
At 8:30 of this video Andrew Ng mentions that the cost function for stochastic gradient descent (for a single observation) for logistic regression is
$-y_i \log h_w(x_i) - (1 - y_i) \log h_w(1 - x...
somber bane
does anyone have any article or video that shows how to apply mini batch gradient descent on matrix factorization?
 rocky maple
Who has used pretrained Torch models for videos?
I want to use a Resnet3d torchvision.models.video.r3d_18(pretrained=True)
But the data needs to be preprocessed in a certain way
But I'm stapling my own video frames together, I'm not using a torch dataset.
trim oar
azure cedar
Sum is 0 for both merge on ['Key'] and ['Key', 'serial', 'quantity]
To do what you wanna do, I'd do the following:
- Make a copy of both DF to play around
- Merge on all the columns that exist on both DF, if all the columns are the same, simply on = df1.columns
- Drop "Quantity" on MergedDF so you only have ProductName and SerialNumber
- MergedDF.duplicated() would yield any duplicated Product/Serial number. Unless you have two products sharing the same serial number, or two serial numbers sharing the same product name, should help you find duplicated values
I didn't realy through everything cuz my head still hurts from the hackathon I just did. So if checking duplicated product is not the only task, please point me to it
trim oar
🙂
azure cedar
so would this work if I'm trying to find the inverse
Having exact pairs is a good sign
so saying for anything that has a pair, remove it from the new DF, if it doesn't send that list to my function
would I even have to use merge here then?
Couldn't I just concat the tables (identical columns) and find and delete anything that has a valid pair?
basically in my case: Pair of files with 3 matching columns = good = do nothing
if no pair, needs to be sent to function for rework
trim oar
Oh
azure cedar
i based my response off of your idea
trim oar
concat would be better then, and still duplicated would yield it
Because merge probably would have merged identical ones
but concat doesn't do that
azure cedar
yeah i want to 100% avoid any deletion of things which is why i caught myself when applying merge
no overwriting or deleting i'm looking for a hard match for pairs as validation
trim oar
so concat axis = 0
azure cedar
another way that can be done is concating all 3 columns into a string and hashing it
and then simply every time you have to analyze a list hash the row and check the other table for the hash
i just realized that
what does axis = 0 do
trim oar
concats vertically
azure cedar
okay so just glues it on the bottom
trim oar
yes instead of horizontally
That's probably by default I just tend to specify it
Glad you have a solution!
 shadow quiver
Hey guys. I just have encountered a ML problem. Say there are photos of leafs, and leafs contain disease on them. And there are masked photos for 4 types of disease, for each leaf. There are tabular data about picture height and weight and encoded mask
Basically it's a plant disease recognition. I should train a model and predict the 4 types of diseases for every leaf. Where can I start this? I'm completely new to this masking topic.
livid quartz
can someone help me interpret this t-sne plot? I don't know if its good... The dataset I used predicts mortality after thirty days from flu patients. Outcome is binary with 0 being no death and 1 being death
shadow quiver
How can I predict image from an image in Keras? Like, input shape is 512x512 and output is also a 512x512 array?
 sturdy dune
Hello everyone, I have written a blog on K-means clustering, the unsupervised machine learning algorithm. Give it a try,I hope it helps you. https://datamahadev.com/understanding-k-means-clustering/

This article will introduce you to Unsupervised Learning and will help you gain a proper conceptual understanding of K-Means Clustering.
lapis sequoia
so I just started learning data analysis with Python...
this is some part of my dirty ass scripts.
do you guys think I'm in the right path?
wintry olive
good morning ecneics-atad
e nics a tad
hypothetical question what if you were given the freedom to model a fictional character
 limber crow
can I use panda with django?
wintry olive
whoa django i haven't heard that in awhile
i completely forgot why we were using it probably for this: a lightweight and standalone web server for development and testing
lapis sequoia
: /
 spare lotus
I need to predict age, gender and race from a picture. I looked at many popular solutions, and they all use CNNs, which I'm not allowed to use. Any ideas on what else I can use for this task?
 azure stump
 trim oar
spare lotus
I need to predict age, gender and race from a picture. I looked at many popular ...
trim oar
spare lotus
I need to predict age, gender and race from a picture. I looked at many popular ...
RNN or its variations
Takes in 3D shape, learns from previous sequence, tho I have not done it on images
trim oar
lapis sequoia
so I just started learning data analysis with Python...
this is some part of my ...
I'm not sure what do you mean by the right path, especially when the same things can be done in many ways, and I think simply by taking actions to learn is admirable already, but:
df.groupby(df['Fly Date'])[['passengers','seats']].sum().reset_indexshould achieve your occupancy_rate already. Where pandas only seems to only take one argument, you can always put the list of columns inside a list to input as a single argument. Same thing with yourorg- calculation looks good, but it may be more sensible to separate month and year. This way you can do more manipulation later for ad hoc requests, such as calculation by month or by year. You can to_datetime first, and then create new columns with to_period. See here. https://pandas.pydata.org/pandas-docs/stable/reference/api/pandas.Series.dt.to_period.html
- 0.425 is not a strong correlation but still a moderate correlation. You can see the cut-off for correlations here. https://www.dummies.com/education/math/statistics/how-to-interpret-a-correlation-coefficient-r/
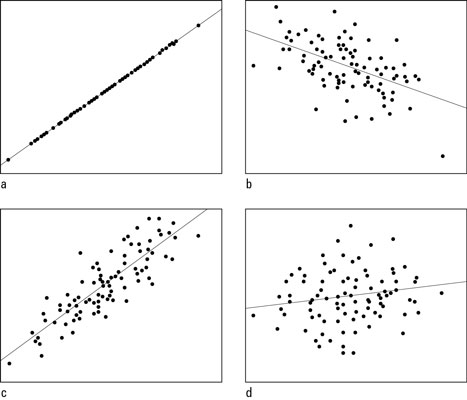
In statistics, the correlation coefficient r measures the strength and direction of a linear relationship between two variables on a scatterplot. The value of r is always between +1 and –1. To interpret its value, see which of the following values your correlation r is closest to: Exactly –1. A perfect downhill (negative) linear relationship […]
waxen birch
having matrix with columns x1,x2.....x15,y i have to perform linear regression, do you guys know how to do it using python?
15 x columns and one y column
(i can provide a sample of data if needed)
 worthy scarab
Any idea why it says sigma has incorrect shape?
trim oar
It's as simple as model.fit_transform(X_train, ytrain), model.score(X_test, y_test)
 bronze skiff
worthy scarab
Any idea why it says sigma has incorrect shape?
bronze skiff
worthy scarab
Any idea why it says sigma has incorrect shape?
print out the shapes of sigma (in this case, Error?)
also, welcome to python-- please learn to use camelcase
 heady tide
quick question, Spacy or Nltk for lemmatization?
trim oar
Personally nltk
lapis sequoia
@trim oar
I am so much grateful for your sincere advices! It’s been only a month to learn data analysis with python so I barely know few stuff. Thanks again and I’ll look into those links!!
heady tide
@trim oar I see, went with that since it offers more flexibility
Are there any more steps that I need to take before computing the tf-idf ?
should I remove all the stop words ? check ngrams ? Or will tf-idf do that for me ?
trim oar
heady tide
<@!680795279758327819> I see, went with that since it offers more flexibility
I have limited experience with NLP but here's my two cents. TF-IDF works like this: the more a word appears in a single corpus, the more the weight it'll have. At the same time, the more the same word occurs in different corpuses, the less the weight it'll have. That sort of balance it out.TF-IDF probably could balance out the stop words for you, but I'd personally just do the usual cleaning such as removing the stop words. ngrams is different iirc, about providing context (grouping of words). I haven't worked much on it yet, but I'd imagine you'd still need them.
I welcome correction
 quasi crypt
Hi! is there a more advance library for encrypt PDF's?
I've tried PyPDF2 but the options are limited (i can't set all these options to what i want).
heady tide
much appreciated @trim oar, I will remove stop words as you said and then lemmatize, then the data will be fed to the tf-idf
lapis sequoia
I got a question. How can i reload my neural network weights? i wanna recalculate them ONLY if there have been changes on number of epochs, batch_size or anything that if changed, will modify the weights
 ocean pumice
doesn't it depend on your implementation ?
 mellow kestrel
hello , am new to python ,question , is it easier to use Conda for installing tessract for an OCR project
bronze skiff
why not just use pip
lapis sequoia
idk, i can change my implementation for sure. I would like to refactor it, but idk how
bronze skiff
lapis sequoia
I got a question. How can i reload my neural network weights? i wanna recalculat...
don't you save your weights after training? just load them back in for inference and don't retrain it
mellow kestrel
bronze skiff
why not just use pip
yeah ill try it thanks 😄
lapis sequoia
yeah but 1 epoch more will make weights change
so if i changed epochs, i need to recalculate weights
1 epoch or 1 more image on trainin
or validation
or w/e
trim oar
I haven’t tried but
ModelCheckpoint has save_weights_only attribute
TensorFlow
Callback to save the Keras model or model weights at some frequency.
lapis sequoia
save_weights saves weights only
trim oar
Yeah isn’t that what you wanted? Change however you want and then load the weights?
lapis sequoia
yeah but how do i know if training data or epochs or anything changed?
trim oar
What do you mean? Isn’t transfer learning all about having pretrained model and train on new data/problem to save time?
Sorry I didn’t read anything else if you stated your origins problem
trim oar
Ok
lapis sequoia
the first time, all the weights are calculated, but for the second time, i just load them. I dont need to recalculate them
i only wanna recalc them if i have 11 images, for example
or if i have 10 images but different from the first ones
or if number of epochs change
trim oar
Yeah so you just save the model
lapis sequoia
or anything that will make weights change
trim oar
There may be better way for it but I would have just saved the model as a file
You just want to predict now so it’s model.predict, no?
lapis sequoia
yes
but again, if my training data changes, weights will change, and i want to recalculate them
trim oar
So yeah, have a folder specific to your project, save the entire model to an h5 file or whichever, document date and probably what did you train it on with a txt. You have that version of the model forever now, and you can keep on training without losing the original one.
lapis sequoia
i dont mean that
trim oar
Unless I’m missing something
lapis sequoia
i just wanna recalculate weights if anything that would have make weights change, has changed
trim oar
Oh cuz you have it on a running script you mean
lapis sequoia
yes
trim oar
Ah.. sorry then. I’m not familiar with the production environment yet
Sorry for the misunderstanding
lapis sequoia
no problems
bronze skiff
still not understanding
you have a model that's you've trained with some hyperparameters-- i assume you pass it in using argparse or something in the command line?
then you have to things you want: if you rerun the script again with no changes in hyperparameters, it'll just load the last trained model and run inference
otherwise if something changes, you retrain?
because it sounds like you want a CI/CD integration
with state+hyperparams being managed by, say, mlflow or something
@lapis sequoia
lapis sequoia
mmm it is written on python xd
i can paste the code if u really dont understand
but right now, i retrain the nn if there isnt any file like weights. But i have to manually delete the file so the nn is trained again. So yeah, i wanna retrain it if anything changed
arctic wedgeBOT
Hey @lapis sequoia!
It looks like you tried to attach a Python file - please use a code-pasting service such as https://paste.pythondiscord.com
lapis sequoia
Pastebin
Pastebin.com is the number one paste tool since 2002. Pastebin is a website where you can store text online for a set period of time.
sorry if coding sucks 😄
as you see, data is remade if npy files do not exist (but should be remade also if the content has changed) and same for weights. So if i want that to happen, i need to remove the files
bronze skiff
yeah, but that's nothing you can do within the script
if you change something outside of the script and then rerun it, the script doesn't know what changed
unless the script queries some persistent datastore that can check the diff of the files
lapis sequoia
yeah i though something about (for weights only) saving on a txt the epochs and batch_size, and on the script itself, compare the current ones with the ones on the txt
but for the images... idk what to do
i wanted to put it on al class for me, but i dont have that experience on making classes
my plan was:
one class called cnn, with functions such as: load data, train, and predict
and save ofc
bronze skiff
usually for hyperparameters in the script you can write them out into a yaml or txt file as metadata
and then compare it to the passed in hyperparameters when running the script to see if an update is needed
lapis sequoia
yeah but i think everything will be better inside a class
bronze skiff
data follows similar techniques-- you can perform a hash of the data
if the hash of your new data differs from the old one, reupdate
lapis sequoia
yeah i though about md5 for images. But to create the md5 i need to make the npy file, and this is what takes time 😛
is like: creating the npy everytime, and save or not
but what takes time is creating it
anyway, my neural network thinks bulbasaur is graveler so
xDDD
i dont think i will make it work
cuz i dont have much more images
 jaunty scroll
hello is it possible to convert json to dataframe if the levels of nesting in json data are arbitrary and change from tier to tier?
 vague mauve
guys i need help from someone who really knows what the are doing when it comes to coding especially in the realms of a.i if you do please dm me
 hollow gull
jaunty scroll
hello is it possible to convert json to dataframe if the levels of nesting in js...
hollow gull
jaunty scroll
hello is it possible to convert json to dataframe if the levels of nesting in js...
what does change from tier to tier mean?
hollow gull
vague mauve
guys i need help from someone who really knows what the are doing when it comes ...
Ask your question if you have one.
 fossil pecan
guys is there anyone that knows about keras? I have a simple question.
hollow gull
Ask your question if you have one.
hollow gull
fossil pecan
guys is there anyone that knows about keras? I have a simple question.
Ask your question if you have one.
jaunty scroll
hollow gull
what does change from tier to tier mean?
I mean that sometimes a nested dictionary will X number of values, and then the next tier down might have 10 more than that for example, and then theres also lists of dictionaries
and if im trying to create dataframe, it doesnt seem like it fits that changing number of values in a column-row relationship
fossil pecan
I see everywhere this, a variable next to a layer. What does it mean? The picture is from a guide on the official keras site
hollow gull
jaunty scroll
I mean that sometimes a nested dictionary will X number of values, and then the ...
I would try converting it to a dict and dropping it into a dataframe. I suspect that pandas is going to search all of the rows to determine what columns need to be present.
jaunty scroll
hollow gull
I would try converting it to a dict and dropping it into a dataframe. I suspect ...
ok i will give that a go thank you
hollow gull
pandas typically does a good job of converting a dict into a dataframe in my experience with a syntax like
df = pd.DataFrame(dict_data)
@glad mulch the thing that is going to make this a bit harder is that there are so many interaction terms with SOC. But in general I would say write out the equation for the linear regression. Then you can group the equation based on different variables and see how the predictions are going to depend on that variable.
SOC and energy are both slightly negative but SOC Energy is highly positive. Therefore if you hold SOC constant and increase energy what is the impact. What is the impact if you increase both SOC and Energy?
 visual rivet
fossil pecan
I see everywhere this, a variable next to a layer. What does it mean? The pictur...
visual rivet
fossil pecan
I see everywhere this, a variable next to a layer. What does it mean? The pictur...
i think it means that theres is 10 possible categories so there needs to be 10 outputs. its weird because i would expect there to be a softmax activation. without looking at the rest of the guide im not 100%
visual rivet
fossil pecan
I see everywhere this, a variable next to a layer. What does it mean? The pictur...
also i think the official keras documentation is different than the tensorflow doc. so the implementation would be different
visual rivet
fossil pecan
I see everywhere this, a variable next to a layer. What does it mean? The pictur...
looking at it again, it seems to be using a functional api so its passing in the first layer "x" to a output layer with 10 nodes.
fossil pecan
@visual rivet thank you very much. Now I get it.
trim oar
I'm not super great at statistics yet but from the equity world it's pretty simple. Value stocks in the past 10 years have been underperforming. But when times are bad, money flocks to value instead of growth. And I think it's early this year before March or last year that we saw a super abnormal flock into the energy sector.
 deep rock
Heyo!
So, i have created this dataframe with extra data that i calculated from original data source:
Here is how I constructed the dataframe:
The thing is ... I ploted another line with the acceptance_rate_y values on y-axis but it only initiates on value 2 on x-axis. Like this:
Anyone can help?
trim oar
deep rock
The thing is ... I ploted another line with the acceptance_rate_y values on y-ax...
I only saw countplot with data from tm_df by the way
 cunning dust
Hi sorry i may be asking something really silly but i have a question
if i have a huge number of information, wich would be faster to analyse and occupy less space, numbers or letters?
trim oar
cunning dust
if i have a huge number of information, wich would be faster to analyse and occu...
There never is a stupid question. Usually to analyze text they are still encoded.
I’m not sure where you’re getting at or what you’re trying to do
lapis sequoia
Wew, I made it over the ~waves~
livid quartz
"J48 performs better than Random forest because it deals with both categorical and continuous values,
whereas Random forest gets biased in favor of the attributes with categorical values. "
I found that statement in a research paper, just wondering if it was true that random forest is biased towards catergorical values?
 north plinth
can anybody tell me how can i run convolution neural network with just numpy ..Weights are saved in a pickle file which was trained with keras
lapis sequoia
are there any great youtube tutorials on data science ?
should i opt in buying a udemy course instead ?
 whole vortex
Guys, I've been given to task to cluster a seed dataset but unsure how to cluster the info as a row represents a different seed but unsure what data from each row to use when clustering the data
 regal herald
lapis sequoia
should i opt in buying a udemy course instead ?
regal herald
lapis sequoia
should i opt in buying a udemy course instead ?
That should be your last resort.
whole vortex
lapis sequoia
are there any great youtube tutorials on data science ?
Bruh there's loads of pandas tutorials online
ocean pumice
google have a lot of ressource about NN from numpy. i was searching for it a few days ago 🙂
regal herald
lapis sequoia
are there any great youtube tutorials on data science ?
There's great websites and Youtube tutorials on it.
@lapis sequoia List of resources for data science, I can remember:
Coursera - https://www.coursera.org/learn/python-data-analysis
SimpliLearn - https://www.simplilearn.com/big-data-and-analytics/python-for-data-science-training
DataCamp - https://www.datacamp.com/courses/intro-to-python-for-data-science
FreeCodeCamp video - https://www.youtube.com/watch?v=LHBE6Q9XlzI
Edureka video - https://www.youtube.com/watch?v=-6RqxhNO2yY

Coursera
Offered by University of Michigan. This course will introduce the learner to the basics of the python programming environment, including fundamental python programming techniques such as lambdas, reading and manipulating csv files, and the numpy library. The course will introduce data manipulation and cleaning techniques using the popular python...

Simplilearn.com
Enroll now for Data Science with Python course to get expertise in Python libraries such as NumPy, Pandas, SciPy, and Matplotib with ✔️ 6 Real-World Projects.

Master the basics of data analysis in Python. Expand your skillset by learning scientific computing with numpy.

This Python data science course will take you from knowing nothing about Python to coding and analyzing data with Python using tools like Pandas, NumPy, and Matplotlib.
This is a hands-on course and you will practice everything you learn step-by-step.
💻 Code: https://github.com/datapublishings/Course-python-data-science
🎥 Learn more about Dat...

🔥Edureka Python Certification Training: https://www.edureka.co/data-science-python-certification-course
This Edureka video on the 'Python For Data Science Full Course' will help you learn Python for Data Science including all the relevant libraries. Following are the topics discussed in this tutorial:
00:00 Agenda
02:37 Introduction To Data Scie...
lapis sequoia
regal herald
There's great websites and Youtube tutorials on it.
thanks so much man
whole vortex
Hey guys, I have a csv file with 3 columns. The first representing the row number, the second representing a node and the third representing a second node. I want to store the edge for each row between nodes for all rows... Does anyone know how I can do that with the networkx library?
 noble rock

Provide innovative solutions in advanced data analytics and AI for a number of booming industries!
Are u interested in this competition ?
We need only a team member because we have grouped with three people already. If you're eligible and would like to join , feel free to let me know.
trim oar
whole vortex
Hey guys, I have a csv file with 3 columns. The first representing the row numbe...
Can you translate that for a non-network person to understand?
whole vortex
I have 2 columns in a csv file
column1 represents node1
column2 represents node2
node 1 always connects to node2
the connection between node1 and node2 is called an edge
I need to find a way to create a list of edges and visualise the data from the csv file as a graph
@trim oar
trim oar
so each data point / row is a connection
and there are some properties on node2 that could be on node1 representing continuous connection
arctic wedgeBOT
Hey @solid isle!
Uh-oh! It looks like your message got zapped by our spam filter. We currently don't allow .txt attachments, so here are some tips to help you travel safely:
• If you attempted to send a message longer than 2000 characters, try shortening your message to fit within the character limit or use a pasting service (see below)
• If you tried to show someone your code, you can use codeblocks
(run !code-blocks in #bot-commands for more information) or use a pasting service like:
 solid isle
Can anyone help me in installing chatterbot library, I have tried several times but it is showing error , I tried to install it in pycharm, anaconda but at both places, I got error
WARNING: Retrying (Retry(total=4, connect=None, read=None, redirect=None, status=None)) after connection broken by 'ReadTimeoutError("HTTPSConnectionPool(host='pypi.org', port=443): Read timed out. (read timeout=15)")': /simple/chatterbot/ WARNING: Retrying (Retry(total=3, connect=None, read=None, redirect=None, status=None)) after connection broken by 'ReadTimeoutError("HTTPSConnectionPool(host='pypi.org', port=443): Read timed out. (read timeout=15)")': /simple/chatterbot/ WARNING: Retrying (Retry(total=2, connect=None, read=None, redirect=None, status=None)) after connection broken by 'ReadTimeoutError("HTTPSConnectionPool(host='pypi.org', port=443): Read timed out. (read timeout=15)")': /simple/chatterbot/ WARNING: Retrying (Retry(total=1, connect=None, read=None, redirect=None, status=None)) after connection broken by 'ReadTimeoutError("HTTPSConnectionPool(host='pypi.org', port=443): Read timed out. (read timeout=15)")': /simple/chatterbot/ WARNING: Retrying (Retry(total=0, connect=None, read=None, redirect=None, status=None)) after connection broken by 'ReadTimeoutError("HTTPSConnectionPool(host='pypi.org', port=443): Read timed out. (read timeout=15)")': /simple/chatterbot/ ERROR: Could not find a version that satisfies the requirement chatterbot ERROR: No matching distribution found for chatterbot
this was the error, can anyone tell what's the issue and how should I install this library
trim oar
While waiting, and while I don't have experience with chatterbox, I did encounter similar things awhile back. What happened to me was that I installed tensorflow on my machine but Jupyter was not recognizing it somehow. So it was a simple pip install tensorflow on the Jupyter notebook again for me at the end, but basically it may be the environment/path that you're directing them to
are different
tribal wind
hello guys, anyone here good with NLTK? could you pls dm me if possible
heady tide
Has anyone used a multiprocessing pool for lemmatization ? If so did it considerably improve the execution time ?
solid isle
trim oar
While waiting, and while I don't have experience with chatterbox, I did encounte...
how to change the path then😭 for anaconda
 civic fractal

Stack Overflow
I have a dataframe with about 1.5 million rows. I want to convert this to a protobuf.
Naive method
generated with protoc
import my_proto
pb = my_proto.Table()
for _, row in big_table.iterrows():...
Stack Overflow
I have a dataframe with about 1.5 million rows. I want to convert this to a protobuf.
Naive method
generated with protoc
import my_proto
pb = my_proto.Table()
for _, row in big_table.iterrows():...
Could anyone answer this, would me much appreciated
Pandas and protobuf
Could anyone answer this, would be much apprecaite
heady tide
protobuf will replace json
 rocky copper
can anyone reccomend me a good plagiarism checker algorithm for comaparing to two documents.
 cobalt elbow
hello
cobalt elbow
rocky copper
can anyone reccomend me a good plagiarism checker algorithm for comaparing to tw...
bibliography
 thin wolf
Hi y’all! I’m a python beginner trying to learn how to use Jupyter notebooks!
Good at sql, but new to notebooks and python
Does anyone know where I can find a list of recommended resources to get started?
thin wolf
regal herald
<@456226577798135808> List of resources for data science, I can remember:
Course...
Oh just saw this
 frosty pine
austere swift
frosty pine
austere swift
Just ask your questions
 olive lichen
hey all, does anyone know of how to do regular expression searches which iterate over a list
e.g. I have a list of regular expressions r, and I have some list of strings s and I want to search s for each regular expression in r
trim oar
olive lichen
e.g. I have a list of regular expressions *r*, and I have some list of strings *...
List comprehensions?
olive lichen
trim oar
List comprehensions?
having a hard time coming up with one. not sure how to iterate over a list when the iteration is happening inside of re.findall(x,y)
 digital charm
Can i ask some doubts here?
 midnight stone
is this the right place to ask about dirs and paths
lapis sequoia
guys does anyone knows Data Science with Python. If yes can u contact me
azure stump
These functions can really help u guys
https://medium.com/analytics-vidhya/knowing-these-can-make-you-better-in-python-26e43afc0fd

 hardy shale
Might be a Careers question, however do you guys feel like a masters/PHD is required to get a datascience/data engineering position?
whole vortex
Can someone help me out with getting this info and plotting it into graphs
 eager heath
Is this an assignment question?
whole vortex
@eager heath yeah
But it’s the only damn question I haven’t answered
I think it’s because there are 3 pieces of information
I feel like I’d need multiple graphs here for each day of the week for each bike type
So there are 3 bike types and 7 days in a week
So 21 graphs reepresenting the duration of a bike ride for each bike on each day of the week
@eager heath would you say I’m on the right track or no
eager heath
!rule 5
arctic wedgeBOT
5. Do not provide or request help on projects that may break laws, breach terms of services, be considered malicious or inappropriate. Do not help with ongoing exams. Do not provide or request solutions for graded assignments, although general guidance is okay.
eager heath
We can't help with with an assignment, sorry
 ripe lion
Does anybody have a good tutorial on how to use the matplotlib basemap?
 hoary breach
I am trying to learn monte carlos using python. Can anyone help
for background this is for modeling molecules
ocean pumice
what's your problem with montecarlo ?
did you try solving pi with it ? there isn't much to understand about montecarlo
ocean pumice
it should help you understand it, and it's very easy to implement
hoary breach
i just wanted to know if monte carlo is the only way for probability heuristics
ocean pumice
ha
probably not ? dunno
the best video about spiking neuron i found so far : https://www.youtube.com/watch?v=5SrEycIbfRE&list=PL09WqqDbQWHFvM9DFYkM_GfnrVnIdLRhy

The emergence of brain-inspired neuromorphic computing as a paradigm for edge AI is motivating the search for high-performance and efficient spiking neural networks to run on this hardware. However, compared to classical neural networks in deep learning, current spiking neural networks lack competitive performance in compelling areas. Here, for ...
 jagged plume
Hi, I am trying to plot a confusion matrix but I am getting the following error:
Error when checking input: expected sequential_22_input to have shape (50, 99) but got array with shape (1, 50)
This is my code: https://pastebin.com/4hqV7hmi
Any clue what the issue is, I have been trying to resolve this for hours now... 😅
Pastebin
Pastebin.com is the number one paste tool since 2002. Pastebin is a website where you can store text online for a set period of time.
 still delta
Guys after converting PDF to String, I want to extract a line from a long string text, for example a question "1. *************?" from the string?
Anyone could help?
lapis sequoia
Hello everyone! I just dropped a new YouTube video on how to interact with APIs in Python to load and work with data. Let me know what you think. https://youtu.be/laOQ3Sfw5yo

Python Project 2 : How to interact with APIs in Python
Beginner Level Tutorial
See all my content here:
https://linktr.ee/thirdeyecyborg
Medium Article referenced in this video:
https://towardsdatascience.com/how-to-interact-with-apis-in-python-10efece03d2b
To discover more about this Python crash course, PLEASE check out:
https://thirdeyecy...
worthy scarab
Looks like my coefficients are completely wrong
still delta
torpid cave
With an example it would be easier to help you
I think it will work, I am on it thank so much
 brazen owl
i
Hi
Give the mean of the series and its standard deviation. Is it possible to model the lifetime with a
exponential law? Argument based on the values obtained for the mean and the standard deviation.
that what i need to do
arctic wedgeBOT
Hey @brazen owl!
Uh-oh! It looks like your message got zapped by our spam filter. We currently don't allow .txt attachments, so here are some tips to help you travel safely:
• If you attempted to send a message longer than 2000 characters, try shortening your message to fit within the character limit or use a pasting service (see below)
• If you tried to show someone your code, you can use codeblocks
(run !code-blocks in #bot-commands for more information) or use a pasting service like:
brazen owl
import numpy as np
import matplotlib.pyplot as plt
import math

dat=np.loadtxt (fname=r"C:\Users\Amine13\Desktop\COURS 3I\math maintenance\a09.txt")
x=dat[:,0]
y=dat[:,1]


plt.plot(x,y,'.')
plt.show()
 final scaffold
Hi, need a quick help! Consider that I've (10+x) columns {x: 0 to any even number}.
I want to apply a condition where column 6th is not null + column names containing the word "events" is not null (these "events" column will depend on x).
How to do this in pandas?
serene scaffold
Is there a way to do this without looping?
    letters = ['A', 'B', 'C', 'D', 'E']
    vec = np.ones((5,))
    for i, letter in enumerate(letters):
        vec[i] = np.nanmax(n[LETTER_GRID == letter])
 pure sedge
Hi i have downloaded stock market data from yahoo finance in csv format , i want it to update daily in my csv , how can i do that?
serene scaffold
pure sedge
Hi i have downloaded stock market data from yahoo finance in csv format , i want...
what have you tried so far?
pure sedge
What i want to do eventually is create flask app with list of listed companies and when user selects date it creates a auto arima model
But what is the use if it does not update daily
 twilit pilot
Hello, I am getting this error when I am using the sklearn.linear_model LinearRegression. ```py
from sklearn.linear_model import LinearRegression
import numpy as np
X = np.array([1604275200 1604361600 1604448000 1604534400 1604620800 1604880000
1604966400 1605052800 1605139200 1605225600 1605484800 1605571200
1605657600 1605744000 1605830400 1606089600 1606176000 1606262400
1606435200 1606694400 1606780800])
y = np.array([400.51000977 423.8999939 420.98001099 438.08999634 429.95001221
421.26000977 410.35998535 417.13000488 411.76000977 408.5
408.08999634 441.60998535 486.64001465 499.26998901 489.60998535
521.84997559 555.38000488 574. 585.76000977 567.59997559
584.76000977])
model = LinearRegression()
model.fit(X, y)
The error looks like this
Reshape your data either using array.reshape(-1, 1) if your data has a single feature or array.reshape(1, -1) if it contains a single sample.
 fiery fossil
serene scaffold
Is there a way to do this without looping?
```py
letters = ['A', 'B', 'C', '...
fiery fossil
serene scaffold
Is there a way to do this without looping?
```py
letters = ['A', 'B', 'C', '...
What's 'n' and 'LETTER_GRID'?
livid quartz
Hi, . I want to do some exploratory data analysis on some data before I put it into a model, like create a correlation matrix, but with 77 variables it won't look tidy. Is there a way that I can reduce the number of variables by selecting the most important ones? https://github.com/GitEricLin/BMJOpen/blob/master/OGDataset.xlsx <- the data

GitHub
BMJ Open - Article “Predicting Mortality in Critically Ill Influenza Patients using an Extreme Gradient Boosting Model: a Multicentre Study in Taiwan" - GitEricLin/BMJOpen
serene scaffold
fiery fossil
What's 'n' and 'LETTER_GRID'?
another matrix with the same shape as LETTER_GRID
And LETTER_GRID is a matrix of strings.
whereas n is all floats.
trim oar
twilit pilot
Hello, I am getting this error when I am using the sklearn.linear_model LinearRe...
It's exactly like it says. Reshape it to 2D.
twilit pilot
i did that but then when i print the coef_ and the intercept_, i get 0, 0
which makes not sense, because the graph has an upward trend
 ionic moss
Hi, I have a Python Pandas question
I have a dataframe containing categorical columns Country/Region and Province/State.
I want to visualize the state/province wise combine number of confirmed, deaths, recovered, active COVID-19 cases in the USA
Ideally I want a bar chart with each of the states on the x-axis and the numerical values from column 'Confirmed', 'Deaths', 'Recovered' and 'Active' on the y-axis
fiery fossil
serene scaffold
And `LETTER_GRID` is a matrix of strings.
Run this code as it is gives error , as n and LETTER_GRID is not defined. What output do you want from this code?
ionic moss
Ideally it should look like this, all hints and tips are appericiated
serene scaffold
fiery fossil
Run this code as it is gives error , as `n` and `LETTER_GRID` is not defined. Wh...
that's not the entire program, so it's not expected that it would run on its own.
trim oar
twilit pilot
i did that but then when i print the coef_ and the intercept_, i get 0, 0
I didn't get 0
How did you reshape it
fiery fossil
serene scaffold
that's not the entire program, so it's not expected that it would run on its own...
I meant to say what is this block of code doing?
twilit pilot
trim oar
I didn't get 0
oh wait nvm. i was comparing stocks and 0 was what i got for a different stock. the other stock had no linear relationship lol. thanks for the tip tho
trim oar
🙂
trim oar
ionic moss
Ideally it should look like this, all hints and tips are appericiated
I can't play around with the notebook to find it for you right now but: https://stackoverflow.com/questions/38807895/seaborn-multiple-barplots
Stack Overflow
I have a pandas dataframe that looks like this:
class men woman children
0 first 0.91468 0.667971 0.660562
1 second 0.30012 0.329380 0.882608
2 third 0.11899...
Don't know if this helps
final scaffold
Hi, need a quick help! Consider that I've (10+x) columns {x: 0 to any even number}.
I want to apply a condition where column 6th is not null + column names containing the word "events" is not null (these "events" column will depend on x).
How to do this in pandas?
trim oar
final scaffold
Hi, need a quick help! Consider that I've (10+x) columns {x: 0 to any even numbe...
I don't quite understand what you're trying to convey but check out applymap. You can take alook here: https://stackoverflow.com/questions/19798153/difference-between-map-applymap-and-apply-methods-in-pandas
Stack Overflow
Can you tell me when to use these vectorization methods with basic examples?
I see that map is a Series method whereas the rest are DataFrame methods. I got confused about apply and applymap meth...
final scaffold
Should i share an image of a sample?
trim oar
Sure but I don't have anything to play with right now
final scaffold
Please see this ^@trim oar
Number of columns Untill column L is fixed, but after that columns will vary, there can be either 0 column or any number of columns
I want to filter this table when 'Installs'!=null & columns containing string 'events' are not null as well
trim oar
This is not optimized but if it’s a one time thing I’d probably just:
- Filter with regex to retain only columns with “event”. https://pandas.pydata.org/pandas-docs/stable/reference/api/pandas.DataFrame.filter.html
- Concat or merge with installs
- Dropna (how=“any”)
There’s probably a better way to do it just not on top of my head right now
But as always I suggest playing these with copy() only.
final scaffold
That's what i have been thinking to do, but i was avoiding this.
Well, if you come across something better, please ping me.
Thank you.
 strong oasis
Hey has anybody here done the freecodecamp rock paper scissors program?
It's my first ML program and I could use some help with it this week if anybody is familiar and/or available.
Learn to code. Build projects. Earn certifications.Since 2015, 40,000 graduates have gotten jobs at tech companies including Google, Apple, Amazon, and Microsoft.
arctic wedgeBOT
Hey @true oasis!
Uh-oh! It looks like your message got zapped by our spam filter. We currently don't allow .txt attachments, so here are some tips to help you travel safely:
• If you attempted to send a message longer than 2000 characters, try shortening your message to fit within the character limit or use a pasting service (see below)
• If you tried to show someone your code, you can use codeblocks
(run !code-blocks in #bot-commands for more information) or use a pasting service like:
lapis sequoia
What do you want to do with data ?
 red roost
Can anyone here point me to a good guide for advanced machine learning. I'm having trouble finding people on youtube who actually KNOW WHAT THEY ARE TALKING ABOUT. I am looking for some pseudocode for a basic neural net node class
 vital patio
lapis sequoia
What do you want to do with data ?
vital patio
lapis sequoia
What do you want to do with data ?
I have no intention to use it. I was just trying to do something to learn scrapy so this was the first idea that popped up in my head.
lapis sequoia
red roost
Can anyone here point me to a good guide for advanced machine learning. I'm hav...
Coursera
lapis sequoia
vital patio
I have no intention to use it. I was just trying to do something to learn scrapy...
Oh but check TOS first before doing scraping
lapis sequoia
You study zt university'?
red roost
no
red roost
thanks
vital patio
lapis sequoia
Oh but check TOS first before doing scraping
Is there any risk for my github account or anything? Because this is just for educational purposes only.
lapis sequoia
Im not sure but check TOS
vital patio
lapis sequoia
Im not sure but check TOS
Ok thanks anyway.
 molten hamlet
im reading a book, and they say that variance is divided not by n, but n-1
and Im confused, cause wherever I look, formula is for n
In statistics and in particular statistical theory, unbiased estimation of a standard deviation is the calculation from a statistical sample of an estimated value of the standard deviation (a measure of statistical dispersion) of a population of values, in such a way that the expected value of the calculation equals the true value. Except in so...
 high badge
yea i learned something in my statistics class that dividing by n-1 for some reason fits the measurement of standard deviation better
 frozen gazelle
Please, if anyone will let me interview them about their job PM me or fill this out: https://docs.google.com/document/d/1oddinBkUCT1DQrFkJDRH6GYjmmWJDRmagcaW0hmQp0o/edit?usp=sharing

Google Docs
Please help answer some! What is your job title and what does your daily role look like? How long have you been doing this? What would you do in your early career? College? First position? What would you have done differently straight out of college/when you began entry level/first job? Are ...
I'll pay if needbe
olive lichen
hi everyone, the round() function is being a piece of shit. i'm really angry lmfao
this is what i have written
    for num in list:
        print(round(num, 3))

roundlist(liberalMindZScores)```the goal is to round every number in the list to three decimal places
when i run, i get this error
TypeError                                 Traceback (most recent call last)
<ipython-input-66-fcef4bcaa5f3> in <module>
      3         print(round(num, 3))
      4
----> 5 roundlist(liberalMindZScores)

<ipython-input-66-fcef4bcaa5f3> in roundlist(list)
      1 def roundlist(list):
      2     for num in list:
----> 3         print(round(num, 3))
      4
      5 roundlist(liberalMindZScores)

TypeError: round() takes 1 positional argument but 2 were given```