#data-science-and-ml
1 messages · Page 271 of 1
 ripe forge
It's like training a parrot to say the word yellow. Now, if you show it a yellow card, and ask it what colour it is, the parrot says yellow. You're like yay i taught it colours. Right?
"no Darr, that doesn't make sense. Show it a blue card, and it will still say yellow!"
Well, removing the test set is like removing all cards except yellow. You just removed the blue card... That's bad.
You don't achieve your goal without a test set in ML. because you can be fooling yourself into thinking you achieved it, but all you did was build a parrot.
 fleet heath
yeah
 steady harbor
Can anyone help me with a Langton Ant's theory ... 😐

This is the code btw ... need to be done with matplotlib and the code for it is already written and Only the theory part is left which I dont understand some parts of it .... Like for loops in the bottom :
 bold rune
Does anyone know how to separate a single column vector from the rest in a matrix that has multiple columns? I'm using numpy
 wild pine
do you mean like extracting [1,4,7] from [[1,2,3],[4,5,6],[7,8,9]] ? @bold rune
bold rune
Yeah pretty much, but someone else already answered. All I needed was data[:, n] to extract the n'th column:)
wild pine
yeah, exactly ^^
 proper swift
does any one know how to move a row in pandas to the end of a dataframe?
 remote pond
maybe could let the row and the last row exchange
temp = row, row = last row, last row = temp
 red briar

Stack Overflow
So I have a dataframe that looks like this:
#1 #2
1980-01-01 11.6985 126.0
1980-01-02 43.6431 ...
 ivory stag
heyy, can somebody help me with how to count number of rows in a dataframe, please?
proper swift
ivory stag
thank you so much!!!
proper swift
@remote pond dont want to exchange any rows, just move a row to the bottom
i was thinking of dropping the row, then reappending it to the dataframe, but dont think thats efficient?
remote pond
sorry I misunderstand it
the only way I can find is the same with you
if dataframe is a linked list then it's easy, but dataframe is not, I think your idea is efficient enough
ivory stag
i am sorry but i have another doubt as well T-T
so here is a dataframe (named 'class_report' )in which there is a column called marks and name, so i need a statement in which i will be able get an output where the mark is less than 50 and names with 'r' ( i tried to do it but then i cant get the name with 'r')
print(class_report[class_report.marks<50]) - i got the answer
print(class_repot[class_report.name=='r']) - i got no answer
but i need both of in the same line, i cant use two print commands here T-T
remote pond
could you show the output of class_report.dtypes
one possibility is that there's no "r" in the name col
ivory stag
lol no there is 'r' in the dataframe but it shows 'empty dataframe' lol
but the thing is we need to do both the conditions in a single line
remote pond
class_report[class_report.marks<50][class_report.name=='r'] this must works
ivory stag
let me try that one
name marks grades 0 andrew 80 B 1 jackson 45 D 2 ritika 90 A 3 sarah 67 C Empty DataFrame Columns: [name, marks, grades] Index: [] UserWarning: Boolean Series key will be reindexed to match DataFrame index. print(class_report[class_report.marks<50][class_report.name=='r']
nope :((
ivory stag
wait lets says that we need to get rows of students with grades 'B', what would we do then?
ivory stag
i keep on getting userwarning: boolean series key will be reindexed to match dataframe index lol
ivory stag
aah but why is it empty?
remote pond
class_report[class_report.marks<50][class_report.grades=='D'] try this
remote pond
most cases not
ivory stag
if it is the mark alone, i am getting it, and if it is the grade alone without the marks statement, it shows empty dataframe lol
remote pond
show the output of class_report.dtypes
bold rune
I would like to output a scatter plot given some data I have in two separate numpy column vectors
However, when I run my code it doesn't show the plot
here's my code for the plot:
def plotdata(true_house_prices, estimates):
    fig, ax = plt.subplots()
    ax.scatter(true_house_prices, estimates)
    ax.set_xlabel('True Price')
    ax.set_ylabel('Estimated Price')
    plt.show()

plotdata(t_train, t_test)
what am I doing wrong here?
 gentle token
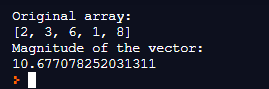
np.linalg.norm(array) anyone know what this is exactly doing? (numpy)
bold rune
I'd imagine it's normalizing the given array @gentle token
 wild pine
it's been a while since i did anyting with pyplot, but does fig.show() instead of plt.show() do the trick?
@bold rune
bold rune
wild pine
it's been a while since i did anyting with pyplot, but does `fig.show()` instead...
I'll try that
Hmm nope. Still nothing:/
@gentle token Formula for normalizing values in a given set?
gentle token
bold rune
<@!319993807183544320> Formula for normalizing values in a given set?
yes. at first i thought it was just the sum of all the values and divided by the length but i was wrong
thought that was "normalizing"
gentle token
@bold rune ahh thank you!
bold rune
No worries:)
remote pond
so the age values are dummy variables?
proper swift
its alright, i figured it out
 steady elbow
hey
i have a DataFrame and i need to fix index int of a specific value in a row
from pandas import DataFrame
from numpy import int8 as np_int8
data_frame = DataFrame(
  [[i+2, i + 4] for i in range(0, 50)],
  columns=["Temperature", "Duty"],
  dtype=np_int8
)
i tried finding the answer in the docs. but couldnt find it
red briar
ivory stag
`name marks grades
0 andrew 80 B
1 jackson 45 D
2 ritika...
Did you do groupby?
 cobalt jetty
Hey, @steady elbow
What do you mean by fixing an index int?
Throwing your code in JN shows that your columns are well-set and both of type int.
 molten hamlet
Hey, any good book for machine vision? 😄
 modest salmon
can anyone help me with some categorical data stuff in seaborn?
 spiral peak
molten hamlet
Hey, any good book for machine vision? 😄
spiral peak
molten hamlet
Hey, any good book for machine vision? 😄
Specifically machine vision or ML/AI in general?
molten hamlet
more like machine vision algos and image processing stuff then neuralnets @spiral peak
but give me for both field 🙂
spiral peak
hmmmm, so I don't think I have anything machine vision related specifically bookmarked or saved unfortunately. My one professor does recommend this book highly though: https://smile.amazon.com/Hands-Machine-Learning-Scikit-Learn-TensorFlow-dp-1492032646/dp/1492032646/ref=dp_ob_title_bk
He says it's pretty well what he covers in his grad class. You can probably take a look at the O'Reilly catalogue for other suggestions.
 velvet thorn
gentle token
`np.linalg.norm(array)` anyone know what this is exactly doing? (numpy)
velvet thorn
gentle token
`np.linalg.norm(array)` anyone know what this is exactly doing? (numpy)
no, that takes the norm
which you can think of as a measure of "distance" (it is related to normalisation though)
!e import numpy as np; print(np.linalg.norm([3, 4]))
 arctic wedgeBOT
@velvet thorn :white_check_mark: Your eval job has completed with return code 0.
5.0
so its the distance between all those numbers
velvet thorn
the default case
is to treat the array passed to it as a vector representing a point
and to calculate the Euclidean norm
which is basically (x ** 2 + y ** 2 + ...) ** 0.5
gentle token
ah i see
velvet thorn
one form of normalisation is to divide each row by its norm
velvet thorn
bold rune
This calculation should normalize every value in the array
this is specifically min-max normalisation
there are other methods
 somber bane
Can anyone give my some good article of a step by step applying stochastic gradient descent on matrix factorization?
velvet thorn
velvet thorn
and to calculate the Euclidean norm
this can also be thought of as the magnitude of a vector in space
gentle token
i need to learn more about this 😅
velvet thorn
in short, the "norm" of a vector is one conceptualisation of its "length"
gentle token
oh
velvet thorn
is that too abstract
gentle token
it makes sense
ive heard of this before
i had to normalize a vector
in the godot game engine
velvet thorn
yeah, and you need to choose an appropriate norm for that
ivory stag
red briar
Did you do groupby?
nope, but i was able to find the mistake, thank you!!
 glad jay
hey guys, can someone help me implement an add_edges method to my ADT?
im a little confused on how to do it, i can paste some code here too
 fast steeple
yup
glad jay
class Node:

    def __init__(self, data=None, next=None):
        self.data = data
        self.next = next


class LinkedList:

    def __init__(self):
        self.head = None

    def append(self,data):
        if not self.head:
            self.head = Node(data)
            return None
        curr = self.head
        while curr.next:
            curr = curr.next
        curr.next = Node(data)


class Vertex:

    def __init__(self, id):
        self.id = id
        self.neighbors = LinkedList()

    def add_neighbor(self, neighbor, weight=0):
        self.neighbors.append({neighbor: weight})

    def get_connections(self):
        return self.neighbors.keys()

    def get_id(self):
        return self.id

    def __str__(self):
        lst = []
        for x in self.nieghbors:
            lst.append(x.id)
        return "vertex ID: " + str(self.id) + "is neighbor of " + str(lst)


class Graph:

    def __init__(self):
        self.vertList = {}
        self.vertices = 0

    def add_vertex(self, val):
        self.vertices += 1
        newV = Vertex(val)
        self.vertList[val] = newV
        return newV

    def add_edge(self):
i think i have class Vertex implemented correctly
and some parts of graph implemented correctly
fast steeple
so u want to add a node on a given path or to the deepest end
glad jay
good question haha
could i post some specifications in this chat?
i think its given path
but i dont want to be wrong and you help me and waste ur time haha
fast steeple
def Getvalue(self, config = None, path = ""):
        """
        Recursively Traverses the path and gets the value

        :Args:
            config: Dict
                dict to traverse

            path: String, List
                Path used to traverse the dict
        """
        if config == None:
            config = self.config_dict

        if isinstance(path, str):
            path = path.split("/")
        if len(path) >= 1 and not("" in path):
            index = path.pop(0)
            data = config.get(index)
            if isinstance(data, dict):
                return self.Getvalue(data, path)
            else:
                return data
        else:
            return config


    def Setvalue(self, value, config = None, path = ''):
        """
        Recursively Traverses the path and Sets the value

        :Args:
            value: Any
                Value to replace or set

            config: Dict
                dict to traverse

            path: String, List
                Path used to traverse the dict
        """
        if config == None:
            config = self.config_dict

        if isinstance(path, str):
            path = path.split("/")

        if len(path) >= 1 and not("" in path):
            index = path.pop(0)
            if not config.get(index):
                config[index] = value
                return None

            data = config.get(index)
            if isinstance(data, dict):
                return self.Setvalue(value, data, path)
            else:
                if isinstance(data, list):
                    config[index].append(value)
                else:
                    config[index] = value
        else:
            return None
works on trees if u give it path to traverse
glad jay
sorry, what is this? jhaha
fast steeple
it adds and access the edgs in a tree
 heady tide
Sorry for a non code related question, but I just wanted to ask whether these questions/theorems are applied and used in some cases in DS
cobalt jetty
Those are Statistics exercises, especially the point estimation part of it. They can be used in data science when you do research on econometry, polling, etc.
 livid quartz
Hey does anyone have any good youtube video / book suggestions for learning linear algebra from scratch?
cobalt jetty

Home page: https://www.3blue1brown.com/
Kicking off the linear algebra lessons, let's make sure we're all on the same page about how specifically to think about vectors in this context.
Typo correction: At 6:52, the screen shows
[x1, y1] + [x2, y2] = [x1+y1, x2+y2].
Of course, this should actually be
[x1, y1] + [x2, y2] = [x1+x2, y1+y2].
Ful...
livid quartz
Thanks will check it out 🙂
 lapis sequoia
!e print("hello world")
arctic wedgeBOT
You are not allowed to use that command here. Please use the #bot-commands channel instead.
molten hamlet
spiral peak
hmmmm, so I don't think I have anything machine vision related specifically book...
have you read that book ?
lapis sequoia
livid quartz
Hey does anyone have any good youtube video / book suggestions for learning line...

YouTube
Matrices, vectors, vector spaces, transformations. Covers all topics in a first year college linear algebra course. This is an advanced course normally taken...

How to Get Help with Linear Algebra for Machine Learning? Linear algebra is a field of mathematics and an important pillar of the field of machine learning. It can be a challenging topic for beginners, or for practitioners who have not looked at the topic in decades. In this post, you will discover how to […]
 worthy scarab
In this plot it takes the 11.169 from somewhere in the code using {:6.3f}, what does this {:6.3f} mean or represent?
steady elbow
hey i recently asked a question about pandas and my reaction was "what tf was i writing ?" so here is the correctly written question
how can i get index of a value in a specific column
from pandas import DataFrame
from numpy import int8 as np_int8
data_frame = DataFrame(
  [[i+2, i + 4] for i in range(0, 50)],
  columns=["Temperature", "Duty"],
  dtype=np_int8
)
i know how to get a value with a specific index in a row.. data_frame["Temperature"].iloc[0] would return 2
but how would i get the index by searching for a value. so if i searched for value 30 i would get 28 back.
 chrome barn
data_frame.index[data_frame['Temperature']==30].to_list()
 torpid cave
worthy scarab
In this plot it takes the 11.169 from somewhere in the code using {:6.3f}, what ...
torpid cave
worthy scarab
In this plot it takes the 11.169 from somewhere in the code using {:6.3f}, what ...
Can't tell how it gets it
But it is the critical value
For your hyp-test
chrome barn
{:6.3f}

is relating to the format of the output of the calculation of 100*prob1,HighX

meaning the output needs to have at least 6 characters with 3 after the decimal point.

Your output 11.169 confirms to this

for more info about it search for: python string format (ting)
 limpid oak
does anyone have python notebooks for practise perticulary in gis and datascience?
cobalt jetty
Go on github and search for keyword in their searchbar. You'll get many recs. Otherwise !resources
 novel field
Hey guys. I am working with a pandas DataFrame like this and am looking to create a nested dictionary keyed by 'id' with values being dictionaries with keys and values for 'capacity' and 'level' for only the ids where is_customer is True. Anyone know how to do this?
 umbral sluice
I have question guys,
I want to make a models in tandem
Something like this
How to do it?
limpid oak
@novel field try df.iterrows()
novel field
Thank you I think that's what I want!
novel field
@limpid oak do you know how i could iterrows() only where is_customer is True?
 brisk ravine
how to get started with machine learning
 regal summit
is machine learning with andrew-ng good to start with machine learning??
 tranquil fable
I read a couple of job advertisements so far, all of them asking for knowledge in python or R. I wonder why none of them said "Julia or Scala would be nice as well". Any1 have an idea why? I thought Julia would be the "next big thing" for data science
 sick blaze
Python and R are much more popular than Julia
You might be working on scala or Julia on the job along with python
@brisk ravine checkout the pinned msgs
tranquil fable
I know that, but a phrase like "Cool if you already know Julia" would assure an applicant in my eyes that the advertisers know what they are looking for
sick blaze
If you think of Golang, it is considered the web server language of the future, yet it is still not very popular compared to other languages like cpp or python or java
Same thing goes for Scalia and Julia
tranquil fable
If I remember vaguely, Golang is a lot faster than the typically used languages, which is a main selling point. Is that correct?
sick blaze
It’s selling point is speed and simplicity, correct
Imagine cpp and python had a baby
 pine burrow
Anyone know why this errors?
mydb = mysql.connector.connect(
host="<host>",
user="<username>",
password="<my_pass>"
)
print(mydb)```
Everything matches up, yet I don't know why it does not connect... serene scaffold
@pine burrow looks like a #databases question
pine burrow
oh, thought I was ther elol
steady elbow
so i have a DataFrame object and i want to update a row
import pandas as pd
import numpy as np

df = pd.DataFrame(
    [[i+1, i+4] for i in range(0, 10)],
    columns=["Temperature", "Duty"],
    dtype=np.int16
)
new_df = pd.DataFrame(
    [[2, 50]],
    columns=["Temperature", "Duty"],
    dtype=np.int16
)
df.update(new_df)
how would i update x row because this updates the first row to those values
df.iloc[5] = [10, 80] seems to work
is it a good practice ?
livid quartz
Nothing wrong with using iloc, that's what I always use anyways
 hushed sleet
Have you ever code your own Decision Tree Clasifier based on sklearn.tree?
I got problems with this task on uni. We have to write our decision tree classifier
 spiral yew
not sure if this is the right channel but anyone know why my cuda only works for pytorch but not tf? im on ubuntu 20.04
serene scaffold
spiral yew
not sure if this is the right channel but anyone know why my cuda only works for...
I'm awful at solving environment problems but what error are you getting?
spiral yew
@serene scaffold its not an error i type python3 in terminal and then check if tensorflow is using the gpu my gpu isnt detected
but pytorch works for some reason
serene scaffold
@spiral yew what are you doing to make sure that pytorch uses cuda? what are you doing to make sure that tf uses cuda?
spiral yew
@serene scaffold yea lemme pull it up gimme a few min
 tall basin
Hey guys, can you help please? I am seeking free courses of data science I'll do a list and after I'll post this, may help a lot of people, Thank you so much!
 high badge
for scikitlearn.model_selection: whats the difference between cross_val_score() and cross_val_predict()?
i know that both divide the data you pass it into k-folds with i=1 to k iterations (splits), and each iteration it chooses 1 fold as the test set and the rest are training folds
serene scaffold
high badge
for scikitlearn.model_selection: whats the difference between cross_val_score() ...
those sound like variable names, so it's anyone's guess.
high badge
oh my bad
serene scaffold
so those are functions defined in sklearn?
high badge
yea
spiral yew
@serene scaffold ok so this is what i ran for pytorch: import torch
print(torch.cuda.is_available())
sry im not sure how u add like code blocks
wait wtf now it comes true
bruhh what
lol sry for the pings then, i figured it out by myself thx @serene scaffold
glad jay
can someone help me test out a ADT code?
im just trying to see how it works
its an undirected graph
 smoky bobcat
i need help asap, anyone online available?
@serene scaffold When I perform Normalization/Standardization (fit_transform) it shows me the transformed values however if after i try to print the data transformed the values are the same
anyone help pls, im stuck here for 1 day or so
velvet thorn
smoky bobcat
anyone help pls, im stuck here for 1 day or so
fit_transform doesn't operate inplace.
velvet thorn
high badge
for scikitlearn.model_selection: whats the difference between cross_val_score() ...
one gives a score, the other predictions
just like model.score vs model.predict
velvet thorn
steady elbow
``df.iloc[5] = [10, 80]`` seems to work
it does, but I very rarely have a reason to update a DataFrame by position
which is what iloc does
 quick igloo
Hello i want to be data scientist where should I start
 midnight trench
so i have 2 numpy array of string
import numpy as np
array1 = np.array(["he","she","ree"])
array2 = np.array(["he", "she", "ree", "me", "aee"])

result = array2-array1
#i want result to be me and aee and like that i want the result to be components that's only available in array2 and result shouldn't contain any array1 items.
print(result)
@midnight trench why are you using numpy arrays for strings?
midnight trench
Bcz im using a .txt file to import array/List and i thoughtnunpy is betterway to do it, if threis any way using normal python list please let me know, i have to manage 300 students data using this oof.
@velvet thorn
velvet thorn
midnight trench
Bcz im using a .txt file to import array/List and i thoughtnunpy is betterway to...
why wouldn't you just use a list comprehension
!e
left = ['a', 'c', 'e', 'g']
right = ['a', 'b', 'c', 'd', 'e', 'f', 'g']

unique_left = set(left)

print([e for e in right if e not in left])
@velvet thorn :white_check_mark: Your eval job has completed with return code 0.
['b', 'd', 'f']
Thx
smoky bobcat
velvet thorn
`fit_transform` doesn't operate inplace.
i dont understand, could you elaborate for noobie words
into''
velvet thorn
smoky bobcat
i dont understand, could you elaborate for noobie words
it creates a copy
with the changes made
it doesn't change the thing you pass into it
smoky bobcat
so how do i fix it?
smoky bobcat
yes but i dont see where i make the copy so dont know how to fix it
velvet thorn
smoky bobcat
yes but i dont see where i make the copy so dont know how to fix it
fit_transform returns a copy.
smoky bobcat
ok, so should i save it?
now that i save it, it doesn't have the table format like before the stardandization
velvet thorn
smoky bobcat
now that i save it, it doesn't have the table format like before the stardandiza...
check the return value type
and the type of your original data
and you will understand why
smoky bobcat
the return type is a numpy array
so do you mean that even tho in jupyter the visualization is different from before now the thing is actually the same ?
velvet thorn
smoky bobcat
so do you mean that even tho in jupyter the visualization is different from befo...
well
they're different data types
but pandas DataFrames are backed by numpy arrays
smoky bobcat
is there a way to update the pandas with this numpy array?
 median dove
Hey guys, when should I scale/standardize my data? I’ve seen a lot of notebooks that scale/standardize/normalize their data but how do I know when should I do any of those?
velvet thorn
smoky bobcat
is there a way to update the pandas with this numpy array?
yes, but why?
velvet thorn
median dove
Hey guys, when should I scale/standardize my data? I’ve seen a lot of notebooks ...
there are things you do that depend on scale.
for example, KNN or SVMs
because these consider the distance between points (rows)
glad jay
anyone have some knowledge on undirected graphs?
 zealous holly
hey everybody
 bright spindle
hello, My program is a simple client server message program, but i cannot figure out the 'send' and 'recv'. How do we know if its client.send or server.send if i want to send from server to client ? the same with recv
zealous holly
I'm scraping a covid-19 website and need help with xpath selectors

Live statistics and coronavirus news tracking the number of confirmed cases, recovered patients, tests, and death toll due to the COVID-19 coronavirus from Wuhan, China. Coronavirus counter with new cases, deaths, and number of tests per 1 Million population. Historical data and info. Daily charts, graphs, news and updates
 thin quiver
Hello, i am am having a problem, what IDE do you use for data science, Pycharm, Jupyter, Colab, or something else?
because i need to pick one and i don't know what to pick
 fair wraith
@thin quiver Atom + Hydrogen
thin quiver
idk i found this: https://chrome.google.com/webstore/detail/shopee-data-scraper-produ/abkpijbdlpolpdmjpbbieodlngljodbn?hl=en-GB

Shopee data scraper - easy data extraction tools of product, price, sales rank, review
smoky bobcat
@velvet thorn how much would you charge me to explain some basic ml content i'm not being able to get
velvet thorn
smoky bobcat
<@!171929073063297024> how much would you charge me to explain some basic ml con...
!rule 5
arctic wedgeBOT
5. Do not provide or request help on projects that may break laws, breach terms of services, be considered malicious or inappropriate. Do not help with ongoing exams. Do not provide or request solutions for graded assignments, although general guidance is okay.
arctic wedgeBOT
6. No spamming or unapproved advertising, including requests for paid work. Open-source projects can be shared with others in #python-general and code reviews can be asked for in a help channel.
smoky bobcat
@velvet thorn i need to learn how to standardize or normalize a model and then use it
i am having trouble with normalization/standardization
do you have an example on hand?\
velvet thorn
smoky bobcat
do you have an example on hand?\
check sklearn documentation
they have examples.
did you try Google?
velvet thorn
 gray wigeon
any idea on how to scrape list of seller data from shopee or lazada?
gray wigeon
any idea on how to scrape list of seller data from shopee or lazada?
p sure that's against TOS
smoky bobcat
i did, but problem is after i get that numpy array, and don't know how to proceed with that for the ml because im use too the panda dataframe
velvet thorn
smoky bobcat
i did, but problem is after i get that numpy array, and don't know how to procee...
why do you need to work with dataframes?
smoky bobcat
so i need to predict a disease, i have a dataset, it's imbalanced. I'm trying to balance it but then i get that numpy array and i get stuck
and yes ive searched a lot on google and youtube tutorial
velvet thorn
velvet thorn
why do you need to work with dataframes?
doesn't answer this question
smoky bobcat
they all show how to use the function of the library but not what to do after with the numpy array
smoky bobcat
velvet thorn
doesn't answer this question
hmm because i don't know how to do it otherwise, I have learnt how to convert back a numpy array to a pandas dataframe tho. Point is then I'd have to concatenate columns and it's a mess
velvet thorn
smoky bobcat
hmm because i don't know how to do it otherwise, I have learnt how to convert ba...
...what do you want to do after you perform scaling?
smoky bobcat
@velvet thorn use Decision tree, logistic regression and different classification models to predict the target
velvet thorn
you know you can fit those on numpy arrays too, right?
smoky bobcat
Yes but I’m not sure if it should be done that way, and it becomes really difficult to visualize data like that
velvet thorn
smoky bobcat
Yes but I’m not sure if it should be done that way, and it becomes really diffic...
why do you need to visualise post-scaling?
smoky bobcat
Also because, I have some features that are not going to be scaled and some that needs to be scaled
velvet thorn
smoky bobcat
Also because, I have some features that are not going to be scaled and some that...
don't use sklearn's transformers
complicated for a beginner
just do it in pandas
smoky bobcat
How?
velvet thorn
what kind of scaling?
smoky bobcat
Normalization or standardization
smoky bobcat
I could do both
velvet thorn
just choose one.
smoky bobcat
Normalization
smoky bobcat
Mean 0 std 1
smoky bobcat
Usually I would use MinMaxScaler, make a model, fit it and then transform
smoky bobcat
Ok sus then same thing for standard scaler
smoky bobcat
velvet thorn
how does the mathematics work?
I’m not required to learn the math behind.
smoky bobcat
I’m sorry for being like this 😪
velvet thorn
why are you sorry?
not everyone likes learning for the sake of learning
and you don't owe me anything TBH
anyways
hope you figure it out! 👋
can you elaborate
hm
for production?
or experimentation
gray wigeon
oh hey i had this kind of distribution too lol
gray wigeon
velvet thorn
p sure that's against TOS
totally lol. that's why i didn't elaborate much
gray wigeon
thin quiver
idk i found this: https://chrome.google.com/webstore/detail/shopee-data-scraper-...
saw this too but this is more product data than seller data
thin quiver
o, ok
gray wigeon
any advice on making a regression analysis on a zero inflated dataset?
 winter mural
Hi, I'm planning to learn python data science. where should i start?. I know numpy basics
thin quiver
@winter mural here is a good course: https://youtube.com/watch?v=tPYj3fFJGjk, i would start with google colab, or jupyter noteboock

Learn how to use TensorFlow 2.0 in this full tutorial course for beginners. This course is designed for Python programmers looking to enhance their knowledge and skills in machine learning and artificial intelligence.
Throughout the 8 modules in this course you will learn about fundamental concepts and methods in ML & AI like core learning alg...
 rigid aurora
worth a shot.. dunno who checks this channel
i need help plotting two plots side by side, adding dots on them, then connecting the dots
assume this is doable.. just cant find anything on tack
STACK*
lapis sequoia
You could plot a function between the Points, so the function connects them. Never tryed this, but should work. But i think its more work than necessary
Ah nevermind, subplots. I try something
rigid aurora
oooo
it doenst have to be subplots! i just couldnt figure out how to plot 2 plots in 1 figure side by side
if i put two in one, theyll stack on top of each other
lapis sequoia
rigid aurora
if i put two in one, theyll stack on top of each other
And you dont want them to stack on top of each other? What you want to show with this? Some learning effects? Or different ML Models?
rigid aurora
nope! just for visual
because im writing up a paper right now
need to show result
lapis sequoia
Okay and if you try tree subplots, one and two with the first and second function and the third stacked together? So you can show your results in two ways. First of all you can referenz to the function itself and second you could referenz to the third one, stacked together and theire differenzes/equality?
rigid aurora
yes!
i can do this
buttt
i am doing a continuition of this paper
who already showed their experiment result like this
my work is an improvement to this paper, and i would like to compare them
i have an idea...
lapis sequoia
Ahhh okay, so if you dont use a X and Y axis with concret values, you could add to one of your functions a +x value, so if you plot them together, the functions dont stack on top of each other
lapis sequoia
Yeah fixed it :d
rigid aurora
are you a data scientist sir?
lapis sequoia
Master student Data Science, so close to that
Anyone knows why input_shape = (3, 6, 6) x = tf.random.normal(input_shape) y = tf.keras.layers.Conv1D( 3, 3, input_shape=input_shape[1:])(x) print(y.shape) outputs the y shape as (3,4,3) instead of (3,4,4) ?
rigid aurora
same here poopaye
mater student
well, hopefully to graduate this sem
i wonder who will hrie me
hire
lapis sequoia
let's say the input_shape represents an image of size 6x6x3 ( with 3 channels ).. why when I convolve it with a filter 3x3x3 I don't actually get an output of 4x4?
rigid aurora
conv1d?
 sand crane
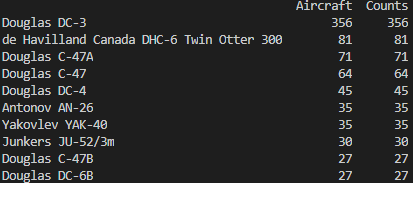
Hi guys, I am looking for some help. I am trying to sort my dataframe by finding the elements that have the most occurrences and then extracting those (I've done this with values_counts()). I also want to get the amount of occurrences for each unique element (I have also done this with values_counts().values). My issue is that I want to have the unique occurrences in one column of my dataframe and their occurrence amount in another column but value_counts() doesn't seem to allow this as it returns the element along with its count. You can see in my dataframe I have the string of the element and the count in the aircraft column (using value_counts()). And in the counts column I have just the count (using value_counts().values). If I use unique() to get each unique occurrence of an element then the order will be wrong where the aircraft won't match the correct count. How can I retain the order of these two?
 cyan matrix
Having a difficult problem. Have a pandas dataframe with ~200 rows/columns. Columns are variables of what services are provided by recovery centers. Each center offers some, but not all of the services available (for example, the first row only offers 78 of the ~200 variables). Is there a good way to match my value to the column label so that the 78 of the 200 variables are in their appropriate columns, and the services they do not provide are empty?
 untold cedar
Hello, i am having trouble with matplotlib. My '''matplotlib.pyplot.show()''' seems to do this
 odd tendon
If somebody could help me I'd be really grateful. I can't get PyCharm SciView to plot anything using geoplot, it simply doesn't show in the tab at all.
lapis sequoia
untold cedar
Hello, i am having trouble with matplotlib. My '''matplotlib.pyplot.show()''' se...
The Error Type say you try to plot a list. So try a solution from this thread:
https://stackoverflow.com/questions/40073322/plotting-list-of-lists-in-a-same-graph-in-python
Stack Overflow
I am trying to plot (x,y) where as y = [[1,2,3],[4,5,6],[7,8,9]].
Say, len(x) = len(y[1]) = len(y[2])..
The length of the y is decided by the User input. I want to plot multiple plots of y in the...
untold cedar
lapis sequoia
The Error Type say you try to plot a list. So try a solution from this thread:
...
im trying to calculate my points and have the live graph in the same program. is this not possible? it seems to halt each time it shows the graph
lapis sequoia
untold cedar
im trying to calculate my points and have the live graph in the same program. is...
So you try to plot live data on a live graph?
untold cedar
yes
lapis sequoia
It is possible, i saw a tutorial once. W8
Python Programming tutorials from beginner to advanced on a massive variety of topics. All video and text tutorials are free.
This will help you
untold cedar
yep ive seen that
the tutorials all seem to have their "live" data passed through a csv within a function
but mine is generated in a loop within the program, and i cant seem to continue the iteration once ive called the FuncAnimation
lapis sequoia
Hmh i need to see the code, but normaly it is possible to do it this way.
Comment your Code that dont work and clip it to one of the Available Help channels. More people read it than and can help you with the code.
untold cedar
aight will do ty
 cedar sun
which is a good lib for IA on python? ive used keras, but i heard pytorch is good too
 livid cradle
any idea of what proyect i could do
i just finished a very big proyect and don't know what to do
lapis sequoia
Depends on your skills. RNN or LSTM is a good one.
cedar sun
who are u replying to
this guy is just spamming the same question on all channels
he already got a reply
livid cradle
I am good at functional programming could u tell me any project i could work in
lapis sequoia
cedar sun
which is a good lib for IA on python? ive used keras, but i heard pytorch is goo...
Use Keras or TensorFlow. PyTorch is good too, but not my favorite
lapis sequoia
livid cradle
I am good at functional programming could u tell me any project i could work in
Prolog Text Analysis
livid cradle
??
lapis sequoia
livid cradle
??
If you like functional programming, try some text analysis
livid cradle
should i try making a traductor of javascript to python?
lapis sequoia
Oh man functional programming without a Functional Language... Try some LISP or SWI Prolog if you like functional programming
cedar sun
lapis sequoia
Use Keras or TensorFlow. PyTorch is good too, but not my favorite
isnt tensorflow used on keras?
lapis sequoia
cedar sun
isnt tensorflow used on keras?

Intellipaat Blog
In this blog on Keras vs Tensorflow, you will learn about the key differences between Keras and Tensorflow which will provide you a better understanding of what you should learn.
You can use some API`s yes
 bronze barn
Does anyone have any good links to understand how to analyse clusters?
 hoary jungle
Hello, anyone can help me to find a json dataset with 1 million+ entries? I am doing a college job where I have to turn that into a relational model
 ancient venture
instrument_response=np.loadtxt(r'C:/Users/Sidharth/Documents/Computing Labs/Project 1/Distance_Mpc.csv', delimiter=',', skiprows=1, usecols=(2))
print(instrument_response)
if (instrument_response==1):
#my function is here#
Hi guys, I've got a dataset and I've already defined a function
I want to make it so that my function is only applied to the data which corresponds to a "instrument response" = 1
When I run my code, I get this error
ValueError: The truth value of an array with more than one element is ambiguous. Use a.any() or a.all()
any help would be appreciated
 wintry olive
I was just researching fine tuning datasets https://huggingface.co/docs/datasets/
cedar sun
@lapis sequoia look
ah nvm i confused pytorch with tensorflow xd almost the same color
wintry olive
I understand that the $$$ is in the datasets. Not just top level accumulation of a huge library of datasets. Its more about fined tuned custom built curated datasets with smart cache. Still over my head tho
cyan matrix
tried earlier but wanna see if anyone can help here, attempting to extract/clean data set in python for use in R. running into a problem as below
I have a pandas dataframe with approx 200 rows/columns. The rows contain incomplete data, where not every column will be filled (for example the first row has 78 of the 200 possible variables). I have a list of the 78 variables that row 1 has, and I am trying to transpose that list into the pandas dataframe, where each variable is placed into it's respective matching column.
For example:
  Name     Location   Service A  Service B  Service C  Service D
1  Αlpha    Alabama       NaN       NaN       NaN       NaN
2  Beta     Alaska        NaN       NaN       NaN       NaN
3  Gamma    Arizona       NaN       NaN       NaN       NaN
4  Delta    Arkansas      NaN       NaN       NaN       NaN ```


I plan to use a
for
 loop to draw out all the services so that I will eventually have a list that would be something such as ['Service B', 'Service D'].

After the first iteration, I would hope it would look something like this:
```   Name     Location   Service A  Service B  Service C  Service D
1  Αlpha    Alabama       NaN     Service B   NaN       Service D
2  Beta     Alaska        NaN       NaN       NaN       NaN
3  Gamma    Arizona       NaN       NaN       NaN       NaN
4 Delta Arkansas NaN NaN NaN NaN```is there a way to get iloc if i know loc of a row in pandas.DataFrame ?
i guess i can do it with booling --> converting to a list --> indexing
 whole vortex
How do I convert an image from grayscale to colour
It was originally colour then I converted it to grayscale using opencv... Then applied DCT compression then decompression. Now I want to put colour back into it
ripe forge
Uh. You took away information from the image. That information doesn't exist in the image anymore.
You can turn the greyscale image into 3 channel greyscale image, but you'll need the original image or it's information to put the colours back.
heady tide
More reasons to use data table
R benchmarks
Also, fun fact, data table in R is faster than Pandas in python, I did not know that until today
 hollow scarab
so I have an issue when I use df.groupby
I used it on a test file on my pc and it worked
but it just doesnt want to gorup the data up on the work pc
Like I save it to excel at the end, and the top row and first column are index numbers
and the data is a mess, it doesnt group up anything
heady tide
Wrong, Pandas is much faster than R at everything else.
molten hamlet
is there something that I could use to find closest point in 3 dimensions?
not to iteraing over all points?
torpid cave
@heady tide https://datascience.stackexchange.com/questions/24052/is-pandas-now-faster-than-data-table

Data Science Stack Exchange
https://github.com/Rdatatable/data.table/wiki/Benchmarks-%3A-Grouping
The data.table benchmarks hasn't been updated since 2014. I heard somewhere that Pandas is now faster than data.table. Is this...
I love R... but Python is just used everywhere
heady tide
at everything else
torpid cave
Yeah
I will always defend R but Python is good for doing almost everything
I mean, I used webscrape with R, once I started using Python it just changed my mind
And results are mixed. I think once you start using you start implementing dictionaries-tuples-matrix
Instead of working with dataframes
Python wins
heady tide
See the thing is, R is made by statisticians for statisticians
high badge
i have a question about performance measures on classifiers. Are the precision, recall, and f1 scores only for binary classifiers?
heady tide
The thing I don't like about Data Science is that python made it super easy for people to get into the field without much background in mathematics
torpid cave
Don't they take math courses in undergrad/postgrad DS programs?
 tidal violet
whats the most efficient way to extract the adjacent neighbors of an element in a 2d Numpy array?
torpid cave
I understand your concern. I studied DS after finishing engineering and economics degrees with were math focused... my intention was to learn the tools to make my life easier. When I started doing the modules (in DataCamp) I was surprised how they introduced time-series algos without explaining what was going on
tidal violet
wrong channel sorry
heady tide
I am rethinking my choices of majoring in DS
@torpid cave when did you finish university ? Was the field as saturated as it is now back then ?
torpid cave
Australia
I finished my MsC last year
I feel that in Australia there demand is hughe
But for people with business experience
I get at least 1 message from recruiters eveyr week
in likedin
But it depends on the niche you are doing
heady tide
yeah from another side it is inevitable that the amount of data and the use of it will only grow in the following years
torpid cave
Yeah and most companies rely on excel
For 90% of their tasks
Once they start shifting to more structured ways of working the demand will keep on increasing
What people must understand is that DS is more than doing Neural Networks and Computer Vision
heady tide
yeah, heck most of the time the hardest part is preprocessing
torpid cave
yes
I haven't applied a ML algorythm in the past 8 months I think
We are currently implementing the data pipelines to get the data for the algorythms
heady tide
Thats super normal imo
torpid cave
And most firms are in a less developped stage
wintry olive
Id like to custom build highly experimental abstract adaptive neural structures for the hugging face community platform -- which uses an Apache Arrow Table storing format.
The neural structures I have in mind are adaptive monster sized "structures". It's a beast of several preprocessing layers deep so it might require keras API?
the adapt() method could take a tf.data.Dataset object but some of the layers are trainable and will use federated learning and auto update and evolve like a scripted out VM...
wintry olive
so I'm researching data structures and looking into all platforms. I looked into pandas. it's is all database 100% but I really like the ideas of melt() pivot () pivot_table() and the tools to manipulate textual data especially corpus or virtual corpus data or general data of the dataset. technically I'm considering a custom class in which datasets is a part of.
yoo PanelOLS might be what I am looking for.
 whole sage
Hi. Has somebody deployed a keras model using flask?
median dove
Hey, anybody knows if in example #1 he is only keeping or dropping the correlated features? It is not very clear

Medium
Introduction to Feature Selection methods and their implementation in Python
 twin mantle
Could somebody explain me how to plot an aggregated panda series in seaborn?
wintry olive
PanelOLS code is heavy professional. It was nice to see such a high level of math and code mastery expressed in a professional capacity rather then presented as a tutorial or learning experience. Amazing what you can do when you know how to write your own scripts and establish well defined classes. I will focus on Panda for organizing the data and writing scripts and establish well defined classes just to prototype this idea. no sense in creating some hybrid or hack data structure. Although my idea is highly experimental.
twin mantle
Please?
wintry olive
https://medium.com/@emredjan/emulating-r-regression-plots-in-python-43741952c034 and diagnostic plots for residuals https://robert-alvarez.github.io/2018-06-04-diagnostic_plots/
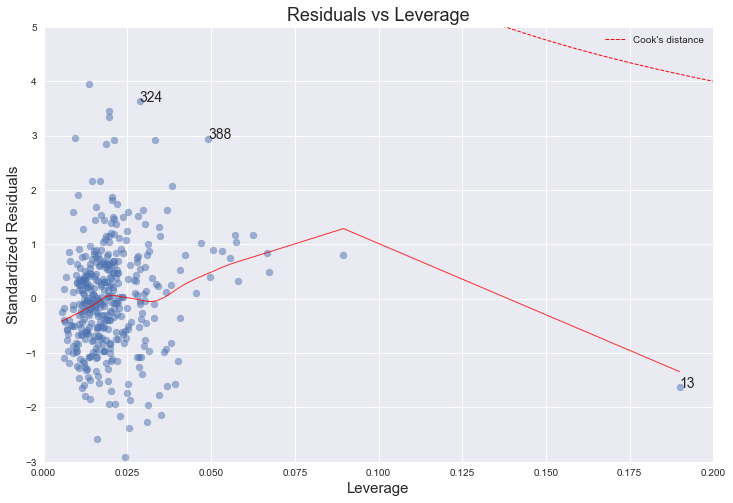

and how to interpret them
idk I saw Panda as a tool for organizing data in datasets and with textual manipulation a tool for optimizing merging or oragami morphing the graph orientation.
torpid cave
@glad mulch might sharing your fitted equation?
midnight trench
I have a quite a stupid question being a intermediate data scientist but, how really does the code work? like what type of understanding does processor make when it's reading bytecode and if it read it how does a processer understand the bytecode? did the processer got coded? how does a machine learn?
 twilit pilot
If I have a .csv file like this... ```
Symbol, Price
AMZN, 3000
AAPL, 318
ABC, 26
AMZN, 4000
AAPL, 278
ABC, 32
And I load the .csv file like this...```py
import pandas as pd

df = pd.read_csv('my_file.csv', delimiter=',')
How do I filter the data to only get the information about the AAPL stock?
Thanks a lot in advance 🙏 And please ping me
torpid cave
Filtering once you have the data:
df_appl = df[df['Symbol'] == 'AAPL']
@twilit pilot
twilit pilot
@torpid cave Thanks a lot 🙏 😁
 azure locust
Hi, Does anyone know how the two tasks i.e, (Masked Language Modelling (MLM) and Next Sentence Prediction (NSP) ) in Google's BERT are being trained?
Whether it is trained 50% for MLM and 50% for NSP or in a cyclic manner or first MLM will get trained and then NSP will get trained?
 lunar bough
bruh
lapis sequoia
midnight trench
I have a quite a stupid question being a intermediate data scientist but, how re...
Oh man, unexpected 🙃
You can learn from some good Textbooks, like Machine Learning with Python - Müller & Guido or use some Websites about Computational intelligence.
For the start please read this and try to study a bit, before you start asking something like this 🙃
https://towardsdatascience.com/how-do-machines-learn-561181ed209a
Medium
Machine Learning Concept Explained for the Non Computer Science People
sand crane
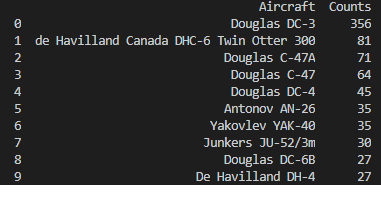
Hi guys, I am looking for some help. I am trying to sort my dataframe by finding the elements that have the most occurrences and then extracting those (I've done this with values_counts()). I also want to get the amount of occurrences for each unique element (I have also done this with values_counts().values). My issue is that I want to have the unique occurrences in one column of my dataframe and their occurrence amount in another column but value_counts() doesn't seem to allow this as it returns the element along with its count. You can see in my dataframe I have the string of the element and the count in the aircraft column (using value_counts()). And in the counts column I have just the count (using value_counts().values). If I use unique() to get each unique occurrence of an element then the order will be wrong where the aircraft won't match the correct count. How can I retain the order of these two?
sand crane
Ok, I solved this myself. The index was the aircraft string and the count of its occurrences was the values. I simply returned index to my aircraft column (value_counts().index) and then returned values to my counts column (value_counts().values). Now I have the occurrences of each unique aircraft (its name and count) in two separate columns
 midnight trench
 stable mortar
one of my teamates wrote this shit
stable mortar
one of my teamates wrote this shit
what's so about it?
whole vortex
How do I convert grayscale image back to colour via opencv
 halcyon vale

Day 17 of #300DaysOfData!
Elastic Net :
Elastic Net is a middle grouped between Ridge Regression and Lasso Regression. The regularization term "r" is ...
 desert oar
@glad mulch slanted residuals like that usually means your data is strictly bounded but your model isn't respecting those bounds
You should consider a different model, maybe transform the target to [0,1] and use logistic regression
tall basin
tall basin
Hey guys, can you help please? I am seeking free courses of data science I'll do...
.
Thanks
 fierce shadow
@whole vortex you can't really convert a gray scale image to a RGB image since, grayscale consists of less information than a RGB image, however there are some neural networks, which are trained to convert a gray scale image into rgb
median dove
Hi guys. In a Linear Regression model, is it a better practice to keep or drop the correlated variables to the target feature?
lapis sequoia
Anyone can point me to good online machine learning resources and tutorials?
I mean OML, not online courses
Trying to learn how to update a pickled trained model with new trained data
but can't find resources anywhere
desert oar
Pickle can't really be modified in place
You have to unpickle, train, and pickle again
stable mortar
midnight trench
what's so about it?
You saw nothing weird about that for loop? Who even passes the i to the function lmao.
 hollow gull
lapis sequoia
Trying to learn how to update a pickled trained model with new trained data
hollow gull
lapis sequoia
Trying to learn how to update a pickled trained model with new trained data
I don't have resources, but some models have a warm start argument that you can pass to continue training.
https://scikit-learn.org/stable/modules/generated/sklearn.ensemble.RandomForestClassifier.html
lapis sequoia
I've got an XGB model I need to train every week
but we're talking millions of data weekly
vs billions if I start from 0 every week
hollow gull
I don't see a warm start argument in xgboost in python, but I thought there was one.
https://xgboost.readthedocs.io/en/latest/python/python_api.html
lapis sequoia
I save the OVR in a pickle
and unpickle it to predict
I saw Online Learning could probably fix the issue of needing to retrain from scratch
hollow gull
Yeah, that part should be fine as long as you can get the model back into memory, it doesn't matter how you do it. Pickle shouldn't be a problem although I think there was some reason our team wasn't using it. They are using mleap instead I believe.
But that doesn't impact the retraining piece.
lapis sequoia
so is there a way to do old_pickled_model + current_week_model?
hollow gull
process_type [default= default]

A type of boosting process to run.
Choices: default, update
default: The normal boosting process which creates new trees.
That sounds potentially useful to me.
https://github.com/dmlc/xgboost/blob/master/doc/parameter.rst

GitHub
Scalable, Portable and Distributed Gradient Boosting (GBDT, GBRT or GBM) Library, for Python, R, Java, Scala, C++ and more. Runs on single machine, Hadoop, Spark, Dask, Flink and DataFlow - dmlc/x...
This claims to have the answer:
https://stackoverflow.com/questions/47000253/python-xgboost-continue-training-on-existing-model
Stack Overflow
Lets say I build an xgboost model:
bst = xgb.train(param0, dtrain1, num_round, evals=[(dtrain, "training")])
Where:
param0 is a set of params to xgb,
dtrain1 is a DMatrix ready to be trained
 earnest herald
What Visual Studio build tools do I need for python in general? I am trying to import Annoy right now
I am using 3.8.5 if that matters
lapis sequoia
earnest herald
What Visual Studio build tools do I need for python in general? I am trying to i...
https://marketplace.visualstudio.com/items?itemName=stevedower.python
You mean this right?

Extension for Azure DevOps - Visual Studio Team Services extension for Python developers.
earnest herald
lapis sequoia
https://marketplace.visualstudio.com/items?itemName=stevedower.python
You mean ...
No
Visual Studio
lapis sequoia
earnest herald
No
Ah okay. Hmh in gerneral i would use VS Code But for Data Science i recommenc Anaconda - Jupyter Notebook
earnest herald
lapis sequoia
Ah okay. Hmh in gerneral i would use VS Code But for Data Science i recommenc An...
This is my error in case you wanna have a look
https://pastebin.com/N1uRJg6y
Pastebin
Pastebin.com is the number one paste tool since 2002. Pastebin is a website where you can store text online for a set period of time.
It legit says I need https://visualstudio.microsoft.com/visual-cpp-build-tools/ but I have no idea what workload to install
Visual Studio
lapis sequoia
earnest herald
It legit says I need https://visualstudio.microsoft.com/visual-cpp-build-tools/ ...
Okay there is a Build Tool Standalone. Google for it. It should solve this problem.
earnest herald
Awesome! Thanks mate
lapis sequoia
And update everything. Normaly this tool say what is wrong, but tick everything
earnest herald
Sweet
earnest herald
lapis sequoia
And update everything. Normaly this tool say what is wrong, but tick everything
Although I could have used the standalone version, I did a bit more reaseach and realized that I needed to install the C++ workload in Visual Studio. This is for anyone who might face this later (:
But I think the standalone version is pretty much the same of what I did
 earnest forge
I have the following dataset, how can I assign values from Location to X and Y respectively, considering that Location is not a tuple, it is just a string.
lapis sequoia
Hey, can anyone help me with this? https://cdn.discordapp.com/attachments/760445352305754142/781594109826826300/unknown.png

@earnest forge How can you publish that information o.o
wintry olive
I'm here researching NLP/NLU for UX and a dream but you guys are using ML models to solve real world problems or to optimize workflows or gain market insight
are you guys comp sci branching out? or already in the field of ops or statistics trying to leverage new tech to gain an edge?
ancient venture
is there a way to end a for loop after x iterations
in my case i need to end a for loop after 25 iterations
it seems like my code is doing the 25 iterations i need, then simply repeating it over and over again
earnest forge
lapis sequoia
<@!518811421434314772> How can you publish that information o.o
what do you mean?
It is open-source csv file that is available for everyone in Kaggle ._.
wintry olive
i suppose there is opportunity to profit from lowering the barriers of entry and reducing the need to do so much coding. Unless you prefer coding? I'd like to help you guys focus on data and datasets. Someone should design UI tools for you guys to build custom workspaces that you can save share and collaborate on as easily as google docs+notebooks.
all your data is pre structured right?
 scarlet cloak
I'm writing a script to parse through a VCF file and create 4 outfiles but I was wondering if I can have the script place those outfiles in a directory of the users choice? I'm just wondering if this is possible? not sure if I need to use the os.mkdir() to do this
wintry olive
probably already have internal IT software tools right? the other issue is data manipulation tho...
bronze barn
Is there a way to print data in a nice table in Jupiter notebooks? I've tried the following settings but to no avail:pd.set_option("display.max_columns", 200)
pd.set_option("display.max_rows",3100)
pd.set_option('display.width', None)
pd.set_option('display.max_colwidth', None)
wintry olive
the workspaces would be user generated black boxes of models, scripts, transforms, physics engines, computer algebraic expressions, and cache. Metaphor here is some workspaces would be like Mandelbrot Zooms the output would be an expression of that. Other workspaces would be like kitchens to cook information. in that you can chop cook melt() pivot() bake() fuse() consume() data in the abstract
@bronze barn can you import panda? the pivot() call or function is what you need I think or melt() panda is where it's at for data manipulation
you can shape tables like oragami with panda
bronze barn
I'm not sure I follow, sorry. I've got the layout of the df I want but because I have many features around 20, it won't print in a table in notebook but several columns at a time which I have to scrolls through. Reading the documentation on those functions it sounds like they're for changing the layout of the df
molten hamlet
bronze barn
I'm not sure I follow, sorry. I've got the layout of the df I want but because I...
have you tried just pd ?
I think it auto captures notprinted 😄
bronze barn
molten hamlet
have you tried just `pd` ?
Silly me 😄 . Sorry to bother you with questions but is it possible to export this table as a PNG or something? Also, is there a way to display categorical data in this table because it only shows numerical features?
molten hamlet
bronze barn
Silly me 😄 . Sorry to bother you with questions but is it possible to export t...
that your dataframe, its possible
ancient venture
for this data set
i want y to take be columns 1-31
i.e. all the columns except "Wavelength"
how can I do this
 austere swift
you can do df1 = df.drop('Wavelength', axis=1) and df1 will be a df with all the columns except wavelength
df will be the same
ancient venture
ah ok
austere swift
if you wanna do slicing like you did with your first one though it would be y = spectral_data[:, 1:]
both will work fine
ancient venture
ohh okay yeah that'd be preferred
tysm
do you know how i could apply a for loop to do this?
so what I would have instead is
like that is originally what i had
(there are 30 columns of observation data in the spreadsheet)
but this for loop seems to produce the results i need, although
instead of results = [a,b,c] i get results = [a,a,a,b,b,b,c,c,c]
what i basically need this to do is do some data analysis for x=column 0 and y=column 1, then for x=column 0 and y=column 2, then for x=0 and y=column 3 etc
lapis sequoia
could somone explain to me transform = transforms.Compose([transforms.ToTensor(), transforms.Normalize((0.5,), (0.5,)),])
wintry olive
@ancient venture I'm not an expert on the subject but import this source if applicable https://bashtage.github.io/linearmodels/doc/_modules/linearmodels/panel/model.html#BetweenOLS.fit I'm thinking you need to set x=0 as constant not three separate unique pointers to the same values? @lapis sequoia not sure will it generate a generic tensor or will it just apply the normalize effect?
 delicate jackal
I was gonna ask if anyone here is good at pandas but its seems like thats the only thing you're all talking about
I have a basic question
This is the head of my dataframe
lapis sequoia
holy moley
delicate jackal
I need to find the lower and upper quartile of Global_Sales but need to do it by Genre
sorry for being a noob
I know there is a dataframe.quantile command but how would I make Global_Sales go by Genre?
I did it!
thanks dude
wintry olive
@delicate jackal hmm that might require a script or a class. not sure which approach would be more efficient. also have to figure out some mechanism to point the command to run in the Genre class? or run the script then invoke the command on the scripts output? idk
wintry olive
I also found this https://www.dcode.fr/numbers-quantile it's a webapp to calculate quantile
Tool to calculate the quantile value from a list of values. The quantiles/percentiles/fractiles of a list of numbers are statistical values that partially illustrates the distribution of numbers in the list.
delicate jackal
for upper quartile
honestly grouping things in pandas has been a nightmare for me xD
thanks mate
wintry olive
np 👍
wintry olive
wait hold up... databases are incredibly useful in this field right? I thought SQL was a type of DB but apparently it's a programming language. Is there an advantage for using a programming language with ML transformer models as a tool rather than data entry and utilization of good old fashion databases?
are you rebelling against the databases?
models and datasets > SQL old fashioned databases
Critics argue that SQL should be replaced with a language that returns strictly to the original foundation: for example, see The Third Manifesto. However, no known proof exists that such uniqueness cannot be added to SQL itself,[45] or at least a variation of SQL. In other words, it's quite possible that SQL can be "fixed" or at least improved in this regard such that the industry may not have to switch to a completely different query language to obtain uniqueness. Debate on this remains open.
a lot to unpack.... I was just about to ask why not add these ML models to old fashioned databases? I even thought about open source collaboration based virtual databases as a tool for my proposed idea for workspaces or a complete UI abstract.... now I have to read some manifesto and figure out what returning to the original foundation is all about.
apparently allowing duplicate rows makes it difficult or tedious to work with in python
that makes more sense then manifesto and original foundation...still have to read that tho
midnight trench
wintry olive
wait hold up... databases are incredibly useful in this field right? I thought S...
SQL Is Language that controles database, SQL stands for Structured Query Language, actually you can even call this database bcz, SQL Stores database as Structured Qurey as told in full form.
wintry olive
hmmm the procedural extension to "unknown" doesn't resolve the issue? plus if Oracle has a hand in SQL than this is a G rebellion?
IF i = NULL THEN SELECT 'Result is True' ELSEIF NOT(i = NULL) THEN SELECT 'Result is False' ELSE SELECT 'Result is Unknown';
I'm switching to laptop...
nah oracle is a version title not some corporate feud. hmm figures this is the one area I never paid much attention to considering I am natural generalist who loves to design user experiences
wait oracle is involved with db
serene scaffold
I need to study for my AI final. But that is work.
wintry olive
4D seems interesting but definitely not open source

Documentation for 4D Developers
The flexibility and power of the 4D programming language make it the ideal tool for all levels of users and developers to accomplish a complete range of information management tasks.
key phrase is: information management tasks.
whoa "With ORDA, data is accessed through an abstraction layer, the datastore. A datastore is an object that provides an interface to the database model and data through objects and classes. For example, a table is mapped to a dataclass object, a field is an attribute of a dataclass, and records are accessed through entities and entity selections."
well they beat me to that
anyone feel like reverse engineering that into python?
 queen crown
hoping someone can help me in this channel about building a sorted list from scratvh
I have an empty list that I want to populate with orders that are ordered based on price and timestamp
right now, i'm dong this
my_list.append(order)
my_list.sort(key=lambda k: (k.price, k.timestamp))```is there a way of doing this?
bisect.insort_right(my_list, (order.price, order.timestamp, order))
 calm nacelle
this is probably a better place to ask this dumb question, https://stackoverflow.com/questions/65031767/how-do-i-easily-convert-a-streaming-array-to-variables
Stack Overflow
I tried to find this answer, and after several hours, still no results. I want to do something very easy, this doesn't have to be this complicated...
So, we have a pyaudio buffer that pulls a chunk...
if anyone can send help i'd appreciate it hahahaha
i swear im not 100% incompetent
calm nacelle
i decided to skip it and just have x be the datastream and y be a cusignal minimum phase
a bit easier hahahaha
calm nacelle
not sure what that is, ill have to read about that
Machine learning package for streaming data in Python
trying to work with this right now
seems neat
wintry olive
yeah i was looking in linear models https://bashtage.github.io/linearmodels/_modules/linearmodels/iv/model.html#IVGMMCUE
yoo multi flow does look neat
calm nacelle
trying to run something custom rn, keeps giving me a none type error
no idea why lmao
 white carbon
Hey guys, I am trying to make a 5d scatter plot given 4 attributes and their associated classes using the iris data set. My current code is
    pred = k_means.predict(input_train)

    x = input_train.iloc[:,0]
    y = input_train.iloc[:,1]
    z = input_train.iloc[:,2]
    a = input_train.iloc[:,3]

    fig = plt.figure()
    ax = fig.add_subplot(111, projection='3d')
    ax.scatter(x, y, z, a, c=pred, cmap=plt.hot())
    plt.show()
Where x,y,z,a are the columns for the data of my attributes. I was wondering if anyone could help me out with this
velvet thorn
white carbon
Hey guys, I am trying to make a 5d scatter plot given 4 attributes and their ass...
so what's the problem?
white carbon
I get this error
Traceback (most recent call last):
  File "...", line 62, in <module>
    prepData()
  File "...", line 58, in prepData
    ax.scatter(x, y, z, a, c=pred, cmap=plt.hot())
  File "...", line 2313, in scatter
    art3d.patch_collection_2d_to_3d(patches, zs=zs, zdir=zdir,
  File "...", line 554, in patch_collection_2d_to_3d
    col.set_3d_properties(zs, zdir)
  File "...", line 481, in set_3d_properties
    self._offsets3d = juggle_axes(xs, ys, np.atleast_1d(zs), zdir)
  File "...", line 763, in juggle_axes
    if zdir == 'x':
  File "...", line 1329, in __nonzero__
    raise ValueError(
ValueError: The truth value of a Series is ambiguous. Use a.empty, a.bool(), a.item(), a.any() or a.all().
what do you expect the result to look like?
when you say "5d scatter plot"
white carbon
Well what I am looking for is, the x,y, and z axis are 3 of the 4 attributes, the colour of the plotted data is their class, and the size of the plotted data is their fourth attribute. I am unsure if this is "5d", but since it had 5 aspects to it I just assumed. I am extremely new to coding so I have no clue as to what I am doing wrong 😦
velvet thorn
white carbon
Well what I am looking for is, the x,y, and z axis are 3 of the 4 attributes, th...
huh.
hm.
try ax.scatter(x, y, z, s=a, c=pred)?
white carbon
For reference to what I am doing is using the iris data set for machine learning. The code you sent does make a scatter plot thank you! I was also wondering however, since I renamed the classes to 1,2 and 3, the colours that appear are purple, a very light yellow, and I cant see the other one. Is there a way to fix this or do I just ahve to change the numbers of the classes to something else?
velvet thorn
white carbon
For reference to what I am doing is using the iris data set for machine learning...
that would be due to your colour map (cmap)
adjust it accordingly
it's not related to the class names
white carbon
Oh that makes sense thank you! For the size of the points, I noticed that they all look the same, probably because the values of them are quite similar, from the visualization given to me by python. Is there a way to zoom in to take a better picture of this, I am trying the magnifying glass but it does not seem to work.
 rapid raft
I want to make a quiz website that will take its questions and choices from a pdf /image. I have tried things like pytessaract but it doesnt detect math equations and stuff like this. So i was thinking of making something that just cuts the questions and choices into short images of their own then i will use them . But i dont have knowledge how i will be able to do
that. Can anyone tell me what i need to do/learn to make it happen
 north sand
Hi everyone!!
Im actually into datascience and I discovered SuperDataScience (that has a udemy course of Machine Learning A-Z) and I am having a hard time deciding if I will buy their discounted subscription.
is anyone here tried their services?
 agile wing
Yeah i bought three courses of udemy ever since their black friday sale happened.
I think its worth it...from the bLack friday sales going on.
 analog apex
How to use textract with django?
livid quartz
Does numpy have a function that normalises column vectors to length 1 ?
velvet thorn
livid quartz
Does numpy have a function that normalises column vectors to length 1 ?
length 1...?
that's not normalisation, if I understand you correctly
livid quartz
Ah sorry, In this case I am talking about Linear Algebra
velvet thorn
livid quartz
Ah sorry, In this case I am talking about Linear Algebra
so what do you want to do exactly
livid quartz
Normalise A matrix of column vectors so that their length is 1. I've done it manually by dividing each column vector by the square root of their dot product, but I was just wondering if NumPy had a quicker way to do it
velvet thorn
livid quartz
Normalise A matrix of column vectors so that their length is 1. I've done it man...
when you say "length"
do you mean in the sense of some sort of norm e.g. Euclidean distance?
velvet thorn
divide by np.linalg.norm
I would suggest
you refrain from saying "length"
it's quite misleading
livid quartz
Ah right ok, It was just the way I have been taught linear algebra
velvet thorn
"length" is one interpretation of the norm, yes
but the more general term is "unit norm"
rather than "length 1"
(Euclidean norm is implied, but of course other norms exist)
(and in this case you are specifically using the Euclidean norm)
livid quartz
Perfect, I will keep that in mind
 barren meadow
 frail arch
Can someone tell me difference between macro and min average in precision score in sklearn?
 hasty grail
 oblique vine
nope
I kinda want the lowest of surrounding pixels
not median
I mean
lowest if neighbours are zero or sth like that
 terse dove
hi
i have a question
if i have 2 columns of data, one is categorical and the other is numerical. there are some missing values in the columns
what is the code that replaces the missing values with the most frequent value in the column ( both for the categorical variable and the numerical)
i don't know if it helps, but the categorical column has values like 1, 0, 4, 5 .. (not a, b, c)
 trim oar
check out the documentation for fillna()
You can fill missing values however you want with that method
===
But to be honest, depending on how many missing values you have and the distribution, you are introducing bias. Inputing with mode could drastically change your analysis
https://jamesrledoux.com/code/imputation#:~:text=Imputation Method 1%3A Most Common,given in Pandas'%20value_counts%20function.
James LeDoux's Blog
In the sense of?
terse dove
sry for the late reply
i was eatting
basically, we were given 2 datasets (training and test), both have missing values. we are allowed to get rid of data that have missing values in the training dataset, but we are not allowed to do that in the test dataset, so i thought i would use the most frequent in a column to fill in the missing values both in the training and the test data
trim oar
You don't do anything to the test data because that's the whole point of having a test set
Uh gonna reply more but in a middle of something
terse dove
ok sure, i think i need a long discussion regarding that topic
just to make sure, we will build our model based on the training data, then use it on the test data to predict the classes of its instances
trim oar
I'm guessing this is for a course? Step one would always be checking how much data is missing and why they are missing, so (stock.isna().sum() / stock.shape[0])*100 gives you an idea of the missing values %. If it's too much, might as well drop. If it's substantial, it's better to note the assumption when introducing the bias. You'd also want to check for missing value types and distribution in each feature, this tutorial gives a simple explanation about missing value types and for mean/mode/median https://towardsdatascience.com/all-about-missing-data-handling-b94b8b5d2184

Medium
Missing data is a every day problem that a data professional need to deal with. Though there are many articles, blogs, videos already…
If you have a skewed distribution, for example, imputing mode would make that even more skewed
terse dove
ok cool thanks, i will check it. another question. I have a column that have numerical values such as 1, 2, 3, .. and so on. it is required that we trait that column as categorical
how to do that?
do i convert the numbers into, let's say, a, b, c, d, ..?
trim oar
I'm not sure why would you do that. What was the exact wording? Because that makes it had to compute, unless you're performing a decisiontreeclassifier?
Even then..
terse dove
we have to use multiple classifiers and decide on the best one based on the balanced error rate for each classifier
i mean, should i leave the column as it is and run my training?
i don't know the process to be honest, but is there supposed to be a way to specify that these columns are categorical?
trim oar
Oh I see. You can col = col.astype() to change the datatype to object rather than integer
To change the datatype
 main badger
I am new to neural networks (and AI/ML for that matter) and I am trying to wrap my head around the Dense layers in Keras. So I have a question.. Does adding multiple Dense layers with same arguments make any difference, is there a point in doing that? I do not understand how having two dense layers with activation='relu' for example make a difference.
 sturdy dune
Machine Learning isn't only about writing few lines of code and getting the output printed. Understanding the concepts of every algorithm plays the important role. Here is the blog where I explained concept behind K-Nearest Neighbours Algorithm in a simplest way.
Hope it helps you!!! Let me know your feedback.
https://datamahadev.com/machine-learning-algorithms-k-nearest-neighbours-detailed-explanation/

KNN is one of the basic supervised learning algorithm used for classification. By the end of this article, you will easily start applying KNN on various datasets.
whole vortex
Does anyone here know the process of Discrete Cosine Transform on an image?
Struggling to understand how DCT2 works. The part when the 8x8 block from the image has been selected then "calculate the contribution of each block in the image, that when added together, will create this image exactly."
 delicate wedge
ERROR 1064 (42000): You have an error in your SQL syntax; check the manual that corresponds to your MySQL server version for the right syntax to use near ''localhost' IDENTIFIED BY 'password' at line 1``` I changed my password to the word `password` but what am I doing wrong?whoa this channel has a lot of activity 👍 I'm reading thru it to get caught up and on the same level...
whole vortex
lol
wintry olive
mmm 🤔 Ian yu knows what's up.
 flint canopy
hi i just heart that here can ask python module pandas thing and excel thing here . is it okay to ask here
 frosty flare
hey guys , does anyone here uses openCV library on Pycharm mac os ?? 
wintry olive
I was interested in Panda because of its tools for data manipulation specifically melt() and pivot() but that's more of a convenience quality of life tool to help get the job done so to speak...
flint canopy
wintry olive
I was interested in Panda because of its tools for data manipulation specificall...
do u mind to look at my code and have a check
wintry olive
sure what you got?
flint canopy
idk what's problem with this code , i want to update the status but it will come out warning from module
lapis sequoia
Show the warning
flint canopy
lapis sequoia
Show the warning
this is the warning it will not clash my program , after that it will continue my program
lapis sequoia
flint canopy
this is the warning it will not clash my program , after that it will continue m...
Stack Overflow
I'm new to pandas, and, given a data frame, I was trying to drop some columns that don't accomplish an specific requirement. Researching how to do it, I got to this structure:
df = df.loc[df['
flint canopy
hmm i refered it before , but idk Y i doesn't update my excel
wintry olive
it's not a tool for updating Excel. It's a tracking number to see it is your Excel or not. It's a built in back propagation warning system that is flawed? A lot of the warnings are false positives and can be completely turned off according to jezrael.
my Excel or not my Excel?
frosty flare
hey , i have a problem accessing my mac's camera using opencv on pycharm ... can anyone help?
wintry olive
I was wondering why there is a need to make a warning for that tho. It makes sense to try to back propagate if possible. redundant data is an issue however I see it in terms of signal to noise not original and copy. Also signal to noise is relative to the observer
then you think in terms of interference not all interference is negative sometimes it can be resonate and positive other times a neutral cancellation
haven't used pycharm it looks like a very popular python editor console especially for data science too with SQL built in
datasets like https://github.com/huggingface/datasets

GitHub
🤗 Fast, efficient, open-access datasets and evaluation metrics in PyTorch, TensorFlow, NumPy and Pandas - huggingface/datasets
they are almost like virtual corpora carefully curated and stored in an open library
that is hard tedious work too and unless you feel like going to the source and sorting thru haystacks looking for needles to add I suggest we help them out if we can. Google corpus a lot of them are free with limited use some are not free but most of them let you easily make virtual corpora on there webapps using queries and linguistics and semantic filters and collectors
and that's just the data not even the datasets. the datasets have additional meta data and are really powerful tools for ML in the right hands. The data is like a bolt... the data set is the socket which actually fits allowing you to tighten the data into a ML framework model process. There is more tools in the set but you don't want to over fit or introduce bias for the sake of convenience.
my idea is built on that same foundation. but from there it will be all about creative diverse expression. broad spectrum artistic not laser focused realistic and very much a product of a stack of meta objects emerging from a highly complex 'complex plane'
wintry olive
sorry for thinking out load again. more questions or posts about data science from actual data scientists would be greatly appreciated ☺️
bruh that was supposed to be a 😃
anyone working on computer vision data and models? I've been focusing on NLP
velvet thorn
it's not a tool for updating Excel. It's a tracking number to see it is your Excel or not. It's a built in back propagation warning system that is flawed? A lot of the warnings are false positives and can be completely turned off according to jezrael.
@wintry olive it’s also about coding style
if you write code in a more FP way it generally doesn’t happen
I was wondering why there is a need to make a warning for that tho. It makes sense to try to back propagate if possible. redundant data is an issue however I see it in terms of signal to noise not original and copy. Also signal to noise is relative to the observer
@wintry olive because you can’t tel reliably whether you’re modifying the original or not
wintry olive
I gotcha yeah it makes sense to me. the answer was given by @lapis sequoia however I'm thinking the user who asked the question was having difficulties understanding due to auto translate of formal language? I noticed some Asian script text in his code somewhere.
good as an FYI but not ideal as a useful means for determining true original vs copy of data frame
velvet thorn
I am new to neural networks (and AI/ML for that matter) and I am trying to wrap my head around the Dense layers in Keras. So I have a question.. Does adding multiple Dense layers with same arguments make any difference, is there a point in doing that? I do not understand how having two dense layers with activation='relu' for example make a difference.
@main badger yes, it does. the output of the previous dense layer goes into the next
wintry olive
or data frame slice might be to incomplete to determine orgin
velvet thorn
good as an FYI but not ideal as a useful means for determining true original vs copy of data frame
@wintry olive yeah, it’s a Python limitation
wintry olive
also one is Google cash driven the other Facebook cash driven. Which is great for open source software developers. However I share this because Google auto generated that bit from an inference. it emerged quute glitch fully in my search results. beat feature I suppose because I was definitely looking for the comparison.
idk why it superimposed thumbnail graph images over the text tho
I use google search way too much
I know what it was I used hey google to take screenshot so google assistant must have permission to write over chrome app
any computer vision peeps want to run this thru their models?
https://c.tenor.com/8GyjIYDJGXsAAAAM/mandelbrot-zoom-fractal.gif

compare stream processing vs batch image and look for holomorphic functions
wintry olive
i keep stumbling into this this graph holomorphic/meromorphic or something. apparently those spikes have something to do with primes idk take the batch photos at the prime-spikes? or use them to modulate recursive iteration as if to encode/dedcode data on the infinite fractal expression? 8 layers? or 8 colors? or something? i haven't really looked into computer vision modelling as much as I have NLP tho

“In character, in manner, in style, in all things, the supreme excellence is simplicity.” – Henry Wadsworth Longfellow This Chapter, and the two that follow it, may seem at …
seems relevant
lapis sequoia
guys, how can i install opencv for python with gpu support? (same for tensowflow)
 thorny owl
Can anyone help me with a numpy question really quick?
velvet thorn
thorny owl
Can anyone help me with a numpy question really quick?
just ask
 vital linden
lapis sequoia
cant i use it if my gpu is amd?
vital linden
lapis sequoia
cant i use it if my gpu is amd?
tensorflow with AMD GPU is hard and unstable in my personal experience. There's a rocm-tensorflow fork that only works on linux. I spent a lof time to get it to work but unstable and often freezes while training - I can only get it work with certain batch sizes.
main badger
velvet thorn
> I am new to neural networks (and AI/ML for that matter) and I am trying to wra...
Thank you for responding. How would having repeated layers help? If I have two dense layers with default parameters, would it improve the accuracy? Or just slow things down?
 proper quail
Ready to develop your next AI-enabled application? ACM-VIT is proud to present The Neural Hack to cap off the year 2020. Whether you're well-versed in Machine Learning or a newcomer to the space, we invite developers from all backgrounds to solve real-world problems with innovative AI solutions. Mark your calendars for 4th & 5th December for a thrilling 36-hour hack!
An AI based hackathon to promote women in technology.
Anyone can participate in this hackathon but the team should consist of atleast 50 percent women.
For more information visit: https://theneuralhack.devpost.com/

The Neural Hack
Welcome to The Neural Hack - An AI based Hackathon for Women in Tech!
Thought it would be helpful in this channel so shared it🙃
velvet thorn
main badger
Thank you for responding. How would having repeated layers help? If I have two d...
it...depends?
more layers generally means higher complexity
main badger
velvet thorn
it...depends?
Hmm.. in the scenario I am studying, it doesn't seem to be increasing the accuracy.
I realise I am not too clear on what the dense layer is basically doing. I need to go back and reread
velvet thorn
main badger
I realise I am not too clear on what the dense layer is basically doing. I need ...
a dense layer
main badger
I understand why the relu activation or the sigmoid activation is doing, but with default parameters.. not clear.
velvet thorn
is basically a lot of parallel linear regressions
with an optional activation layer that provides nonlinearity
main badger
Ahhh.. this helps!
lapis sequoia
main badger
Ahhh.. this helps!
It depends on the task. Do you need time delayed information, NN are just crap. You need some RNN for short term or LSTM for Long-short term questions. If you use a NN you only need one or two layers with many neurons. If you have a higher task (such as NLP or handwriting recognition or something like movie processing) you need Deep Leraning with many Layers and a few neurons. You need to understand the differenc between NN and Deep learning RNN´s/CNN´s.
NN´s are not so powerful and i don´t use it anymore. Cause LSTM is more powerful (but leran NN first)
velvet thorn
lapis sequoia
It depends on the task. Do you need time delayed information, NN are just crap. ...
strictly speaking, "neural network" covers all of them.
in other words, CNNs and RNNs are types of NN.
but yes, just fully connected layers won't get you anywhere
lapis sequoia
Yeah sure. But better performance
velvet thorn
the point is that it's not really correct to say "NN means only fully connected layers"
lapis sequoia
Can anyone point me to data science related to game theory, or know any game theory / data science communities or discords?
lapis sequoia
vital linden
tensorflow with AMD GPU is hard and unstable in my personal experience. There's ...
and any other way to use amd gpu on machine learning?
 loud veldt
Hi everyone. For those who also use R programmers, can someone recommend a book for Python that is like Hadley's R for Data Science?
fierce shadow
@lapis sequoia https://medium.com/swlh/how-to-use-amd-gpus-for-machine-learning-on-windows-96ace916e97

I think this something you looking for
lapis sequoia
lapis sequoia
and any other way to use amd gpu on machine learning?
Theano dude.
Best GPU/CPU Python lib
fierce shadow
for amd gpus?
fierce shadow
although I believe Nvidia is still the best option as it provides with CUDA api
lapis sequoia
Try it. But you have the best support with theano
It calculates with your hardware the best way of solving a problem with minimal time
lapis sequoia
fierce shadow
<@456226577798135808> https://medium.com/swlh/how-to-use-amd-gpus-for-machine-le...
okey seems good so far. But i have never used enviroments... xD i install packages with pip and import them when needed on pycharm
Theanos 🙃
Please choose a default device:

   1 : llvm_cpu.0
2 : opencl_amd_ellesmere.0```i guess i need to select 2?
trim oar
Environments are good for two reasons. When you use time series or deeplearning packages, or other complex packages, there are times where you could mess up the underlying structure, and you don't wanna mess up your root/base.
Then of course, when you share your project, you'd want the other party to be able to replicate the results. Or vice versa, replicate their results. Hence sharing the environment with the exact packages
Probably there are some other reasons, but these two are the biggest for me
main badger
lapis sequoia
It depends on the task. Do you need time delayed information, NN are just crap. ...
I am new to all these and do not understand most of the terms you have used. I will note these down and look them up. And as you also suggested, I need to learn and have a sold understanding of the fundamentals first, it is all very surface level as of now. Could you please suggest some good resources for learning for beginners? Thank you very much.
 elfin bear
I have a script that extracts some metadata from a file/directory of files and I try to find a good way to print it both to terminal (less data) and to file (all data). Anyone got any good idea what would be the best way?
 molten ridge
I want to encrypt Some data and Store in SQlite but I cant
when i encrypt the Data with cryptography.fernet
 past kiln




 vague portal
Useful resources for software development/architecture of ETL pipelines?
wintry olive
i got something for you @vague portal https://optool.co/

check it out and let me know what you think
not specific to transforming adapting data from source archival or warehoused data to cloud workstation containers and then back update (that would be sweet tho) but you might be able to hack it?
used as a cheap work around? idk
well that statement had a lot of noise in it. meant to say "not specific to sourcing data from warehouse state to a workstation to work transform or adapt it in a manner that back propagates (if reasonable or desireble)
 tropic nest
Hey all, I've got some code where I was using numpy.trapz to integrate some data and I'm trying to use numpy.integrate.simps for simpsons quadratic method instead, it keeps giving me a 'ValueError: operands could not be broadcast together with shapes (19,) (9,) ' however, when I check .shape of both 'y_speed' and 'x_interval' arrays it returns '(19,)'.
I'm calling
'''Python
code
distance = integrate.simps(y_speed, x=None, dx=x_interval, even = 'avg')'''
The full traceback:
''' File "C:\Users\ckowalski\AppData\Local\Programs\Python\Python38-32\lib\site-packages\scipy\integrate_quadrature.py", line 499, in simps
result = _basic_simps(y, 0, N-2, x, dx, axis)
File "C:\Users\ckowalski\AppData\Local\Programs\Python\Python38-32\lib\site-packages\scipy\integrate_quadrature.py", line 360, in _basic_simps
result = np.sum(dx/3.0 * (y[slice0]+4*y[slice1]+y[slice2]),
ValueError: operands could not be broadcast together with shapes (19,) (9,) '''
Damn I just looked up code tags I'm still using the wrong tags.
As near as I can tell I'm giving it what the docs say it requires-- two equal-length arrays...
wintry olive
hmmm idk.... seems like a reasonable place to start troubleshooting. aside from that what would the purpose of having equal shapes vs unequal shapes in your scenario? just a visualization preference?
tropic nest
Well the simpsons method requires an even number of intervals. Otherwise the function falls back to trapz for one of the intervals.
So that's just a matter of cpu usage and precision
wintry olive
ahh
oh yeah i see it now [distance = integrate.simps(y_speed, x=None, dx=x_interval, even = 'avg')]
tropic nest
yeah my bad, I googled codetags for this discord but I guess they've changed since the post I read
wintry olive
nah your good. im learning and you know more than i do 🙂
tropic nest
Hah maybe IDK 🙂
Think I found my mistake, apparently I need one dx per INTERVAL of y. So if I want to pass it a bunch of x,y series I'll need to convert each x,y pair into a x,[last_y, new_y] pair and then make arrays of those... yikes.
That seems so weird. I'll have to make a generator to pass it the same values twice to integrate x,y data...
tropic nest
Okay I guess I should have just pressed on. Already I've found out why. For numpy.trapz, I would pass the x,y series as trapz(y=y_speed, x=none, dx=x_interval) but for scipy.integrate.simps of the same arrays, it has to be simps(y=y_speed, x=x_interval)
wintry olive
ahh
tropic nest
I guess I expected scipy to use the same syntax there
The function is for data read via MODBUS serial i/o from a BAC8000, a 56-kilowatt motor controller. I'm developing a display/controller for other ebike hotrodders 🙂
wintry olive
niice
terse dove
guys I have a quick question. if I have about 5% of the data is missing from a column, do I replace the missing with the most frequent or the mean?
tropic nest
is it time series?
terse dove
no
tropic nest
then that's sort of hard to answer without knowing what you want to do. Why do you need to replace them?
terse dove
10000 data, 500 missing
tropic nest
replacing with means would not affect the mean, whilst the median could actually shift the distribution and affect normality, etc
terse dove
i want to replace the categorical variables with the most common
tropic nest
well you'll have to do most frequent then, right? you can average categorical variables, e.g. 'control', 'treatment_x', etc?
can't*
tropic nest
I absolutely don't want this to sound mean, but... how can you not know a categorical variable?
I would delete the row
terse dove
it is a project
tropic nest
shouldn't categorical variables of your samples all be defined before you even get any data?
terse dove
i know nothing about the data
just a machine learning class
get data, get classifier, train and build a model. here is the test data and do the prediction
and u can
and u can't delete rows in the test data
that was what we were told
tropic nest
Hmm I know nothing about machine learning. I'm a researcher by trade.
Are you trying to train the model from data/classifier then assign classifier based on data?
tropic nest
Okay so then shouldn't you assign classifiers not based on the most frequent classifier, but by the classifiers most frequently associated with data of that value?
Or near that value?
I couldn't tell you how to implement that, but just picking the most frequent classifiers in all the data is probably not what your professor is looking for.
terse dove
well, he is not telling us exactly what he is looking for. basically 20 variables, 3 variables have some missing data (5%)
so i don't know
5% doesn't seem that much of bias or what not
i don't know
i just want to get rid of this shitty project and sleep
tropic nest
lollll
terse dove
i am tired of this semster
my back hurts
my mind is telling me to escape the shit out of here
but i have to endure just few days
and i will be free
still i need to find a job, but at least i am not going to be stressed from shitty deadlines for a while
tropic nest
Relatable, I worked all through this holiday. But don't take the shortcut-- I would bet big money that not doing ML and taking the most common values is not what you're supposed to do.
terse dove
so what should i do for the test data that we are not allowed to delete the rows that has missing data in it
tropic nest
You need to use ML-- for each value missing a classifier, find other values nearest that value that have classifiers, and look at the frequency of classifiers for those values. Pick the most frequent classifier
terse dove
u know that i need to build a classifier, a classifier was not given to me
tropic nest
Right. So to build a classifier from the values, take each value missing a classifier... find other values nearest that value that DO have a classifier, they may be mixed... pick the most common one, and assign that.
tropic nest
Yeah. Probably the ideal way to do it, is to write a loop that for every missing point, calculates an error term (point_without_classifier - point_with_classifier) and then if the error term is below a certain constant that you set by testing the output, check the classifier with if: statements and increment counters to get the frequency of each classifier. Then, pick the classifier with the highest frequency and assign that to the point with the missing classifier
So for every single point with missing categoricals, you'll be iterating over the WHOLE dataset with categoricals
But only using some of that dataset with categoricals
terse dove
i am sorry but i will be honest with u, I don't want to get any more headache with this project as i literally have a final exam on 30th of november, i would rather get less marks in the project than getting more and more headaches from it. I need to study for the final, otherwise it is ... well u know the drill.
it is just that i made a promise with myself that i will python more on my own after i finish this semester, no deadline stresses
tropic nest
Good luck!
terse dove
thanks. i am really hating sitting down and staring blankly at my screen 😄
vague portal
wintry olive
i got something for you <@!153175734221799424> https://optool.co/
Hmm I'm looking for a resource that can teach me how to make my own pipeline from scratch. Right now, I have some data cleaning functions. I want to wrap these into classes so I can add each class into a pipeline. Using classes let's me be flexible in choosing which classes I want to be added into my pipeline
Each class will clean and change my dataframe
wintry olive
I like the sound of that especially regarding the focus on class objects. Try to focus on scripts too while your at it. I can show you an example of code written by an author with mastery of code and concept when I get back to my 💻or google PanelOLS and look at the source code. you will need to code at that level for sure. Keep at it and don't give up or try to go at it from a different angle start on json and get into Apache projects like druid or meta model if you want to engineer at a comp sci level
 obtuse skiff
Hello, can someone pls explain something to me. I have a basic CNN, similar to lenet5 architecture and Im testing various loss functions.
Why is it when I have softmax at the end of the architecture it converges MUCH faster when using MSELoss and slow for CrossEntropyLoss. but when I remove the final Softmax in the architecture. MSELoss doesnt converge and CrossEntropyLoss converges really fast?
Same with L1 Loss that performs much better without softmax.
trim oar
5% is a lot of bias you're introducing
Although it depends on the subject matter obviously, anything above 3-4% is already much. If I could drop it, I'd drop it. Otherwise, usually .median() is better than .mean() or .mode() for not messing around with the distribution much.
trim oar
terse dove
well, he is not telling us exactly what he is looking for. basically 20 variable...
But did you mean 5% as combined or each have 5%?
wintry olive
have a learning platform to share. this one looks gamified too. https://leetcode.com/ theres also a job placement service that may or may not work but the learning side with the gamified experience added to it looks top notch

Level up your coding skills and quickly land a job. This is the best place to expand your knowledge and get prepared for your next interview.
lapis sequoia
guys, could u help me building a cnn for image classification (like 100 classes) with one of this: not too much training data or not too much validation data
cuz sadly i havent found too much images from my data set
wintry olive
i haven't looked into computer vision as much as I have NLP. there was one model that caught my eye considering it was similar to what i was researching at the time. I haven't been able to relocate it or check back in with its progress tho. essentially they were using transform models tokenizers masks auto suggest like functions on images. somehow they were able to take raster scan lines of pixels as if sequences of "pixel words" and run that through custom made transformer model.
"pixel word" should be the keyword to find it easily with a search query
 silent current
anybody able to help me with Pandas stuff in #help-apple ?
 tender bison
anyone know anything about audio visualization?
I need to take an audio file, cut into N chunks and return a timeline based on the intensity of the given chunk
the timeline size is fixed so I need to be able to get chunks of arbitrary size, the idea I"m working on atm is something like chunk = (len(audio) / len(timeline) )
chunk_instensity = chunk.total() / len(chunk)
then I draw the timeline out by the intensity
google is not being friendly to me atm
nvm found a visualization program that suits my needs
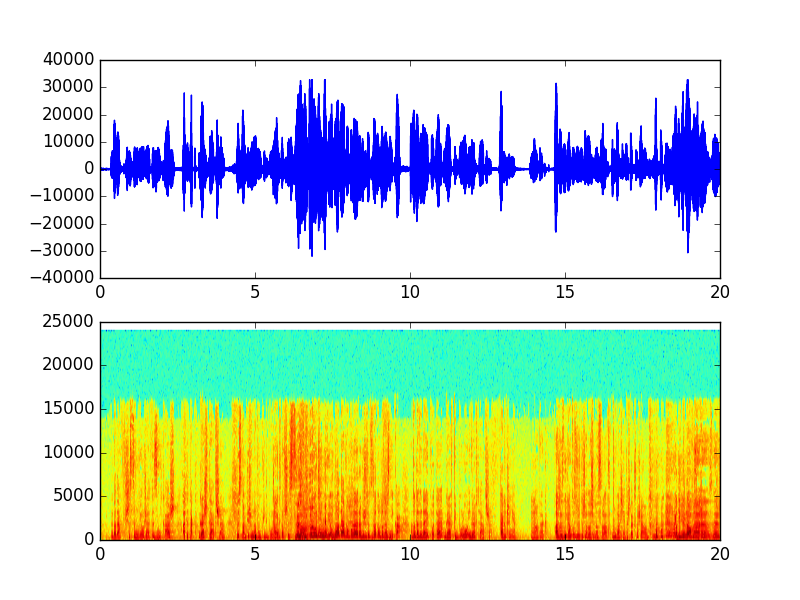
(.)(.) dev thoughts …
To be quick - for recent idea I need to segment audio file, perfectly after one speaker finish his sentence and second speaker start talking. Also I need to detect number of unique speakers in audio.
in case anyone else wants to know
 gray sedge
Hi everyone
Can someone tell me what I need to do on this Y axis? (pandas & matplotlib)
gray sedge
I'm following this much now 🙂 Just need to work one more bug out
Those value's that are showing up as '-' are actually '-' in the page it's being pulled from, so they're not showing as NaN
But, I need to convert that to a number for this to work
Which it doesn't like, showing "could not convert string to float"
the second df.replace isn't doing anything :\
Here's the whole thing, actually
& output
gray sedge
Oo nevermind, I had to go to the webpage, inspect, copy the character, and insert it. Apparently the key wasn't good enough for it.
lapis sequoia
terse dove
@trim oar each variable has 5% missing. (3 variables have missing data out of 20)
trim oar
terse dove
<@!680795279758327819> each variable has 5% missing. (3 variables have missing d...
It’s your call and you probably imputed data already. Just the number isn’t small.