#data-science-and-ml
1 messages · Page 270 of 1
 austere swift
 velvet thorn
hm.
so you want to drop columns
with more than 10% nulls?
I suggest
you reread the documentation
in particular, what thresh does
velvet thorn
(it would be good to let them figure it out)
austere swift
okay lol
 rustic apex
Can I create a snippet for a jupyterlab file?
velvet thorn
did you read the docs?
yup
hm
I wouldn't characterise it in that way
but it's important to know how to solve your own problems
part of that generally involves being sure you know what a function does in a specific situation
and documentation helps for that
 bold ledge
This code lets me iterate through the labesl and check if v is == sarcasm, but how do i get to update v?
for v in df['label']:
    if v == 'SARCASM':
        v = 1
    else:
v = 0```you can do an enumerate() on it to get the index of the v you're currently on
then update it based on the index
 robust granite
How do i get started in this field? I have prior knowledge of DBs, Java ,Python Web dev. But i want to enter this field.Anyone with suggestions?
Where should i begin
 torpid cave
@robust granite this field is quite wide
It depends on what you will be doing, or what you want to do.
robust granite
TBH dont care how wide it is or how difficult
torpid cave
It is not about it being difficult
It is about not being able to know everything
It is like CS.. you can be a developper, do cyber security
specialize un data bases
robust granite
Yes i know I am a cs graduate
torpid cave
So try to see where in DS you want to be
torpid cave
You could quickly fit into doing Data engineering
 patent prairie
So you got a CS degree?
torpid cave
As you have the technical skills
And build the data oriented skills meanwhile
This is mostly statistics though
At least for my field, if you do NN is something entirely different
robust granite
noted
torpid cave
So the field is quite big. Try to see where you will fit or where you want to go
And you have the upperhand as most DS/bootcamps don't teach the valuable CS skills
robust granite
start from linear algebra? stats prob?
torpid cave
Yeah that sounds about right
Probably focus a bit on stats
I have used little linear algebra as I am not developping new algos, but I have to understand what technique I used for the dat
*data
robust granite
IK what id be dealing with. I just needed a starting point
torpid cave
Well then you could just go through books and implement algos
I used this personally:
http://faculty.marshall.usc.edu/gareth-james/ISL/
It is for R, because I started with R
robust granite
Ok. IK the courser wont teach you much as googling does but if you have suggestion that will be great
 shell berry
can you use tf-idf along an embedding layer in pytorch?
or do you need a word index dictionary or something
torpid cave
But most of the techniques used are there
robust granite
torpid cave
It is for R, because I started with R
I have started with python
torpid cave
Python and R give the same output, Python is easier to implement pipelines with and most people in my org use it so I had to change
I use that book with Python btw
The theory behind is what matters
And it is like a bible to me
I just google the modules in Python
torpid cave
nww
I come from Economics and I am had to learn programming while on the job
So I tell you, you have the upperhand
robust granite
Oh. I want to learn Economics and i am cs graduate
torpid cave
In the job it is all regressions and ts analysis
I don't use fancy methods at all, unless I have some time and data
The hardest part for me was aligning with the CS side
robust granite
Yes. All the course directly jumps on topic WO teaching the basic math behind it.
So I was confused where to begin
torpid cave
I am a big fan of not doing courses
I knew I had to do economic analysis. So I focused on data manipulation/cleaning, and time-series analysis
So I just got the books, got real projects, and went with it
Try getting hold with real datasets as well
I mean, kaggle and online courses are cool... but in reality, datasets are dirty and require cleaning and manipulation
If you can create means to construct these datasets that is a plus.. e.g. scraping
Well at least that is my experience, I am sure there are other people in this group who had a different approach to DS
shell berry
Anyone have experience implementing RNNs in pytorch?
 heady hatch
Hey all, what does it mean to you guys when someone says to evaluate the dataset?
torpid cave
@heady hatch depends
For me sometimes is seeing the data quality
How much data there is, if there are NAs, errors, if it is complete, if I have everything to do the analysis
And getting some descriptive statistics to check if it is robuts
*robust
heady hatch
Hey thanks @torpid cave , was wondering if I'm missing anything.
How would you get descriptive statistics on enormous datasets where data is read in batches?
torpid cave
That one is a bit tricky
I don't dealt with web analytics too much so I am not sure on how to respond to this
Maybe I would get all the data in a VM with enough processing power and do the analysis there
It depends on the data though
For averages I think you can just them up... E(x) + E(y) + E(x + y)
SD I would be more careful
Like do the in a rolling basis
Then get MAX-MINs and augment them
heady hatch
HmM! That's really good to know and keep in my pocket. Thanks for that.
Ideally, I want to do it for this dataset but at the same time there are 136 features so probably won't.
torpid cave
well 136 is quite a lot
heady hatch
To give you some context, I'm working on learning to rank algorithms. And I'm doing it on I think Bing's search data.
This is my first time working with these kinds of problem, so it'll be interesting.
torpid cave
Looks like an intersting project
I have never approached web analytics, and I think it is a complete field by its own
heady hatch
I feel that.
I wanted to follow up from something you worked on a while back.
You wanted to translate R code into Python. Were you able to finish the whole thing?
torpid cave
Yeah it was quite an easy task
I just need to get more into using Pandas
And stop complaining that Python syntax can get dirty when compared to R
I am doing webscappers atm with Python for a personal project
Which is always fun
velvet thorn
heady hatch
Hey thanks <@!752743098089734236> , was wondering if I'm missing anything.
How ...
there are actually algorithms for that
it depends on what kind of statistics you're talking about
heady hatch
I'm not sure. The prompt just says "Evaluate the dataset", so I figured I give them basic details on the dataset.
velvet thorn
heady hatch
I'm not sure. The prompt just says "Evaluate the dataset", so I figured I give t...
hm
mean/std at least
for batches
are trivial to calculate
based on their definitions
median is more complex
min/max are the simplest, I guess
heady hatch
Hmm alrighty!
I'm going to try to load the dataset to see if I can fit it in memory. It's only 1GB, so I think it should okay just might take a while.
Learning new things.
Apparently we can use StandardScaler to get the mean and variance of a csr.
One of the feature has a std of 6e6 with the mean of 10e4.
torpid cave
Test for normality maybe
heady hatch
Would that be important if we're not doing a linear regression?
Or I guess please fill in my ignorance in stats.
torpid cave
well it can serve many purposes
Most parametric analysis rely on normality not only regression
And then, if I had these batches I could treat them independently as samples of the population
And get their sampling statistics
e.g. get mean, sd, max, min... for each batch
That just came to mind while I went to get some groceries
heady hatch
Ahh! hahaha I love the thinking about stats while grocery shopping.
torpid cave
hahaha
And it could give you ideas on how to threat the variables as well
If you need to do any transformation
heady hatch
Oh makes sense makes sense.
velvet thorn
linear regression doesn't rely on the dependent variable being normally distributed
 dim moss
can anyone explain why is the whole csv file nt loading
velvet thorn
dim moss
can anyone explain why is the whole csv file nt loading
show code
and elaborate
dim moss
this is it
velvet thorn
how do you know it's not the whole file
dim moss
after line 4 it has ... on every column
velvet thorn
well
that's because
it truncates the data
so it doesn't clog your browser
you can see it says there
1156 rows...
dim moss
how to fix it
velvet thorn
there's nothing to fix
dim moss
I mean all the 1156 rows
torpid cave
You have all the rows there
dim moss
nah
torpid cave
Just hidden
dim moss
yeah how to unhide them
velvet thorn
dim moss
yeah how to unhide them
you can Google "pandas show all rows"
but
I don't really see why you would want to
torpid cave
1.. why would you do that?
2... google
dim moss
I need each and every row to be shown over there
velvet thorn
dim moss
I need each and every row to be shown over there
for what reason?
dim moss
it's just my requirement
torpid cave
something like this maybe
pandas.set_option('display,max_rows', len(df)
pd
torpid cave
pandas.set_option('display.max_rows', df.shape[0]+1)
source: first google answer
Well yeah pd.set_option
dim moss
torpid cave
```py
pandas.set_option('display.max_rows', df.shape[0]+1)
```
source: first goo...
I also got the same answer from google thanks
dim moss
datascience is fun
heady hatch
Hey y'all.
This is the first time I'm seeing data split like this. Can anyone break it down to me why they'd do this?
Their reason is
Dataset Partition
We have partitioned each dataset into five parts with about the same number of queries, denoted as S1, S2, S3, S4, and S5, for five-fold cross validation. In each fold, we propose using three parts for training, one part for validation, and the remaining part for test (see the following table). The training set is used to learn ranking models. The validation set is used to tune the hyper parameters of the learning algorithms, such as the number of iterations in RankBoost and the combination coefficient in the objective function of Ranking SVM. The test set is used to evaluate the performance of the learned ranking models.
They proposed validation set to be used to tune hyperparameters. But then I've never dealt with tuning hyperparameters on every fold. Unless I'm missing something.
Dataset is from here.
torpid cave
I think you just partition the data to train the model multiple times... instead of doing training/validation just once, you do it 5 times
Damn I am shooting blanks here, sorry
It makes me think of step-wise learning in TS
heady hatch
Or maybe they do it 5 times to have a better understanding of the model as opposed to running cv once and then testing it once. Running it 5 times to see how the model acts on different unseen parts of the dataset?
torpid cave
Anyone who can troubleshoot requests here?
 winter sluice
hello all does anyone now how to export datas scrapped from a website to a csv file without looping?!
winter sluice
using requests and bs4
torpid cave
Well depends on the website
If you dont want to loop you can select elements
or sub-select elements and then do selections under those elements
winter sluice
i scrapped those elements:
['Locality', 'Type of property', 'Subtype of property', 'Price (€)', 'Type of sale','Number of rooms', 'Area (m²)', 'Fully equipped kitchen','Furnished', 'Open fire', 'Terrace', 'Garden', 'Surface area of the plot of land (m²)','Number of facades', 'Swimming pool', 'State of the building'])
torpid cave
So depends on the website
winter sluice
from this website

Envie d'être en "ville" mais pas trop, besoin d'espace et de verdure, pourquoi ne pas jeter un oeil à cette maison en vente?
Maison dans une ru...
and i need to iterate it to all the other products (but i already have the other urls)
winter sluice
yes! you need it here or in github?
winter sluice
torpid cave
Do you want to iterate to other webpages?
i want to save the same data for all the other product
products*
torpid cave
here is fine
I understand french btw, by products you mean links to the houses on the bottom?
winter sluice
it's my very first project in python...it's very basic my code then you know😅
torpid cave
No worries haha
I am working in a scrapping project at the moment so things are quite fresh
winter sluice
it's too long let me cut it
torpid cave
Or send me a github link
 arctic wedgeBOT
Hey @winter sluice!
It looks like you tried to attach a Python file - please use a code-pasting service such as https://paste.pythondiscord.com
 proud iron
Guys, what steps can be taken to find the "k nearest" row of any row in a pandas dataframe? 🙂
proud iron
Nevermind, I will just go to a help channel.
velvet thorn
proud iron
Guys, what steps can be taken to find the "k nearest" row of any row in a pandas...
this is actually
not that simple a problem
what's the context?
proud iron
@velvet thorn one second I will dig up the condition.
@velvet thorn here is the condition:
ake a function find_k_most_similar(df, record_id, k)that takes in input a dataframedf, the label of a row record_idand a parameterkand returns a dataframe that contains the k rows indfthat have the largest number of entries in common (i.e. that match exactly) with the record with indexrecord_id(this should include also the instance with labelrecord_id).
It might make more sense with the data set, as it is all strings or missing values.
 weary heart
hi, i'm new to ML, i'm wondering when are we need to use MAE,MSE,RMSE/else for eval metrics?
in regression
proud iron
@weary heart https://medium.com/human-in-a-machine-world/mae-and-rmse-which-metric-is-better-e60ac3bde13d

I hoope that this is a good start. 🙂
weary heart
proud iron
<@!293332238962262017> https://medium.com/human-in-a-machine-world/mae-and-rmse-...
thanks ! so, if the error is small it's good to use mae , if the error is big we use RMSE . am i correct?
proud iron
@weary heart that sounds about right. Also it appears to me that you are interested in validating your models so it is worth looking into "k fold validation". https://www.statology.org/k-fold-cross-validation/
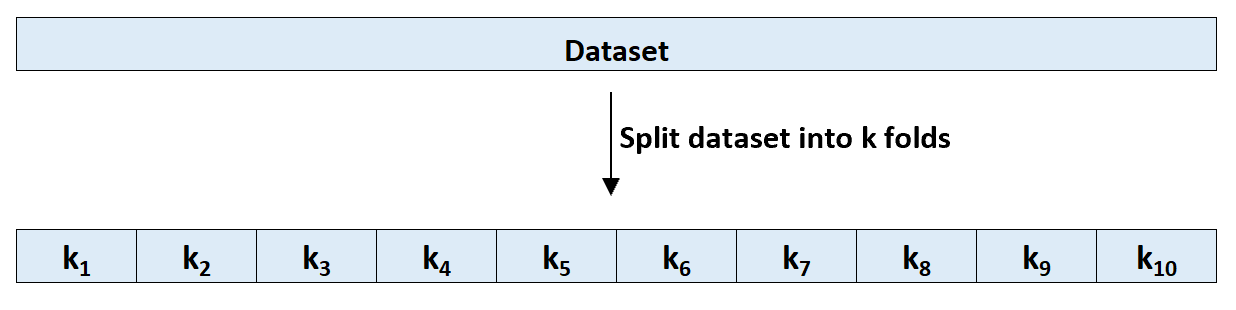
This tutorial provides an introduction to k-fold cross-validation, a commonly used method to evaluate model performance in machine learning.
 desert oar
No. MAE penalizes large errors less than RMSE.
proud iron
Well, I have made a mistake @weary heart thank you @desert oar for correcting me. Peace! :)
desert oar
Generally RMSE is a good default. I would use MAE in problems where it's OK to have a few really bad predictions but mostly-good predictions
RMSE will be inflated in cases like that
There are also both Median Absolute Error and Mean Absolute Error
They are very different and both abbreviated "MAE"
weary heart
if for example i'm predicting sales in some retail store, and i have MAE 710.111 and RMSE around 1000, which one should i use? if i take a look at the percentage on MAE, it gives me 30% error
weary heart
desert oar
They are very different and both abbreviated "MAE"
ah i'm referring to Mean Absolute Error
torpid cave
@weary heart RMSE and MAE should be used to compared models? Please correct me if wrong
desert oar
Sometimes people write MAD for "median absolute deviation" to distinguish from MAE "mean absolute error"
weary heart
i'm looking for the best eval metrics to my model (using hyper tuning xgboost) i getting 60% result. but i still kinda uncertain about when to use RMSE or the other, this is my first time on regression datasets
desert oar
What is the model predicting
 hollow gull
@weary heart I think the question comes down to how will the model be used and what types of errors are most costly to the end use of the model. This is restating what was said previously, but if a bad outlier means that the manufacturing process explodes and puts human's at risk, then RMSE is a better metric because it will be more sensitive (and therefore will pay more attention) to outliers. If you are willing to give 99% of your predictions a good value, and occasionally dropping the ball (maybe in the case of a product recommender, sometimes you recommend a product they don't like but there isn't much cost to that) then maybe MAE is better than RMSE.
I think you might argue that a particular error metric isn't better for a particular model, instead the error metric is meant to understand the business process.
You run into a similar issue in classification problems, which is why frequently accuracy is not always the best metric in classification problems. Sometimes you are more sensitive to certain types of errors and you want to find a error metric that most closely maps to what costs you money.
weary heart
desert oar
What is the model predicting
I'm predicting item sales on bigmart datasets
weary heart
hollow gull
<@!293332238962262017> I think the question comes down to how will the model be ...
ahh i see thankyou for the explanation. much clearer now !😄
hollow gull
This is a problem with 'toy' data science problems and many interview problems. There isn't a business use case, which makes it hard to come up with the best solution. I find it helpful to make up the business requirements because then I can tell that narrative when I am talking about my solution and it helps me motivate the choices I made and demonstrate how I was thinking about the problem. It also gives the interviewer enough information that they can ask you some easy, but instructive questions like, 'You mentioned that false positive were more costly, how would you change your analysis if all errors were equally costly?'
 south cove
Does someone know good pandas tutorial?
 whole mica
google maybe? Just go until you find one you like? @south cove
south cove
I just asked maybe you know one
south cove
Ok good luck with this
whole mica
currently trying to find a good way to make a TicTacToe A.I but no idea where to start
south cove
If you are a really begginer just make it if else
whole mica
well, i have to program the game too right?
south cove
Yeah I understand
whole mica
I wanna get a job in programming too but i am not going to school for it haha
south cove
At first you can try just make a game using tkinter
whole mica
would following a video along be a bad idea? That is how i have learned so far
south cove
It's ok when you understand the code
whole mica
alright ! Cool !
hollow gull
@whole mica there are a lot of free courses to help you get started. I was just browsing some of the offerings on https://www.codecademy.com/
Codecademy
Learn the technical skills you need for the job you want. As leaders in online education and learning to code, we’ve taught over 45 million people using a tested curriculum and an interactive learning environment. Start with HTML, CSS, JavaScript, SQL, Python, Data Science, and more.
If you goal is to learn data science, you will have to do premium, but their introduction to python 2 course is free. Unfortunately their intro to python 3 is premium. I would recommend python 3, but maybe others have a different opinion.
!resources
arctic wedgeBOT
Resources
The Resources page on our website contains a list of hand-selected learning resources that we regularly recommend to both beginners and experts.
https://pythondiscord.com/pages/resources
 earnest forge
Can someone recommend good Optimization Methods course/YT playlist?
whole mica
believe it or not i coded a game already haha, im onto the A.I part @hollow gull
heady hatch
@velvet thorn , @torpid cave
I kinda got the model running right now. It's on 2700 training steps out of 100000.
Thanks for spending the time with me to talk about big data.
Also oscarftm, I read that you were dealing with some troubles with requests? I'm not an expert, but what was your issue?
 proper swift
does anyone know how to change the, index column name from 3 (the 3 column to the next of the Code column) to something else?
It's a leftover index number after removing some rows of data, setting that row as a new column header, and reseting the index
traditional renaming doesnt appear to work :/ and now im just confused
hollow gull
What do you want your df to look like when you are done?
You can set any column to be the index with df.index = df[columnname]
whole mica
@hollow gull do you do this for a living ?
hollow gull
@whole mica you mean data science? If so then yes.
whole mica
Is there any way for me to get into it without having a degree?
hollow gull
heady hatch
Hey y'all.
This is the first time I'm seeing data split like this. Can anyone b...
@heady hatch I haven't seen a split like that before and it seems dangerous to me. you are using the test data set to make decisions, so my impression is you are losing some of the independence as a result. Maybe if there is another test holdout that isn't used for decision making it would be okay, but this looks sort of odd to me.
When you tune hyperparameters with cv you are evaluating the hyperparameters on each fold, but then you are boiling it down to a single average error, right? With sklearn you can look inside the cv object and see the in sample and out of sample error on each fold though.
rustic apex
I have a Numbers page, that I have allot of stocks written in. I also have “•, +, or -“ included in the cells because it showed why I wrote them down. How do I loop through, when there’s the symbols in them as well?
hollow gull
whole mica
Is there any way for me to get into it without having a degree?
I am sure it is possible, just a question of how hard it will be. If you learn the skills on your own and can demonstrate that to a business they would be crazy to not hire you, the degree is just intended to give them some confidence that you have some sort of minimal requirements. But I would think that anyone with a few awesome projects under their belt that can communicate what they did and why and is able to answer technical questions should be able to get a job irrespective of their degrees. In practice though, I think having a good instructor/mentor that can point you in the right direction and try to help you identify areas where you should focus.
hollow gull
rustic apex
I have a Numbers page, that I have allot of stocks written in. I also have “•, +...
I think we will need more context about what you are trying to do, it sounds like maybe read a dataset from excel that you have modified with custom symbols?
rustic apex
@hollow gull yes, but in Apple Numbers. Instead of a cell having just a ticker symbol, I included a •, + or - that showed why it interested me. So, how do I loop through and get a stock price, when it has those and it’s not all caps or lower?
hollow gull
I am not familiar with Apple Numbers. Are you getting an error message that you can share? Can you share the code that you are using?
heady hatch
@hollow gullTuning hyperparameter on each fold is really odd to me, that's where the question really stems from.
I was wondering if the 5 folds were k fold or some other structure they were following.
Because right now we're assuming they're using kfold which might not be true.
Good point on test set not being unbiased because it is iffy.
Actually it's not just a good point, it's a really good point. I'm going to think about it some more on what to do.
rustic apex
@hollow gull it’s basically excell. I haven’t tried it yet. But I’m wondering if the extra symbols will mess up anything?
hollow gull
Unfortunately basically excel and excel might not be the same thing. Can you export it as a csv and then load it with pd.read_csv
!docs pandas.read_csv
arctic wedgeBOT
pandas.read_csv(filepath_or_buffer, sep=',', delimiter=None, header='infer', names=None, index_col=None, usecols=None, squeeze=False, prefix=None, mangle_dupe_cols=True, dtype=None, engine=None, converters=None, true_values=None, false_values=None, skipinitialspace=False, skiprows=None, skipfooter=0, nrows=None, na_values=None, keep_default_na=True, na_filter=True, verbose=False, skip_blank_lines=True, parse_dates=False, infer_datetime_format=False, keep_date_col=False, date_parser=None, [...]```
Read a comma-separated values (csv) file into DataFrame.

Also supports optionally iterating or breaking of the file into chunks.

Additional help can be found in the online docs for [IO Tools](https://pandas.pydata.org/pandas-docs/stable/user_guide/io.html).

Parameters  **filepath\_or\_buffer**str, path object or file-like objectAny valid string path is acceptable. The string could be a URL. Valid URL schemes include http, ftp, s3, gs, and file. For file URLs, a host is expected. A local file could be: <file://localhost/path/to/table.csv>.

If you want to pass in a path object, pandas accepts any `os.PathLike`.

By file-like object, we refer to objects with a `read()` method, such as a file handler (e.g. via builtin `open` function) or `StringIO`.... [read more](https://pandas.pydata.org/pandas-docs/stable/reference/api/pandas.read_csv.html#pandas.read_csv)I would guess that pandas isn't going to care about your special characters, it will just put them into an object and assume they are strings.
 wild pine
hey guys. i recently started learning reinforcement learning. I've been trying to make a DQN learn pole balancing, but my algorithm is decreasing in performance with every training step.
i tried fiddling around with some of the parameters, but nothing really seems to improve it, so I've come to the conculsusion that there's something fundementally wrong with my understanding. i was hoping one of you guys would take a look, and maybe give me a nudge in the right direction.
here's my current code: https://hastebin.com/vozijaxovo.py
i know it's quite a bit of code. I was hoping that maybe one of you wizards would be able to spot an obvious nono by just scimming over it.
any amount of help would be greatly appreciated!
thanks in advance!
 shy moat
Could you solve it? #python-discussion message
I don't mean elements sum but A1*a1 + A2*a2 + .... + An*an, for example.
hollow gull
@wild pine I don't have experience using reinforcement learning, have you followed along with a tutorial and seen if you can reproduce their results and if their method is similar to what you did? https://towardsdatascience.com/cartpole-introduction-to-reinforcement-learning-ed0eb5b58288
Medium
Solving OpenAI Gym Environment
@shy moat You want to know how to code up matrix multiplication from scratch or are you willing to use libraries?
shy moat
hollow gull
<@!394821178146947075> You want to know how to code up matrix multiplication fro...
Anything will be fine.
wild pine
@hollow gull i looked at a different tutorial and felt like i was largely doing the same thing. however, i'll try taking a look at this one as well, and see if i notice anything. Thanks ^^
hollow gull
@shy moat is that what you are looking for?
import numpy as np
A = np.array([[1, 2, 3], [4, 5, 6]])
B = np.array([7, 8, 9])
C = A.dot(B)
print(A, '\n\n',  B, '\n\n',  C)
[[1 2 3]
 [4 5 6]]

 [7 8 9]

 [ 50 122]
Thank you. I explained without details, sorry.
If
A[0] = np.random.randint(5, size=(2,2))
A[1] = np.random.randint(5, size=(2,2))
c[0] = 1
c[1] = 2
```,
I want to obtain `A[0]*c[0] + A[1]*c[1]`.
A[0] = np.random.randint(5, size=(2,2))
A[1] = np.random.randint(5, size=(2,2))
c[0] = 1
c[1] = 2
A[0];A[1]
array([[1., 1.],
[4., 1.]])
array([[2., 3.],
[4., 2.]])
A[0]*c[0] + A[1]*c[1]
array([[ 5., 7.],
[12., 5.]])
You know anyone besides coodcamp who could mentor me or I could build a relationship with? I’d love to build a career in coding and I’m down to learn fast
 agile wing
shy moat
agile wing
shy moat
But the key is that I don't want to use like
sum = zeros((2,2))
for i in range(2):
  sum += A[i]*c[i]
A = np.random.randint(5, size=(2,2))
B = np.random.randint(5, size=(2,2))
D = np.dstack([A, B])

C = np.array([0, 1])

D.dot(C)
why not?
shy moat
Scalar c is defined as cvxpy variable.
hollow gull
scalar c isn't a scalar if it has an index unless I am missing something.
shy moat
I don't understand the problem is, so I would check myself again...
Sorry for disturbing.
hollow gull
 lapis sequoia
is this appropriate for api help
lapis sequoia
is this appropriate for api help
If it is a data science API maybe, you could also try taking a help channel.
 rich silo
@green hemlock Hey dude, turns out that the bins can be sorted with sort_values() function from pandas.
Also the bins register as int64 so there might be an easy way of changing their format
whole mica
@velvet thorn I got a quick question. If I’m building the Pokémon A.I and I’m using data from others. How do I get the data from them playing?
Or Wel does anyone know how I get it??
torpid cave
@heady hatch great to know you are doing ok
I was stuck generating JS webpages and clicking through them
velvet thorn
hollow gull
<@!542872811245666305> I haven't seen a split like that before and it seems dang...
@heady hatch no, this is fine, and in fact not uncommon.
because you perform hyperparameter tuning using the validation set
and you only evaluate the final model on the test set.
@glad mulch don't mix inplace
methods normally make copies
so when you call .set_index(..., inplace=True) on the result of reset_index(), you're changing the index of that copy
but anyway
I think you should be able to do reg_data.reorder_index(['Ticker', 'Date'])
torpid cave
are you grouping?
Looks like you have unique values in Ticker but not in date so it is setting it up by an as index
 umbral sluice
Hey guy,
A quick question about learning models. I have a scenario where I want to use a classier which will predict the class of the label and if the label is of particular class then a regressor.
So basically a binary classifier to regressor
Any idea how to do it?
 molten hamlet
can I stretch pyplot? i want to scale down xaxis by 240 times
 modest orbit
Should I ask for help on a database program here, or in the help channels?
It's a really simple one, I'm just learning data visualization and need help with a bar chart
torpid cave
I think data viz fits here
hollow gull
molten hamlet
can I stretch pyplot? i want to scale down xaxis by 240 times
if you expose the axis object you can set the x limits with ax.set_xlim(xmin, xmax)
You can expose the axis object with subplots for example:
fig, ax = plt.subplots()
df['data'].plot(ax=ax)
ax.grid()
ax.legend()
ax.set_xlim(xmin, xmax)
fig.show()
You need a label to do a classifier, do you have one already and you have a y_target for the regressor? Many problems are not set up that way. It might be more typical to do a clustering followed by a regression.
What is your current situation and what are you trying to do?
Do you know of the library missingno?
https://github.com/ResidentMario/missingno

GitHub
Missing data visualization module for Python. Contribute to ResidentMario/missingno development by creating an account on GitHub.
whole mica
Sephith you see what I asked 🥺
hollow gull
whole mica
Sephith you see what I asked 🥺
I don't really know how to respond, that is too vague of a question. I don't know of good ways of getting data out of games that don't host an API.
whole mica
Like to get training data! My bad
torpid cave
What kind of data Swank? Can you offer an example?
hollow gull
@modest orbit I am morally apposed to bar charts, but I will do my best to help if you give us more details about your problem.
whole mica
Uhhh, I’m eventually going to be building a A.I to play Pokémon so
Like having a mix of good and bad players and their play throughs
modest orbit
@hollow gull that would be amazeballs, and yea so far they're the most annoying chart for me right now. I posted my question on #help-mushroom
However I updated my code, but now the issue is that the wrong columns are being taken as x and y values..
torpid cave
So that is data propetary to Pokemon
Have you written an algo with the rules and how to simulate the game?
hollow gull
@night loom can you turn your dataframe into a dict and then print it in the chat with df.head(25).to_dict()
I want to get a sample, but I am too import the data myself unless I have to.
hollow gull
@glad mulch I would look at df.index on both dataframes and make sure the types are the same.
oh, you have that.
Sorry
What do you mean there is a 3 difference?
hollow gull
At least not at the level you are showing... You do some processing after the merge. Is the na count the same right after the merge?
hollow gull
torpid cave
You would just get NAs on the values w/o index
That is my impression as well, that is why I am wondering if the issue is actually the set_index, reindex, or rename.
hollow gull
Not 3000 nulls though. It should be 3.
torpid cave
hollow gull
Not 3000 nulls though. It should be 3.
That
You get 1k rows per date?
wow
What are you getting
intraday?
hollow gull
Are there duplicate index values?
whole mica
torpid cave
Have you written an algo with the rules and how to simulate the game?
Not yet. But i soon will
torpid cave
@whole mica maybe you could code-in some plays manually, and make the bot play against iself for 20~30 years.
I think that is the way they trained the dota2 bots.
whole mica
torpid cave
<@!335796935170719744> maybe you could code-in some plays manually, and make the...
Why would I do that for such an outdated game,
torpid cave
20~30 years in computing time
I mean for you game
Pokemon
You don't need to feed it with data, if you program the rules you can train it against itself
As the rules are quite well defined and will likely not change
whole mica
You sure? Another person said it might be best to get training data
torpid cave
Yeah might be better, but it might be harder/pricier to get that data
So there is your trade-off
whole mica
Oh well
I have friends to do it
In your honest opinion what do you think
Getting data or having it create it on its own
torpid cave
That is the million-dollar question
Sometimes you can't buy the data you need
or it is prohibitely expensive
so you try to collect it
And then you can't collect it because it is hard/impossible
hollow gull
 cunning grail
Anyone here able to help with AI questions
cunning grail
Anyone here able to help with AI questions
Give it to us, we will do our best.
whole mica
The data I’m getting is free
 cyan flame
I'm having trouble instally numpy on an apple silicon/m1 mac
I have Python3.8/pip that came installed through apple developer tools, however there seem to be some issues when it comes to installing any data science related package i.e. numpy/scipy/matplotlib
rustic apex
@hollow gull it’s showing the stocks I have in the file, but now I want to get the price per cell
torpid cave
@cyan flame consider using the Anaconda Distribution
cyan flame
torpid cave
<@!754006029896777789> consider using the Anaconda Distribution
I have not actually used conda before, will it overwrite the original python installation?
torpid cave
I dont think so
It creates a virtual environment
And pre-loads all the DS packages you need
Hmm
Do double [[ when indexing?
esg_data.groupby(['Ticker','Date'])[['ENV Score',....,'GOV Score']]. >rest of code
When selecting
I thought you meant the error
Ok I see what you mean
Why don't you loop it?
Try
groupping by ticker
order by date
and then apply the functions
I would remove indexes
reset_index()
Then group by ticker
cyan flame
@torpid cave Conda worked! Thanks!
whole mica
@torpid cave how do I convert the data or retrieve the data from them playing?
torpid cave
@whole mica that is the problem
And how will your program connect with the App as well, think about that
I am not into digital analytics so it might be hard for me to advice you on this, but I know that everything they do since the moment they enter the app until the moment they leave is tracked
whole mica
Well I have an emulator on my Mac, I just gotta figure out how to do that too.
 short zephyr
somebody has a list of data preprocessing methods for each type of data? (ie excel(alphanumerical, images for CNN etc, text for RNN etc, video->images for CNN & segementation)?
 noble linden
Anyone can help me about Algorithms class for computer sciences?
umbral sluice
hollow gull
You need a label to do a classifier, do you have one already and you have a y_ta...
Thanks for your response.
I have a y_label and y_target
 pulsar latch
Hey would u guys say learning data structures and algorithms is important for being a data scientist
 plucky zephyr
why people use R2 (coefficient determination) with y actual and y predict,
if it say 90, what it mean? and why use R2 for y actual and y predict ....
dim moss
hey guys how can I fix this kernel is restarting issue
molten hamlet
hollow gull
if you expose the axis object you can set the x limits with ax.set_xlim(xmin, xm...
that is the shift, I want to scale whole plot
or axis
with points
lapis sequoia
Hi guys, I'm doing an assignment regarding loops, list and dicts. However, I'm super stuck
Can somebody help me out?
 blazing lodge
can someone guide me here
velvet thorn
lapis sequoia
Hi guys, I'm doing an assignment regarding loops, list and dicts. However, I'm s...
if it's not specifically DS related, try #❓|how-to-get-help
velvet thorn
molten hamlet
that is the shift, I want to scale whole plot
can you elaborate on what exactly you want
molten hamlet
@velvet thorn plot(data), without X array, and scale all down by 240, instead of creating X = np.arange(len(data))/240
molten hamlet
yes, I want just to scale plot on x axis 😄 so labels in stead of 240 will be 1
my data is samples in such framerate
velvet thorn
molten hamlet
yes, I want just to scale plot on x axis 😄 so labels in stead of 240 will be 1
I'm actually not sure if there's an easy way to do that apart from specifying x manually
like you could use a custom formatter but well
or
you want 0 to 1, with a number of steps equal to the number of points in y?
best I can think of is np.linspace(0, 1, len(y))
 dull musk
 plain frost
how i do cross validation . csv file
 somber bane
Can anyone recommend me some good article on Gradient descent and stochastic gradient?
Because I try to find them on line, but none of them I found is good.
I mean article that actually showed me how to apply GSD on a data set, not just explain to me the concepts
 twilit tangle
damn thats some nice data science
 cobalt jetty
<@&267629731250176001> You might want to check this.
 devout sail
!pban 722761272776720505 NSFW
arctic wedgeBOT
 :ok_hand: applied ban to @cunning hinge permanently.
cobalt jetty
This might be up your alley, @somber bane https://www.youtube.com/watch?v=IHZwWFHWa-w

Home page: https://www.3blue1brown.com/
Brought to you by you: http://3b1b.co/nn2-thanks
And by Amplify Partners.
For any early-stage ML startup founders, Amplify Partners would love to hear from you via 3blue1brown@amplifypartners.com
To learn more, I highly recommend the book by Michael Nielsen
http://neuralnetworksanddeeplearning.com/
The b...
3b1b is an awesome channel through and through
somber bane
Thanks @cobalt jetty
hollow gull
plain frost
how i do cross validation . csv file
How you apply cross fold validation doesn't really depend on what format you store your data in (in your case .csv.) Any tutorial on how to apply cross fold validation should be able to help you or the sklearn documentation or user guides.
hollow gull
molten hamlet
look I got seconds, instead of 480 frames
Does that mean you figured it out and you don't have a question anymore?
blazing lodge
can someone tell what's the error about?
hollow gull
It sort of looks like that isn't an appropriate way to call set theme.
maybe try:
sns.set_theme(context='notebook',
              style='white')
https://seaborn.pydata.org/generated/seaborn.set_context.html
https://seaborn.pydata.org/generated/seaborn.set_theme.html
A bit like how matplotlib is structured, it seems that seaborn has a way to declare how your plot will be constructed and shown (i.e. its context), the theme is part of this context.
you beat me to it, Seph
whole mica
anyone here use mini max before ?
molten hamlet
hollow gull
Does that mean you figured it out and you don't have a question anymore?
I got solution ,but it does not anwer my question 😄
lapis sequoia
anybody can help me with solving following in python?
hollow gull
molten hamlet
I got solution ,but it does not anwer my question 😄
What is wrong with just dividing your x column by 240 to convert it into frames per second?
desert oar
@lapis sequoia "doesn't work for me" is impossible to help with
You dont need numpy to compute a 2x2 matrix inverse
In fact you dont need to compute the inverse at all really
You should review your class notes on the rules of matrix transposes
whole mica
hey salt rock
you use minimax at all
im trying to implement it in my code but i am having difficulties
lapis sequoia
@desert oar looking for examples, what i have done in python is a mess
yes i have googled
 remote pond
maybe numerical methods needed?
hollow gull
whole mica
hey salt rock
@whole mica What issues? You getting an error message?
remote pond
I think it's really hard to solve this from original equation, at least you should change it some
and then just from scipy.linalg import solve
here's the doc
molten hamlet
hollow gull
What is wrong with just dividing your x column by 240 to convert it into frames ...
too complicated 🤓
i wanted to maybe plotstep=1/240
😄
somehow pyplot projects that numbers to x axis, so there must be some way
hollow gull
molten hamlet
somehow pyplot projects that numbers to x axis, so there must be some way
I worry that you might be overengineering your solution. Simple division would be easily readable and with a comment it would be easy to understand why you did it. Why build in potentially complicated functionality into a plotting tool to rescale your data when you could just rescale your data?
You could always build your own plotting function that applies a scaling before calling matplotlib.
molten hamlet
@hollow gull Im saying, that if you plot(data) then you got no X
and somehow pyplot does what is does, creates X values
hollow gull
If you don't specify an x column I think it just uses the index.
proper swift
@hollow gull could you help me with something?
hollow gull
Just ask and whoever can help will try to.
proper swift
ok, im trying to change the dtypes of a list of columns, from object dtype to an int dtype. Trying a for loop gives me a
<ipython-input-12-fa0b6a80e2cb>:2: SettingWithCopyWarning:
A value is trying to be set on a copy of a slice from a DataFrame.
Try using .loc[row_indexer,col_indexer] = value instead
when trying to change just one column, i get:
ValueError: invalid literal for int() with base 10: '66,796,807'
It looks like it doesn't understand the commas in your string column that you want to switch to an int?
The first part (the warning) I believe has a link to the documentation and you should go and read that. It is a dense read, but it is important because it tells you why the code you were passing is dangerous.
The link should give you suggestions on the correct syntax to make sure what you are coding is doing what you intend it to do.
proper swift
So i am working with a xlsx file, with 90 odd columns, each column contains a specific age i.e. 0-90, all columns are obviously integers, but do not have the correct dtype assigned. and the values in these fields are not yet seperated by columns
hollow gull
@glad mulch I think it is usually better to just ask your real question, even if no one has they might still be able to answer your question.
proper swift
yeah just reviewing the documentation now
hollow gull
proper swift
So i am working with a xlsx file, with 90 odd columns, each column contains a sp...
Edit: I realized later that the following statement is not correct. He said that column names are between 0 and 90 not that the values were between 0 and 90.
It seems like the error is telling you that the one column you passed has a value of '66,796,807' that is inconsistent with what you said (everything is between 0-90) are you sure what you said is correct?
proper swift
@hollow gull apologies, i mean the column names are between 0-90. that probably refers to the "all ages" column, which was already in the existing file. Each column contains a total of the approximate number of people in that age group
hollow gull
proper swift
<@!350851617223999488> apologies, i mean the column names are between 0-90. that...
Try looking at the dtypes directly after loading the data. Does it convert most of the ages correctly, but not all ages? df.dtypes
proper swift
hollow gull
Try looking at the dtypes directly after loading the data. Does it convert most ...
yeah every single column is an object, dtype
hollow gull
@glad mulch See, now I learned something PanelOLS looks interesting. I don't remember seeing something like this before.
proper swift
here's the code i was trying to use, to convert the columns with total age values in:
for x in num_columns:
    df[x] = df[x].astype(int).apply(lambda x: f'{x:,}')

error:
<ipython-input-12-fa0b6a80e2cb>:2: SettingWithCopyWarning:
A value is trying to be set on a copy of a slice from a DataFrame.
Try using .loc[row_indexer,col_indexer] = value instead

See the caveats in the documentation: https://pandas.pydata.org/pandas-docs/stable/user_guide/indexing.html#returning-a-view-versus-a-copy
  df[x] = df[x].astype(int).apply(lambda x: f'{x:,}')
num_columns is just a list variable containing each column with age values in it
hollow gull
proper swift
here's the code i was trying to use, to convert the columns with total age valu...
I prefer something like this. I think it is more readable:
for columnname in df.columns:
    df[columnname] = df[columnname].astype(int).apply(lambda x: f'{x:,}')
yeah true, im just testing still, normally fix the variable names post testing haha
hollow gull
Then to see if it is an issue with only one column or all of them you could either print out columnname before trying to convert it. Or you could put a try except and see which columns were successfully converted.
for columnname in df.columns:
    print(columnname)
    df[columnname] = df[columnname].astype(int).apply(lambda x: f'{x:,}')
I think this would run, but the except statement might not be correct.
for columnname in df.columns:
    try:
        df[columnname] = df[columnname].astype(int).apply(lambda x: f'{x:,}')
        print('column: {} was successful'.format(columnname))
    except as e:
        print('column: {} failed!!!!!!!!!!!!!!!!!!!!!!!!!!!!!!!!!'.format(columnname))
I don't remember how to except all.
proper swift
just tried a try and except, all columns couldnt be converted lol 😦
for column_name in num_columns:
    #print(column_name)
    try:
        df[column_name] = df[column_name].astype(int).apply(lambda x: f'{x:,}')
        print(f'{column_name} column - converted!')
    except:
        print(f'{column_name} column - was not converted')
Sure, but if you know which ones won't converted then you can try to figure out why.
proper swift
all of them were not converted haha
hollow gull
Actually, maybe pandas will solve this for you. Try this instead.
for column_name in num_columns:
    #print(column_name)
    try:
        df[column_name] = pd.to_numeric(df[column_name])
        print(f'{column_name} column - converted!')
    except:
        print(f'{column_name} column - was not converted')
I didn't notice you were using a lambda.
proper swift
yeah, i'm afraid im still learning!
hollow gull
That is okay we are all learning, I wasn't trying to shame you.
proper swift
don't worry, I didn't take it as a shaming, just as helpful advice
no luck sadly
its odd because, i havent done anything major to the file
hollow gull
What is the output of that code?
proper swift
i've deleted a couple of rows, and resetted the index a couple of times
The code works, in the sense that it tells me what columns were/weren't converted . Unfortunately, all columns were not converted.
OUTPUT:

All ages column - NOT CONVERTED!
0.0 column - NOT CONVERTED!
1.0 column - NOT CONVERTED!
2.0 column - NOT CONVERTED!
3 column - NOT CONVERTED!
4.0 column - NOT CONVERTED!
5 column - NOT CONVERTED!
6.0 column - NOT CONVERTED!
7 column - NOT CONVERTED!
8.0 column - NOT CONVERTED!
9 column - NOT CONVERTED!
10.0 column - NOT CONVERTED!
... - all the way up to column 90
try:```py
for column_name in num_columns:
#print(column_name)
try:
df[column_name] = pd.to_numeric(df[column_name])
print(f'{column_name} column - converted!')
except as e:
print(f'{column_name} column - was not converted')
print(e)
correct me if im wrong, but wont that "except as" argument not work, unless you specify a specific error like a ValueError or something?
hollow gull
I am not sure what the correct syntax is to accept all exceptions.
maybe```py
for column_name in num_columns:
#print(column_name)
try:
df[column_name] = pd.to_numeric(df[column_name])
print(f'{column_name} column - converted!')
except Exception as e:
print(f'{column_name} column - was not converted')
print(e)
yeah, it looks like Exception is a built in class. I think that will work.
proper swift
i cant remember either haha, will give both a go
so, "except as e" didnt work, get a syntax error.
however...
except Exception as E did work!
Output:

All ages column - NOT CONVERTED!
Unable to parse string "66,796,807" at position 0
0.0 column - NOT CONVERTED!
Unable to parse string "722,881" at position 0
1.0 column - NOT CONVERTED!
Unable to parse string "752,554" at position 0
2.0 column - NOT CONVERTED!
Unable to parse string "777,309" at position 0
3 column - NOT CONVERTED!
Unable to parse string "802,334" at position 0
4.0 column - NOT CONVERTED!
Unable to parse string "802,185" at position 0
5 column - NOT CONVERTED!
Unable to parse string "809,152" at position 0
6.0 column - NOT CONVERTED!
Unable to parse string "827,149" at position 0
7 column - NOT CONVERTED!
Unable to parse string "852,059" at position 0
8.0 column - NOT CONVERTED!
Unable to parse string "838,680" at position 0
9 column - NOT CONVERTED!
Unable to parse string "822,812" at position 0
10.0 column - NOT CONVERTED!
Unable to parse string "813,774" at position 0
A glance at the rest of output, it seems that strings @ position 0, can't be parsed
okay, so i might have semi fixed it
hollow gull
Yeah, it still looks like the issue is commas. I would try this.
for column_name in num_columns:
    #print(column_name)
    try:
        df[column_name] = pd.to_numeric(df[column_name].str.replace(',' ''))
        print(f'{column_name} column - converted!')
    except Exception as e:
        print(f'{column_name} column - was not converted')
        print(e)
i added the arg, errors='coerce'
        df[column_name] = pd.to_numeric(df[column_name],
        errors='coerce')
 slate flame
Hi! I am trying to use tensorflow-gpu and it is running slower than normal tensorflow. Is there a common mistake I might have made?
proper swift
but @hollow gull i still get the following Setting With Copy Warning error message :
<ipython-input-44-a109f50f7798>:5: SettingWithCopyWarning:
A value is trying to be set on a copy of a slice from a DataFrame.
Try using .loc[row_indexer,col_indexer] = value instead

See the caveats in the documentation: https://pandas.pydata.org/pandas-docs/stable/user_guide/indexing.html#returning-a-view-versus-a-copy
  df[column_name] = pd.to_numeric(df[column_name], errors='coerce')
and the majority of values have been converted to NAN haha
hollow gull
I am hesitant to use errors='coerce'. I would rather handle the errors directly and that way if there is a new issue in the future it raises and error to let me know that it needs more fixing.
proper swift
yeah thats a good point. came across it during my googling, and thought it could help,just made things worse lol 😦
slate flame
Either of you got any advice?
proper swift
sorry im not familiar with TensorFlow yet
slate flame
Alright
proper swift
hollow gull
Yeah, it still looks like the issue is commas. I would try this.
```py
for colum...
Output:

All ages column - NOT CONVERTED!
Can only use .str accessor with string values!
0.0 column - NOT CONVERTED!
Can only use .str accessor with string values!
1.0 column - NOT CONVERTED!
Can only use .str accessor with string values!
2.0 column - NOT CONVERTED!
Can only use .str accessor with string values!
3 column - NOT CONVERTED!
Can only use .str accessor with string values!
4.0 column - NOT CONVERTED!
Can only use .str accessor with string values!
5 column - NOT CONVERTED!
Can only use .str accessor with string values!
I am not familiar enough to give you good advice and I don't know common mistakes. There are a lot of things that could cause a gpu job to not outperform. The data isn't big enough, you have a weak gpu and a strong cpu, etc.
hollow gull
proper swift
```python
Output:
All ages column - NOT CONVERTED!
Can only use .str accessor w...
Can you paste the head of your raw dataset into the chat so I can start playing with it on my side?
proper swift
sure, might be better to pm you, i think were hogging this channel
hollow gull
They prefer not to pm, but you could request a help channel and let me know which one.
arctic wedgeBOT
Hey @proper swift!
Uh-oh! It looks like your message got zapped by our spam filter. We currently don't allow .txt attachments, so here are some tips to help you travel safely:
• If you attempted to send a message longer than 2000 characters, try shortening your message to fit within the character limit or use a pasting service (see below)
• If you tried to show someone your code, you can use codeblocks
(run !code-blocks in #bot-commands for more information) or use a pasting service like:
Hey @proper swift!
It looks like you tried to attach file type(s) that we do not allow (.xlsx). We currently allow the following file types: .3gp, .3g2, .avi, .bmp, .gif, .h264, .jpg, .jpeg, .mkv, .mov, .mp4, .mpeg, .mpg, .png, .tiff, .wmv, .svg, .psd, .ai, .aep, .xcf, .mp3, .wav, .ogg, .webm, .webp, .flac, .afdesign, .m4a, .csv.
Feel free to ask in #community-meta if you think this is a mistake.
proper swift
try this csv file, of the top 10, the pastebin looks really odd. This data isnt sensitive, its publically available data
hollow gull
Converting things to dicts makes it pretty easy to rebuild the dataset on my side without having to save the file somewhere and then find the path and then load it, blah blah blah. I am lazy. I recommend using df.head(5).to_dict() then I can just paste that into df = pd.DataFrame(dictvalues)
If it was too long, I would just take the first 5 columns, that would be enough to debug this.
I will do it on my end this time though 🙂
proper swift
haha no worries, thanks for the tip, forgot about convert to dict
can you see this code?
proper swift
excellent, any help is much appreciated
obviously i can do some cleansing in excel, but im trying to learn how to do it in pandas and python
hollow gull
That reads in correctly though.....
df.dtypes
Code           object
Name           object
Geography1     object
All ages        int64
0.0           float64
               ...
86.0          float64
87.0          float64
88.0          float64
89.0          float64
90+             int64
Length: 95, dtype: object
Can you try your converting of the types on only the head of the dataframe?
for column_name in num_columns:
    #print(column_name)
    try:
        pd.to_numeric(df[column_name].head())
        print(f'{column_name} column - converted!')
    except Exception as e:
        print(f'{column_name} column - was not converted')
        print(e)
yeah that works
so the output says each column was successfully converted,
however dtypes, shows that a handful of columns remain as objects, and the rest as float64.
Specifically, columns = All Ages, 3, 5, 7, 9 and 90+ remains as object dtype, out of the num_columns
hollow gull
So there is a formatting issue of those columns. I would look at the value in the head of those columns very carefully and compare it to the ones that successfully converted. My guess is that it will be a commas issue.
 green hemlock
hollow gull
Can you try your converting of the types on only the head of the dataframe?
green hemlock
hollow gull
Can you try your converting of the types on only the head of the dataframe?
I haven't read the whole thing, but this will just tell if it can be converted, it won't actually convert, because the values are not assigned back.
hollow gull
green hemlock
I haven't read the whole thing, but this will just tell if it can be converted, ...
You are correct, I wanted to see if it successfully converted, but not to overwrite the values.
whole mica
hollow gull
<@335796935170719744> What issues? You getting an error message?
not necessarily, just cant figure out how to organize it or even put it into my code. I have my tic-tac-toe created using tkinter but after that no clue
proper swift
@hollow gull yeah i think the issue is that the columns not converted are not floats like the majority of the others. 'All Ages - str', 3, 5,7, 9 should be ints, but are objects, and 90+ might be a string as well. Every other number for some reason is their float equivalent
maybe its best to replace the column headers first to more suitable names using a for loop? i.e. convert columns 0.0 - 89 to 0-89 integers, then the columns with strings, manually
hollow gull
The column name shouldn't matter, but I am going to have to take a break. Sorry I wasn't able to resolve it in 50 message 🙂
proper swift
no worries buddy, you've been really helpful, much appreciated
 earnest herald
Repost from #internals-and-peps
Hello everyone,
This will be a vaugue question but please try to answer to the best of your knowledge.
I am making a nearly-identical image detection algorithm (not from the scratch) for my firm. I am new to the industry.
So I will be processing thousands of images and have used LSH algorithm for it (which uses dhash for calculating signatures I guess)
This is my internship project and I have not "studied" on Machine Learning/Deep Learning.
Now would this be a good approach for image recognition? Or should I go to Tensorflow?
Thanks a bunch. Any response would be valuable to me (:
Regards,
Mortis
@ me. Cheers!
whole mica
Well, i do not know much but my buddy is going to school for teaching! Let me give him a shout and see what he says! @earnest herald
earnest herald
whole mica
Well, i do not know much but my buddy is going to school for teaching! Let me gi...
Awesome! Thanks bud (:
I'll be waiting for a response 😁
whole mica
If im not mistaken, tensorflow would be correct but do not quote me on that till i get a direct answer!
earnest herald
Yeah personally I think Tensorflow would be more efficient but I've successfully stolen and modified an LSH code from git so idk maybe I'm biased towards it XD
whole mica
I'm just getting into coding so i do not know a whole lot haha
earnest herald
All good. It's fun you should practice and explore as much as you can
whole mica
I am trying to get into it as a career but do not know where to really start haha
not going to school for it is kinda tough
earnest herald
If you're new to programming, I think you should just start with youtube. Start with any youtuber and any language. Though, personally, I think Java/Processing would be better but maybe I'm being biased because I'm really new to Python
Python would be a good choice as well but if you wanna see visible results for, like literally visible results go with Processing (which is based on Java)
whole mica
Well, I think im pretty decent at python already
im getting into machine learning now haha
but i am having troubles with it
whole mica
I am !
earnest herald
Have you understood OOPS?
earnest herald
Bruh
Learn about oops
classes and objects
ML, in the end, is just maths and physics. Don't go for fancy words
whole mica
im good at the math part
cobalt jetty
Object Oriented Programming, Swank.
It's just a paradigm in programming.
If you don't know about it, it's fine, you have already worked within its confine if you know Python pretty well ^^.
cobalt jetty
What troubles are you having with Tensorflow/ML, @whole mica ?
 unreal glacier
You learned ml?
cobalt jetty
I've used it a few times for fun personal projects.
unreal glacier
Where did you learn it
cobalt jetty
online mostly. I had a project in mind.
it's more like a starting hobby thing that turned into a more involved work
I went back to Uni because i found it interesting.
unreal glacier
Im first year
Learning python for 2 months
But I've done js, flutter and other stuff before
Im not sure where would you get a job
With python tho
Except data manipulation and stuff
And the nerual networks stuff seems to hard
cobalt jetty
Neural networks are okay thanks to TF and Pytorch. Understanding them is much harder.
 high badge
im currently working with this dataset https://www.kaggle.com/lepchenkov/usedcarscatalog
theres 1 category with 1118 different unique values
how do i fix it so that the dataset i feed my model isnt a huge dataset encoded in 1s and 0s

Dataset contains car ads with lots of categorical and numerical features.
i was thinking to one hot encode the "model_name" column but seeing that it has 1118 unique values, should i remove the column? or trim the unique values (i noticed that there were a lot of unique values that had a frequency of just 1 or 2)?
cobalt jetty
To recap, you're trying to determine the model name of a car (label) based on the other available data (your features)?
high badge
im trying to determine the price of the car
cobalt jetty
Seeing the size of the dataset, one hot encoding the column could work, I don't think it would lead to a memory issue. However you're dealing with cars here and if you remove the column, since you have the manufacturer's name and the other features, I don't think it will impact the results much. There's a lot of correlation involved.
Comparing the two results (if you include the model name or not) could be interesting.
high badge
i see
how do i decide what to do with that column
there are a lot of model names that have low frequencies and (im assuming) due to those low frequencies wouldnt impact the results as much, then again there are some model names that have high frequencies
cobalt jetty
If you're looking for a smaller encoder for memory issues, you might want to look at the variety of available encoders (maybe a hash encoder). You could also look into some sort of dimensionality reduction. https://www.analyticsvidhya.com/blog/2020/08/types-of-categorical-data-encoding/

Dealing with categorical data is key to creating a successful model. Refer to this article to understand various categorical data encoding methods.
high badge
ah thanks
would there be a memory issue if i were to one hot encode all the categorical columns in the dataset?
for this example, i would one hot encode the 13 boolean columns and 10 object columns
these are the number of unique values in all the object columns
cobalt jetty
tbh, I doubt there'll be a memory issue one-hot encoding it all
You'll just have a fat array.
but you should first think about what model you want to use
then see how to format your data.
high badge
ah ok
cobalt jetty
what would you like to implement?
high badge
could i use a linear regression model?
cobalt jetty
you absolutely could tbh.
 slim fox
linear regression is a good baseline model
- you can make it capture some non-linearity
if you start to multiply feautures
cobalt jetty
if it's your first model, you can definitely check out the linearRegression functions which are part of the sklearn module.
high badge
alright thanks a lot guys 👍 ill check this out
cobalt jetty
If you end up dropping the model_name feature, try to explore some other models like RandomForestRegressor for the heck of it.
not because the model couldn't handle the feature, but because I've never implemented such a model with that much unique value. I dunno what it would result with (could be fun to try ngl)
velvet thorn
high badge
for this example, i would one hot encode the 13 boolean columns and 10 object co...
why do you think you need to one-hot encode boolean columns?
high badge
well i could also set the column to 1s and 0s but idk the advantages of doing that compared to one hot encoding
velvet thorn
high badge
well i could also set the column to 1s and 0s but idk the advantages of doing th...
boolean is basically 1/0
which is exactly the same as one hot encoding
high badge
in this case would there be certain advantages to picking one way over another
like one hot encoding it and keeping it as one column with 1s and 0s
cobalt jetty
No. You're just adding a superfluous column in that case.
a column
1
1
0
would just become
1 0
1 0
0 1
nothing of value is added.
high badge
alright thanks
umbral sluice
I have a scenario where I have y as the row for amount which is either 0 or some value in USD. But most the values are zero like 80%. I am trying to under sample the y with
imblearn.under_sampling.RandomUnderSampler. But this accept bool or binary. So i tried converting the y to bool and it works.
But now my resampled y is a bool and i want to get the non zero values back.
I have tried the index for new resampled y but doesnt seem to be fine.
If someone could suggest something.
velvet thorn
umbral sluice
I have a scenario where I have y as the row for amount which is either 0 or some...
why not just undersample manually
 eternal haven
hey could anyone help me understand what this question is saying? i really don't get it
how does k means clustering give me 3 vectors for each language
is it talking about the distance from each point to each center?
velvet thorn
yes
 bronze barn
yes that would be my interpretation of it - the Euclidian distance to its cluster centre
eternal haven
ahhhhhh
well that explains it
love answering my own questions after being confused for hours
lmao
velvet thorn
umbral sluice
How can i do that?
undersampling basically just means taking a subset of rows
how would you subset a dataframe?
eternal haven
so i could obviously write an iterative function to get the euclidean distance of each point to the cluster center but is there a nice way to do it built into sklearn?
bronze barn
Can anybody help me modify the ticks so that they are centered on each colour and not straddeling two colours as in the case of the second tick.
Currently have:fig, ax = plt.subplots()
fig.set_size_inches(10, 5)
plt.scatter(Xcosinereduced[:,0], Xcosinereduced[:,1],c=y_pred, cmap="Dark2")
plt.colorbar()
velvet thorn
@bronze barn what do you mean "centred on each colour"
you mean you want one tick for each cluster's centroid?
on both x and y axes?
eternal haven
i might as well also ask about plotting here,
i'm trying to plot decision boundaries using contourf, this is the raw data
whole mica
cobalt jetty
What troubles are you having with Tensorflow/ML, <@!335796935170719744> ?
I don't use tnesorflow at all !
eternal haven
and i'm getting these weird artefacts
whole mica
@earnest herald Use Tensorflow! That is the answer i got!
eternal haven
whole mica
what in the world
eternal haven
ah lol
velvet thorn
let me think about this for a moment
eternal haven
yeah these ancient relics
velvet thorn
it's not a common problem
velvet thorn
oh hm maybe I'm wrong
I thought in particular for graphic distortions only "artifact" was correct but it appears that the British/American distinction applies to that too
🥴
bronze barn
velvet thorn
you mean you want one tick for each cluster's centroid?
Not sure if it's very visible but to the right of the graphic there are ticks to denote each cluster color. The ticks however are incorrectly formatted and should start with 0 (as the clusters are 0 indexed) and I want a tick positioned correctly at each color for the respective cluster.
eternal haven
oops i outed my br*tishness
velvet thorn
bronze barn
Not sure if it's very visible but to the right of the graphic there are ticks to...
ah, so you mean for the colourbar?
bronze barn
yeah!
velvet thorn
eternal haven
oops i outed my br*tishness
I use British English too
but there are some weird things
like I've never heard "programme" used for the computer kind
velvet thorn
bronze barn
yeah!
so plt.colorbar has a set_ticklabels method
look into that
@eternal haven this is a mega shot in the dark
but try plotting with antialiased=False?
or playing around with Nchunk?
those are my guesses
antialiased : bool, optional
Enable antialiasing, overriding the defaults. For filled contours, the default is True. For line contours, it is taken from rcParams["lines.antialiased"].Nchunk : int >= 0, optional
If 0, no subdivision of the domain. Specify a positive integer to divide the domain into subdomains of nchunk by nchunk quads. Chunking reduces the maximum length of polygons generated by the contouring algorithm which reduces the rendering workload passed on to the backend and also requires slightly less RAM. It can however introduce rendering artifacts at chunk boundaries depending on the backend, the antialiased flag and value of alpha.
velvet thorn
😦
sorry, no idea
this is one of the few questions I think you might need to ask on SO?
it's probably something to do with the rendering backend
what are you running MPL in?
Jupyter?
velvet thorn
try a different backend in Jupyter?
eternal haven
idk how to do that
velvet thorn
 boreal summit
<@171929073063297024> ✌🏿
boreal summit
<@171929073063297024> ✌🏿
why are you tagging me specifically
boreal summit
My book says sklearn's cross validation features expect a utility function (greater is better) rather than a cost function (lower is better).
velvet thorn
eternal haven
that just made the plot take up more space unfortunately
😦
okay, I'm tapped out I guess
sorry
boreal summit
Cause you the man I know.
velvet thorn
boreal summit
Cause you the man I know.
in general you shouldn't tag specific people to answer your questions unless you're in a conversation with them IMO
boreal summit
Ooh, okay. Sorry for that.
velvet thorn
boreal summit
What's the difference between a utility and cost function?
whether higher is better or worse
that's basically it
boreal summit
I just saw you were online which was why.
 sinful scarab
I'm using sklearn 5-fold crossval and for some reason, one of the model always perform terribly on the last score. Could there be any logical explanation behind this?
model: 1 hidden layer, 200 hidden units, 3000 epochs, ReLU activation
fit time [0.49169683 0.36597085 0.43397832 0.36899686 0.50506401]
average: 0.4331413745880127
std: 0.058700436539204856
train NMSE [-39.45858978 -44.70056506 -43.41979258 -53.12465407 -35.57709429]
average: -43.25613915709408
std: 5.880303506799056
test NMSE [ -97.75984664  -84.05016425  -74.77287089  -31.89081676 -145.84716218]
average: -86.86417214306005
std: 36.8073276536995
train r2 [0.82413865 0.84447483 0.84928377 0.80458722 0.88434569]
average: 0.8413660325143206
std: 0.02671729657875345
test r2 [0.68708343 0.6504056  0.6787764  0.85554167 0.0444955 ]
average: 0.5832605214992869
std: 0.2788604361617939
I have tried to run this a few times, and the last one is almost always significantly worse than the others
possibly resolved: I changed cv=5 to cv=KFold(5, True)
 somber torrent
i convert the strings into float but pandas display it in scientific notation
the number really isnt that big
how can i remove that?
 south minnow
Hello
Is there someone here that is experimented with opencv?
I REALLY need some help :c
Somebody?
please...
austere swift
just ask your question, you don't need to ask to ask
south minnow
I am having a problem with my libreries, not oly opencv
for some reason this error appers when I import something
Traceback (most recent call last):
File "C:\Users\usuario\AppData\Local\Programs\Python\Python38\lib\site-packages\numpy_init_.py", line 305, in <module>
win_os_check()
File "C:\Users\usuario\AppData\Local\Programs\Python\Python38\lib\site-packages\numpy_init.py", line 302, in _win_os_check
raise RuntimeError(msg.format(file)) from None
RuntimeError: The current Numpy installation ('C:\Users\usuario\AppData\Local\Programs\Python\Python38\lib\site-packages\numpy\init.py') fails to pass a sanity check due to a bug in the windows runtime. See this issue for more information: https://tinyurl.com/y3dm3h86
I really need someone to help me
austere swift
pip install numpy==1.19.3
austere swift
yeah windows changed the way their FPU functions work in version 20H2 which broke numpy 1.19.4
eternal haven
@velvet thorn actually, going back to the thing i posted originally... euclidean distance does not make sense because that returns a scalar not a vector...
do i just do the mean vector minus the cluster center vector?
or like, sqrt(x-y)^2
for each component
whole mica
does anyone know how to train neural networks
velvet thorn
@velvet thorn actually, going back to the thing i posted originally... euclidean distance does not make sense because that returns a scalar not a vector...
@eternal haven huh
what do you mean
like I don’t get the problem
eternal haven
so like
velvet thorn
oh
eternal haven
i have 22 mean vectors
velvet thorn
each vector is one point
eternal haven
yeah
velvet thorn
you have 3 cluster centres per language
eternal haven
exactly
velvet thorn
so you’re supposed to get the vectors representing the centres
eternal haven
..............................................................
...............................................................................
ok so that's almost making sense
the gears are turning
but there are only 3 cluster centers in total
velvet thorn
but there are only 3 cluster centers in total
@eternal haven huh
eternal haven
oh so i'm supposed to
ah
i see
right
yes
i separate the dataset into classes
me
i cannot believe it's taken me this long
 median dove
Hey guys. In the following code:
X_train=scaler.fit_transform(X_train) X_test=scaler.transform(X_test)
What is the difference between transform and fit transform? I am using StandardScaler of sklearn
eternal haven
transform transforms, fit_transform fits and transforms
median dove
I see some examples that both train and test use fit_transform
eternal haven
like
fitting means you fit the model to the dataset
you don't want to fit to the test dataset
austere swift
median dove
Hey guys. In the following code:
```py
X_train=scaler.fit_transform(X_train) X_...
fit_transform just combines fit() and transform()
so you fit it to the dataset and then transform the dataset and it'll return the transformed dataset
median dove
And when should I use fit_transform and when just transform?
austere swift
transform() is when the model is already fitted
eternal haven
^
median dove
because in some examples I see both test and train use fit_transform
austere swift
and you want to transform some data with the model
eternal haven
test should never use fit_transform
median dove

Learn Data Science for free through courses, practice on real-world datasets and discuss with leading domain experts and data science enthusiasts.
See block 14
eternal haven
oh
austere swift
thats a scaler
eternal haven
ok so that's a scaler, they're scaling up both datasets
austere swift
its transforming the dataset
its not doing any sort of analysis or modeling
if you look in block 16 where they have the svm, they use fit to fit it to the training set and predict to predict the testing set
median dove
Got it, I guess both of them are using fit_transform because they are different datasets?
median dove
Alright. Thanks for your help
eternal haven
oh god damnit
why am i getting IndexError: index -61 is out of bounds for axis 0 with size 22 when i try to draw a dendrogram
😡
ok so
the dendrogram is only letting me use a list of 22 or fewer vectors
i don't understand
oh
its the labels array
velvet thorn
median dove
because in some examples I see both test and train use fit_transform
you should scale the test dataset based on the parameters learnt from the training dataset
velvet thorn
austere swift
its not doing any sort of analysis or modeling
it is
calculating descriptive statistics is a form of (simple) analysis
the same principles apply
eternal haven
velvet thorn
you should scale the test dataset based on the parameters learnt from the traini...
are you sure?
wouldn't that make the test dataset more closely resemble the training dataset?
surely you want it to be independent
velvet thorn
eternal haven
wouldn't that make the test dataset more closely resemble the training dataset?
why do you say so
velvet thorn
eternal haven
because you're using the principles learned from the test set to scale it up
you shouldn't learn anything from the test set
that's the point.
eternal haven
well yeah but if you apply a transformation to the test set based on the training set
and then later use that transformed test set
it's going to have influence from the training set isn't it?
velvet thorn
eternal haven
it's going to have influence from the training set isn't it?
yes
which should be the case
eternal haven
but you're then going to use that to test the actual model
i don't understand why you'd want that
velvet thorn
because
your model is based on the training data.
okay, look at it this way
take the simplest case
of a linear regression
a linear regression assigns coefficients to each feature
and these coefficients are calculated based on a particular scale.
say your scaling is min-max normalisation
eternal haven
ah...
velvet thorn
and in the training set a particular feature has the range [0, 60], which will be scaled to [0, 1].
the coefficient for this feature is 3, which basically means that a unit increase in that feature will lead to an increase in the target by 1/20
now, imagine that this feature has the range [20, 120] in the test set.
this will also be scaled to [0, 1].
how do you think that would interact with your trained linear regression's coefficients?
that's the second point
and the last point is
imagine you go through this process of rescaling based on test data.
what if your test data consists of a single observation?
eternal haven
sorry, i was away for a bit
yes that makes sense
thanks
ok i think this is the last question for today:
i have four dimensional data i need to plot on a single bar graph
i could do this easily in excel but i need to use matplotlib so like wtf do i do lol
i'm going to actually try to do this in excel
see if i can get the lay of it
tabulating is easy
wow that was incredibly simple
so i want... two subpolts, each with two subplots of its own?

 honest parcel
Helloo
I wanna learn about data science and i dont know where to start
Can someone give me guide about what should i learn as a begginer?
 tight shore
 frail flower
If you have access to Pluralsight, use that.
 prime cloud
Hi I am trying to implement a MobileNet model using cifar-10 but I am only getting ~10% accuracy. Here is my architecture
Any suggestions? I am new to ML
 earnest meteor
Hi, using sklearn GridSearchCV, I use sklearn KNeighborsClassifier estimator, I was requested to do a benchmark, any ideas what do I need to test here?
desert oar
@lapis sequoia you should be able to solve that linear algebra problem w/ formulas from your coursework
@earnest meteor "benchmark" usually means "computation time"
ask for clarification from whoever gave you the task
earnest meteor
https://biodatamining.biomedcentral.com/articles/10.1186/s13040-017-0154-4 something like this

BioData Mining
The selection, development, or comparison of machine learning methods in data mining can be a difficult task based on the target problem and goals of a particular study. Numerous publicly available real-world and simulated benchmark datasets have emerged from different sources, but their organization and adoption as standards have been inconsist...
desert oar
@honest parcel eventually you will need:
- math: probability, multivariate calculus, linear algebra
- programming in python, especially using numpy, pandas, and matplotlib. also Excel and SQL, maybe R instead of python but we are in a python server...
- statistical & machine learning modeling
- data visualization
- hands-on experience with all of the above
so basically pick one and start there
@earnest meteor do you have more context for the specific request you got?
 steady harbor
Do someone happend to have any python code related to Langton Ant's theory using Matplotlib with the use of random also 😐
earnest meteor
@desert oar says: How did you validate your results? What kind of benchmarks do you have in your project?
I only have unit tests 🙂
with random faker data
desert oar
@earnest meteor what kind of project?
earnest meteor
because it gives me the output I want 🙂
desert oar
how do you know it's what you want?
let's say you put your recommender system into production serving 10k requests a day
how do you know it will continue to do what you want?
earnest meteor
That is the issue I don't
desert oar
then i'd say you have not benchmarked your model 🙂
perhaps the question might be better stated as "performance evaluation"
did you hold out a test set at least?
did you even learn about train/test spliting?
desert oar
i see
i dont understand this trend of courses trying to integrate machine learning without teaching people anything about it
its a real shame and it makes it very hard on students
earnest meteor
Actually people tend to learn top-down, so first they learn the goal they need to achieve, then they learn afterwards how to test stuff.
desert oar
...
 ripe forge
Here's the problem