#data-science-and-ml
1 messages · Page 232 of 1
 flat plank
I have simple cold start recommender using get_dummies then moved on run sentiment analysis using vader and topic modeling. I want to now combine the 3 dataframes and make a hybrid combining them and pointers as to the docs to read. Is this the right place to ask?
 paper niche
@tender wind So what you have is a list of JSON (raw data); whereas the training set should be a dataframe of features. E.g. you have an array of transactions per row; you would extract features like number of transactions, average transaction amount etc., and not input the entire transactions array into the ML model.
I would just map functions that extract individual features on the list of dictionaries (converted over from JSON), for example:
json_list = [...]  # your raw data (map `json.loads` on these if need be)

# define a few functions here to extract specific features from your raw data
def number_of_transactions(row):
    return len(row['transactions'])

def avg_transaction_amt(row):
    return np.mean([txn['transactionAmount'] for txn in row['transactions']])

# map these functions onto json_list and concatenate the results together
feature_list = [[f(row) for f in [number_of_transactions, avg_transaction_amt]] for row in json_list]
df_X = pd.DataFrame(feature_list)
Of course, plenty of ways to clean this up, but this is one possible way to approach the extraction process. Basically, the idea being to write functions, each function corresponding to 1 feature that you want to extract from the "raw data".
 lapis galleon
Hello, I am trying to add a column to a dataframe to later obtain the frequencies. However, when I add the column I get the following warning:
In[]:
a=FFMonthsXY[2] #FFMonths[2] is a dataframe
a.loc[:, 'count']=1
print(a.head(3))
Out:
X Y count
0 1 3 1
1 2 2 1
2 2 2 1
/usr/local/lib/python3.6/dist-packages/pandas/core/indexing.py:845: SettingWithCopyWarning:
A value is trying to be set on a copy of a slice from a DataFrame.
Try using .loc[row_indexer,col_indexer] = value instead``` acoustic halo
@dull turtle 175 images is a really small datatset, you really need a lot more than that, that's probably why it isn't working very well
infact if your program always guesses invalid image for everything, it would still have accuracy higher than 50%
if your validation set it roughly the same
 queen jungle
What is the best method for saving a sklearn model, what happens to me is that the model which I save to a pickle file, it's actuary is always different (usually for the worst) to its original value. To add when trying to find the best model possible and iteratively looping over the fitting of the model and have it save to a pickle file when the best one is found (this could mean .dumping a model 30+ times) I almost always receive the worst version of my model.
acoustic halo
Is the model so big that you cant just have a list of models?
queen jungle
Well the data it's using size is 575154.
I didn't know that was possible
acoustic halo
also i think sklearn recommends joblib, though it's effectively the same as pickle
And fwiw, if you dump a model, reload it and it is different, it's more likely you are dumping it wrong somehow
queen jungle
well I'm using the normal syntax and one placed on the sklearn docs python s = pickle.dumps(clf) clf2 = pickle.loads(s)
 tender wind
@paper niche That is a neat way to go at it. I am still wondering how to catch the relationship between the payment method used for a transaction among all the payment methods a user might have...
 pastel compass
What's a good way to the get the average of multiple vectors?
 lapis sequoia
OOh i have a good example! ```listOfVectors = [[1, 2, 3], [3,2,1]]
numberOfVectors = len(listOfVectors)
totalXTerms = 0
totalYTerms = 0
totalZTerms = 0
for i in listOfVectors:
totalXTerms += i[0]
totalYTerms += i[1]
totalZTerms += i[2]
print("Averaged vector is: " + str([totalXTerms / numberOfVectors, totalYTerms / numberOfVectors, totalZTerms / numberOfVectors]))```
Efficiency is 3 * O(n), where n is the number of 3D vectors in the list
not bad
 cursive sun
@pastel compass np.mean(np.array(listOfVectors),axis=0)
pastel compass
Thanks! @cursive sun @lapis sequoia
cursive sun
I think the more fun question is how do you average vectors that aren't in R^n
e.g. S^2
so if I gave you pairs of days of the month and hours of the day, e.g. [28,10],[31,8],[7,2], etc
how would you meaningfully talk about averages
like, what's the average time of day something happens
lapis sequoia
lol i forgot about numpy XD
i need to learn how to use that
i'm still so new to python
data science is sick
queen jungle
Is there something I'm doing wrong here?
 sonic goblet
I want to ask about tfidf vectorizer
suppose I have testing and training separate datasets
if i fit the tfidfvectorizer to training set only
can i use the vectorizer on testing set?
 tight stone
Hello,
I am currently working on a web-project (React) which takes in 2 images (simple shapes like a triangle or circle on a white canvas) as inputs, sends them to a backend (Python) where multiple samples are created by using randomized transformation-functions from opencv and then are finally used to build (compile) a tf.keras-model which is supposed to return probabilities on a 3rd image that determines as to how close it looks to the 2 input images and how much it does not look like them.
For example:
3rd image (circle) probabilities: 60% - input-image1 (circle), 30% input-image2 (square), 10% undefined
I know this is a lot to take in but my actual issue lies in the model that I compile.
While the model goes through its epochs it shows a stable increment in its growth, so, acc is rising and the loss is decreasing. Though, I still get very confusing results when I predict the probabilities. For some reason, my model sometimes returns probabilities that make no sense.
For example, I choose to draw a triangle and a square and predict my 3rd image where I draw a different triangle it sometimes returns something like: 9% triangle, 91% square.
And here I am now trying to understand these kind of results.
important note:
I have not worked on neural networks/machine learning before.
I also have limited knowledge about all the ways you can build a model for different kinds of cases. So, please excuse my lack of knowledge at this point.
I build my current model by watching a video from the youtuber sentdex with the title: Deep Learning with Python, TensorFlow, and Keras tutorial
paper niche
@tender wind hmm, I assume you mean you want to do the 'join' between transaction and payment methods. That would preferably be done during the raw dataset generation stage (i.e., place each payment method struct inside the transaction struct ) -- do you have any influence over the generation of this JSON data whatsoever?
if not, you could just implement the left / inner join yourself using pure python..
Is there something I'm doing wrong here?
@queen jungle you need to callfiton the CV object first before you can usetransform. Alternatively you can usefit_transform()which does both for you.
@tight stone maybe start by looking at all the artificial/augmented training examples that opencv is throwing out. and compare them visually with the 3rd image you're drawing.
 ripe forge
if i fit the tfidfvectorizer to training set only
@sonic goblet that is the only correct way to do it, yes. And yes you are expected to use it on both train and test.
 sullen glacier
@everyone
Just shipped something you'll like! 🚀
Highly recommend this free chrome/firefox extension as a must-have. It automatically finds code implementations for machine learning papers anywhere on the web (Google, Arxiv, Twitter, Scholar, and other sites)
https://chrome.google.com/webstore/detail/mlai-code-implementation/aikkeehnlfpamidigaffhfmgbkdeheil
or
https://addons.mozilla.org/en-US/firefox/addon/code-finder-catalyzex/

Code auto-finder for ML/AI papers, powered by CatalyzeX.com's repository used by thousands of engineers & researchers worldwide.

Download ML/AI Code Implementation Finder for Firefox. Code auto-finder for ML/AI papers, powered by CatalyzeX.com's repository used by thousands of engineers & researchers worldwide.
This add-on automatically finds and links open-source code implementations in-line on the cu...
 quasi cape
Any one new to Data science and want to practice , i am also in same situation and need someone to practice with
 leaden snow
@quasi cape yep ,
quasi cape
I am at very beginner level
leaden snow
@quasi cape oh , no worries
lapis sequoia
I know almost nothing about data science, but I'm willing to learn XD
I'm guessing it's generating statistics on data, but I'm not sure how useful that is XD
Unless the data is SUPER extensive, like to the point of violating privacy
Like recording what times a person is online, what they search on their web browser, etc
Then, I guess you could use that information to figure out what to advertise to them lol
ripe forge
see, that's not the only side of things that has data
taking your same analogy, i can either research every habit of a person.. or, quite simply, i just observe my own trends as a proxy
so, if i find that brand x sold more than brand y of some item, i dont have to research into the buying habits of my customer, i already have the evidence of what was sold
data science usually tries to work with the "indicators" that the business has, not stuff that is private to an individual
lapis sequoia
is anyone familiar with spark here
I'm wondering about the efficiency of processes
so, I know spark api's in python work at the spark level on the jvm processes
but python processes are also spawned .. and we have to maintain the data processing on the spark level
I'm wondering if using python functions def that encapsulate pyspark code slows done spark by adding overhead
 dull turtle
when i do batch size = 32 i am getting score= model.evaluate_generator(test_set) [14.239362716674805, 0.17073170840740204]
i am getting more loss and accuracy
dull turtle
what can be wrong happening here?
i am having droput (0.4), batch size = 32, epoch = 1500
 indigo steppe
b = np.array([[[1,2], [3,4]], [[5,6], [7,8]]])
print(b)
[[[1 2]
[3 4]]
[[5 6]
[7 8]]]
So this is a 3d array in numpy,right?It is 3d because of the [[5,6], [7,8]] being one dimension and the other arrays are the other two dimensions,right?
 ripe marlin
from sklearn.datasets import load_iris
from sklearn.neighbors import KNeighborsClassifier
from sklearn.model_selection import GridSearchCV
from sklearn.model_selection import train_test_split
import numpy as np
iris=load_iris()
knn=KNeighborsClassifier()
X=iris.data
y=iris.target
X_train,X_test,y_train,y_test=train_test_split(X,y)
knn.fit(X_train,y_train)
knn.predict(X_test)
TypeError Traceback (most recent call last)
<ipython-input-20-b2700a2c1e9a> in <module>
----> 1 knn.predict(X_test)
TypeError: 'numpy.ndarray' object is not callable
what's going on here?
dull turtle
now i am getting this way score= model.evaluate_generator(test_set) [11.011309623718262, 0.0]
when i do prediction on this it is predicting correctly
acoustic halo
@indigo steppe Every level you go down in a list effectively is a new dimension
so [1,2] is 1d, [[1,2],[2,3]] is 2d
a list of 2ds would be 3d
indigo steppe
Ok thx,but looking on the printed out result,could you tell the dimension?
the number of dimensions
acoustic halo
its 3d
indigo steppe
i am new to numpy so indexing and dimensions are a bit confusing to me
acoustic halo
if you print len(array.shape), that gives you a rough idea
indigo steppe
oh,cool,thx for the info
 pale thunder
array.ndim iirc
lapis sequoia
any kagglers here?
 topaz delta
Hi all, i am doing a project using regression on how to predict the forex market with information relative to covid-19 and was wondering if there was anyone i could discuss my logic with over a video call? id really appreciate it! do let me know 🙂 vivienneobrien.github.io / twitter: @iamvob
acoustic halo
@topaz delta hello fellow msc
 spare stone
Hi all
I'm trying to figure out how feasible it would be to leverage an open sourced social listening tool and some AWS credits to build word cloud trend reports
GitHub
Open Source Social Media Monitoring Suite. Contribute to openstream/open-social-media-monitoring development by creating an account on GitHub.
Willing to pay for consultation and/or work, just trying to scope out the project
acoustic halo
@spare stone It would be a relatively simple project but that repo is super old, I would imagine few of the APIs would be dead, especially major ones like FB or twitter
spare stone
that was a very limited search, mostly to validate that something like it existed.
Thank you for your input. Assuming there is an updated repo, this wouldn't be too difficult to pull off?
acoustic halo
If all you want is word cloud info based on time/date then yes
spare stone
I think so. I'd like to be able to look at different location parameters if possible. Would it cost a lot of amazon credits?
if I was looking at twitter for the whole US, for example.
 unkempt rapids
can i ask a web scraping question here?
acoustic halo
I think if anything, the twitter api will cost more than cloud credit
esp if you want to continuously scrape all US tweets every day
spare stone
hmm, maybe I could run it to only scrape tweets at intervals and only if they meet a certain amount of engagements...
I wasn't really thinking of using the API but a web scraper instead.
bc I have much more aws credits than I could use
acoustic halo
I'm fairly sure most scrapers will use a websites API anyway
 buoyant vine
its not really a scraper if its using a api lol
acoustic halo
tell that to tweepy, though admittedly thats the only "scraper" i have used
spare stone
I'm not entirely sure
buoyant vine
its also against twitters ToS btw
spare stone
I don't think that phantombuster does
I don't know how else they can keep getting away with the solutions they offer
well, if I'm not using their API that wouldn't be a problem, right?
acoustic halo
You'd probably be okay as long as you only got trends from the country you are actually in
Otherwise you need to also be logged in
buoyant vine
🤔 Why wouldnt you use the API if its availble
spare stone
because it costs dough
buoyant vine
one is very much against ToS and rule 5 in this server
and the other is put in place for people to use
spare stone
and I have a ton of aws credits if there is a way of open sourcing or licensing whatever phantombuster does
acoustic halo
If you limited what tweets you were after you would be alright
spare stone
wait web scraping is against ToS for this server?
 arctic wedgeBOT
5. Do not provide or request help on projects that may break laws, breach terms of services, be considered malicious/inappropriate or be for graded coursework/exams.
buoyant vine
you're literally webscraping the site lmao
spare stone
and I don't see how data scraping could be considered malicious, but I'm not the arbiter of that
buoyant vine
If sites dont want you doing it, you shouldnt do it
this being a partnered server those rules are heavy applied
spare stone
ahh, gotcha
buoyant vine
if it breaches any site's ToS we cant help you
spare stone
understood
buoyant vine

spare stone
appreciate the help thus far! Sorry I broke your rules!
sonic goblet
@sonic goblet that is the only correct way to do it, yes. And yes you are expected to use it on both train and test.
@ripe forge Thankss
tender wind
@paper niche I have no influence on how that JSON blob is generated
I will probably run a model generating features without joins and see where it lands
flat plank
I am new at data science looking for anyone to talk to about a toy project. I
made a simple hot-encoded cold start recommender, sentiment analysis and topic modeling on the same data set. The recommender table is 1.0 to 0.0 the sentiment analysis ranges from 1.0 to -1.0 and the topics are 1 to 7. When I got to make the hybrid I know I can hot encode the topics and add to the recommeder then maybe I sort by the pos or neg or the compound 0.8705}
pastel compass
So I am using this online corpus and the data is all in xml files. Does anyone know a good module for parsing xml files?
acoustic halo
@pastel compass ElementTree is built into python, I would start there
pastel compass
Thanks!
dull turtle
how i can get accuracy of CNN model? @acoustic halo
acoustic halo
@dull turtle Assuming keras, model.evaluate with your validation data returns the loss and accuracy
tight stone
@tight stone maybe start by looking at all the artificial/augmented training examples that opencv is throwing out. and compare them visually with the 3rd image you're drawing.
@paper niche So, did I get you correctly, to check if the randomly created samples are correct/close to the 3rd input image? I can do that through my frontend but visually you see differences between the samples and the input images.
Like, you can tell that the samples from input-image1 are triangles and the samples from input-image2 are circles but they don't look identical. My 3rd input image (the image I wanna identify) is basically like my first 2 input images except that I use it for identification.
 upbeat knot
Hello! I'm looking for a Python plotting library which allows for multiple dropdowns/widgets to filter data? Tried plotly but it looks like unless I use the ipywidgets library, I'm stuck with only one dropdown. Looking for something that is aesthetically pleasing, interactive and embeddable. Any help would be appreciated, thank you
 serene scaffold
>>> bools = token_idx != 0
>>> bools
tensor([[True, True, True, True, True, True, True, True, True, True, True]])
>>> torch.LongTensor(bools)  # causes error
any idea on how to get this as a long tensor?
looks like it's torch.tensor(bools, dtype=torch.float64)
acoustic halo
tensor.long()
 tacit brook
Guys i was trying to visualize a decision tree with the following code. But i am getting the following error
Can anybody please help me?
Error - https://pastebin.com/ABuT3iSQ
 lapis sequoia
I feel like I have seen you're github profile before @tacit brook, but I'm not sure
tacit brook
I feel like I have seen you're github profile before @tacit brook, but I'm not sure
@lapis sequoia ooh
I think you have seen the same dataset might be. Coz it has turned out to be a standard ds for decision tree lol
lapis sequoia
oh actually i found the profile I thought it was close to your name
its sdusmantha something
tacit brook
😅
tacit brook
😆
tacit brook
ok sure
@lapis sequoia https://paste.pythondiscord.com/ahapahovun.sql
Its a long error though
lapis sequoia
Omg lol im so stupid
sorry for bothering you i acidentally pressed alt + up
and now im in data science instead of #discord-bots
just realized
tacit brook

lapis sequoia
@tacit brook Sorry for bothering you I don't know that much about data science 😦 sorry
tacit brook
ya np
serene scaffold
        token_idx = token_tensor.unsqueeze(0)
        mask_idx = torch.tensor(token_idx != 0, dtype=torch.long).unsqueeze(0)
        segment_idx = torch.tensor([token != '[MASK]' for token in tokenized_text], dtype=torch.long)

        token_idx = tf.reshape(token_idx, (num_tokens,))
        mask_idx = tf.reshape(mask_idx, (num_tokens,))

        with torch.no_grad():
            result = self.model(token_idx, segment_idx, masked_lm_labels=None)
somewhere along the way, my tensors are being converted to a type called EagerTensor, presumably within the call to self.model
serene scaffold
huh I figured it out
 drowsy kite
Hey guys I got a really weird error after upgrading to python 3.8 and installing vs code (not sure if the two are relatable)
Basically my note book wont run now though
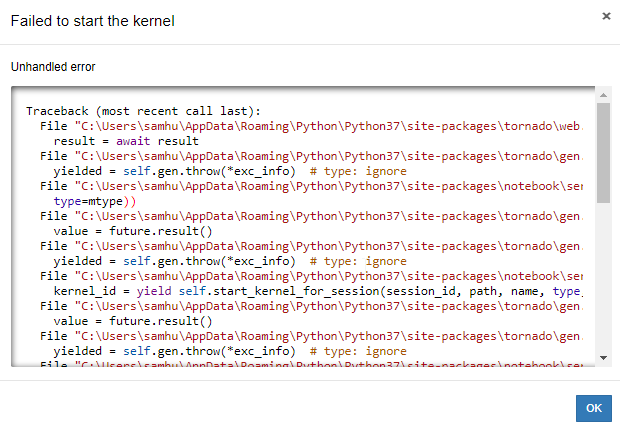
anyone ever experience something similar?
 shadow quiver
Hey guys. Using pandas, can I make this to give blue -> 0 in mercedes and volvo? I mean if a color doesn't exists for a brand, I still want to see it as 0 count
 hearty jewel
got a question regarding the following: my question is, i want to understand why were looking at the fraction of replicates that were LESS than or equal to the test statistic - in other problems, sometimes were looking at what was greater. Do you choose less than / greater than depending on the context of what you're testing?
so hold on
ive done some digging, and by definition, a p valaue is : p value = the probability of observing a test statistic equally or more extreme than the one you observed, given that the null hypothesis is true. so i looked at the ihst, and so what im always gunna do is look at the distirbution of the relpiactes and choose the extreme
??
im remembering from undergrad we'd look at the absolute value, and this is probably why
in this situation the test statistic was negative, so were looking at the left side of the curve
 rare portal
Hmm, has anyone worked with USGS` rdb files? I'm wondering if there's a pretty way to load a file with data from multiple sites into a dataframe.
I was thinking of using the to_datetime coerse option and dropna to do it, but that seems a bit hacky?
Here's an example image.
You can see that the data for each site is separated by a few lines of comments and a header column. The comments are not a problem, the issue is the header row and the nonsense row that occurs right after the header row.
I don't really want to hardcode which rows to skip, so I'm wondering if there's a better way to do this...
 undone needle
I have a quick question if someone is able to help.
I'm looking for a library that will allow me to not only build a heatmap with a few given points, but also let me sample points on it.
For example, I would like to have some points (2, 3) = 4; (5, 2) = 10; and (10, 10) = 1. I would like to be able to sample something like (5, 5) to get what value could be expected. It's something like FEA, but with an arbitrary arrangement and number of points.
I've found ways to plot heatmaps, but not a way to query interpolated points.
tacit brook
I think with plotly its possible. But im not 100% sure abt it
 flat quest
if there is indeed always a few lines of comments and a header column
you could get the indices of those points and split the dataframe based on those indices @rare portal
paper niche
to check if the randomly created samples are correct/close to the 3rd input image? I can do that through my frontend but visually you see differences between the samples and the input images.
@tight stone I guess my general point was to try and characterize the mistakes made by your model. i.e., is your model always confused by a specific 'pattern' in your 3rd image? Or is it when you trained with a triangle+square drawn in a particular way, then it makes a certain kind of mistake, but not when you train with a differently drawn triangle+square. Etc.
Basically if I understand you correctly, during training, your model only sees the 2 images + their augmentations, so if you're perplexed by why your model is so confident in guessing square when the 3rd image is a circle, could it be that it somehow saw a circle-like image that was generated by opencv but is labeled as square during training? Maybe opencv's transformations rounded the corners of your square, etc.
There are no magic solutions here. Try to first characterize under what circumstances your models are making mistakes; then I would say half the battle is won.
dull turtle
hello guyz i have a CNN code
 umbral aspen
Hi guys are there any helper libraries or something to help choose the learning rate when using tensorflow/keras? Curious to see if there is something out there before I dive into some more complex code examples...
acoustic halo
You tune the learning rate via the optimizer in keras
 minor sapphire
hello! i have this problem to solve. I need to find the first occurence of a sum of 2 integers in an array that equal a certain value. What is a good algorithm for that? i need it to be efficient so it can search a list of 10,000,000 elements. Thank you!
 tame basalt
@minor sapphire maybe consider looking at a generator object with next(i for i in list if i == sum) or using filter(function, list) also try out different stuff with timeit to test efficiency
quasi cape
All remaining properties are passed to the constructor of
the specified trace type
(e.g. [{'type': 'scatter', ...}, {'type': 'bar, ...}])
any one know how to over come this error in Choropleth
minor sapphire
@tame basalt gonna check yout the filter function. And yeah good idea, i even forgot about timeit module. Gonna check it out
umbral aspen
You tune the learning rate via the optimizer in keras
@acoustic halo Hmm ok - I found this which seems to make it quite straight forward: https://github.com/keras-team/keras-tuner - would that be a good approach?

GitHub
Hyperparameter tuning for humans. Contribute to keras-team/keras-tuner development by creating an account on GitHub.
 white wave
guys, data science is just consist in data field?
 nova timber
Hello, I'm working with python 3.8.3, Im trying to install tensorflow but it won't work, can anyone help please?.
lapis sequoia
@nova timber use Colab, tensorflow comes pre-installed
and it has a free gpu/tpu environment if you ever need it
 stable cave
Hello I have a problem with scipy.interpolate.splprep.
I am getting an ValueError less than 1% of the time in my program and I'm not sure why. I am using it to get points on a curve between two points random points on my screen.
The function https://paste.pythondiscord.com/iqekupolot.py
Error (couldnt get entire traceback, it was too far back in the terminal): ```
File "/home/johan/repos/chanscape/venv/lib/python3.8/site-packages/scipy/interpolate/fitpack.py", line 156, in splprep
res = _impl.splprep(x, w, u, ub, ue, k, task, s, t, full_output, nest, per,
File "/home/johan/repos/chanscape/venv/lib/python3.8/site-packages/scipy/interpolate/_fitpack_impl.py", line 279, in splprep
t, c, o = _fitpack._parcur(ravel(transpose(x)), w, u, ub, ue, k,
ValueError: Invalid inputs.
It happens on this line in the function: `tck, u = scipy.interpolate.splprep([x, y], k=degree)`
Example values when fail: ```
x=[702 708 708 714] y=[145 139 139 133] k=3
that's because you have consecutive duplicate values in your x and y
 real hollow
Happy 4th to all of you from overseas 🥳
I wonder if any of you guys would like to recommend some resources to learn making a custom NLP sentiment analyzer with python
arctic wedgeBOT
Pasting large amounts of code
If your code is too long to fit in a codeblock in discord, you can paste your code here:
https://paste.pydis.com/
After pasting your code, save it by clicking the floppy disk icon in the top right, or by typing ctrl + S. After doing that, the URL should change. Copy the URL and post it here so others can see it.
dull turtle
File "E:\paymentz\image_save_api.py", line 194, in trainmodel
model.fit_generator(
UnboundLocalError: local variable 'model' referenced before assignment``` knotty moon
I think i solved the 2 generals problem
 rough umbra
Not sure if this goes under data sience but i'm trying to pull a image url from a website and i am able to scrap the website down to finding the url but i'm left with a long HTML content i noyl want what's inside "image url here" however i'm ot sure how and here is my code:
I'm left with this html content but i only want what's inside the blue marker
umbral aspen
@rough umbra I would not consider that data science, but you can try this link from stackoverflow: https://stackoverflow.com/questions/2612548/extracting-an-attribute-value-with-beautifulsoup

Stack Overflow
I am trying to extract the content of a single "value" attribute in a specific "input" tag on a webpage. I use the following code:
import urllib
f = urllib.urlopen("http://58.68.130.147")
s = f.re...
rough umbra
Alright, thanks for letting me now and the link!
 robust dome
Hey just a quick question. what is a boolean tatement that I could use to tell if something is in a list
or a graph
 dawn turtle
 hoary breach
Hey I got a quick question-- when setting up my jupyterlab notebook, the function time does not work. any idea why? Am using arch, conda and pip are both up to date.
 woeful kelp
Same here but I have a very specific question regarding 2D arrays
flat quest
just ask the question lol
dull turtle
hi guyz i have a code which saves a image in training folder and then it starts training a CNN model
when training completes it gives "loss" and "accuracy"
i want to save a CNN model on the basis of loss and accuracy
now i want that if "loss < 0.05" and "accuracy > 85 %" then only it saves a model. otherwise it again retrains a model
i am having two functions in it def trainmodel this function contains training a CNN model and def post this function contains image saving part
 toxic hound
tf.Tensor([[ 101 1192 1132 1177 103 119 102]], shape=(1, 7), dtype=int32)
how do i get ([[ 101 1192 1132 1177 103 119 102]]
from this
 dusk osprey
how do you guys share models across AI applications?
lapis sequoia
Guys im planning to make a word predictor using rnn which predicts the next word based on prev sentences, but how do you manage with the time steps? For example i'd train the model with n time steps but what if the input has different time steps?
Im assuming, we truncate the array if it has more than n time steps but what if its lesser than n
Please Ping while replying
 ivory plank
@lapis sequoia You only use what you know, so while you should worry about how that affects your predictions, you shouldn't worry about the model itself
You're probably looking at using an LSTM for next word prediction
lapis sequoia
yes
im thinking off using a time step of 5
alright ty, ill ask help again incase i face any prob
ivory plank
You should really look at how RNNs and LSTMs work to understand the answer to your question tho @lapis sequoia
lapis sequoia
i have watched few vids, explaining them
on an intuitive level
cause i dont really know the math behind lstm or rnn
is it like those valves which control the flow of info?
from one layer to another
i was thinking of using a 0 for filling sentences which have less than n time steps
and incase its more i'd take the last five words
ivory plank
that's generally how that works, but you don't have to explicitly do that yourself
the model dimensions aren't a problem
lapis sequoia
oh okay
ivory plank
Well that's not entirely true; you do have to set up your code with the correct shape and then do it but I don't think that's the same as what you think you're doing
I really encourage you to check out medium posts on lstms and next word prediction
you'll get a much deeper understanding by looking at the code and the math of an lstm
ivory plank
The short answer is what you think it is; you'd pass an empty spot. But the solution to this problem is built much deeper into the architecture and the input (with distinct end and missing states) than that. You should look closely at an LSTM to really understand how that works @lapis sequoia
lapis sequoia
if u dont mind, for reference can u give a link for a medium post?
flat quest
@lapis sequoia for dealing with timestep issue. The general methodology is to make the seq_len the mimimum viable length to fit all the input sentences. For any sentences that are less than you're required seq len, you pad them with 0's.
As for the mathematics behind RNN's and LSTM's, I'd suggest reviewing those and actually understanding the inner workings. It'll help explain why your accuracy for text generation will be fairly low (which it will be)
lapis sequoia
oh okay, so does that mean there are better ways to deal with this problem?
lapis sequoia
okay thanks
 unreal shoal
thanks, I have now deleted my reply.
serene scaffold
have fun!
unreal shoal
ty
serene scaffold
I currently have a project where I get a vector representation of a phrase after passing it through BERT, and then I find the nearest neighbor to the BERT vector in an entirely separate vector space. Obviously the outputs are initially meaningless, but the goal is to discover the mapping between the two vector spaces.
My advisor told me to use a feed forward neural network
All I've really done so far is speed up the nearest neighbor search using a KD tree.
robust dome
does anyone know how to make python print elements that are common in a list?
 rancid brook
not data science
 cinder pilot
@serene scaffold why do you even need a neural network for this?
or I didn't get you
serene scaffold
it could be that the problem is solvable without them
cinder pilot
as far as I know the problem of the nearest neighbors is solved with plain algorithms, not neural nets
kd-trees, as you mentioned
but I might understood you wrong
serene scaffold
are you familiar with word embeddings?
cinder pilot
a little bit 🙂
serene scaffold
so we have word embeddings that were created from a large body of medical literature
and embeddings that represent labels that certain words and phrases get to place them in an ontology
they're called concept unique identifiers. I'm not entirely sure how they were created.
The assumption is that if CUIs represent a number of similar terms, then you can find a mapping between the two semantic spaces
cinder pilot
I need to check this out and think about it a little bit
serene scaffold
I'd appreciate your help. I can also talk to my coworkers tomorrow.
Feel free to DM me
cinder pilot
well, I have never faced such a problem before
so my answer will depend on how much you know about neural networks
if you are familiar with them and want to hear a concrete architecture/approach that is the best and most used for your type of problem then I am unable to help you there, sorry
but if you are absolutely new to NNs then I can tell you that this problem seems like neural nets are able to solve for sure
as far as I understood it it's just a mapping between n-dimensional space and m-dimensional space. A function. And neural nets are good at approximation of functions
ripe forge
Well put. I think a neural network should be able to do this task no problem
More concretely, do you have a set of "answers" corresponding to your Bert vectors in this new space?
Basically if you have the representation of your inputs in this new space, or a set of vectors that are close in this new space, you're simply trying to predict the new vectors from Bert vectors
The network then hopefully ends up simply learning a mapping inherently by doing this task
cinder pilot
what I see as the most simple and obvious approach that comes to mind: your network has an n-dimensional input layer and m-dimensional output layer (and, of course, layers in between them). If I understood it right you already have labels for input embeddings (so, it's supervised learning) otherwise I can't say (I am not familiar with unsupervised NNs at all). And that becomes just a common deep neural network
ripe forge
How well it works you'll just have to see and tweak. But you need this kind of pairs as your training data
cinder pilot
But, again, I am not familiar with these type of problems and seems like mapping between 2 semantic spaces should be deeply known and explored by now, though quick googling didn't give anything useful
Sorry if it's not what you expected and not a thorough explanation 😦
flat quest
if you have both inputs and output vectors that you'd like to map to each other
NN's should do just fine, as long as the training data is there.
serene scaffold
if you are familiar with them and want to hear a concrete architecture/approach that is the best and most used for your type of problem then I am unable to help you there, sorry
@cinder pilot I don't really know very much about neural networks even though I've seen all those network diagrams. I've taken linear algebra though.
But, again, I am not familiar with these type of problems and seems like mapping between 2 semantic spaces should be deeply known and explored by now, though quick googling didn't give anything useful
I have a paper where they did exactly what I'm trying to do but the part about the neural network was vague.
tight stone
@tight stone I guess my general point was to try and characterize the mistakes made by your model. i.e., is your model always confused by a specific 'pattern' in your 3rd image? Or is it when you trained with a triangle+square drawn in a particular way, then it makes a certain kind of mistake, but not when you train with a differently drawn triangle+square. Etc.
Basically if I understand you correctly, during training, your model only sees the 2 images + their augmentations, so if you're perplexed by why your model is so confident in guessing square when the 3rd image is a circle, could it be that it somehow saw a circle-like image that was generated by opencv but is labeled as square during training? Maybe opencv's transformations rounded the corners of your square, etc.
There are no magic solutions here. Try to first characterize under what circumstances your models are making mistakes; then I would say half the battle is won.
@paper niche Sorry for answering so late.
This is indeed a good argument and clue to solve this issue of false classification.
But this is apparently not the case. I send their transformed samples back to the frontend, so, the user can actually check them themselves.
There were also cases where I used a triangle and circle as inputs.
Even there were cases where the neural network identified the triangle as a circle.
The image shows how my application looks like.
I marked which shape-probability belongs to which canvas.
The 3rd probability is not set at the moment because I don't know how I would implement that properly.
flat quest
did u make the classifier yourself @tight stone or ur using a classifier a company has already built?
tight stone
I made them myself if I got you correctly.
If the classifier is the number of the input-canvas'/-image that is used for the neural network.
flat quest
classifier would be the neural network itself
@tight stone
tight stone
Ah, sorry, I made the neural network myself @flat quest . I didn't use anything that was already built.
flat quest
yeah was thinking itd be weird if an already existing model was performing that poorly.
how does the model do on training data? @tight stone
 potent nymph
I have a list of student dictionaries read in from a CSV file
Each student dictionary looks like this
{"Name": "A", "Email": "email@email.com", "Gender":"Male", "Homeroom":"Mr X's class", "Nationality":"American"},
The goal is to create groups based on gender, homeroom or nationality
So the user will specify the number of groups, say 3 groups
And it needs to create groups with even numbers of male and female students
e.g. something like
[MALE, MALE, FEMALE], [FEMALE, MALE, FEMALE], [MALE, FEMALE, MALE]
i.e. no groups should have all males or all females if it can be avoided
How can I do this?
rancid brook
You could fill the males one by one into each group then the females after
Like put one male into each group, then if you still have some left do that again, until you are out
Then females go in after
@potent nymph
cinder pilot
@serene scaffold can you share this paper?
dull turtle
!pastebin
arctic wedgeBOT
Pasting large amounts of code
If your code is too long to fit in a codeblock in discord, you can paste your code here:
https://paste.pydis.com/
After pasting your code, save it by clicking the floppy disk icon in the top right, or by typing ctrl + S. After doing that, the URL should change. Copy the URL and post it here so others can see it.
paper niche
@tight stone Nice app. Very reminiscent of QuickDraw and the likes.
Hmm, apart from the training performance that @flat quest brought up, I'ld also be interested to hear about the general architecture that you're using. I'm assuming some variant of CNN. Intuitively, one would expect the NN to pick up on (in the case of triangles vs circles) the fact that one has 3 vertices / pointy-areas whereas the other does not.
If you visualize the convolutional filters, you might get some sense of what your model is actually learning. (there was something like this for the MNIST dataset; but I can't quite remember which site it is anymore)
If it were me, I would just stick to 1 model first (say, the one that you showed in your image that learnt from triangles and circles), and attempt to debug on that 1 model.
- what kind of drawings is the model prone to getting wrong? Do some tests on a bunch of different drawings. Maybe triangles with very wide bases are being misconstrued as circles. Or maybe it's confused by right-angled triangles Etc.
- Similarly, the flip side: what kind of drawings is your model prone to getting correct?
Then dig deeper into & visualize the filters the model has learnt. Which pixels are getting picked up as "important" for the classification task?
 charred ocean
I have a question. Is C# effective for data analytics ? Does anyone have any insight on this ?
pale thunder
from what I understand, data analytics are done mostly in python, java, domain specific languages like R and Julia, and sometimes JS. Never heard of C# in the domain
 slim fox
@pale thunder did you recently got promoted to helper? Grats 😉
pale thunder
I did indeed
slim fox
nice 🙂 On the topic, I see that Scala is also a language that seem to get more and more traction in data related stuff
 manic bronze
I have a question. Is C# effective for data analytics ? Does anyone have any insight on this ?
@charred ocean better go with python
lapis sequoia
hi, i'm beginner with data science with phyton. Welcome any advice or recommadation
 steel roost
@lapis sequoia definitely recommend Pandas, bs4, and the requests library
steel roost
I learned from youtube and did used random data from kaggle
i even went a step further and made charts from the data i extracted
lapis sequoia
@steel roost can you give best tutotrial on youtube, please
 calm scarab
Hi guys, I am strugling to find a job as a data scientist. Are there any professional data scientist working in Europa, Asia, or USA? I want to send my CV and if he/she can check fastly and give some advises about CV and projects I did or should de to improve my change. I really need it, and if someone help me, I would be reeeealy appreciated.
steel roost

Data used in this Tutorial: https://github.com/KeithGalli/pandas
Python Pandas Documentation: http://pandas.pydata.org/pandas-docs/stable/
Let me know if you have any questions!
In this video we walk through many of the fundamental concepts to use the Python Pandas Data Scie...
@lapis sequoia
lapis sequoia
@steel roost Thank you very much
steel roost
no probelm @lapis sequoia
 modest blaze
Hi all, Im a bit of a noob here in python.. I'm trying to plot all my cycling rides in matplotlib so I can create a "year in review"..
This is what i have so far, but the scale or aspect ratio doesn't seem to be maintained like it does on a map
ideally, each subplot would be 1x1 (inches), but I think I need to normalize the lat/longs somehow to do this
anyone have any ideas on how to achieve this?
serene scaffold
@cinder pilot I only have the abstract and some diagrams that they made. This one describes their whole pipeline
They calculate the cosine distance from the BERT output to every single vector in the CUI vocabulary, which was taking forever even with 40 CPUs working concurrently. I sped it up with a KD tree.
ripe forge
Use the r flag for the string. r'C:yourpath'
 chrome barn
df = pd.read_csv('c:/test/file.csv')
/ instead of \ and also specify the file you want to load
chrome barn
probably you mean pokemon_data.csv instead of cvs
lapis sequoia
@chrome barn Thanks,
lapis sequoia
does anyone know how to remove a commit i mistakenly made to a a specific branch
flat quest
have you pushed the commit yet?
lapis sequoia
yea
im new to git :/
i accidentally pushed it to several branches when i meant to do it to just one
 limpid oak
Hello everyone, I'm new to this server, sorry for mistake, I have one problem for that I have to submit solution tommorow
I have to find solution for making polygons from list of cordinates
 spark stag
this isn't really data science and we can't help with examined/school work because of
!rule 5
arctic wedgeBOT
5. Do not provide or request help on projects that may break laws, breach terms of services, be considered malicious/inappropriate or be for graded coursework/exams.
spark stag
you may have better luck in a help channel then because this doesn't really sound like data science
limpid oak
'[{"position":0,"Latitude":19.334445,"Longitude":77.2685681},{"position":1,"Latitude":19.3344453,"Longitude":77.2685673}]'
how to get this seprated (split) to make pandas DataFrame
or any other solution
lapis sequoia
can someone help with git?
i accidentally pushed files to the wrong branch and im trying to remove them from appearing
 uncut shadow
Well, that's not a python question and not a data science question
serene scaffold
@lapis sequoia take a look at #tools-and-devops
lapis sequoia
thanks
serene scaffold
@limpid oak see #❓|how-to-get-help
cinder pilot
@serene scaffold well, they took SciBERT model that is a better trained version of BERT for science. Then they add additional layers right after the output of SciBERT. To be more accurate they use average pooling, then fully connected layer (with tanh activation function) to CUI-sized layer. I am not familar with cosine similarity and how it can be applied there, so I'm unable to describe this layer but then they use softmax fucntion which gives you the probability
So, after you add these layers you're going to have to train this net again a little bit on your particular problem and dataset
I think I can't explain it more detailed
But I can say what you need to try to google: BERT fine-tuning, adding layers to pre-trained networks and maybe transfer learning
serene scaffold
@cinder pilot Thanks! I'm busy with something else today but I plan to dive into this some more pretty soon
tight stone
@flat quest @paper niche
These are some images about what my model is made of and how it performs in general.
It usually starts to looks acc on epoch 7 but I have also seen cases were it rises in acc even after epoch 7 - that's why I put in the EarlyStopping.
Usually, my training-curve for acc rises just like that. The same goes for the training-curve for loss. The only issue is that my val_acc-/val_loss-curve never really fits because it randomly seems to be good or bad.
Nice app. Very reminiscent of QuickDraw and the likes.
Thanks, I actually didn't know about QuickDraw hahaha.
If it were me, I would just stick to 1 model first (say, the one that you showed in your image that learnt from triangles and circles), and attempt to debug on that 1 model.
- what kind of drawings is the model prone to getting wrong? Do some tests on a bunch of different drawings. Maybe triangles with very wide bases are being misconstrued as circles. Or maybe it's confused by right-angled triangles Etc.
I did a bunch of tests with various forms but the results do not differ that much.
Though, what I realized was that it sometimes guesses things wrong depending on where I am drawing on the 3rd canvas. For example: It guesses most of my triangle-drawings right but, suddenly, guesses my triangle wrong because I drew it in the left corner of the 3rd canvas.
Maybe that has something to do with my randomly generated samples?
- Similarly, the flip side: what kind of drawings is your model prone to getting correct?
None in particular. Probably because my neural network is build whenever both input images are drawn and a number of samples is set.
So basically, every time I draw my 2 input-images, set the number of samples and start generating all the stuff (samples+NN) I create a brand new neural network.
Then dig deeper into & visualize the filters the model has learnt. Which pixels are getting picked up as "important" for the classification task?
I really didn't find any help while googling for that. Would you be so kind to tell me as to how I can do that? Whenever I search for visualizations of my layers/filters I just articles as to why I should do that but not how I do it.
@paper niche
modest blaze
I have a list of dataframes with 2 columns in each df, what's the best way to get the max value from the list of dataframes per column?
 chilly geyser
Do you want the max per column or
modest blaze
I want max value across all dataframes of a given column
chilly geyser
I'm not sure if combining the DFs then max is faster or if you get df-by-df-max, then take column-max over that is better
But those are the two ways I'd do it
modest blaze
i have the latter, but was curious if there was a more "pythonic way" using list comprehension/zip maybe
chilly geyser
I can't get a python-yet-good way of getting it for both columns
This is what I have if you want the first column
max(map(lambda x:x.max(), df_list), key=lambda x:x[0])[0]
But I think it's a lot better to do this:
df_list = list(DataFrame(uniform(size=(10, 2))) for _ in range(5))
num_cols = df_list[0].shape[1]
col_max = [-float('inf') for _ in range(num_cols)]
for df_max in map(lambda x:x.max(), df_list):
    for idx in range(num_cols):
        if col_max[idx] < df_max[idx]:
            col_max[idx] = df_max[idx]
print(col_max)
So if you have and want 40 columns you don't iterate through it 40 times unncessarily
Oh and uniform is a numpy.random func while DataFrame is from pandas
^This is assuming you want col 1 max and col 2 max by the way, even if they are different members of df_list
flat quest
you don't want to use pythonic methods when dealing with datasets. Python lists are terribly slow compared to matrix operations @modest blaze
@tight stone. What are the class distributions for your dataset? roughly even in circles and triangles?
 lusty coral
hey guys
is it possible to relate two same shaped numpy arrays with each other?
relating because i want to preserver order of data
one arrays is [4, 5, 6] and the other [33,44,88]. but first elements of each array is related. how can i preserve it that way?
flat quest
not sure what you're exactly trying to do
You're trying to relate them in what way?
lusty coral
yeah they are related to each other, i dont want to store them in a single ndarray though
they'll be separated but i want to know the "indices" of the arrays as i calculate different things you know
i know i can use dataframe and series and stuff but numpy is like millions of times faster in my case where i iterate over rows of data and do calculations with them
using their order @flat quest
order of existence
i dont know if that s the right term 😄
 spice widget
If I have query regarding python for finance, can it get solved here? It's a pretty basic doubt
hearty jewel
lol why does the imputer argument for axis have axis=0 meaning columns, when in every other API it is axis=1 for columns
 safe tapir
Is there an explanation for models that make sense only on the margins?
For example, suppose I have a stock picking model which selects the top N stocks for a time period. For the universe of stocks, there is poor R^2, but the edge cases seem to perform well in backtesting. Is it acceptable to use the model, or is it biased?
flat quest
er xd i still didn't get how ur trying to relate them. @lusty coral
like 4 is related to 33, 5 to 44, and so forth?
tight stone
@tight stone. What are the class distributions for your dataset? roughly even in circles and triangles?
@flat quest Em, I am not sure if I got your question completely, sorry.
I usually have the same amount of training data for each image. So, for example, 20.000 for input-image1 and 20.000 for input-image2. But there are very few cases where my randomized image transformation fails. So, there might be cases where I have 19.980 and 20.000.
chilly geyser
I assume the question is asking if the classes are balanced
But more directly the full distribution would be the exact percentage of each class
Imbalanced classes creates problems
tight stone
They are. At least that's how I set it up.
paper niche
@tight stone
I really didn't find any help while googling for that. Would you be so kind to tell me as to how I can do that?
Something like https://machinelearningmastery.com/how-to-visualize-filters-and-feature-maps-in-convolutional-neural-networks/; the general idea is to extract out the weights of the conv. layers and visualize them on a heatmap. Or extract the output after 1 convolution to see what has been done to your original image by each of the learned filters.
But I realize your architecture is just a feed-forward NN. Have you tried your luck with CNN's yet? You might try to visualize the dense layer weights that you have via the method above, but I'm not sure that you would find the model is learning anything intuitive (to us humans) from your images (like a 'triangle' has 3 vertices as opposed to a circle having none). CNNs are more suited for such feature extraction tasks. (or rather, tasks that rely on the NN learning specific spatial features like the existence of straight lines, or pointy-ends or what-not).
Maybe that has something to do with my randomly generated samples?
How much 'variety' is there in your augmented samples? What kinds of augmentations are you doing? You generate 20k different images from a single one, if there were all just translations of each other, you can imagine it wouldn't do much in helping the model to generalize to your '3rd' image (the test set), if it were a slightly deformed triangle or smth. It's an extreme example, but you get my drift.

Deep learning neural networks are generally opaque, meaning that although they can make useful and skillful predictions, it is not clear how or why a given prediction was made. Convolutional neural networks, have internal structures that are designed to operate upon two-dimens...
tight stone
@paper niche No, I haven't tried CNN's yet. I used this kind of model because I just happened to see that in one youtube-video where somebody used it for the mnist-dataset.
But I get the point why a CNN would possibly suit this case better.
Thanks for the link, I will give it a shot.
I use 4 different transformations: perspective transformation, translation, scaling and rotation.
Also, I use them randomly. So, there might be a transformed image that has gone through all 4 whereas there might be another image that has been translated, scaled and rotated. The order of transformations is also random.
I will just try out a CNN and see how this behaves.
flat quest
make a test set
@tight stone don't train on this portion of the dataset.
Once you're done training with the test set, try evaluating on the test set. That'll tell you if the model is just screwing up on that single image, or for the other images as well. Convnets will boost performance, but ffn should do decently well
 ebon nebula
Hello all. Can someone recommended me a book/site/app where I can start studying Data Science. (Beginner level)
 hardy shale
@ebon nebula
https://www.freecodecamp.org/learn
They have a large section of material on Data Analysis which introduces you to Numpy/Pandas/Jupyter, even data cleaning. From there you can move on to the projects themselves and they even have a course over data visualization with D3. You can even get into ML as well

Learn to code. Build projects. Earn certifications.Since 2015, 40,000 graduates have gotten jobs at tech companies including Google, Apple, Amazon, and Microsoft.
ebon nebula
Thanks !!
 cunning furnace
Not sure if this is the correct channel. What module does this look like?
uncut shadow
what do you mean
chrome barn
probably which library was used to create the graph, hard to tell from the graph but to get create such a graph look into popular libraries like matplotlib and ploty for example and look for 3d plots into the documentation of these libraries
lapis sequoia
@hardy shale thanks
 robust marsh
where can i find some good tutorials about Dash? i have no experience with plotly only know bare basics about html enough to write my flask app
tight stone
@flat quest So, I should have a completely separated set just for testing?
Isn't the validation_split already doing this?
Or are you talking about pinpointing my mistake by using a training set that is not bound to my web-application (for example by using Jupyter Notebook)?
safe tapir
Is there a way to get a "rolling" timeseries split?
In traditional TS split, you get this behaviour:
[0], [1]
[0, 1], [2]
[0, 1, 2], [3]
[0, 1, 2, 3], [4]
I want this behaviour:
[0], [1]
[0, 1], [2]
[1, 2], [3]
[2, 3], [4]
 astral scaffold
hi, do you have any reference for sound classification using deep learning? thank you
 pure axle
Hi Guys, I got an interview coming up for a Data Analyst role, i applied for, I have been told that I will be given a dataset and within half an hour i need to analyst and produce a report. I am still working on my learning and analyzing skills. Could someone give me example, what kind of analysis one can carry out on a simple data set? Thank you in advance.
chrome barn
it really depends on the kind of dataset they will give you and the tools that are available for you to use they have given you any information about that
pure axle
Thank you for your response. I haven't been given any information other than , I am told that I will be doing an unseen Task (30 min) at the start of the interview and I will be emailed the task- my guess is since it will be emailed to me it could be a dataset on an excel spreadsheet. The data set is in the Health and Safety Directorate of Transport authority i am currently working with. So dataset may contain some information on Health & Safety elements.
I will appreciate any advice or even example of what kind of simple ..may be a universal analysis I can carry out. Thank you.
chrome barn
ah oke so it is a remote test only with a 30 minute time limit after which you have to send it back, i am not really domain knowledgeable about the industry your operating in so it will be hard to give specific advice for that but have you experience with working with datasets and drawing conclusions from them?
chrome barn
if you want some dataset to practice with: use your favorite search engine: search for the tableau super store dataset it is an excel file. Open the file in excel or python and try to make some meaningful graphs and tables with the data. If you are stuck on what to do, or need some inspiration, search again with your favorite search engine and this time for tableau public dashboards that make use of the super store dataset to get a feeling of what kind of dashboard/graphs that can be made with the data and what questions they try to solve (sales per state, sales over time, etc), good luck with your interview
 spare lotus
Does Python have a way of fitting a stable distribution like Matlab's StableDistribution? I've found this https://erdogant.github.io/distfit/pages/html/Parametric.html#distributions and it has levy_stable, cauchy and norm distributions, but all of these have the alpha parameter fixed. Matlab can fit the alpha parameter as well. Is there a way to do this in Python?
 limpid raft
Can someone recommend a site to learn about convolutional nets?
chrome barn
you could check out fastai and check if it is your cup-of-tea of learning style and what your looking for
limpid raft
I'll take a look at it, thx
flat quest
@tight stone
well generally you'll need to have a train set, a val set, and a test set.
While in your case the validation_split does do that. You generally make your model better based on validation_data. You use the test_data to to a final check on how good your model performance is (i.e. you only use it once - at the very end).
Your model might just be performing badly for that one triangle. I wanted to see if the model was performing badly on other triangles as well
tight stone
@flat quest Ah, I see, sorry for not getting it right away.
I will try generating a test_set and see how model handles the test-images.
I can't really tell if this helps but at least it might help me pinpoint my mistakes, thanks.
flat quest
yeah
its just to see if your model performs decently on other triangles. Cause then we know its probably not a programming error you made
 scarlet river
can anyone here help with pandas? currently i imported a jsonfile and turned it into a dataframe and im trying to get summary statistics on price (category) using df.describe but i want it to only count the prices in a row for a specific product (which is a separate column) how could i do this?
chrome barn
if i am understanding your question correctly the groupby method could help you with this: an example would be df.groupby(["column_with_product"],as_index=False).agg({"column_with_price":"count"}) you could use a filter afterwards to only get the specific product(s) you need
lapis sequoia
How can I visualize a plot of 21 lines easier lol
This just looks like a mess
Is there any better way to visualize that lol
 obsidian mica
is there a good library to use for data analysis on a list of numbers
like seeing deltas of when the numbers go up after x many indexes and back down etc, see if theres patterns
would numpy do something like that
 pseudo sonnet
Ok so I have a set of 1.4 million research abstracts and an exclusion list of 10k phrases
What I need to do is count the number of times a phrase from the exclusion list appears in each abstract
with open('suffix_phrase_exclusion.txt') as f:
    re_exclusion = f.read()

re_exclusion = re_exclusion.split('\n')
re_exclusion = re.compile('|'.join(re_exclusion))


def find_num_exclusion(regex, abstract):
    import re#necessary because of multiprocessing
    return len(re.findall(regex, abstract))


n_proc = multiprocess.cpu_count()
start = time.perf_counter()
with multiprocess.Pool(processes=n_proc) as pool:
    # starts the sub-processes with blocking
    # pass the chunk to each worker process
    results = pool.map(partial(find_num_exclusion, re_exclusion), data['Abstract'].to_list())
end = time.perf_counter()
print(end - start)

data['num_exclusion'] = results
data['num_exclusion'].to_csv('num_exclusion.csv', sep='\t', header=True)
data.head()
Is there any way I can speed this up more? It's been running for almost an hour
As you can see, I've parallelized it and I'm using compiled regex
rancid brook
Thats a pretty huge regex
pseudo sonnet
it is
rancid brook
searching for 10k seperate things in each of the 1.4 million papers is gonna take quite a while
14 billion invididual checks
pseudo sonnet
any idea ballpark how long?
rancid brook
you could test it for like 100 papers and then extrapolate
pseudo sonnet
If it's like a few hours I'll just let it run
I thought of that but I'd have to terminate what's running
Which is my fault lmao
rancid brook
Why?
pseudo sonnet
I'm at 100% load on my CPU. If I run a test alongside this I probably wouldn't get an accurate time right?
rancid brook
True, but you'll at least get an upper bound
pseudo sonnet
I mean off the top of your head would you have any idea how to calculate how much memory it would end up using?
My memory usage has been creeping up the whole time and if I knew what the final size would be I could get an idea how far along it is
rancid brook
that sounds like a memory leak
Is it from all the numbers of words your storing?
mm can't be because 1.4 million numbers takes up like 5 MB of space
pseudo sonnet
looking at task manager I have a python process where there's around 16 subprocesses actually using CPU power
But then there's a ton of top level python processes taking around 60MB each
no CPU power
Yeah something smells here it's probably gonna run out of memory before it finishes
I guess I'll just terminate it and do some tests
So yeah it would take 19 hours to do all of it
 turbid hearth
I am trying to check if a pandas dataframe has NaNs and then output an error message if it does
what can i do in pandas to do that
 spiral peak
You can do something like: df.isnull().values.any()
That'll run through the entire dataframe and determine if each cell/item is null/NaN. Values will remove axis and just have values in an numpy array and then you check if any is True.
turbid hearth
would i have to filter the dataframe first so there are only numerical columns?
since the dataframe im working with would have categorical and numerical data
spiral peak
It should work for any type of cell. All it's doing is checking if it's NaN/Null or not. It doesn't really care what the datatype is inside beyond that since it converts it to boolean based on the .isnull() output.
 past maple
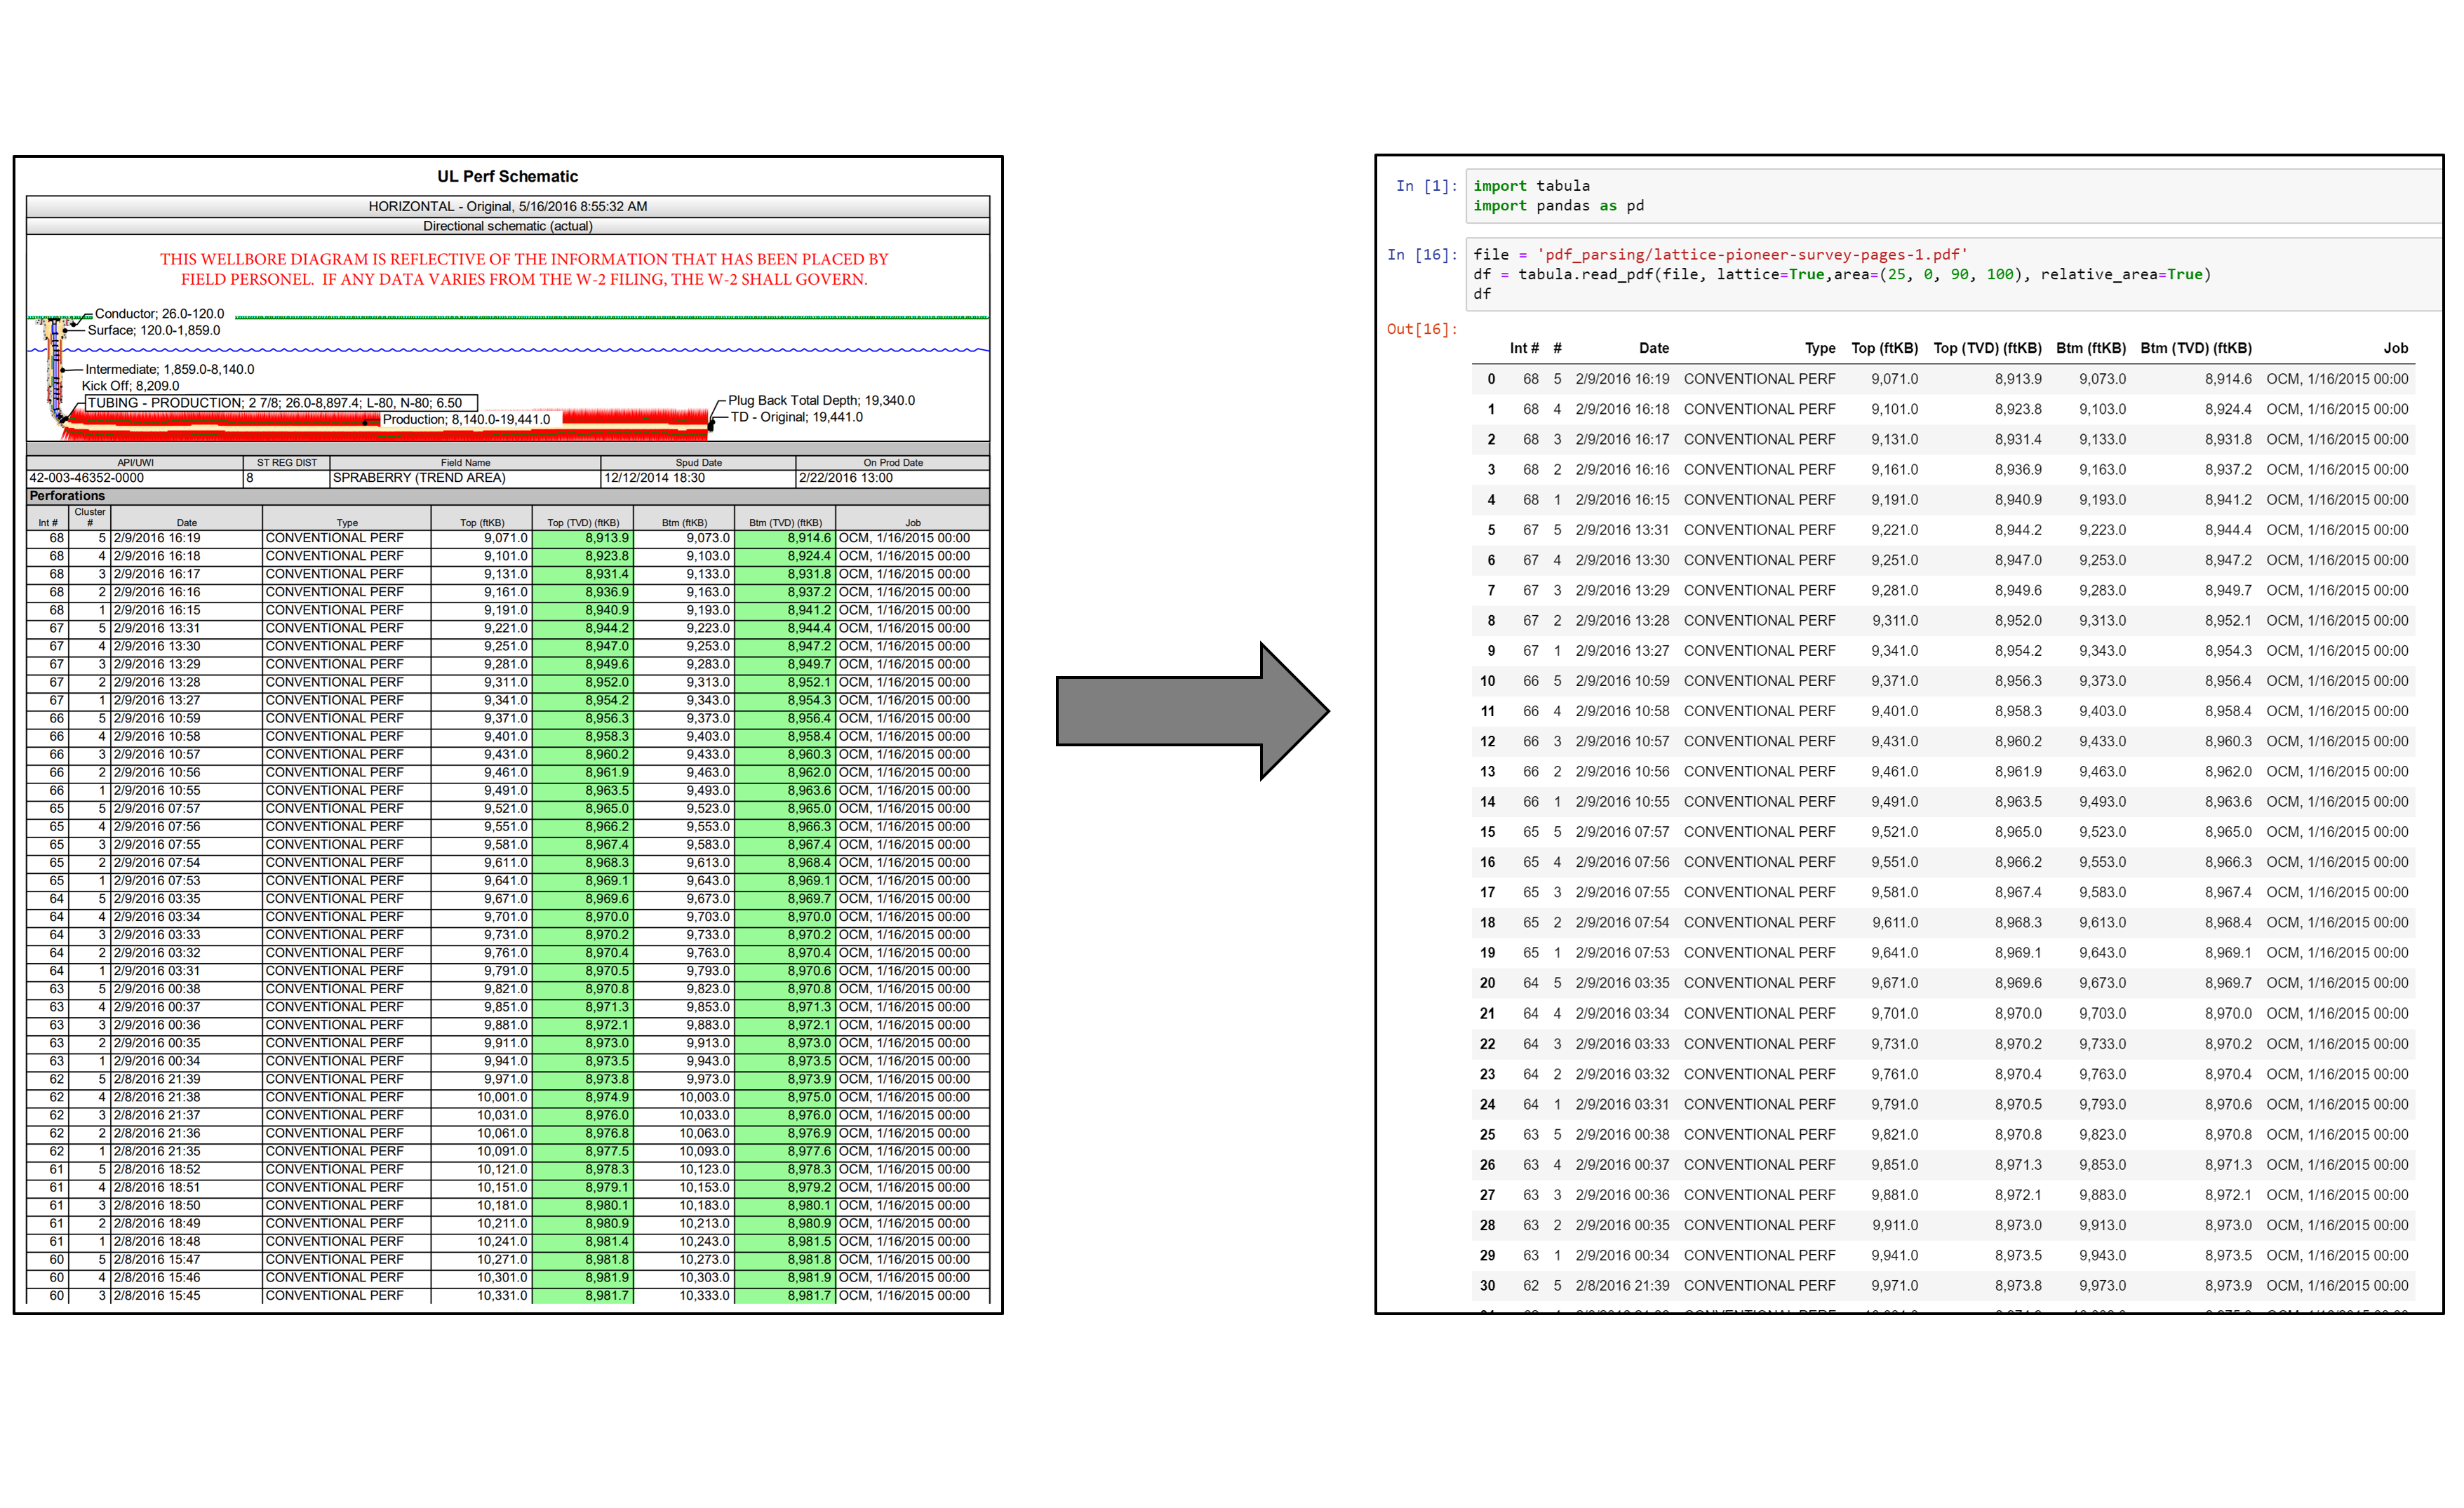
hello. i want to extract data from a PDF to csv format.
its arranged in this format.
So how do i go about it?
 rough lava
if you do get an answer to that, I would love to know about it!
chrome barn
you could look into tabula-py: https://aegis4048.github.io/parse-pdf-files-while-retaining-structure-with-tabula-py it worked for while extracting data from pdf files
Pythonic Excursions
It's hard to copy-and-paste rows of data out of PDF files. Try tabula-py to extract data into a CSV or Excel spreadsheet using a simple, easy-to-use interface.
dull turtle
i want to train my model till i get "loss < 0.05" and "accuracy >85 %" , is this correct way to code for same```python
if score[0] < 0.05 and score[1] >.85:
#model_json = model.to_json()
#with open("model.json", "w") as json_file:
#json_file.write(model_json)
model.save_weights(save_path+country+"model.h5")
model.save_weights(save_path+country+".model")
print("model saved...1")
    else:
        data["epoch"]+=100
        #epoch = epoch + 200
        print("model retrained...")
        print("epochs 2",data['epoch'])
        model.save(save_path+country+'.model')
        model.save(save_path+country+'.model.h5')
        print("model saved...after retraining")
        self.trainmodel(self, country,data['epoch'])```
 chilly sphinx
i am creating a desktop asistant i require it to understand sentences can anyone help me with that
 marble jasper
quite a complex task, look into NLTK as a starting point, but that rabbit hole goes deep
unless you want to go use neural networks, for which lately BERT and GPT-2/3 are making big splashes, look into parse trees
this is the one on nltk's website: https://www.nltk.org/_images/tree.gif
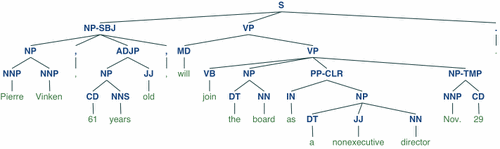
this is part of one that Google's NLP API (which performs better than NLTK) produces:
you'd hop through the tree to identify what the user wants in terms of verbs and nouns. It's quite complex doing it this way (due to the many different ways someone can express something), and you may be better limiting the user to a very strict set of syntices
lapis sequoia
class perceptron(object):
def init(self,eta = 0.01,iters = 50,random_state =1):
self.eta = eta
self.iters = iters
self.random_state = random_state
def fit(self,X,y):
rgen = np.random.RandomState(self.random_state)
self.w_ = rgen.normal(loc=0.0,scale=0.01,size=1+X.shape[1])
self.errors_ = []for _ in range(self.iters): errors = 0 for xi,target in zip(X,y): update = self.eta * (target - self.predict(xi)) self.w_[1:] += update *xi self.w_[0] +=update errors += int(update != 0.0) self.errors_.append(errors) return self def net_input (self,X): return np.dot(X,self.w_[1:])+self.w_[0] def predict(self,X): return np.where(self.net_input(X)>=0.0,1,-1)
can somebody explain the def fit function please?
i tried to break this down but couldnt understand
 wise cypress
Anyway to change externalstylesheets in dash later after declaring the app?
 glacial rune
If I've got some data that erroneously flatlines (amongst real, trending data) for a couple of hours, does anyone have any suggestions on how to identify it? As doing if current value = previous value doesn't sound entirely robust, so maybe I could incorporate a check to see if most of the values are the same?
marble jasper
sounds like checking the range or variance in a sliding window might be good?
 stuck cloak
hi guys. new here and new to programming as well.
I have a question that maybe you guys can help me with. I have this dataset that I want to build a CNN model for. Trying to covert the column sequence to numerical values but dont know how. anyone can help?
 rigid summit
Is there a way to stop the Kite pop-up from loading onto my screen when I start Spyder?
lapis sequoia
if i have a bunch of dates and i want to predict next months values, but the values depend on specific variables, should i use time series forecasting or regression?
or both
 desert oar
@stuck cloak "how to convert something to numerical values" is a huge topic
you might want to refer to the genetics literature for your problem. they were early adopters of machine learning and there should be plenty of field-specific techniques available
it also looks like you might need to apply some string/text cleaning first...
 slow flare
@lapis sequoia ARIMA with transfer functions. Unless you have a lot of variables, then you could try a RNN.
lapis sequoia
ty
desert oar
are there any good transfer function libraries in python right now?
for time series modeling
 last agate
Is Google colab enough when starting with machine learning?
As in I don't have the hardware needed
flat quest
yeah its a great starting point
flat quest
tho its limits on ram and storage aren't very generous. If you start working with larger datasets you might need to use a local computer or cloud
slow flare
@desert oar you could try the NAG library, TSA submodule. I haven’t performed any time series analysis in python. I’m very strict in using R for stats and python for ML. 🙂
 solid aurora
When I perform feature normalization on my dataset,
should I perform it on the entire thing?
or just the training data (and obviously re-apply it to my test data)?
lapis sequoia
can someone help with RL and time series?
glacial rune
I have a group of shops and their prices with timestamps and want to plot this on a graph
I've made 2 dictionaries, both with key as shop name, then variable as prices and timestamps as a list
I think I can populate the two lists then plot them
is this a sensible way of going about this?
lapis sequoia
can anyone say me what's exactly the difference between the types of gradients ?
i know the three types
but i exactly donno the difference
desert oar
@solid aurora the latter: "learn" the normalization on the training set, apply to test set and at prediction time
@glacial rune have you used pandas and/or matplotlib before?
@lapis sequoia what are the three types?
lapis sequoia
batch gradient descent,stochastic gradient descent and mini batch descent
glacial rune
yup used matplotlib before
desert oar
@lapis sequoia oh. those aren't 3 kinds of gradients
the gradient is the gradient
those are 3 different forms of gradient descent
which is a first-order optimization algorithm
desert oar
@glacial rune can you provide some sample data? im not sure i understand the format of your data
desert oar
the number of data points that are used to compute the parameter update
lapis sequoia
ohh
desert oar
stochastic = 1 point at a time
lapis sequoia
is that like classification tasks?
ebon nebula
Hello all. What course/book would you suggest me to learn data science from. (I know the basics of python)
glacial rune
yeah sure @desert oar !
so I actually have a list of dictionaries which was from a json:
[{"price" : 120, "shop" : qwe, "timestamp" : "00:00"}, {"price" : 140, "shop" : asd, "timestamp" : "00:00"}... {"price" : 130, "shop" : qwe, "timestamp" : "01:00"} ]
is the sort of data I have in it. Ultimately I want to plot price against time for the different shops.
I've made two dictionaries using collections.defaultdict for storing values.
Both dictionaries have the different shop names as keys, e.g.
prices = {"qwe": [], "asd": []}
timestamps = {"qwe": [], "asd": []}
I'd like to put the prices and timestamp data into the empty lists in the dictionary
so I can ultimately plot it
is this a sensible approach?
desert oar
i see
do you use pandas?
that will be the easiest way
otherwise you can do it "manually" like you're describing w/ the defaultdicts
glacial rune
I've never used pandas no, I could have a look into it though!
glacial rune
ok, managed to populate the prices and timestamps dictionaries, so if I wanted to plot qwe timestamps on the x axis, how do I refer to that in the code?
desert oar
oh you should convert them to datetime objects
glacial rune
yeah I've converted the timestamps to datetime objects
desert oar
then just iterate over shop names and plot as desired
glacial rune
I'd like it to plot it all on the same graph but the way I've set up my loop, it's plotting it after every
plt.plot(...) line
I only have plt.show() after all of the plt.plot() iterations as I thought it would only show once it reaches plt.show()
but the graph pops out when the plt.plot() line is ran... is this normal? all the guides I've seen have multiple plt.plots and then a plt.show() to make the graph appear
nvm, it was an indent 😄
lapis sequoia
I'm trying to work with an API but it's a little bit confusing because I don't have the best experience when it comes to JSON.
Code:
https://paste.pythondiscord.com/sicocalasi.py
Error:
I'm trying to get this right here:
"stats": {
"hp": "39",
"attack": "52",
"defense": "43",
"sp_atk": "60",
"sp_def": "50",
"speed": "65",
"total": "309"
}
But it's pretty hard because it has the "{" and for some reason confuses my code and apparently it isn't an array it's bigger so how would I get this to work?
hp = dictionary["hp"]
hp = dictionary[{"hp"}]
None of these two works
desert oar
@glacial rune do you want them all on the same plot? or a grid of plots
oh you got it owkring
ok
glacial rune
yeah I messed up an indent 😄
thanks for your help!
I now have plotted my data and have some flat lines that I want to get rid of. I’m fairly sure the value just stays stuck for a long period of time so could I perhaps iterate through the list of times and simply check if previous value = current value occurs consecutively over a large period of time then remove those data points?
chrome barn
@lapis sequoia try: hp = dictionary[0]["hp"]
lapis sequoia
ok
chrome barn
@lapis sequoia for stats do hp = dictionary[0]["stats"]["hp"]
lapis sequoia
thanks
ebon nebula
Hi . Can someone recommended me a good course/site/book where I can study Data Science
lapis sequoia
Hi i have question what this message erros mean : Error in match.names(clabs, names(xi)) :
glacial rune
Ok so I want to remove consecutive duplicates, but only if there are more than n consecutive duplicates... does anyone have a way of doing this please?
ah sorry, consecutive duplicates of elements in a list
I've been googling and checking stack exchange but can't find something entirely
I have been looking through pandas videos to see if they have any
sure, so for example:
[9, 9, 2, 3, 4, 5, 6 , 8, 9, 9, 9 ,9 ,9 ,9 ,9 ,9, 2, 4, 6, 6, 6, 6]
let's say if there are more than 3 consecutive duplicates, all of those will be removed
so we would have
[9, 9, 2, 3, 4, 5, 6 , 8, 2, 4]
could keep the first/last duplicate but not that important
desert oar
is a dict not similar?
glacial rune
actually the data I have is in dicts
with lists as the values
but it's consecutive duplicates within those lists
as I'm tracking them over time
so my initial data was a list of dictionaries:
[{"shop": "qwe", "price": 123, "time": "00:00"}, {"shop": "asd", "price": 156, "time": "00:00"}, {"shop": "zxc", "price": 236, "time": "00:00"} etc. ] # with changes in price over time
I made two dictionaries to store the data, the keys being shop for both, but values being a list of prices and a list of time
as I want to remove flatlined data, I need to look for consecutive duplicates, no
?
I was thinking, if I could iterate over the lists and find say, >n consecutive duplicates, it would remove those for me... but can I iterate over the elements of a list within a dictionary?
ebon nebula
Hi . Can someone recommended me a good course/site/book where I can study Data Science
slow flare
Has anyone used any really good tools for labeling images with polygons instead of rectangular boxes? I am currently using labelImg.
chrome barn
with pandas you could use the shift function to figure out which rows are duplicates and later remove them, maybe even the drop_duplicates function with the subset argument could maybe also work
 peak zealot
why is pandas converting discord ids like 308778632111980554 to 3.0877863211198054e+17?
I can just convert the ids to strings to fix it but I prefer to preserve them as ints
chrome barn
pandas is not really converting them but in the output because it is a large integer or float it is showing/outputting it in scientific notation formatting
 plain forge
That's how panda outputs large numbers
lapis sequoia
wouldn't it be easier if you would convert these large numbers into a string since they are IDs
@peak zealot
peak zealot
yeah that's what i'm doing now
lapis sequoia
👍
 oblique belfry
https://paperswithcode.com/methods
Papers with code is such an awesomre resource

753 methods • 25676 papers with code.
limpid raft
Simple question about CNN kernel size. I'm trying to fit 8000 images of 32 by 32. Whenever I use a kernel size different than (1,1) it doesn't fit, which I don't understand why. Could anyone tell me what I should do to increase the kernel size or what I'm doing wrong? (I'd like to be more specific but I'm fairly new to this)
here the relevant code:
def build_model(learningrate=0.01):
Model = Sequential()
Model.add(Conv2D(64, kernel_size=(3,3), strides=(1,1), activation='relu', input_shape=(32,32,1), use_bias=False, kernel_initializer="he_uniform"))

opt = tf.keras.optimizers.Adam(learning_rate = learningrate)
Model.compile(loss="mape",optimizer='adam')
return(Model)
model = build_model()
n_epochs = 2
es_callback = EarlyStopping(monitor = 'loss', patience = 5)
model.fit(training_input,training_output,epochs = n_epochs, verbose = 1, callbacks = es_callback)
flat quest
totally agree @oblique belfry
Tho being able to understand those papers is a whole different thing. Most ppl have difficulty even when someone explains the paper to them.
oblique belfry
True.
Though I guess that is an education thing. You have to have a certain amount of knowledge to understand what papers are talking about. But, I have found that although I might read a bunch of papers, trying to translate that in code is HARD.
I really like the push for Machine Learning and AI papers to post their code with the paper and if possible the dataset(s) used or the method of how to create that data yourself.
flat quest
oh yeah definitely
its one thing to know the math behind it. Whole nother thing to be able to code it, even if you have a lot of exp with ml libraries.
Yeah I wish they did that too. But i suppose the papers would get even longer than they are now then
oblique belfry
To me, the code is more enlightening to the process than the paper.
flat quest
possibly
but you'll still need the actual verbal explanation. Code on its own won't cut it
glacial rune
pick that dictionary's item and just iterate over it
@mellow saffron maybe I missed something super obvious then but I found it difficult to iterate over a dictionary since it wasn’t ordered? As I have each shop and price as a key: value respectively
So... iterating over the list for each one, I wasn’t sure about the syntax
peak zealot
why is df.drop(labels=["whatever"] always return KeyError when I definitely have a row with the appropriate value
my csv looks like guild_id,role_name 308778632111980554,Bot Dev 308778632111980554,Shade's Bots and no matter what I put as role name it gives a KeyError
 dapper nexus

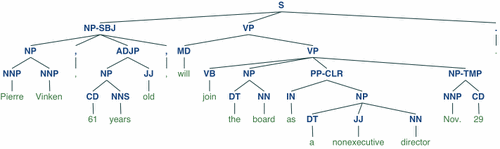 oblique belfry
Yes.
pseudo sonnet
So can I switch keras backends at runtime?
I have plaidML installed so i can accelerate my neural net on my R9 290 but I want to do the vectorization on my CPU
 tawdry bobcat
Any good resources on intent classifcation with python?
Sentence classifcation, sentiment analysis etc
lapis sequoia
hey, i just started using numpy for my project as otherwise i wait like 30 minutes for my script to finish.
but im encoutering massive memory problems;
i have a folder of around 2 gb of text files, each file is around 200-500 kb but can go up to 10mb and i load them as 1d array like following:
for item_x in glob.glob(input_dir + '*'):
mofo = np.append(mofo,[open(item_x).read().split('\n')])
after a couple of seconds it uses 10gb of my ram and i don't know how to fix it. anyone got an idea ?
the goal of my project is basically to compare each text file with each other and find similar text files,
i can do this with numpy using np.setdiff1d(input_1,input_2,assume_unique=True)
and then using the .shape function to calculate the difference in %
 rapid escarp
Is there any API like google's Smart compose that i can use for my project ? Thanks for the help.
 crude flame
I did some data science online courses a while ago, but forgot a lot of it already... does anyone have a good cheat sheet or quick reference to brush up on the core concepts?
glacial rune
following the code here: https://towardsdatascience.com/pandas-dataframe-group-by-consecutive-same-values-128913875dba
is there a way I can only show it if the group size is greater than a certain size?

Medium
Grouping Pandas DataFrame by consecutive same values repeated multiple times
lapis sequoia
following the code here: https://towardsdatascience.com/pandas-dataframe-group-by-consecutive-same-values-128913875dba
is there a way I can only show it if the group size is greater than a certain size?
@glacial rune interessing
Medium
Grouping Pandas DataFrame by consecutive same values repeated multiple times
chrome barn
use apply to iterate over each row and see if the value is greater then what you specify and if not just drop the row
glacial rune
ok I figured it out - not familiar with looping when you have two things(?) to loop, e.g.
for k, v in df.groupby((df['v'].shift() != df['v']).cumsum()):
I figured that v was the group ('v' is the column heading) so I just made an if line to see if the group size was big enough
what are the proper names for 'k' and 'v' here?
also, if I want to delete the rows in those groups in my data, could I make a list of all the index numbers that show up in the group, then drop those from my original dataframe?
chrome barn
df.loc[df["v"]-df["v"].shift(1) != 0, "v_prev"] = 1
df.loc[df["v"]-df["v"].shift(1) == 0, "v_prev"] = 0
df.loc[0,"v_prev"] = 1
df.loc[(df["v_prev"] == 1), "group"] = df['v_prev'].cumsum()
df['group'] = df['group'].fillna(method='ffill')
df['group_sum'] = df.groupby('group').v.transform('sum')
df = df[df['group_sum'] >= 10]
you could try something like this
it is based upon the same dataframe as in the link you mentioned earlier
glacial rune
thanks, I forgot to check discord as I did it 😛 but I did something like:
df = df.drop(list(v.index)
as v is a dataframe of then group
chrome barn
you got an example or the html string?
 graceful ice
yes I have the example string
arctic wedgeBOT
Hey @graceful ice!
Uh-oh! It looks like your message got zapped by our spam filter. We currently don't allow .txt attachments, so here are some tips to help you travel safely:
• If you attempted to send a message longer than 2000 characters, try shortening your message to fit within the character limit or use a pasting service (see below)
• If you tried to show someone your code, you can use codeblocks
(run !code-blocks in #bot-commands for more information) or use a pasting service like:
 serene veldt
Hello, could someone help the understand how the mean works when working with 3d tensors?
not understanding how its calculated when using this axis
graceful ice
@chrome barn will pastebinw ork for you
chrome barn
yes is fine
arctic wedgeBOT
Hey @graceful ice!
Uh-oh! It looks like your message got zapped by our spam filter. We currently don't allow .txt attachments, so here are some tips to help you travel safely:
• If you attempted to send a message longer than 2000 characters, try shortening your message to fit within the character limit or use a pasting service (see below)
• If you tried to show someone your code, you can use codeblocks
(run !code-blocks in #bot-commands for more information) or use a pasting service like:
graceful ice
@chrome barn https://file.io/xojV3JFEt6X1
check this
I want to fetch all tables where columns are more than 2
chrome barn
it says file not found
ebon nebula
Hello all. Can someone suggest me a course/book/site where I can start learning Data Science with Python.
graceful ice
https://we.tl/t-1wuUm3bppX
@chrome barn

1 file sent via WeTransfer, the simplest way to send your files around the world
arctic wedgeBOT
Hey @graceful ice!
It looks like you tried to attach file type(s) that we do not allow (.pdf). We currently allow the following file types: .3gp, .3g2, .avi, .bmp, .gif, .h264, .jpg, .jpeg, .m4v, .mkv, .mov, .mp4, .mpeg, .mpg, .png, .tiff, .wmv, .svg, .psd, .ai, .aep, .xcf, .mp3, .wav, .ogg.
Feel free to ask in #community-meta if you think this is a mistake.
graceful ice
basically I want to read tabular data from emails
And I am not getting any ways to do that
chrome barn
yes i see what you want
graceful ice
can you help me
chrome barn
there are multiple ways in which it can be done:
- the easiest way that i know off will be using pandas and the read_html method but this will not always work
- the second method which required more work will be using a package like BeautifulSoup
and of course there will also be other methods but i am less familiar with them
graceful ice
Umm
I tried with bs
but not getting a way to to fetch the data
if you have worked with this type of things
could you please provide me a refference
or a snippet
chrome barn
i can provide you with a bs snippet hold on
 rancid dove
When is it appropriate to use datetime in pandas
Like I have simulation data that has sim time, of about 600 seconds
Would use datetime be appropriate for anything time based or only when it's like over the period of days months , when u would use categoricals too
ripe forge
id use datetime when its real datetimes
not "durations"
or i suppose, to clarify. "time" is not enough for me to start using datetime. "dates" are. this is just personal preference though
lapis sequoia
Can someone help me get this into an iterative form?
This creates a list of all possible unordered pairs from an input list.
Unfortunately my input list has 25 elements in it, wich leads to nearly 2 bil possible permutations and over 40TB of data.
Since i dont have that much capacity i want to reduce the list on the fly, hoping it will save me enough space, but my recursive implementation does not allow for that.
def rec_perm(list):
    res = []
    if len(list) <= 2:
        return [[list]]
    for i in range(len(list)-1):
        touple = [list[0], list[i+1]]
        tmp = rec_perm(np.delete(np.delete(list, i+1), 0))
        for k in range(len(tmp)):
            tmp[k].append(touple)
        for x in tmp:
            res.append(x)
return res```@lapis sequoia i'm not sure this is really data science but you could try convert your function into a generator then it wont store all the possible values and will lazily generate them as needed meaning less memory required and less initial processing (as that is done when requested)
lapis sequoia
im sorry all these different channels confuse me, i never know if im in the correct one..
i thought this one fits the best since im trying to analyze data
spark stag
thats fine, usually looking at the channel description gives an overview of what the channel is about
lapis sequoia
oh mb didnt realize discord offers that
peak zealot
How come when I update a row in a CSV with Pandas it messes up other rows
146705060938776579,1,1```
the 1.0 in the first row should stay as 1 loud sorrel
What the start to Data Science?
lusty coral
@peak zealot how it messes things up there?
@lapis sequoia use caching
And also generators as well
 upper ginkgo
Hi, I've been trying to build Tensorflow for the last 2 days without any luck. I've followed this guide: https://www.tensorflow.org/install/source_windows
I'm using Python 3.8.3, bazel 2.0.0
Build label: 2.0.0
Build target: bazel-out/x64_windows-opt/bin/src/main/java/com/google/devtools/build/lib/bazel/BazelServer_deploy.jar
Build time: Thu Dec 19 12:31:16 2019 (1576758676)
Build timestamp: 1576758676
Build timestamp as int: 1576758676
``` and the latest version of MSYS2.

When running bazel build --config=opt //tensorflow/tools/pip_package:build_pip_package after configuring the build with py configure.py it takes a long time before erroring:
INFO: Analyzed target //tensorflow/tools/pip_package:build_pip_package (339 packages loaded, 21623 targets configured).
INFO: Found 1 target...
INFO: Deleting stale sandbox base C:/users/luis_/bazel_luis/r4xt3sxh/sandbox
ERROR: C:/users/luis_/desktop/tensorflow/tensorflow/core/framework/BUILD:1373:1: ProtoCompile tensorflow/core/framework/variable_pb2.py failed (Exit -1073741795)
Target //tensorflow/tools/pip_package:build_pip_package failed to build
INFO: Elapsed time: 1102.609s, Critical Path: 61.15s
INFO: 166 processes: 166 local.
FAILED: Build did NOT complete successfully
Can someone help me? I can't use the package provided by pip as it uses AVX2 instructions and errors.146705060938776579,1,1``` the 1.0 in the first row should stay as 1
@peak zealot cast the column back into int again then
peak zealot
I ended up just using all floats since pandas was adament about them being floats
works fine now
lusty coral
Yeah. one of their tricks i guess
 worldly elk
!close
 haughty cedar
hi guys
i have an interesting problem
when plotting multiple lines with matplotlib
i get the following image
however when i plot the orange line alone i have no issues
if anyone has any idea why this is happening or what it could be I would really appreciate the help
rancid brook
Posting your code will probably make it much easier to help you
spiral peak
what does your x-y data look like for both?
 velvet thorn
seems like a type issue
 obtuse condor
Hello guys, anyone knows some things about discrete linear optimization in Python?
 lament dust
@obtuse condor oh noooooooooooooooo
 mellow spruce
Hello all, first time posting so sorry if formatting is not correct. I have a question about how to filter further after using group by and value counts. I have a huge data set (10 million rows) that consists in this: df = pd.DataFrame([["John", "Cleaning"], ["John", "Cleaning"], ["Mary", "Driving"], ["Mary", "Cleaning"], ["Mary", "Walking"], ["John", "Driving"], ["Peter", "Cleaning"], ["John", "Driving"], ["John", "Cleaning"], ["John", "Walking"]], columns=["Name", "Activity"]) For each unique name I want to find how many times each activity occured and filter only the names that performed any activitie more than once. Someone on SO told me to do this result = df[
df['Name'].isin(df[df.duplicated()]['Name'])
].groupby('Name')['Activity'].value_counts() and it returned this Name Activity
John Cleaning 3
Driving 2
Walking 1 however I want to return only the name. Since it is a series I cannot access the columns so I am not sure how to proced. any help is welcomed
mellow spruce
Pls
chrome barn
@mellow spruce ```python
result = df.groupby(['Name','Activity']).size().reset_index(name='count')
result = result[result['count'] > 1]
result.drop(columns=['Activity','count'],inplace=True)
you could add some drop duplicates at the end to remove any duplicates
mellow spruce
Thank you master @chrome barn
dull turtle
i want to access this .model.h5 file
but i am not able to access this can anyone help here
country = data["country"]
        modelType = data["modelType"]

        if modelType == r"E://paymentz//"+country+".model.h5" or country :
            country = data["country"]
            #model = tf.keras.models.load_model(r'E://paymentz//albania//albania.model.h5') or ("albania")
            model = tf.keras.models.load_model(r"E://paymentz//"+country+".model.h5") or (country)
            print("model loaded...")
            test_img = image.load_img(r'E://paymentz//albania//training//albania_passport//asd.jpg', target_size= (64, 64))
```wow
spaghetti code
you shouldn't concatenate strings like that (use f strings or .format) and you don't need to reference filepaths like this, pass them as a flag or declare all your variables at the top
model loaded is not really doing anything here, you need to use a method that actually checks if your model is available
 rose saffron
I never thinked i had to ask help for the pd.read_csv() but.... look at this... in the original file I can read the csv file without problem; but in the same file_copy i can't read the csv file because it says the file does not exists ...
DO u have any idea why this happens?
FileNotFoundError: [Errno 2] File b'Downloads/home-data-for-ml-course/train.csv' does not exist: b'Downloads/home-data-for-ml-course/train.csv'
lapis sequoia
is this a windows environment
rose saffron
yep
lapis sequoia
'C:\\mydir'
rose saffron
nothing...
if u see into the 1st image and the second one the code is the same
i didn't changed the path of the csv file
rose saffron
!pwd
@lapis sequoia where?
lapis sequoia
Edit: going to try the scikit-learn tutorial
 glacial torrent
guys does somebody know why
the method .columns doesnt appear to me?
in the video that im following it worked 😦
lusty coral
Use another editor if you don't like its suggestions
lusty coral
Suggests nothing?
What do you get when you hover over data variable in the first row of the code
What does it say
lusty coral
So writing "data." Gives you nothing?
glacial torrent
a lot of methods
but not the columns one
that's the problem 😦
@lusty coral i have pasted the same code at google colab and there it worked
lapis sequoia
Hello everyone.
I try to create an object but I fail.
This give me error:
AttributeError: 'Reader' object has no attribute 'fpx1'
uncut shadow
well, it means you can't do self.fpx1 because ur class has no attribute like that
lapis sequoia
@uncut shadow Thank you. But it's in def getdara(self)
I don't understand
Object reads dat file. Order its data into variables.
Then I want to use them. I don't want to do regex search-match job again and again
Hi, i need help
ValueError: invalid literal for int() with base 10: 'Or'
uncut shadow
yes, but this fpx1 only exists in the scope of __init__ method. In order to make it usable in whole class, you have to define it using self.fpx1 = ... (of course, replace ... with that list you want it to store)
@lapis sequoia
@lapis sequoia you have to provide some code
lapis sequoia
the code is :all_data['Month'] = all_data['Order Date'].str[0:2]
all_data['Month'] = all_data['Month'].astype('int32')
@uncut shadow Thank you very much. I think I figured out by typing self before every word 🙂
uncut shadow
yeah
lapis sequoia
I don't know. Maybe I don't need to write "self" everywhere. But it works
uncut shadow
@lapis sequoia it means that your data contains data type (probably string) which cannot be converted to int32. In your example it's probably string or
@lapis sequoia Well, you should read more about classes in python, it will help a lot to answer this question. You can check this https://www.geeksforgeeks.org/self-in-python-class/ or this https://stackoverflow.com/questions/2709821/what-is-the-purpose-of-the-word-self for more info about what actually self is in python

GeeksforGeeks
A Computer Science portal for geeks. It contains well written, well thought and well explained computer science and programming articles, quizzes and practice/competitive programming/company interview Questions.
Stack Overflow
What is the purpose of the self word in Python? I understand it refers to the specific object created from that class, but I can't see why it explicitly needs to be added to every function as a par...
lapis sequoia
Hi, i need help for this message error:
ModuleNotFoundError Traceback (most recent call last)
<ipython-input-4-7829a603588a> in <module>
1 import math
2 import matplotlib.pyplot as plt
----> 3 import keras
4 import pandas as pd
5 import numpy as np
ModuleNotFoundError: No module named 'keras'
 high kettle
are you using anaconda?
lapis sequoia
yes with jupyter notebook
stuck cloak
hey guys. rookie here. I have a pressing issue. trying to drop the \t\ in \t\ttactagcaatacgcttgcgttcggtggttaagtatgtataatgcgcgggcttgtcgt how can i do it? if i do .str.strip() it drops inclusive of the first t in the sequence.
uncut shadow
@stuck cloak that's not exactly data science question, but if you want to remove \t\ just from that string, then you can use replace() or just slice it
also, it's something connected with DNA and Nucleic acid structure, right? :P
 tardy portal
Hello, i'm new to this server, but would someone be able to provide assistance with some questions I have regarding to dataframes?
arctic wedgeBOT
Asking good questions will yield a much higher chance of a quick response:
• Don't ask to ask your question, just go ahead and tell us your problem.
• Don't ask if anyone is knowledgeable in some area, filtering serves no purpose.
• Try to solve the problem on your own first, we're not going to write code for you.
• Show us the code you've tried and any errors or unexpected results it's giving.
• Be patient while we're helping you.
You can find a much more detailed explanation on our website.
tardy portal
perfect
thank you
one second
however, when I test case I receive this error
what am I doing incorrectly?
desert oar
what do you expect that to do
and what is score
and what do you think the error message means?
tardy portal
the second screenshot is to verify if I completed the question correctly
@desert oar would it be possible to pm?
desert oar
no
all those questions are related to solving your problem
im trying to be socratic here
tardy portal
I see
desert oar
because this is a common misunderstanding with python and pandas novices
but it stems from fundamentally not knowing how pandas works
tardy portal
okay, moving forward
desert oar
so what is the intended outcome
desert oar
is this a completely different problem?
tardy portal
that derives from the column named "PaymentMethod"
yes it is, ill get back to the other problem later
so to create a new column is simple
df_churn['AutoPayment'] = df_churn['PaymentMethod']
no?
I know I need to create a for loop to obtain the answer, but should I use a split method?
desert oar
you do not need a for loop
tardy portal
if statement?
lapis sequoia
<Message id=731618038905831505 channel=<TextChannel id=366673247892275221 name='data-science' position=25 nsfw=False news=False category_id=409692123944714240> type=<MessageType.default: 0> author=<Member id=389497659087650836 name='salt rock lamp' discriminator='0679' bot=False nick=None guild=<Guild id=267624335836053506 name='Python' shard_id=None chunked=False member_count=63127>> flags=<MessageFlags value=0>>
desert oar
yes
lapis sequoia
<Message id=731618041774866613 channel=<TextChannel id=366673247892275221 name='data-science' position=25 nsfw=False news=False category_id=409692123944714240> type=<MessageType.default: 0> author=<Member id=389497659087650836 name='salt rock lamp' discriminator='0679' bot=False nick=None guild=<Guild id=267624335836053506 name='Python' shard_id=None chunked=False member_count=63127>> flags=<MessageFlags value=0>>
 south quest
uhh
tardy portal
no I am not familiar with that
let me look it up
one second
im sure the df that I'm working with is not a dict
tardy portal
desert oar
ok lets not use things you didnt learn about
you can do it with a for loop
it will just be very slow on a big dataset
im a little alarmed you didnt learn about .apply or .where or .mask
tardy portal
don't you think it would be effective to use an if statement?
tardy portal
one moment
desert oar
!code-block
arctic wedgeBOT
Discord has support for Markdown, which allows you to post code with full syntax highlighting. Please use these whenever you paste code, as this helps improve the legibility and makes it easier for us to help you.
To do this, use the following method:
```python
print('Hello world!')
```
Note:
• These are backticks, not quotes. Backticks can usually be found on the tilde key.
• You can also use py as the language instead of python
• The language must be on the first line next to the backticks with no space between them
This will result in the following:
print('Hello world!')
lets break this problem down step by step
so to create the new column named 'AutoPayment' would be the following:
''' df_churn['AutoPayment'] = df_churn['PaymentMethod'] '''
desert oar
use backticks ` not single quotes '
tardy portal
oh okay, my apologies
desert oar
but ok
df_churn['AutoPayment'] = df_churn['PaymentMethod']
sure, that's fine
this should be a one liner btw
.apply, .map, .where, or .mask would all help you solve this
but its more important imo
to see what you currently are planning
because i think its the same issue
where you think if works differently than it does
and i want to have a simple example to demonstrate
tardy portal
sure if you want to provide an example I would appreciate that
desert oar
fundamentally it comes down to the fact that python is unaware that pandas objects are "vectors"
look at your if statement above
ok actually wait
your code in q 7 is even more confusing than i realized at first
lets just look at what you were planning to do for q 11
tardy portal
Yes I want to create a new column where it would assign a value based on the payment method containing the words 'automatic'
tardy portal
if search('automatic', df_churn['AutoPayment']): print 1 else: print 0
Im pretty sure its incorrect
that the if function does not operate that way
or if df_churn['AutoPayment'] == 'automatic': df_churn['AutoPayment'] = 1 else: df_churn['AutoPayment'] = 0
@desert oar
desert oar
Yeah that's exactly the issue
Give me a minute
Im doing something offline ill @ you
tardy portal
yeah would I have to incorporate a split function since the word 'automatic' is in cased (automatic)?
no worries, take your time
I appreciate your help
desert oar
No
The if is misused
Python itself has no knowledge of the fact that a Series is a vector or collection
I guess this is a bit difficult to explain, basically "it doesn't work like that"
It's hard to explain on my phone anyway
If you write "if" that just acts on a single True/False
There's no notion in python of distributing that operation over a collection or sequence
At least, not with "if"
That's why pandas has all of these methods like apply, map, mask, etc.
That's what enables you to perform these vectorized/distributed computations
tardy portal
that makes more sense
im going through each method to find what's most appropriate for the question
the datatype of the new column should be the same as the column we're take the information from
let me find out the datatype
desert oar
That's not true in this case as per the question
You have a text column and you're trying to produce a numerical/integer column
tardy portal
so I would have to change the dtype for the new column hence if the payment method includes the word 'automatic' it would assign its value to either 1 or 0
desert oar
You would just end up overwriting the column
You shouldn't need to manually change dtype
tardy portal
so i don't have to write anything that would change the value of the new column, there's obviously a way for the new column to show a certain type of value
desert oar
I'm not sure what you mean by that, if you write code that returns a column of integers, the new column is full of integers
Doesn't need to be more complicated than that
Do you have experience with other programming languages or SQL?
desert oar
OK, sometimes misconceptions like this arise because people make incorrect analogies to other tools
That doesn't seem to be the case here
tardy portal
which makes sense, and I totally understand that notion
i'm just confused on creating the new column, it should equal to the column i'm taking data from
there should be more to it than this:
tardy portal
df_churn['AutoPayment'] = df_churn['PaymentMethod']
desert oar
Just write some code that emits the column you want, and assign that new column to the df
Don't overthink this
tardy portal
okay I just did that
what i'm having trouble is how the column is able to assign the value of 1 or 0 based on the payment method including the word 'automatic'
I have a tendency of overthinking things, but i'm trying not to
tardy portal
yes
desert oar
With a boolean valued series
You can assign to a subset
df.loc[df['a'] == 3, 'q'] = -99
The above being one silly example
tardy portal
but the concern is that within the original column 'PaymentMethod' the word 'automatic' is enclosed on parentheses
df_churn.loc[(df_churn['AutoPayment'] == 'automatic'), 'PaymentMethod'] = 1
wouldn't those values be assigned a 1 if it includes the word 'automatic'?
desert oar
yes, you're thinking one step ahead
also you can write df_churn['AutoPayment'] == 'automatic', you don't need to write (df_churn['AutoPayment'] == 'automatic')
also you have the column names swapped
of what you're assigning to
i think that's because the question is unclear, not your fault
tardy portal
no the column names shouldn't be swapped because i'm creating the 'AutoPayment' column
tardy portal
alrighty
well after running df_churn['AutoPayment'] == 'automatic'
everything is false because the word 'automatic' is enclosed in parentheses
desert oar
right
so that's the next challenge
you need to use some kind of string subset searching instead of testing for equality
right?
have you learned anything that helps you do that?
tardy portal
that's why i ask if its wise to run a split function or iterate it based on '()'
desert oar
no i think that's overengineered to your particular use case
do you know how to check if something is in a string in python?
i don't want to give away answers because this is homework
desert oar
you found that by searching the docs?
tardy portal
well google lol
desert oar
alright, let's pretend you found .str.contains instead 😉
 fringe hearth
hi, does anyone here know how to count points in an image using scikit?
desert oar
you could do it with .str.find but you need to read the docs carefully
fringe hearth
tardy portal
after running that, everything that does not include the word 'automatic' is valued at -1
fringe hearth
Im willing to pay via paypal if anyone is able to count how many balls are there by using regionprops by scikit
please DM me
arctic wedgeBOT
6. No spamming or unapproved advertising, including requests for paid work. Open-source projects can be showcased in #show-your-projects.
fringe hearth
whee should i ask?
tardy portal
after changing it to .str.contains everything is either valued true or false
fringe hearth
where
desert oar
you can ask for help, you can't offer payment
but people will not do your work for you
slim fox
everything is either valued true or false
That's normal, you can use it than as boolean mask