#data-science-and-ml
1 messages · Page 210 of 1

 native patrol
@jade chasm if you're looking to solve from an academic context - you can use Gurobi (free academic licenses iirc).
that's what we had used in our Linear Programming course
 pulsar stag

My Website: https://cryptopotluck.com/portfolio/16 Github Repo of Project: https://github.com/cryptopotluck/alpha_vantage_tutorial Alpha Vantage Github: http...

GitHub
tutorial video I made and the repo that goes with it - cryptopotluck/alpha_vantage_tutorial
 barren bluff
Hey guys im a bit stuck with my assignment. I have to plot an image before and after using pca, nothing fancy with k-means or anything like that, but I am a little stuck with the plotting after reducing the dimensions
here is the code I have so far
print(digits.keys())

data = scale(digits.data)

#find amount of samples and features
n_samples, n_features = data.shape
n_digits = len(np.unique(digits.target))

print("datashape: ",digits.data.shape)

print("n_samples %d, \t n_features %d"
      % (n_samples, n_features))


def plotdigitWithoutPCA(num):
    plt.figure(1, figsize=(3, 3))
    plt.imshow(digits.images[num], cmap = plt.cm.binary, interpolation="nearest")
    plt.axis("off")
    plt.show()

plotdigitWithoutPCA(0)
plotdigitWithoutPCA(2)

pca = PCA(n_components=n_digits).fit(data)
@ me if anyone can help
 rapid ridge
hey guys. is legal to make a web scraping?
 fallen quest
Yeah, just make sure not to overdo it with how frequently you scrape because website will ban you or something
 deft harbor
There are copyright concerns, also tos issues to keep an eye on.
fallen quest
True!
rapid ridge
I will keep in mind . I will only extract the links .
 cyan mantle
 rapid ridge
linkedin , monster doesnt allow crawling disallow: /
rapid ridge
is mysql or sqlite better for web scrapping ?
 ancient thistle
you dont need a DB for web scraping (unless you're trying to scrape and download images or something to a server?)
 quartz stream
MCQs are a widely-used question format that is used for general assessment on domain knowledge of candidates. Most of the MCQs are created as paragraph-based questions.A paragraph or code snippet forms the base of such questions. These questions are created based on the three or four options from which one option is the correct answer. The other remaining options are called Distractors which means that these options are nearest to the correct answer but are not correct. You are provided with a training dataset of questions, answers, and distractors to build and train an
I am starting to learn NLP
Can anyone help me
rapid ridge
where can I get this list of countries by their top 10 cities to work for IT / security or penetration testing or IT in general of each country below?
United Kingdom
Spain
Belgium
Romania
Italy
Russia
France
Czech Republic
Poland
Switzerland
Australia
Ireland
Singapore
sweden
Germany
New Zeland
 eager heath
Maybe on LinkIn
(But i don’t see why this question is in this channel, #career-advice would be more adapted 😄 )
rapid ridge
I had to google all cities one by one , but how would you implement this . I have already a dict of files of top 10 - 25 cites from each country , but how can I apply to depends on the link use the wordlist for that for example
self.cities = {
      'AU': open('AU','r').read().splitlines(),
      'BE': open('BE','r').read().splitlines(),
      'CA': open('CA','r').read().splitlines(),
      'CH': open('CH','r').read().splitlines(),
      'CZ': open('CZ','r').read().splitlines(),
      'DE': open('DE','r').read().splitlines(),
      'ES': open('ES','r').read().splitlines(),
      'FR': open('FR','r').read().splitlines(),
      'GB': open('GB','r').read().splitlines(),
      'IE': open('IE','r').read().splitlines(),
      'IT': open('IT','r').read().splitlines(),
      'MX': open('MX','r').read().splitlines(),
      'NL': open('NL','r').read().splitlines(),
      'NZ': open('NZ','r').read().splitlines(),
      'PL': open('PL','r').read().splitlines(),
      'RO': open('RO','r').read().splitlines(),
      'RU': open('RU','r').read().splitlines(),
      'SE': open('SE','r').read().splitlines(),
      'SG': open('SG','r').read().splitlines(),
      'US': open('US','r').read().splitlines(),
}


for url in self.links:
      for city in self.cities:
          print(url+city)


https://www.indeed.com/jobs?q=Los Angeles, CA
https://www.indeed.com/jobs?q=San Jose, CA

https://ca.indeed.com/jobs?q=...

....
I was thinking on this , but i am not sure
for url in self.links:
      for city in self.cities:
          if(self.cities['AU']):
            print(city)
            elif self.cities['BE']:
                  print(city)
 hazy sierra
Elif is tabbed too much ?
eager heath
^
hazy sierra
I could be wrong but wouldn't self.cities['AU'] need to return true ?
also self.cities['AU'] returns the same value over and over again
eager heath
Why it wouldn’t return the same value?
eager heath
As long as you don’t change the value, it is not going to change
rapid ridge
any other way to loop it without too much if , elif
for city in cities:
    if(cities['AU']):
      print(cities['AU'][0])
Isn't self.cities a dictionary?
I thought you couldn't iterate through it
I guess you can
That's weird
eager heath
You can iterate over a dict
rapid ridge
this piece of code is getting the len of cities and not the len of each wordlist , how can I fix it?
cities = {
      'AU': open('AU','r').read().splitlines(),
      'BE': open('BE','r').read().splitlines(),
      'CA': open('CA','r').read().splitlines(),
      'CH': open('CH','r').read().splitlines(),
      'CZ': open('CZ','r').read().splitlines(),
      'DE': open('DE','r').read().splitlines(),
      'ES': open('ES','r').read().splitlines(),
      'FR': open('FR','r').read().splitlines(),
      'GB': open('GB','r').read().splitlines(),
      'IE': open('IE','r').read().splitlines(),
      'IT': open('IT','r').read().splitlines(),
      'MX': open('MX','r').read().splitlines(),
      'NL': open('NL','r').read().splitlines(),
      'NZ': open('NZ','r').read().splitlines(),
      'PL': open('PL','r').read().splitlines(),
      'RO': open('RO','r').read().splitlines(),
      'RU': open('RU','r').read().splitlines(),
      'SE': open('SE','r').read().splitlines(),
      'SG': open('SG','r').read().splitlines(),
      'US': open('US','r').read().splitlines(),
}


for city in cities:
    for x in range(0, len(cities)):
          print(cities['AU'][x])
so how do you iterate over it?
rapid ridge
for city in cities:
    for x in range(0, len(cities)):
          print(cities['AU'][x])
TypeError: list indices must be integers or slices, not str
eager heath
Which line ?
rapid ridge
print(cities[city][i])
rapid ridge
TypeError: string indices must be integers the same
eager heath
for city in cities:
 for i in cities[city]:
print(i)```?works , but how can I now this ?
"I am using US wordlist " + Los Angeles, CA
"I am using US wordlist " + San Jose, CA
"I am using CA wordlist " + Toronto, ON
What does the last snippet output ?
hazy sierra
That's confusing
rapid ridge
for countries in country:
 for i in country[countries]:
  print("I am using {} wordlist amd I am in {}").format(i)
wouldn't split lines return each line in a list ?
 arctic wedgeBOT
:incoming_envelope: :ok_hand: applied mute to @rapid ridge until 2019-10-09 09:48 (reason: newlines rule: sent 145 newlines in 10s).
hazy sierra
What the heck
 lyric canopy
!unmute 518596072122351637
arctic wedgeBOT
:incoming_envelope: :ok_hand: pardoned infraction mute for @rapid ridge.
rapid ridge
great
eager heath
Thanks vez
rapid ridge
yeah
for link in self.links:
      for countries in country:
       for i in country[countries]:
           print("using {} wordlist amd I am in {}".format(countries,i))
the last one integrate the links
eager heath
you can also use fstrings
rapid ridge
self.links = open('indeed.txt','r').read().splitlines()
arctic wedgeBOT
In Python, there are several ways to do string interpolation, including using %s's and by using the + operator to concatenate strings together. However, because some of these methods offer poor readability and require typecasting to prevent errors, you should for the most part be using a feature called format strings.
In Python 3.6 or later, we can use f-strings like this:
snake = "Pythons"
print(f"{snake} are some of the largest snakes in the world")
In earlier versions of Python or in projects where backwards compatibility is very important, use str.format() like this:
snake = "Pythons"

# With str.format() you can either use indexes
print("{0} are some of the largest snakes in the world".format(snake))

# Or keyword arguments
print("{family} are some of the largest snakes in the world".format(family=snake))
how can I complete the string ? using https://www.indeed.com/jobs?q=
links = open('indeed.txt','r').read().splitlines()

for link in links:
      for countries in country:
       for i in country[countries]:
           print("using {}".format(link))
```+ job_qry +'&l=' + str(city) + '&start=' + str(start)
our output looks like this using https://www.indeed.es/jobs?q= now
eager heath
Did you read the embed sent by the bot just up here ^?
rapid ridge
yeah
this are stored in a file using https://www.indeed.es/jobs?q= , how can I supposed to complete the string ? in this case I cannot do https://www.indeed.es/jobs?q={}
eager heath
print(https://www.indeed.es/jobs?q=job_qry&l={i}&start={start})
rapid ridge
this should be static without a file , but using for loop how can we complete it all the links?
for link in links:
      for countries in country:
       for i in country[countries]:
           print("using %s "%(link+"A"+"^S"+"a")) # dirty fix it . but how can I do it in a better way?
Hey im working with the MNIST fashion dataset as a project for school. I am working on a little data analysis and I was wondering, what could be interesting to look at? I just made a histogram from all of the labels, but its not very describing. Also how can I make a seaborn scatterplot with the fashion mnist??
 slim fox
I am not sure that you can do much on that kind of image data
@barren bluff what's your task exactly?
barren bluff
yeah I kind of figured, I transformed some of the data via PCA and made a scatterplot, but not much more than that
I just had to do a data analysis for my project, I am going to create a neural network and use CNN's later on though
slim fox
for images themselves you can just do smth like this:
plt.imshow(images[n], cmap=plt.cm.binary)
yeah I could do that too
 serene veldt
Are there any good metrics for defining batch size and epochs?
 silent swan
differs widely for tasks/models, unfortunately
sometimes it's just determined but how much you can fit in memory
 vestal pecan
anyone here experienced Alteryx before or knows about ?
 lapis sequoia
sure
what do you want to know
it's just a bunch of blocks you can connect together to run experiments... meant for Enterprise users
think.. it's like matlab for data science
vestal pecan
yeah basically the company put me into test, trying data analytics using python and also predictive analytics with alteryx
I m a bit confused on which approach to go for and whether knowing alteryx would be any advantage in future jobs
though the course of learning alteryx was not that good because, it is all about dropping blocks, which didn't explain much
vestal pecan
I liked both, tho i found python more interesting, but I don't feel confident enough to do forecasts or analysis
there are zillions of models, and ways for each model, etc. and online each article says each model is not good enough
barren bluff
hey any of you know how to add references inside of markdown cells in jupyter notebooks?
 dim beacon
@barren bluff what do you mean by “reference” ?
barren bluff
Like a reference to an article
because I used something that stood there
and I dont want to plagerise
dim beacon
I use this
Here is some ref[^foo]. And another one[^bar].

[^foo] _Great Book_ by _Great Author_
[^bar] [Link to cool study](https://example.com)
That's not standard Markdown though
barren bluff
ah thanks!
hey how do you add more neurons per layer when working with keras? Im using a mlp algorithm
 desert oar
@dim beacon sadly you're right, commonmark doesn't have footnote syntax
however pandoc markdown does support footnotes https://pandoc.org/MANUAL.html#footnotes
 crude flame
So I just saw that Deep Mind has some really interesting internships coming up next year and I think I'll apply, but atm I'm doing a PhD in Maths with no AI or Data Science relation... I know some basics in both, but would like to really brush up on my skills and try to do some small project - anyone knows any good reviews/books/papers/other ressources to get me towards research level AI problems? I know it's a very broad question, but I'd be happy about any input and am willing to read some heavy and complicated stuff, if I can learn something from it
desert oar
good question, not sure if the Goodfellow book is still considered relevant
crude flame
so far for Deep Learning I have the Chollet book Deep Learning with Python and I did like half of it so far, but it's very focused on applying DL and I think I'd like to learn some more theory as well
or on the application side some more physics- or math-related applications would be interesting, since I'm doing Mathematical Physics... also went to a summer school about Deep Learning for High Energy Physics at some point, but that was mostly also very introductory
vestal pecan
So after learning data wrangling, connecting to api, pandas, plotting and such in python, is there any website or so to practice these stuff and learn prediction technique or so through exercises ?
I have knowledge in statistics not super strong, but good in probablities and stats and such. But not forecasting models.
Or models
deft harbor
Search Harvard intro to data science
They have a lot of notebooks to work through on their github
desert oar
or start doing kaggle competitions
they tend to throw you into the deep end with little assistance
you probably won't get a good score but you will get the chance to practice
doing old kaggle competitions is probably better
the new ones are pretty sophisticated
vestal pecan
I m not sure i can do competitions
desert oar
you dont have to win
in fact you probably wont even come close to winning
the point is, it's a chance to work on an unfamiliar problem and try out new skills/techniques without pressure to succeed or fail
vestal pecan
Oh will they like tell me what to do and show me answers so i understand ?
I like the projects where they help you reach the answer so you understand how to think when you have a specific problem
desert oar
No, it's the opposite
However they have active discussion forums
So you get to see what other people are attempting and working on
vestal pecan
Oh okay thank you!
lapis sequoia
hi
I have javascript cell magic available on my jupyter.. i'm trying to find a way to add a way to add file upload button to a cell, so I can upload from local to the notebook
desert oar
Notebooks dont have a filesystem to upload to...
lapis sequoia
sure they do
 small ore
I only see a blank website when I go to Kaggle. Is it geography limited?
Also, has anyone found out anything sane from the annealing database on UCI? Or is there some questions/goals somewhere on the web on what to obtain from the UCI database?
desert oar
probably javascript
small ore
I tried multiple browsers and I even tried from an android mobile.
 lapis sequoia
hi, I want to apply a function to a single dataframe column
trying to figure out the most efficient method..
desert oar
@lapis sequoia what kind of function? usually df['mycol'].map is sufficient
lapis sequoia
ok.. but the function I'm mapping to.. how should I define it
like, should I pass the whole dataframe, and define the name of the column I want to use within the function
I think I'll pass one column as a series, because I want to create a separate column using this
hmm
it doesnt work
def convert_open_to_easy_id(open_id_row_input):
    response_xml_as_string = requests.get(url = URL,
                                          params = {'openid':open_id_row_input}).text
    responseXml = ET.fromstring(response_xml_as_string)
    return responseXml.find('easyId').text

working_df['Easy_id'] = working_df['Open_id'].apply(convert_open_to_easy_id)
like.. the new column gets created and everything.. but everything inside it is None
desert oar
that probably means your function is wrong
lapis sequoia
hmm :<
it was working fine for a single request though
I just checked it.. it works fine for a single input
lapis sequoia
do i use apply or map
desert oar
age old question
some say the answer was once written on a scroll, but that scroll has been lost to the sands of time
i usually use map for Series
and apply for DataFrame
the main reason being that .map(..., na_action='ignore') is extremely useful
lapis sequoia
here i'm passing a series.. because it's one column of a dataframe
desert oar
so i personally would use map
apply wouldnt be wrong
but i personally use map for series
lapis sequoia
I should probably look up how they differ in operation
right after I figure out why my function doesnt work x.x
desert oar
they dont, really

Stack Overflow
Can you tell me when to use these vectorization methods with basic examples?
I see that map is a Series method whereas the rest are DataFrame methods. I got confused about apply and applymap meth...
Stack Overflow
Series.map():
Map values of Series using input correspondence (which can be a dict, Series, or function)
Series.apply()
Invoke function on values of Series. Can be ufunc (a NumPy function that
lapis sequoia
if I apply on a series.. what is the input to a function
each element of the series one by one? or the whole series?
lapis sequoia
and map is the same?
desert oar
yeah
lapis sequoia
then why doesn't my function work for series :<
going nuts
ok I think I got it
This works:
convert_open_to_easy_id('url as string')
this doesn't work
convert_open_to_easy_id(working_df['Open_id'][0])
just need to figure out why..
ok
I figured out why
my data was wrong
I am such an idiot
I left the url as part of the data....
 late gull
Any good data scientists who wanna team up for kaggle NFL competition?
desert oar
@late gull what's the timeline for it? i might have time depending on when it's happening
late gull
@desert oar About 2 months to deadline 1 mont to group merge
desert oar
when were you looking to get started
late gull
I already did 
desert oar
oof alright. thats a little short of a deadline i think considering what's going on in my life currently
i'll probably have to pass but good luck
late gull
Allright cheers
 fading kernel
Hi together,
I have a little Problem in one of my project atm.
i have a class in which i create a countVectorizer and create vectors with fit_transform. This generates a _vocabulary.
I would like to have this CountVectorizer with the vocabulary in one file to be able to reuse it in another class.
Does anyone have any advice for me? I already tried to do the whole thing with save_npz. But it didn't work properly.
fading kernel
i create a post 🙂 https://stackoverflow.com/questions/58344350/how-to-save-and-load-vocabulary-from-a-countvectorizer?stw=2
Stack Overflow
I have a class in which I create a countVectorizer and create vectors with fit_transform. This generates a vocabulary_.
I would like to have this CountVectorizer with the vocabulary in one file to be
native patrol
pickle/joblib is standard for sklearn objects
lapis sequoia
Anyone have an idea how I could show the relationship between 3 variables?
How I could plot that visually?
A scatter plot?
late gull
Anybody wanna team up for kaggle competition?
@lapis sequoia use the 3rd variable as hue
late gull
@lapis sequoia I am familiar. How many of your variables are categorical or numerical?
lapis sequoia
All three are numerical
@late gull I used pd.cut to bin the data
Now it's just a matter of how I can plot this
lapis sequoia
I was thinking about what you said - using the third value as a hue
So it would be just plotting 2 numerical variables
Or is that assumption incorrect?
 obtuse skiff
Can someone explain what it means when it says says maxCategories for Vector Indexer? in pyspark
"Decide which features should be categorical based on the number of distinct values, where features with at most maxCategories are declared categorical."
idk what this means
late gull
@lapis sequoia That's what I would do. But it only works if one of the variables is categorical (not continous)
lapis sequoia
I could certainly change one of the variables to a categorical one
@late gull One of the columns I'm working with only contains 2 values - so I could definitely do that
lapis sequoia
Yeah, but my question is how do I plot this on Seaborn
I binned the data
Now I don't understand how to plot it @late gull
native patrol
@obtuse skiff https://spark.apache.org/docs/latest/api/java/org/apache/spark/ml/feature/VectorIndexer.html
it just checks if the number of distinct values in that column is less than or equal to maxCategories, then it treats it as a categorical column - otherwise treats it as a continuous variable
deft harbor
Does anyone have a recommendation on where I should start on big data systems? Example, spark vs the alternative.
I guess a better question would be, which systems should I focus on learning first
lapis sequoia
depends on your use case.. field of application
spark, kafka.. you can't go wrong with those.. Then big data formats..
avro, parquet, capacitor
obtuse skiff
Say I want to have n number of dataframes, so that I would have a regression model on each. Could I create a dataframe that holds dataframes? or would that not work?
lapis sequoia
a regression model for what..
deft harbor
What is the best way to import this .txt file?
CG FEB19 30 YEAR US TREASURY BOND OPTIONS CALL
10600      ----     39'37B    38'33A     ----     38'48    -'44                  39'28
10700      ----     38'37B    37'33A     ----     37'48    -'44                  38'28
10800      ----     37'37B    36'33A     ----     36'48    -'44                  37'28
10900      ----     36'37B    35'34A     ----     35'48    -'44                  36'28
11000      ----     35'37B    34'33A     ----     34'48    -'44                  35'28
11100      ----     34'37B    33'33A     ----     33'48    -'44                  34'28
11200      ----     33'37B    32'33A     ----     32'48    -'44                  33'28
11300      ----     32'37B    31'33A     ----     31'48    -'44                  32'28
11400      ----     31'37B    30'33A     ----     30'48    -'44                  31'28
I thought it would be tabs, but it just isnt coming out right
 unkempt spire
Maybe something like : ``` with open('path_to_file', 'r') as file_in:
lines = readlines()
and after that split using spaces with str.split(' ').strip()
for each line
using the same approach for the first line
Tell me if you're still there
silent swan
@obtuse skiff why not just a list or dictionary of dataframes
obtuse skiff
so I need to have n linear regression models
and I will have the n dataframes holding the data for each model
but I was hoping to be able to do each of them in parrellel but idk if thats possible
silent swan
right, you could still do that with a list of dataframes
e.g. using joblib to do them in parallel
unkempt spire
@deft harbor
data_df = pd.DataFrame()
headers = ['put', 'them', 'here']
for ind, line in enumerate(lines):
    tmp_df = pd.DataFrame()
    if ind>0:
        lines_split = line.split(' ').strip()
        for index, element in enumerate(lines_split):
            tmp_df[headers[index]] = element
        data_df = data_df.append(tmp_df)
maybe not the best but the first that comes in mind
silent swan
yea don't use df.append
 candid solar
I am not sure if this is the right place to ask, but I have three dataframes that use datetime64's as their indexes.
I want to make stacked bar graph, but the dates don't always overlap properly, so I think I need to merge these data sets into one big dataframe, but I am unsure how best to do so
the original data comes from csv's (downloaded from netflix) of an item title, and a date watched ("YYYY-MM-DD")
I've used group by to get a count of things watched per day
and I want to do a stacked bar for each user's data
obtuse skiff
So I want to loop through like 16 things of data creating a dataframe out of it, then append those rows to a single data frame
dataframeCombine = Row('prediction', 'label', 'features')
for i in lst:
#code
dataframeCombine = dataframeCombine.union(dataframeTemp)
something like that where the temporary dataframe has the columns 'prediction', 'label', 'features'
but Im getting AttributeError: __ fields __ when I do the union, as well as check what columns are in the dataframeCombine
in pyspark
 hot compass
can somone help me with json files
like hop in the voice chat with me so i can describe what i mean
 earnest prawn
I could but im around publicly right now so i can hardly jump into voice chat with you
 marsh token
Is there any equivalent of pca methods (R) in python?
The pcaMethods package contains the following man pages: asExprSet biplot-methods bpca BPCA_dostep BPCA_initmodel centered-pcaRes-method center-pcaRes-method checkData completeObs-nniRes-method cvseg cvstat-pcaRes-method deletediagonals derrorHierarchic dim.pcaRes DModX-pcaRe...
Also, is there an R discord?
small ore
The closest I can suggest is the Programming channel in /r/LearnMachineLearning. Maybe people there know of a R only server too
@marsh token
silent swan
what do you need from pca methods
 fallen anchor
is docker the way to go for running TF GPU code?\
silent swan
I've always just run directly/with conda
fallen anchor
Is conda like pip?
If I eventually wanna run is aws, isndocker good?
What is do you use @silent swan
silent swan
conda is sort of like pip +environment manager, and it's better for installing scientific computing libraries
I've not used docker myself, always seemed like a lot more work, but also I'm not productionizing my models
silent swan
macos / linux
 nocturne loom
I am getting the following error from fill_between from matplotlib:
TypeError: ufunc 'isfinite' not supported for the input types, and the inputs could not be safely coerced to any supported types according to the casting rule ''safe''
def plot_area(f,g,var,x0,x1):
    f_coords = []
    g_coords = []
    x_coords = arange(x0-1, x1+1,0.1)
    for i in x_coords:
        f_coords.append(f.subs({var:i}).evalf())
        g_coords.append(g.subs({var:i}).evalf())
    plt.plot(x_coords,f_coords,x_coords,g_coords)
    plt.fill_between(x_coords, f_coords, g_coords)
    plt.show()
f and g are sympy expressions, so I am creating a list of x-coordinates and their corresponding y-coordinates for functions f and g from point x0 to x1 with a bit of leeway for plotting purposes.
I don't really understand why fill_between errors out like that in all honesty.
fallen anchor
Am I wrong?
I don't see how it could possibly get any bigger
hmm
what if it re-uses edge data
 limber cradle
I am barely entering data science but isn't the point (well, one of the most important points) of max-pooling to make your image smaller? If your 2x2 filters don't overlap at all, then it'll be 13x13
quartz stream
Yes for every 2x2 matrix
it will take the max value
so the output will be smaller than 26x26
So only B is the correct answer
@fallen anchor
silent swan
actually it depends on the stride
and padding
if you do some padding and stride=1, you can perversely even get a slightly larger output (although I think the current libraries don't let this happen)
 loud kindle
anyone know how i can plot a large amount of data on a bar graph? I want to plot 1000 "bins" and show the integer at the bottom of the graph (with matplotlib), but the labels just completely overlap :(
ive tried plt.figure(figsize=(2^16,2^16), dpi=200) but the figure is still just 640x480 px
deft harbor
Don't know if there is a way to fit 1000 labels..
Do you need EVERY label? Is there some sorting you could do, and then reduce it to major ticks?
loud kindle
i could put them into buckets, but i thought there might be a way to increase the resolution. Of course thats not gonna be efficient, but a 2^16 inch plot with 200 dpi should be able to handle 1000 labels imo 😄
im trying a scatterplot instead now.
silent swan
what sort of data is this?
loud kindle
its the pixelcount of 10k images
y shows the amount of images with that pixelcount, x shows the amount of pixels. there are ~1000 different formats in the set
silent swan
why not just a histogram with fewer bins?
loud kindle
im just trying stuff out tbh. I tried a bargraph instead because the bins arent continous, so i thought i will save on empty bins
why do you think a histogram is better @silent swan ? isnt it kind of the same thing?
silent swan
what command are you using to plot exactly?
fallen anchor
@quartz stream Ah, I got it convused
limber cradle
So I'm trying to dig into a starter project. Autoencoder - D&D dungeon maps (of a consistent style) - sliders in the middle - create new dungeon maps. That's pretty straightforward.
I also have a decent folder of maps and I've already ditched everything not within a particular style. Next issue is that they're not consistent in size, scaling, or aspect ratio.
How consistent do I have to make these images, really?
limber cradle
They're jpg currently
examples in variation
I need to make another pass to crop out side views etc and rotate anything that's rotated
limber cradle
I was considering doing it manually since I don't know how to do scripting in PS (which I don't have) or GIMP, and I don't know how to use AI/ML to do this for me either
I don't have THAT many maps that need big bits cropped out
fallen anchor
then do it by hand
no need to spend 4 hrs programming that if it will only save you 10min of time
but of course this ^ is more fun
you could blow the contrast to an extreme ratio with PIL or something
than determine the coords of the hope fully 4 big white boxes
and then get the cords for the top left one, or which ever one you want to use
or just a simple for loop to find the white pixels
limber cradle
you're describing a way to find the grid size? And then rescale images automatically?
limber cradle
Not with any real consistency. A single map may contain separate buildings or floors and there's no rule about where the whitespace between may go.
 umbral olive
loud kindle
umbral olive
loud kindle
@silent swan
plt.bar(buckets, bar_values)
plt.xticks(range(len(bar_values)), buckets, rotation=90 )
plt.show()
 safe monolith
So i'm using python3 to try anonymize some data
atm i'm working on richtext/html
 soup = BeautifulSoup(x[0], "html.parser")
            #Removes Images.
            for image in soup.find_all('img'):
                image.decompose()
            for p_tag in soup.find_all('p'):
                for p_cxt in p_tag:
                    words = p_cxt.split(' ')
                    for i, word in enumerate(words):
                        words[i] = fake.word()
                    words = ' '.join(words)
                    p_tag.string.replaceWith(words)
fake.word() generates a fake word,
what i'm trying to do is replace every word ...
with a fakeword
also removes all 'imgs'
 supple ferry
@safe monolith this is for other help channels I presume.
safe monolith
@supple ferry got told might get help In here...
 small shore
I am trying to build a good word embedding system that will allow me to go from words to embeddings and back to words for a chatbot (or atleast build a large vocabulary tokenizer from tensorflow and well built word embeddings). What would the best method be to go about doing this?
silent swan

Library for efficient text classification and representation learning
or GloVe for something more standard
but the question is what you're doing for the chatbot
supple ferry
Any daily users of TS data?
I have some timestamps of different events and I extracted the time from midnight of the earliest event of that type and of that day as a float, which gives me good range of float numbers. What can I extract more? Using sin cos for them is one way and I already did it. How would you approach this question?
 normal plinth
Hey guys, basically a problem I'm having is that I'm using Pandas in Anaconda, trying to predict a health score value for each person. The value is already within the database, but I want the system to try and get them correct based off other factors such as Age, weight, if they smoke etc. The problem is that the correct percentage that they guess is very low and I don't know why it's happening or how I can fix it. I'll post the code too.
def display(mess, values):
    print()
    print("-----", mess, "-----")
    print(values)
    print("------------------------")

import numpy as np
import pandas as pd
from sklearn.naive_bayes import GaussianNB
from sklearn.model_selection import train_test_split


health_data = pd.read_csv("C:/Users/??/Downloads/HealthScores.csv")

health_train, health_test = train_test_split(health_data, test_size=0.2)

#display("Healthscore", health_data)

#display("Column Headings", list(health_data.columns.values))

f_train = health_train[['Age', 'Weight  in lbs', 'Height in Inch',
                        'Units of alcohol per day', 'Cigarettes per day', 'Maritial Status Num',
                        'Additional People in household', 'Salary', 'ActiveNum']].copy()
f_test = health_test[['Age', 'Weight  in lbs', 'Height in Inch',
                      'Units of alcohol per day', 'Cigarettes per day', 'Maritial Status Num',
                      'Additional People in household', 'Salary', 'ActiveNum']].copy()

s_train = health_train[['Health Score (high is good)']].copy()
s_test  = health_test[['Health Score (high is good)']].copy()

#display("features", f_train)
display("", s_train)
# Create a Naive Bayes Classifier. By convention, olf means 'Classifier'
clf = GaussianNB()

#Train the Classifier to take the training features and learn how they relate
#to the training y (the species)
clf.fit(f_train, s_train).predict(f_train)


correct = 0
wrong = 0
for index, row in health_test.iterrows():
    prediction = clf.predict([row[['Age', 'Weight  in lbs', 'Height in Inch',
                                   'Units of alcohol per day', 'Cigarettes per day', 'Maritial Status Num',
                                   'Additional People in household', 'Salary', 'ActiveNum']]])

    diff = abs(row['Health Score (high is good)'] - prediction)
    if (diff < 10):
         correct = correct + 1
    else:
        wrong = wrong + 1

total = correct + wrong

print("Correct ", correct, " wrong", wrong)
print("Total   ", total,   " percentage right", (correct*100)/total,"%")

print("Predict Data", clf.predict(f_test))
display("Actual Data", s_test)
Here is a bit of the CSV file that I am using.
 polar acorn
You are treating this a classification problem but it looks to me more like a regression problem. Maybe you should try using a simple regression model?
supple ferry
If values are not discrete you should not use classification @normal plinth
 rare coral
  File "N:/Discord Bot-20190711T105934Z-001/ChatBot.py", line 6, in <module>
    import tflearn
  File "C:\Program Files\Python37\lib\site-packages\tflearn\__init__.py", line 4, in <module>
    from . import config
  File "C:\Program Files\Python37\lib\site-packages\tflearn\config.py", line 5, in <module>
    from .variables import variable
  File "C:\Program Files\Python37\lib\site-packages\tflearn\variables.py", line 7, in <module>
    from tensorflow.contrib.framework.python.ops import add_arg_scope as contrib_add_arg_scope
ModuleNotFoundError: No module named 'tensorflow.contrib'```w h el p
normal plinth
@supple ferry @polar acorn What do you both mean by should not use a classification?
supple ferry
If the value you try to predict only takes finite number of options for example only 0, 1, 2, 3 then you should use classification. If the value can also be 0.1, 3.8 and etc, aka continuous values, you should use regression
@normal plinth
polar acorn
It may be a bit more complicated sometimes though. Say you want to predict a score say for a movie or something which is an integer between 0 and 100. What you're trying to predict is discrete values. But there are many discrete values and they are ordinal so you should use regression.
slim fox
I would probably say that regression is for when your predictable variable can be ordered
and ofc they are not just 1,2,3 discrete values
normal plinth
@supple ferry @polar acorn The only numbers they need to predict, range from 80-400, so decimals aren't needed - there is a finite number within the database.
normal plinth
How would I change my code so that it uses regression? I'm currently using abs to try and get the percentage up
polar acorn
@normal plinth
As I said sometimes it's best to use regression even though your input is discrete. Ask yourself this: if you predict 99 and the correct score was 100 are you closer than if you would have predicted 45? If you use classification your model will treat both 99, 23 and 100 as three separate classes that has nothing with each other to do. Obviously it would be better to predict the wrong number but be close than to predict the wrong umber and be far off. This means you should use regression
slim fox
have you done EDA on it?
polar acorn
Anyway as your already using sklearn you can check out the many regression models they have.
normal plinth
@polar acorn Isn't that what abs is? For example, if I have an abs of 25 and it guesses 110, when the correct answer is 100 it'll still deems it correct
What is EDA?
normal plinth
No, I don't think I have.
Also, if I wanted to train the model with a file, but then test it on a different file (using the train_test_split method), would I have to load both files in within the same block of code?
polar acorn
abs() just means absolute value (look it up if you don't know what that means). Such that if you're prediction is either -10 wrong or 10 wrong the error will come out as 10. I see that you check if your prediction is close enough. But this doesn't solve your problem. Your problem is that your model doesn't care about getting close, just about getting it exactly right. So you should choose another model.
normal plinth
I've tried about 5 models (Tree, SVM, ForestTree, Naïve, and MLP). All of which give a low percentage - The Tree model being the best (gives around 55%).
polar acorn
They are all models that can be trained for both classification and regression. Did you use MLPClassifier or MLPRegressor?
normal plinth
Classifier
polar acorn
Try Regressor 😉
normal plinth
Alright, I'll try that now - you would just change the include right?
polar acorn
Or any of the other sklearn models that say regression (check the sklearn docs if you are unsure). And do read up on classifiers vs regressors. There are probable many good intros and it's a important concept.
The include?
polar acorn
Just the import or the classifier also?
normal plinth
I changed the classifier to regressor within the import.
polar acorn
you need from sklearn.neural_network import MLPRegressor and clf = MLPRegressor()
polar acorn
Well that's not that good. But there many many things to tune in a MLPRegressor. Theres also many other types of regressors. Try out a few different settings and also a few different regression models.
normal plinth
I've literally tried a load of models and they all around the same percentage - do you think it's something wrong with the code in relation to the size of the data I.E, 5000 + datasets.
polar acorn
While I don't know the size of the data but I'd look at other stuff first. For instance right now we forgot to scale our data. Which is often nice to do when working with MLP's. Maybe you could try a random forest regressor instead?
normal plinth
Before trying to predict health scores, I tried to predict a different dataset (wine quality) and it gave me 60/70% with an abs of 2 - so that worked.
Just used the forest regressor and it went from 10% to 45%, so that's good, but it's still pretty low
That's with a abs of 10 too
polar acorn
As I said theres many many ways of getting more out of models. Do look at the docs for the models and see how you can tune them. Also when we do regression we usually don't look at accuracy (as in how many are closer than 10). We often look at MSE (mean square error) as that is often more informative. When you check with an abs of 10 as you say that means to be 11 wrong or 1000 wrong are equally wrong.
normal plinth
By 'Mean square error' do you mean, you calculate the error percentage
And the lower it is, the better?
polar acorn
No, to calcuate the mean square error you find the error of each prediction, square it and then find the mean of all of those. You don't have to calculate them yourself though, sklearn has that implemented. from sklearn.metrics import mean_squared_error and then just call mean_squared_error(true_values, predicted_values) where true_values and predicted_values are some kind of array with true and predicted values
normal plinth
Alright fair - I'll give it a try.
One final question, if you don't mind. If I wanted to train the model with one csv file, but then test it on smaller csv where I have to predict a health stone that isn't displayed within it; how would I do that, would I have to load the two csv's within the same block of code?
polar acorn
Though I'm not sure what you mean with block of code the answer is probably no. You can load one file and train your regressor on that and then load the other file and predict on that.
normal plinth
And that's all in the same python file? Because I tried to earlier and it didn't work
It just displayed the default values which were 0 as they hasn't been predicted yet
This is what I tried to do:
health_data = pd.read_csv("C:/Users/?/Downloads/Female(2)Database.csv")

health_datas = pd.read_csv("C:/Users/?/Downloads/Population(1).csv")

#health_train, health_test = train_test_split(health_data, health_datas, test_size=0.2)

health_train = train_test_split(health_data, test_size=0.2)

health_test = train_test_split(health_datas, test_size=0.2)

#display("Healthscore", health_data)

#display("Column Headings", list(health_data.columns.values))

f_train = health_train[['Age', 'SexNum', 'Weight', 'Height','Alcohol Per Day (Units)', 'Cigarettes per day', 'ActiveNum']].copy()
f_test = health_test[['Age', 'SexNum', 'Weight', 'Height','Alcohol Per Day (Units)', 'Cigarettes per day', 'ActiveNum']].copy()

s_train = health_train[['Health Score (high is good)']].copy()
s_test  = health_test[['Health Score (high is good)']].copy()
If you wanted to train on one file and test on the other you don't need to use the train_test_split. Just read one file and use it as f_train and use the other file as f_test.
normal plinth
So how would I write that?
polar acorn
Were you define f_train for instance just use f_train = health_data[['Age',... and use health_datas for f_test. Or switch if you want to train on datas and test on data.
normal plinth
That has worked - Thank you so much. Only problem is that it's only predicting 19 of the health scores, not the full 20. It's like it can't read the first column.
And when it is training the model, it only trained 508 bits of data when there's 5k+ of them.
Nevermind - I can't count apparently. It goes all 20.
The second problem is still happening though (training only 500).
It only trains 10% of the data - does that mean it has defaulted if I haven't specified a value?
polar acorn
Hmm that sounds strange. How does your code look now?
normal plinth
def display(mess, values):
    print()
    print("-----", mess, "-----")
    print(values)
    print("------------------------")

import numpy as np
import pandas as pd
from sklearn import tree
from sklearn.model_selection import train_test_split


health_data = pd.read_csv("C:/Users/16027787/Downloads/HealthScores.csv")

health_datas = pd.read_csv("C:/Users/16027787/Downloads/Population(1).csv")

f_train = health_data[['Age', 'SexNum', 'Weight  in lbs', 'Height in Inch',
                      'IQ', 'Units of alcohol per day', 'Cigarettes per day', 'Maritial Status Num',
                      'Additional People in household', 'Salary', 'ActiveNum']].copy()
f_test = health_datas[['Age', 'SexNum', 'Weight  in lbs', 'Height in Inch',
                      'IQ', 'Units of alcohol per day', 'Cigarettes per day', 'Maritial Status Num',
                      'Additional People in household', 'Salary', 'ActiveNum']].copy()

s_train = health_data[['Health Score (high is good)']].copy()
s_test  = health_datas[['Health Score (high is good)']].copy()
I would say that's the main bit of the code - where the problem probably is
Before deleting the train_test_split - this is what I used to tell it to train 20%
health_train, health_test = train_test_split(health_data, test_size=0.2)
Hmm that seems fair enough. I assume you are sure that f_train now has 5k+ rows? You can check by printing out f_train.shape
polar acorn
Does your code still say for index, row in health_test.iterrows(): ?
normal plinth
Yeah, do I need to change that to health_data?
Health_data is the training csb.
*csv
datas being the test
polar acorn
Yes. That would print "Total 5k+" if that is what your after.
normal plinth
Oh wait, no - I did change it to:
for index, row in health_data.iterrows():
What I'm after is that its training on only 500 while there is 5000 within the csv file
Nevermind - it's working now. I was using the wrong one; my bad.
polar acorn
Note however that while it can be interesting to look at the how well the model does on the training data it doesn't really say much about how good the model is. If you want to evaluate how good the model is you need to check how it performs on the test data. So you should certainly not say you model is right 70% of the time just because it scores that on the training data.
normal plinth
Yeah, I know that. I looked at the stats for the test (Gender, if they smoke, weight, active or not etc.) And the health scores looks quite accurate.
polar acorn
Well done 👍 There's probably many things to improve still, but that is always true no matter the case. Good luck further.
normal plinth
Thank you so much, pptt - you're an actual legend mate. I would legit buy you a pint if I knew you.
 hallow hawk
hey, hope you all are doing well!
noob question here - is it worth to install Anaconda instead of manually each lib and software? I'm already installed numpy, scipy, pandas, scikit-learn and jupyter and it was such a painful process. jupyter dot org said they strongly recommend installing Python and Jupyter using the Anaconda Distribution.
I'm a little afraid of such a massive distro with a bunch of useless (for me ofc) libs. usually I prefer to install each piece manually (so I know what each lib do), but maybe I'm just a paranoid?
slim fox
and it was such a painful process
@hallow hawkwhy so?
most usually it is as simple as pip install lib
hallow hawk
a lot of errors. I spent a few hours in searching and trying to fix it
silent swan
yes, use miniconda, that's conda without libraries installed
 tidal remnant
Would someone help me understand back propagation?
of a neural net
so basically you change the weights of each node by however much the previous node was wrong, based on it's weight?
how much do you change it by
ping me if you have a response please
silent swan
differentiation and chain rule
tidal remnant
okay could you elaborate a little more on how differentiation is used?
earnest prawn
If you want to know that youd actually have to go through how exactly the math behind back propagation works, but basically you derive the loss function in order to find out into which direction you should step to minimize it a little more and based on that derivative + your neural networks derivative can figure out how you have to change the values to step that deep
 graceful birch
I have some long-running ML pipelines. What tools are good to manage the pipeline.. say start dependent tasks, report progress or errors to a server/dashboard?
 blissful badger
I'm not entirely sure but maybe RQ or Hangfire?
graceful birch
@blissful badger those seem a bit like Celery, I looked at it but i found the issue was they want me to "lift and shift" my stuff into their framework & language
it would great if i can do something like
./prepare_data --progress_callback=http://127.0.0.1/progress?task_id=abc123
then inside my prepare_data program i can instrument it to make callbacks there
http://127.0.0.1/progress?task_id=abc123&percentage=1
http://127.0.0.1/progress?task_id=abc123&percentage=2
... etc
ie the task manager exposes an API that lets me instrument my code to report progress
dim beacon
@graceful birch Celery can do all that
graceful birch
@dim beacon let's say the ./prepare_data is a long-running Java process. The way I can think of is to have a celery task that
(1) Starts a socket server or HTTP server on localhost:6969
(2) Launches ./prepare_data --progress_server=localhost:6969 using subprocess
(3) The ./prepare_data process will send progress info the server started in (1)
(4) The handler for (1) will take the progress info it has been given and put that in celery's task state metadata ?
dim beacon
@graceful birch what I would do is make ./prepare-data feeding progress status to a Redis DB that you'd be able to query from anywhere
If you use Celery you'd be able to use that value to update the PROGRESS of the task
But do not start a web server for that
graceful birch
@dim beacon yes you are right no point in the webserver and we will have redis anyway
@dim beacon so something like this?
def prepare_data_task():
    progress_key = ... # some random key or the celery task id

    subtask = subprocess.Popen(["./prepare_data", "--progess_key", progress_key])
    try:
        while True:
            time.sleep(1.0)
            if task_is_done(subtask):
                break
            try:
                progress = redis.get('progress:' + progress_key)
                celery.update_progress(progress)
            except e:
                print('update progress failed')

        if task_went_pear_shaped(subtask):
            raise Exception(subtask)
    finally:
        if task_is_running(subtask):
kill_task(subtask)```@silent swan
thank you
supple ferry
@tidal remnant , look at this. this is the best explanation that i have come up with
https://www.youtube.com/watch?v=QJoa0JYaX1I&t=1s
In this video, I discuss the backpropagation algorithm as it relates to supervised learning and neural networks. Next Video: https://youtu.be/r2-P1Fi1g60 Thi...
@void anvil , i have been trying to find you on this discord for some time now, looks like you have deleted and restored your account
tidal remnant
awesome thanks
 upper eagle
Hey, I have two dataframes in pandas, df1 and df2
df1 looks like this:
a
c
b
e
j
df2 looks like this:
a
j
e
z
k
I would like to itterate each dataframe and check if the values matches
I have been trying to setup two for-loops as I would with lists in python
but have been running into issues.
I am looking for something like
    for j in df2:
    if i == j:
    print(f"{i} has a match in df2")
I have been looking around at pandas documentation for a while now and
have not been able to find something useful, any help would be appreciated 😄
 silk acorn
Oh, my bad, this was just element for element.
upper eagle
Yea I tried that already : (
silk acorn
You could turn the columns into sets and get the intersection if duplicates don't matter
supple ferry
@void anvil have you worked with time series data? I need some advice in feature extraction
silk acorn
@upper eagle set intersection seems to be one of the faster ways.
as opposed to np.intersect1d
upper eagle
yea duplicates don't matter, I will look into set intersection
supple ferry
@void anvil so, i have some timestamps of flight times, and I want to extract information from them. I already have weekdays. I also made a new variable which is this:
(timestamp of flight - midnight of the earliest flight in that direction) / 86400
which gives me a float of relative distances for every flight. I can then add cosine of it to my mnl
my question is, which other methods i can use to extract as much information from those horizontal features
supple ferry
if the flight is selected
my idea is treating flights on 10 october at 23:00 similar to the ones which are on 11 october but around midnight, 1 am
time is horizontal in this case
im trying ot make it vertical
supple ferry
How to do that? Can you give me any links where I can learn more about this
supple ferry
@void anvil so I have both origin and destination + every timestamp of every flight in that connection. I. E, the flight has 1 stop I also have its time and where the stop is
The idea with time since last flight seems reasonable. I will try it over the weekend or today if I get enough time
However, it might happen that it will be insignificant, because I already have a variable time since midnight of the earliest flight which I take as an arbitrary reference point
 jade pine
hello guys can any one help me in data science, i wanted to create a content in data science and the minimum word count is 1000 words, can any one suggest me any link or github repo from where i can take help
rare coral
reeeeeee how tf are we meant to use tflearn with tf 2.0
lapis sequoia
hey how can I group a pandas dataframe by it's index? (the index is non-unique),
 north river
where's a good place to ask questions about matplotlib?
supple ferry
@lapis sequoia df.groupby(df.index)
You may have to sort them by index first if it is time based index
silent swan
here's a good place to ask about matplotlib
 wet mica
@upper eagle there is a function within pandas called .iterrow()
it allows you to iterrate through items in a column without having to convert everything to a list or something.
for x in df.iterrow():
do some stuff here
you will have to check, but you can also designate which column it iterrates through. cant remember how off the top of my head though
 unreal dome
Hi. I'm a reasonably experienced dev in python and in other languages/environments and now have a task involving DSP-ish stuff, an area i've never dealt with before. (home project, so unconnected with my professional experience).
i have some ideas about how to approach it, but no clear idea which might be the best option. is this a good place to pose the question, or is there a more appropriate 'cord for python/dsp stuff?
(TL;DR- of the task: find where a slate tone, a ~1 kHz "sine" ends in an audio stream)
 fervent lance
is there a way to give the program x and y and get the pattern of it ?
it's an exponential function
 exotic reef
@upper eagle @wet mica i would advise against using iterrows it's quite slow. Better to use itertuples or convert to a dict with .to_dict(orient='records') which gives you a list of dicts. Unless you really need stuff returned as a series, the overhead of iterrows isn't worth it
@unreal dome do you know for sure the frequency of the sine wave you are trying to track?
@fervent lance what do you mean by 'the program' and pattern?
wet mica
@exotic reef that's really good to know. I'm used to working in R, so moving away from dataframes seems scary to me. I'll have to compare the scripts and see how it performs
exotic reef
Funny you should mention that, i am currently looking longingly at R's plotting ecosystem and tidyverse 😛
I did R aaages ago. I hate plotting in Python.
As for the issue at hand, unless you need Series specific functionality, list of dicts is the way to go
Stack Overflow
I have noticed very poor performance when using iterrows from pandas.
Is this something that is experienced by others? Is it specific to iterrows and should this function be avoided for data of a
It doesn't mention using dictionaries there, but it does put iterrows deadlast (almost)
silent swan
I like iterrows, but I would not use it if I were concerned about performance
good point above, feels like they should just expose .to_dict(orient='records') as a more convenient method
maybe an iterdict, corresponding to itertuples
exotic reef
Iterrows is fine when you just need to get the thing done, and as you say performance isn't an issue. But it can add up pretty quickly just because the performance hit is considerable. True, there is overhead in doing the to_dict conversion, and maybe memory overhead if you want to keep a copy of the original df or more cpu overhead if you convert back to df, but in my experience you can easily get a 20x speedup even including all this
I've not done extensive testing compared to iteruples though so maybe that is the best of both worlds
silent swan
does itertuples return tuples or namedtuples
exotic reef
Ah, good question. I think named tuples
unreal dome
@exotic reef it's notionally a 1 kHz sinewave, but in reality it's more a square wave with rounded corners so unfortunately its bandwidth is rather wider than what it should be. here's what the section of audio I want to algorithmically identify:
you can see what i mean about it being a square-ish wave. but at least its fundamental period is, indeed, 1 ms.
Its amplitude should nearly always be much larger (-6 dBFS) than the associated audio but of course I can't guarantee that. You can also see that its amplitude decays over about 8 periods. (the left hand side extends backward for about a second.) Some of the inputs come from a shotgun mic that is rather hotter and noisier than the section you see there.
unreal dome
possible approaches that occur to me include:
• simply calculate the RMS amplitute and look for the fall off — but this depends on a significant differential in the slate tone and the recorded audio, which isn't a safe assumption being that the target recording level for local peaks to be c. -12 dBFS.
• apply a narrow bandpass filter (IIR or FIR? idk the difference for these purposes) and do the same. The sidelobe frequency components will fall away and the 1kHz fundamental will come through, so the fact that it's not a true sine doesn't matter so much. This would be more accurate. Idk if there's a window comparable to that of an FFT, but I assume not in the same way.
• do a Fourier transform and look for when the peak at 1 kHz goes away. This involves a little imprecision because of the FFT window, but since the frame period is 40 ms (25 fps), i expect that this imprecision is going to be within a frame or two. I'm not sure that this is functionally different from the above and is just wasteful of cycles.
—
you or others here might think of an even better way to do it.
exotic reef
So is the idea that this signal will be inside another one and you want to dig it out?
Or you want to recognise precisely this wave when it appears without anything else noising it up
unreal dome
It's a slate tone: when the PCM recorder starts recording, it substitutes (rather than superimposes, I think) this ~1 second 1kHz tone on the four PCM tracks it records as well as outputs this tone to the camera's own audio input. That gets embedded in the video to ease synchronisation in post.
So the objective is to automatically correlate and align the four discrete PCM tracks with a fifth AAC-compressed audio track taken from video. Then, when the offsets are known, add the four PCM tracks to the video container. The result can then be imported into an NLE and the video editing and colour grading process goes as normal from there, but with the ability to switch between audio tracks as is indicated.
.
also worth mentioning that the slate tone always only ever appears within the first second of PCM tracks and within some variable number of seconds at the beginning of the video's audio track.
so i don't have to scan all of the audio, just the first few seconds of each of the five sources.
 vivid dagger
is k means the most efficient way to cluster data
supple ferry
@void anvil can you give me some more specifics?
 quaint marten
Hey, any data scientists around in this chat that I could ask a few questions to about the field
would be appreciated 🙂
quaint marten
@void anvil are you a data scientist?
I just wanted to know about what entry level job i should apply to
after gaining skills
whatentry level job will help me learn most about the field
quaint marten
i'm going the self taught root rage pop
sorry what I mean is what specific job should i target to learn the most about data science
e.g. a data analyst etc.
fallen anchor
data scientist is a job
 velvet kite
Does anyone know of a good tutorial to make a game as a custom gym environment?
and then make an agent to play it?
deft harbor
Quick question, because I'm pretty sure I've been looking at this for too long now.
When you use sklearns logisticregression, do I need to reshape the features (pandas df) first?
I know when it is a single feature I have to reshape using (-1,1)
Nm, ignore that
supple ferry
@velvet kite Sentdex has good tutorial on that
marsh token
@velvet kite use unity?
 hallow wave
As a data analyst what qualifications and theory would I need to know ?
lapis sequoia
depends what domain you're going to do analysis on....
so background knowledge for one
Spreadsheets, git and numpy..
basic statistics and statistical tests
 dusty talon
hi has anyone ever worked with facenet?
I'm working on realtime face recognition system using facenet, but direct euclidean distance comparison between two vectors (of faces) gave me too many false positives (and negatives too)
so I think maybe I need to train a more sophisticated face classifier
if anyone here have any thoughts, I would like some advice
deft harbor
I've built a classification model using LogitsticRegressionCV. There are three classes, 2 predictors and I've used 5 folds. However, I'm struggling with understanding the array that is output when using model.scores_
I can't post the whole output because of a limit on text, but it returns three of these.
0.0: array([[0.775     , 0.775     , 0.78333333, 0.78333333, 0.78333333,
         0.8       , 0.875     , 0.86666667, 0.86666667, 0.86666667],
        [0.80833333, 0.80833333, 0.80833333, 0.825     , 0.79166667,
         0.79166667, 0.88333333, 0.89166667, 0.89166667, 0.89166667],
        [0.83333333, 0.83333333, 0.84166667, 0.80833333, 0.86666667,
         0.86666667, 0.88333333, 0.88333333, 0.875     , 0.86666667],
        [0.83333333, 0.83333333, 0.83333333, 0.85      , 0.86666667,
         0.89166667, 0.89166667, 0.88333333, 0.89166667, 0.89166667],
        [0.80833333, 0.80833333, 0.80833333, 0.85      , 0.825     ,
         0.84166667, 0.89166667, 0.89166667, 0.9       , 0.9       ]]),
0.0, 1.0, 2.0
How do I read this?
wet mica
Looking for some input here: I am the only datascience person at my company. I got in contact with the datascience team of our holding company, and they want me to put together a wishlist of things I want so they can enable me to get my job done better. For context, I work in marketing data analytics
So far what I have is:
- github account on the corporate account
- virtual desktop or server space to run larger jobs on (my 8GB RAM laptop can't handle too much)
- server space to deploy bots from for automatic data retrieval
My manager wants me to go big on the asks, so does anybody here have any ideas of other things I could ask for? Previously I was a graduate student, so i was used to just getting things myself as I needed them. I'm not used to being able to put together a wish list like this.
slim fox
- virtual desktop or server space to run larger jobs on (my 8GB RAM laptop can't handle too much)
AWS probably is what you are looking fr
 oblique belfry
https://arxiv.org/abs/1802.04799
Just came across this. Somebody figured out how to compile ML models. Interesting...
I wonder if this (or strategies like this) will work.
arXiv.org
There is an increasing need to bring machine learning to a wide diversity of
hardware devices. Current frameworks rely on vendor-specific operator libraries
and optimize for a narrow range of...
 kindred flame
is it possible to make an poker AI?
I have no clue of data science just aksed it myself
 rigid storm
@kindred flame If by possible you mean it has been achieved by someone or some institution already, then yes
there are models that can play 100BB deep 6-max cashgames vs opponents and realize positive BB/100 results over large samples
rigid storm
It can't be implemented on sites sice thats highly illegal
kindred flame
Yea but i mean its possible right?
rigid storm
im not saying there arent any bots out there, because there are - but they're way simpler and are often detected and banned from the sites
yes its possible, but illegal
kindred flame
But a ai wouldnt be really detected or?
I mean the decisions of an ai arent like from a normal bot
rigid storm
I don't know how sites like PokerStars measure weird activity, nor do i know how hard or easy it is to hide from their security
But bots would use more simple heuristics yes, so it would be abc poker
kindred flame
@rigid storm btw how much experience do you have in ai?
rigid storm
those usually get around 2bbb/100 in MTTs over large samples, which is slightly winning
excluding variance of course
I have experience in some simple machine learning tasks such as classifying dementia looking at brain volumes of patients
stuff like that
kindred flame
How long are you already in ai?
rigid storm
Ehm i study cognitive science and AI at tilburg uni in the netherlands
3rd year now
I also play poker for a 'living' haha
kindred flame
@rigid storm haha
oblique belfry
In regards to the TVM paper I linked earlier...
Interesting results with Pytorch.
TVM
small ore
I get <matplotlib.axes._subplots.AxesSubplot at 0x16227e80> when I use any seaborn function and the plot never appears. Could someone tell me what I am doing wrong?
I did try plt.show(). No luck
small ore
Ping me please
silent swan
is this in a notebook?
small ore
Ipython terminal
silent swan
try %matplotlib inline
 plain ice
hey guys for data science or data mining more specifically is kaggle very useful as a portfolio?
lapis sequoia
Anyone familiar with performance measures in terms of time within machine learning?
slim fox
hi there. Got a quick-ish question. How to deal with variable shapes of images for classification using CNN in keras/tensorflow?
I understand that there are several ways, like resize (which can lead to image distortion) gloab max/avg pooling, adding simply a uniform background (like 0s) to fill them to match the shape of the biggest image, but I'm really not sure what is best and how to decide
lapis sequoia
Hello, I am looking for a book, article etc. to gaining real-word business insight case by case, can u suggest?
rigid storm
@lapis sequoia Hey, you mean just the measuring of time to train or test? Or you mean ways to cut the time needed?
lapis sequoia
Say you want to detect if a malicious message has been injected into a car's computer system (used for sensors etc.) - so a metric to evaluate the performance in terms of time to detect this.
rigid storm
Well a really simple method is to just use the time module right?
forest = RandomForestClassifier(max_depth = 16, n_estimators= 200, random_state=42)
forest.fit(X_train, y_train)
end = time.time()
pred_forest = forest.predict(X_test)
print("Run time: ", end - start)
print("Accuracy on training set: {:.3f}".format(forest.score(X_train, y_train)))
print("Accuracy on test set: {:.3f}".format(forest.score(X_test, y_test)))```for example, this piece of code shows you the time it took to test a classifier
its import time btw
output
lapis sequoia
So simply measure the time it took to run the test?
lapis sequoia
ye, i think it makes sense
So if I have additional classifiers, runtime of the models can be used as a metric
I'm just wondering if it is a valid metric - considering hardware can have an influence.
rigid storm
Well i think you can use it as a 2nd grade metric. the accuracy, confusion matrix numbers and/or AUC/ROC are the most important metrics for how well a classifier performs ofc
hot compass
I need to find a place where I can find average latency,download, and upload speed of fibre optic, dsl, 3g, 4g, 5g
but like one site that compares values of each
anyone know of any sites that do that?
small ore
@silent swan No. That wont work in terminal. That is only for notebook I think
silent swan
it should work if the terminal supports graphics. If not, then, welp
hot compass
What hardware and software components are required to create a wireless network?
exotic reef
not really a data science question @hot compass ...
 glad arch
anyone familiar with unittest?
 wicked mantle
I made bs4 parser for site, and i want to upload it to google docs, how to do it? I know how to save it to 'csv', but dunno about google docs
 brazen folio
i have an assigment about cleanig data for data science, I have amount of data in csv format, any suggestion ehat should i do for clean and reduce some redundant data?
or any reference about massive data cleaning
?
 chilly salmon
So I have a CSV file with data.
I use pandas to import the data into a dataframe.
df = pd.read_csv('file.csv')
Works perfectly. However, it'll be missing headers.
The thing is, when I add headers in the CSV file or by using "names = ['Date', 'Name', 'Message']" (matching the amount of columns in the CSV file). It throws an error.
It attempts to import the CSV file 3 times. It always ends on the same line (line 14667 out of 14672).
First error = "Traceback (most recent call last): File "mydata.py", line 14, in <module> print(df) OSError: [WinError 87] The parameter is incorrect"
Second error = "Exception ignored in: <_io.TextIOWrapper name='<stdout>' mode='w' encoding='utf-8'> OSError: [WinError 87] The parameter is incorrect"
The third time it doesn't provide any error message, it just stops at line 14667.
Does anyone have any ideas?
Using 2 column headers instead of 3 works fine btw, for some reason.
glad arch
What type of unit test i can do fot fourier transform function on python
upper eagle
Never mind, fixed it
Had to use, for x, i ... for j, k ...
then do, if i['col'] == k['col']
exotic reef
yeah you can't compare series' like that. Also there are probably faster ways to find matching rows
Certainly using iterrows is illadvised for this
(it's slow)
 chilly shuttle
looks like it could be done as a 2d numpy array product
exotic reef
well if you're just looking for the matches you could do drop duplicates in pandas and look at the inverse or something
glad arch
Hi guys, so I have this Signal class: https://paste.pydis.com/iyihugeqod.py
and Im running unit testing using this TestSignal class: https://paste.pydis.com/elilufozap.py
but when I run the test_comp function I get this error:
diff = Signal.compute_distance(self.signal,self.signal)
AttributeError: 'TestSignal' object has no attribute 'signal'
any idea why?
 wind linden
Hey does anybody here know how to successfully import sklearn.linear_model to pyinstaller? Hiddenimport keeps saying "sklearn not found"
 toxic spindle
Hello. I am trying to read a number from screen and convert it into a string that I can use. I take a screenshot with PIL ImageGrab. This is how the screenshot is.
I'm trying to use pytesseract to convert this image into a string, but it seems to be unable to output the correct one.
I've tried making the RGB image into a black/white, as maybe that would get the pytesseract to work better, but no luck. Is there something I can do with pytesseract to tune it to work better with my images, or is there a way I can filter my images so they can be recognized better?
Thanks! :)
It works with some images, but not all.
small ore
Just from the looks of it, the digits in 290 and 1423 are so close to each other that probably there is no pixel separating two digits at least at one point. Whereas 1514 has clear spacing between digits
toxic spindle
I mean, that's what numbers recognizers are supposed to be able to do right?
even while so close apart
small ore
Can't comment on the intent behind them coding in a particular way and also I do not know anything about the subject. I just made an observation
toxic spindle
Oh, well from more observations, it seems to handle them stretched much better than not stretched. Good observation, thanks a lot!
Now that you mention it, can't believe I didn't notice it 😄
small ore
Maybe having to recognize numbers close apart may involve it running the same recognition algorithm for every column of pixels added (in a loop) and when it matches some digit satisfactorily, remove the columns from the buffer and carry on with new columns. I am of course shooting in the dark.
toxic spindle
well, in the example of 1423, it seems to recognize "1" but not 423. That might be related to the fact that 423 are seens as one number and therefor not recognized.
It either recognizes them very well or recognizes nothing., So it must be a result of it seeing one character instead of two/three characters
small ore
4 and 2 seem to touch each other and 3 seems to have a spacing pixel in a different column at the top and different in the bottom
silent swan
semi-related fact is that deep learning methods for image recognition actually have a more or less built in efficiency for recognizing multiple digits at once
 latent oyster
Hey all! I've done some searching online and wanted to supplement with some answers and/or suggestions from here: what are some data science skills (e.g., dats visualization) that individual projects can showcase?
 soft siren
Data cleaning (outlier removal, missing data imputation), exploratory data analysis, model building, model validation.
lapis sequoia
Hello, how can I determine correlation threshold? Is there any technique to determine? Because if I use %95 case. Does it depends?
soft siren
What so mean correlation threshold?
lapis sequoia
So I have a machine learning question with regards to supervised classifiers. If I have this dataset, with a bunch of messages comprised of timestamp, id, actual data values etc., and the features are computed based on message timestamps. How do I know the amount of messages needed to compute meaningful features? Say for instance the features are computed within a message window of 10 or 100 milliseconds.
lapis sequoia
what does the time stamp have to do with the message
glad arch
hi, I'm trying to re-discretise a signal using fft, any idea how?
 jovial bay
@dry sage invert the img. when the text is black onto a white bg it works better. use IMG = 255 - IMG
also clear it of any noise and rotate it
these things better prepare the img
glad arch
is there a built in function for calculating mutual information?
 bitter spire
What would be the simplest way to plot this chart https://fivethirtyeight.com/features/every-nba-teams-chance-of-winning-in-every-minute-across-every-game/

Can you summarize the NBA season in one chart? With 794 games, more than 152,000 possessions and some 372,000 plays, probably not, but we’ve given it a shot. Wh…
im trying to use plotly but it wont let me use my first row as my x axis
silent swan
the plot or the interactive chart
 rotund siren
Using ipython notebook, running notebook on Mac no problem, but when swtich to my windows im getitng this, Unable to allocate array with shape (50, 1216689) and data type float64
silent swan
that's a very big array
 fringe cove
hello can somebody tells me why csvlook gives me a different line column values from the cat command of the csv ? i should get a column filled with float and not dates 😮
no idea why i have this date in column. i opened qith numbers and the file is correct without the date
lyric canopy
It's trying to infer the type from the values and making a mistake
It sees 1.5 and apparently then concludes it's a common date format
The documentation probably has something about disabling inference and/or providing explicit types
I've never used it myself, though
It's just for output, right?
Try the -I flag, that should disable the type inference completely and just display it as-is, @fringe cove
fringe cove
it works thanks for the great insights ! i had no idea this could happen
#learneveryday
and do u know how i could limit the numbers after the floating point like 1.666666 didnt see any option for that in -h
lyric canopy
I have no idea, I have never used that tool
glad arch
Im trying to import obspy
but it doesn't work
from obspy import correlate_template
but it shows red line underneath the whole thing
 olive willow
guys what can I use to predict numerical values with not a load of data?
cuz I'm trying to predict the temp of my home but dont have loads of data or dont even know where to start
with the predicting
fringe cove
if u have a connected heater and u got the time of activation of it 😂
olive willow
Hahahhaha no I've a rpi and get heat data from there using a sensor
 woeful jungle
Hello, I am just looking for a sanity check, if I am doing a multiple linear regression, I am supposed to trim the model until there are only significant predictors left correct?
 hardy lodge
How do you guys handle writing text files quickly?
For work I am using regex to find certain data, storing it in variables and then writing it in a specific format in a text file
we generally do something like
while True:
try:
with open (yada yada):
actual writing
break
Is this a bad way to go about it? Me and the other python guy here are self taught and we have 0 guidance lol
 mental umbra
what do you need the while True loop for?
hardy lodge
I guess it's just so it loops if there is an error
It would only break out if no error
mental umbra
hmm interesting. I can't imagine there could be many errors if you've successfully opened the file in the first place, and if there is there's probably some serious problem you should deal with
you'd also end up restarting your whole write process
hardy lodge
Yeah we probably could cut the while true out
 wheat plaza
good evening guys, if any of you have experience with tesseract [and training it] please let me know :)
i would like to create my own "language" data by training tesseract over cpu-z windows from screenshots (i can provide examples if necessary) and would like to know if that is a feasible and/or good way to go to improve my ocr detection accuracy
 lusty arrow
hardy lodge
lusty arrow
hardy lodge
Lol yeah what you mean? That's not Char, it's clearly the new guy Quattro lol
lapis sequoia
I have to develop a predictive model for an internship interview
Never done ML before - any resources to get me started?
Unfortunately, I only have 1 week to do this
lapis sequoia
can anyone explain what this means
if I need to conclude anything from this.... how?
I know what lift means and what support means; but I don't know how lift vs support works
 rare grove
I have a pandas DataFrame and I want to group all of the Serieses in it based on values in one column. Specifically, I'm working with event logs with IP addresses, and I'd like to get a view where I can loop over the IPs and examine all of their events.
I'm pretty sure this is basic, I just don't know the data science words for it
rare grove
It seems like everyone pushes the groupby method but that squashes the rows - for my use case, I need to reorient the data and pickle it for another process to pick up and analyze.
kindred flame
how musch data do i need to predict hotel bookings?
 versed axle
hello
wheat plaza
Tron what else would you recommend to extract text from screenshots?
Preprocessing the screenshot and then running tesseract over it seems to run pretty fine, but im open to other technology suggestions
idealy i would use something where i can input the used font and the size and then it would detect all the text with that, but since i havent found anything like this using tesseract seems like the easiest way, and i think i have to train it to get rid of the weird stuff it sometimes detects
this would be an example of a typical input image, im trying to extract the cpu-z data (maybe benchmark data later)
wheat plaza
if anybody has ideas / tips feel free to ping or pm me, everything appreciated
 covert torrent
Hello, can someone recommend me some good articles or documentaries about data in general
why is it so valuable in modern society that it surpassed oil in value.
thank you
I'm trying to understand this
exotic reef
@manic axle Very much 'how long is a piece of string' question. What do you want to predict/ What kind of input data do you think you'll have? What level of accuracy/precision/recall is sufficient for your task?
@rare grove groupby should not squash the rows, do you have example code of how you are using it and what you expect the output format to be?
groupby will return an iterable
rare grove
Wait really?! I read the docs and apparently I'm an idiot
exotic reef
Well i might also be an idiot and it does stuff i don't know, we shall see 😛
groups = result.groupby('shipper')
for s,subset in groups:
     # do stuff
This is an extract from code i am currently working on
the 's' will be the shippers, the 'subset' will be the dataframe corresponding to that group key
exotic reef
it's wicked fast too, and i just learned why. it pre-sorts and then does binary search stuff
sorta...
rare grove
Several tutorials used groupby and mean() or other measurements and so I thought it just had combined/aggregate values, but an iterable of Series is exactly what I need
exotic reef
ah yes mean will indeed squash the rows because, well, it's an average
rare grove
binary search trees are fun
rare grove
ah, yeah so I want to say Hey, what did 127.0.0.1 do on my network today? and give that IP a rating based on a set of all the logs it generated
exotic reef
so you need NLP too? 😛
rare grove
NLP?
exotic reef
natural language processing
i mean, for this you can use basic rule based stuff to get the IP from that text
rare grove
Oh, haha no I can say it in a computery way, hopefully via a web interface with a table of interesting targets to look at
but is that the best way? always select all the rows by the column value? there's no idea like temporary tables for pandas?
exotic reef
ah so it depends on the frequency of each operation which will be optimal
for example are you periodically looping over a long list of ips, or only ever querying one at a time
it would be interesting to bench mark this actually...
the most straightforward lookup way is
subset = df[df['ip_col'] == ip_val]
but if you want to loop and collect over a large number of ips then groupby will be faster
rare grove
I guess I could look at set metadata with groupby, then if the set show signs of interest (it's large, or has large values, or etc) pull it out and pickle it (500-1k at a time) for a second process to pick up
exotic reef
oh right yeah if you are methodically processing them all then groupby is the wya to go
however you will need temporary arrays and things rather than mutating the groupby object
i think
rare grove
damn, I think I really need a Kubernetes cluster for this project
exotic reef
really? how much data do you have?
rare grove
this is all sounding like I'm going to need 12 cores running parallel tasks to keep up with the sessions per minute I hope to ingest
exotic reef
how many rows?
You can also use Dask if you really need distributed computing, kubernetes would be overkill for this i think
rare grove
Infinite rows, since this would run over time - but right now I store a few hundred million log rows
exotic reef
Well okay it's never infinite rows, or if it is, you might be solving the wrong problem 😛
rare grove
One thing I do have access to is an elasticsearch cluster with all this data in it but I have no idea how to leverage that
rare grove
I shall do so presently
I'm perpetually amazed at how many words I don't understand in these docs 😄
this library looks amazing, I think this is what I'll spend tomorrow morning diving into - thank you!
exotic reef
👍
loud kindle
im trying to get pandas to plot the index as my x axis, but i don't know how to pass it, since df.index returns a rangeIndex type which "is not hashable". how can i get the index so it is hashable?
rare grove
df.index.tolist() maybe?
rare grove
Oof
silent swan
what command are you using to plot
deft harbor
@exotic reef is this marketing blurb from dask's website right?
But you don't need a massive cluster to get started. Dask ships with schedulers designed for use on personal machines. Many people use Dask today to scale computations on their laptop, using multiple cores for computation and their disk for excess storage.
Is it really worth putting it on my desktop?
exotic reef
Depends what you mean by 'worth'
lapis sequoia
what's the best way to scrape data from this website and put it in a csv file?
https://basketball.realgm.com/international/transactions/2020
rare grove
I got things mostly ported over to dask today but didn't get quite far enough to be able to tell if there was any performance gain
exotic reef
To state the obvious, make sur eyou are using dask df functions wherever possible
rare grove
Yes and no - it wants me to use pandas objects in some cases, like appending series to dataframe (the docstring for dask.dataframe.Series literally says not to use it lol)
also I will never stop being annoyed at this convention of abbreviating already-short-enough names to two letters 😛
exotic reef
Ah interesting
exotic reef
Just learned about this too, which is neat
https://github.com/jmcarpenter2/swifter

GitHub
A package which efficiently applies any function to a pandas dataframe or series in the fastest available manner - jmcarpenter2/swifter
 naive jay
idk if this is the right channel but anyone have any experience with hash functions such as md5 and sha and generated hashes?
 devout ridge
lapis sequoia
devout ridge
lapis sequoia
Could someone tell me how I could go about providing high level summary stats on a dataset?
Things that I should aim to look at?
soft siren
Depends on the dataset @lapis sequoia . Things like mean, median, and variance of your variables (columns). Number of missing data points, outliers. If you have obvious groups, looking at summary statistics and counts within groups is usually good too
 hexed rampart
I am getting the error: "TypeError: parse() takes 1 positional argument but 4 were given" for the following code:
from datetime import datetime
import pandas as pd
from pandas import read_csv,read_table

def parse(x):
    return datetime.strptime(x, '%Y %m %d %H')


datasetInput = read_csv(r"C:\MLProject\08_LMR_data\basin_mean_forcing\daymet\08\07375000_lump_cida_forcing_leap.txt", sep=" ", parse_dates=[['Year','Mnth','Day','Hr']], index_col=0, date_parser=parse)
i researched it and could not find any fix. I tried doing the date_parser as a lambda function but that did not work either. Any suggestions?
soft siren
@hexed rampart Instead of “””[[“Year”, “Mnth”, “Day”, “Hour”]]”””
Try
“””[“Year”, “Mnth”, “Day”, “Hour”]”””
 lapis frost
can anyoine help with this error?
File "<ipython-input-68-e6aa6e95856f>", line 10
population_record = census.assign(trend = census.2010 + ' ' + census.2011)
^
SyntaxError: invalid syntax
i am trying to make a new column with the values of other columns inside.
lapis sequoia
are you using assign for a pandas df?
lapis frost
yes. it is telling me i have invalid syntax on my column name which is 2010
soft siren
@lapis frost you can use a lambda function:
population_record = census.assign(trend = lambda x : x[“2010”] + “ “ + x[“2011”])
lapis frost
i am trying to create a new column with the values of 2010 and 2011 insid
what is lamda. i have never seen that before.
soft siren
Using the bracket notation may work too.
census[“2010”] vs census.2010
lapis sequoia
when you're using assign, you can't perform an operation in what you're assigning it with
you need to compute that before you assign it to 'trend'
soft siren
The lambda function is an anonymous function that would allow you to do this.
lapis frost
this is the lesson i am following:
five_years = five_years.assign(fullname = five_years.namefirst + ' ' + five_years.namelast)
five_years.head()
which is what he's showing you here
lapis frost
and it works in the lesson.
 sullen wing
in python specifically, lambda is a way to create anonymous functions
lambda and functions are mostly the same in python, with lambda restricted to single statement
lapis frost
namefirst namelast yearid salary fullname
21454 Henry Blanco 2011 1000000 Henry Blanco
21455 Willie Bloomquist 2011 900000 Willie Bloomquist
21456 Geoff Blum 2011 1350000 Geoff Blum
21457 Russell Branyan 2011 1000000 Russell Branyan
21458 Sam Demel 2011 417000 Sam Demel
soft siren
In this case I think your issue is that accessing columns with the “.” Can be a bit unreliable for some column names, things likes numerics and column names with spaces
That’s why bracket notation may be better here
lapis frost
ok
sullen wing
Unlike js, dot notation access an attribute by default, dot notation and bracket notation trigger 2 different dunders
So take note about that as well
lapis frost
FuncTypeError Traceback (most recent call last)
/usr/local/lib/python3.6/dist-packages/pandas/core/ops/init.py in na_op(x, y)
967 try:
--> 968 result = expressions.evaluate(op, str_rep, x, y, **eval_kwargs)
969 except TypeError:
6 frames
UFuncTypeError: ufunc 'add' did not contain a loop with signature matching types (dtype('<U21'), dtype('<U21')) -> dtype('<U21')
During handling of the above exception, another exception occurred:
UFuncTypeError Traceback (most recent call last)
/usr/local/lib/python3.6/dist-packages/pandas/core/ops/init.py in masked_arith_op(x, y, op)
462 if mask.any():
463 with np.errstate(all="ignore"):
--> 464 result[mask] = op(xrav[mask], y)
465
466 result, changed = maybe_upcast_putmask(result, ~mask, np.nan)
UFuncTypeError: ufunc 'add' did not contain a loop with signature matching types (dtype('<U21'), dtype('<U21')) -> dtype('<U21')
i am in a prep course so i do not know what any of this means
soft siren
That error is telling you’re trying to add different types. What is in census[“2010”] I assume it’s a float
lapis sequoia
can you do dtypes on your columns
lapis frost
2010 and 2011 are Columns in the DataFrame
ndex(['state', '2010', '2011', '2012', '2013', '2014', '2015', '2016',
'region', 'division'],
dtype='object')
soft siren
You can find out what type of columns they are by doing census.dtypes
lapis frost
int64
soft siren
Yea so when you try to add the int with “ “ you’ll get an error. The question is what you’re trying to calculate.
lapis sequoia
try .astype(str)
lapis frost
ok, so i need to create a new column with the populations listed in 2010-2016 in that new column
again, I am in a prep course. i do not know what "try .astype" means because i haven't seen that yet.
i assume you mean write it as census.astype(string)?
lapis sequoia
census['2010'].astype(str)
soft siren

lapis frost
k, i'll go try that real quick
soft siren
Same with 2011
lapis sequoia
you want to add a space between your 2010 and the other one.. by using ' ' ... ' ' is a string
so you need to type convert your dataframe columns to string first..
lapis frost
ok, that worked!
thank you! the might look at it a little funny since I haven't been taught that yet, but it lets me move on so...
lapis sequoia
as long as you understood what you're doing..
soft siren
lapis frost
hahahahahahaha, yah. i don't. i just follow the example in the book. when it doesn't work, i have no idea why.
it's learning a new language. when i say words in spanish wrong i don't know why they are wrong. they just are. we'll see how i grow over the next couple of months.
 lost sinew
i did
df = df[df['tweet'].str.contains('helo')]
and the index of the df is messed up (shows only the one that is selected)
is there a way to reset the index to normal (1,2,3,4,5)
i can save it to another csv by index=False, got it
unless there is a way to do it with a csv
but its fine 🙂
lapis sequoia
wut
the index isn't messed up, you've filtered the df based on your selection, so it's only showing those indices
you should name your result df something else, so your code looks cleaner
if you want to drop the index from the result, do
result_df = result_df.reset_index(drop=True)
else try it without the drop = True
 pale thunder
how would one Run-length encode each row of 2D numpy array?
 river plume
Hello guys, I wanted to know the difference between LDA and PCA on a tokenized dataset in NLP
I know that PCA is unsupervised and LDA is supervised
How to decide when to use LDA and when to use PCA ? I'm talking specifically about NLP when we have 5000+ columns of words after tokenizing data
polar acorn
@river plume
Keeping in mind that I just looked up LDA and don't do much NLP here are my thoughts: LDA would encode more of the context, while PCA would encode more of the variation. LDA needs you to set a number of topics before running and would need to be rerun if you want to change that number. That number of topics would be the length of your encoding vector per document. PCA is run once and you can after that decide how many components you want to include, the length of your encoding vector is equal to the number of components you want to include. I think LDA would more useful unless you have absolutely no idea about your corpus and the amount or range of topics it contains.
But do take that with a pinch of salt 🙂 I just now read about LDA on wikipedia.
 acoustic mural
let's say i have access to decades worth of news articles, separated by language and country. 250 million articles is a safe low estimate because I know I have 30 million in English alone. also let's say i were to derive and maintain a set of statistically significant bi-, tri-, and four-grams for each country/language combo, calculated from the beginning of time (as far as i'm concerned) until say... a week ago.
what's a decent rule of thumb for how many times an n-gram should appear in the last week that hasn't crossed that threshold ever before prior to this week, in order to consider it relevant to the current news cycle?
i was thinking 10 would be a good place to start and i could experiment for each language/country, as it's implemented, based on the results (because the number of articles available per combo varies in magnitude significantly) but it can't hurt to ask if anyone's been here before.
@river plume what are you looking to do with the data? and, by 5000+ columns do you mean you've one-hot encoded your words, or you have that many features?
lapis sequoia
Could someone help me figure out how I could split my dataset into train and test?
lapis sequoia
@devout ridge Also, what does it mean to describe model results?
I'm working on an assignment for an interview - and I'm not entirely familiar with ML
river plume
@acoustic mural I have cleaned the texts, applied Porter Stemmer and then vectorized the words. That's how i got that many columns. Something like one hot encoding
acoustic mural
any reason for porter over snowball?
river plume
I have no idea about snowball
acoustic mural
when you say vectorized the words, what do you mean exactly? because when i say that, i mean turning them into dense vectors, not sparse ones
also snowball is essentially porter version 2
acoustic mural
very few, if any, reasons to use porter over snowball nowadays
river plume
@polar acorn thanks, I'll compare the performance of both and see which one is better
acoustic mural
what are you trying to do once you have your vocabulary?
or, one-hot encoded text sorry
river plume
Something similar to sentiment analysis
acoustic mural
via what method? or are you not there yet
river plume
It's a supervised dataset
There are text reviews and there's a target variable containing the binary value wheter it is a positive review or a negative review, so i am making a model that predicts of it is a positive review or a negative one
acoustic mural
🙂 the imdb set?
once your text is encoded, the method you're going to use matters for what you do with the vectors next
if you want to feed it into a neural network with an embedding layer, perhaps, you're going to want to replace each one-hot vector with the index of its active value
then feed that dense vector into an embedding layer with a width equal to the width of your one-hot
lapis sequoia
@acoustic mural Perhaps you might know the answer to my question
What exactly does it mean to "describe your model's results"
acoustic mural
well, your model was built for a purpose, right? how well does it do what it's supposed to?
if it was created to mimic a function, how often does it get it right? when it does get it right, how close is its answer to the truth?
if it was created to explore possible solutions to a problem, what insights can you gain from it?
stuff like that
lapis sequoia
I see - my model was actually supposed to predict tree cover types based on a dataset
So, is there a particular metric I could use to see if it did well?
I'm doing this for an internship interview - have never done ML before so I'm really new to this
acoustic mural
well for starters, what percent of the time does it get it right on data it wasn't trained on (your test set)?
lapis sequoia
Crap, lol I only have a test set and a training set
I don't have data outside of that
acoustic mural
well the test set is what i'm referring to
you shouldn't train your model on your test set
you use your test set to evaluate its performance against labeled, unseen data
lapis sequoia
Oh
I see
I trained my model on the test set - I was essentially given a big dataset and asked to make a predictive model... But I assume you're saying I should be testing the model on data from outside this dataset?
Sorry if these questions are elementary
acoustic mural
you have a dataset, right? take somewhere between 10-30% of your data and put it somewhere else for now
take the remaining 70-90% and train your model
then once you have the model, bust out the data you hid earlier and use your model to predict the answer to each, and compare its results against the answer you already have
acoustic mural
👍 good luck with your interview
 real wigeon
lost sinew
real wigeon
lost sinew
how do i round a column of datetime in a dataframe to the nearest minute
polar acorn
@lost sinew , df.column.dt.round('min')
lost sinew
@polar acorn thanks man
 jolly briar
i'm wondering about the usual approach to google colab with the google cloud platform.
I've just been looking at it and it seems that it requires authentication using an account rather than a service key.
does anyone know of any decent guides to it?
lapis sequoia
aye
you come to the right place
you can link your google colab to your own machine, but the connection will be through internet.. so, not worth it.. Colab doesn't give you enough resources to run for extended periods of time
which is where Datalab comes in.. it's part of GCP
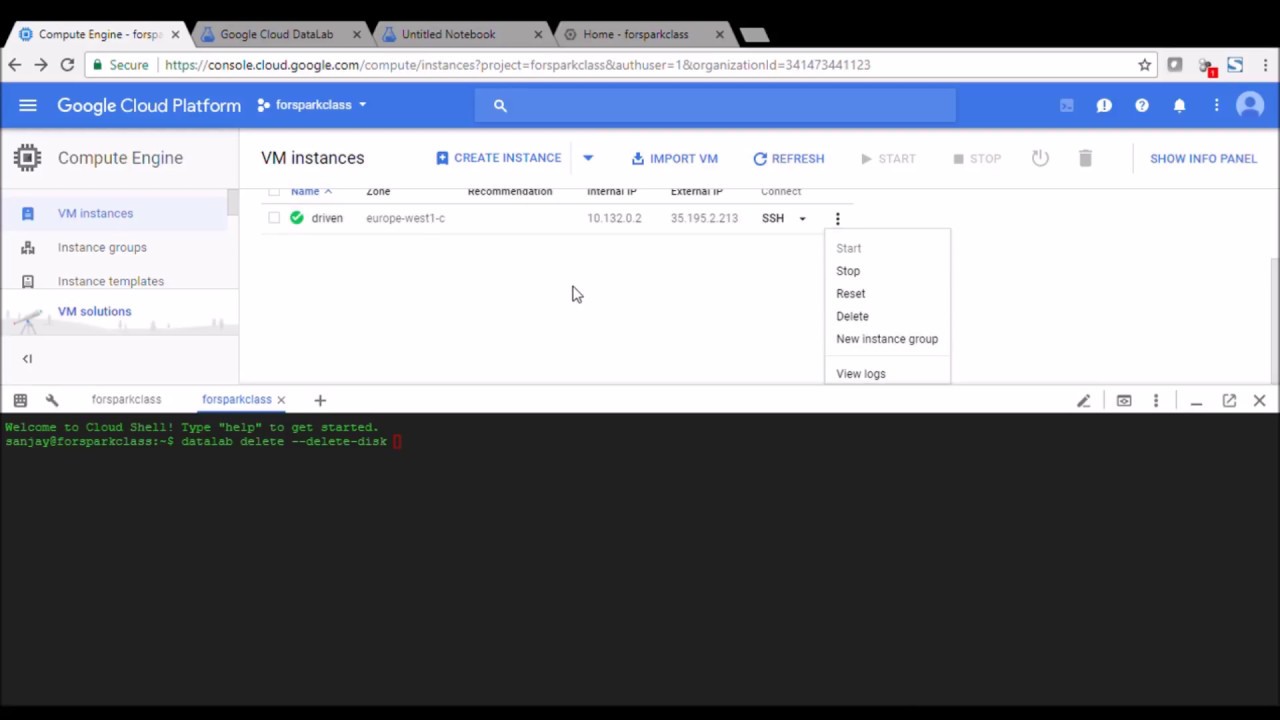
Using Cloud Datalab, creating and deleting the VM instance, using Cloud Storage Bucket
@jolly briar
jolly briar
@lapis sequoia thanks - i'm trying to get a handle on what a typical workflow is here with a team -- as i have a bunch of data coming into storage buckets that's then sent to bigquery with schema etc... but then colab just seemed to work with drive 🤔
i'll have a look at datalab now though
 timid vortex
Anyone here have experience with running your Python on AWS or other clouds?
Just generally curious about the experience
glad arch
hi, does anyone here know how to use fft?
 fallen path
Maybe you can look into this...
https://www.google.com/amp/s/www.geeksforgeeks.org/python-fast-fourier-transformation/amp/

GeeksforGeeks
It is an algorithm which plays a very important role in the computation of the Discrete Fourier Transform of a sequence. It converts a space… Read More »
 upper ginkgo
Hey guys, I'm trying to learn all about machine learning and more specifically neural networks to make a bot be able to 'talk'(or at least pretend it does), but I don't know anything about this, I'm not even a beginner, although I have a lot of experience with Python and I know most things very well. Any sources you would recommend for me to learn?
I have messed around with neural networks a little, but sadly I only have modified code that does not belong to me and I haven't learned much
soft siren
@upper ginkgo I think Andrew Ng’s coursera course on machine learning is probably one of the most common resources for learning about the math behind neural nets (as opposed to just using them)
upper ginkgo
So it focuses on math?
soft siren
It goes into more of the insides and guts of the neural nets than just saying “this package does them, this is how you fit and this is how you predict”
upper ginkgo
That’d be nice, I haven’t learned the required math knowledge since I’m young and those subjects are taught in higher grades than my current one
I’ll be definitely looking into that course, I hate those guides that explain shit
soft siren
This covers some of it
It’s a bit sparse in details but the course covers them a bit more in depth

Coursera
Learn Machine Learning from Stanford University. Machine learning is the science of getting computers to act without being explicitly programmed. In the past decade, machine learning has given us self-driving cars, practical speech recognition, ...
This is the course
Week 4 particularly
upper ginkgo
Thanks a ton
soft siren
👍
soft siren
A confusion matrix tells you about the predictive performance of your classification model. It summarizes the true positives, true negatives, false positives, and false negatives. The diagonal entries tell you how often you’re predicting right, the off diagonals tell you when you’re predicting wrong
Important summary statistics can be derived from the matrix. Namely recall and precision
 mighty tartan
I know this is a bit of a broad question but does anyone have a good statistics course for python 
Or a good statistics course in general
jolly briar
When I run a Google colab notebook, stored on Google Drive, where is the VM located?
I have all the data located in EU ( which is necessary ), but I'm not sure where the computation is done in the case of using colab notebooks
@mighty tartan what kind of stats?
mighty tartan
For finance
I know its a broad question, mostly done the basics like linear regression. Anything that could be helpfull I would aprieciate ❤
jolly briar
@mighty tartan not too sure about finance - quantopian have good resources, and there's also a python for finance book which has some stats and stuff in it iirc (monte carlo syms and stuff)
mighty tartan
yea looked into those :p (also looked into the book)
anyways thx for wanting to help me out ❤
river plume
guys can anyone explain when to use feature scaling and normalization?
is it necessary to use it in all the models?
also, when to use StandardScaler and when to use MinMaxScaler?
deft harbor
@mighty tartan google stat110
@river plume It depends on your data and what you are doing
If you want to use PCA, you need to use standardscaler to bring the mean to 0 and sd to 1
MinMaxScaler is generally used to bring all values between 0 and 1
This is useful for certain classification problems
models
mighty tartan
arigato ^^
 quaint halo
@river plume You do not need to scale / normalise your data for all models only those which use distances in the feature space to extra insight and perform classification. The likes of K-NearestNeighbour and K-Means are sensitive to scale where as tree based algorithms are not. You will need to understand the internals of your models to understand when scaling / normalisation is or is not required.
glad arch
hi guys, I have a signal with samples equal to 120 and another signal was samples equal to 240. Im trying to rediscretise one of the signals in space of another.
I tried this method which works (i.e. PyCharm doesn't complain) but I feel like i'm loosing information by doing that.
signal_ = (self.sampling_rate*self.sample_time)
            signal_ = int(signal_)
            scaling = int(signal_/samples)
            new_signal = self.signal[::scaling]
            return new_signal
another approach could be taking the signal to fourier domain and change samples but I don't see how I can do that
any idea?
deft harbor
Tau wrote it better
 worthy meadow
Hello, I was advised to try this forum to guide me in the right direction. I'm a beginner in python. Just started learning a month ago today, I think. And I'm struggling with career fields to go into. I believe I'd like to work with BCI research or human perception research with virtual reality in the future, and was told by someone in the careers tab that this space may be able to tell me if data science was the correct route to go.