#data-science-and-ml
1 messages · Page 194 of 1
 void anvil
51% train 53% test
51, 53% -1
49, 4 7% 1
Extremely minor class imbalance
so resampling is probably not appropriate
The answer is probably write a different loss function
With categorizing 1 correctly worth more
which is what I'm looking into now
since several of the learners don't incorporate it
but I really don't want to rewrite a bunch of loss functions
 supple ferry
You can increase class 1 either by repetion of samples, or using SMOTE tehcnique

Data Science, Analytics and Big Data discussions
Hi, I am working on imbalanced dataset in Python.I am referring to SMOTE example from this link http://contrib.scikit-learn.org/imbalanced-learn/generated/imblearn.over_sampling.SMOTE.html Can you please explain me the example ?Does X and y corresponds to features and labe...
create synthetic class
which doesnt involve the changing algorithms
void anvil
Isn't that for imbalanced data?
supple ferry
yes
but you can use it
to make your data imbalanced
in favor of class 1
and see how it performs
supple ferry
lstm is slow
void anvil
LSTM generator and CNN discriminator
I'll run at 90,80,70% undersampling and 120, 140, 160% oversampling
The only thing I'm concerned about is fitting over residual error
void anvil
undersampling performing pretty bad
             precision    recall  f1-score   support

       -1.0       1.00      0.37      0.54      2000
        1.0       0.00      0.00      0.00         0

avg / total       1.00      0.37      0.54      2000
ah crap forgot to sort when I sampled, need to redo that
void anvil
All oversampling performs terribly vs not oversampling for both classifier accuracy + secondary performance
Undersampling 0.9 performs about as poorly, 0.8 performs very well
checking 0.7 undersampling
0.7 WORKS much better in classifying but terrible in actual use
void anvil
Undersampling and oversampling not really working
improves accuracy on the first holdout to figure out what the appropriate value is
then falls of when double checking with a second holdout
 gilded dagger
@supple ferry thanks for the advice 😄 I'd really like to use more Spyder, but it just looks too bad on a big screen, and its dark mode looks terrible atm. In the end I got used to PyCharm's cell mode, it does pretty well.
The pandas integration in PyCharm sure sucks though...
 lapis sequoia
can someone help me understand what they did in problem 5 here?

GitHub
Contribute to therealchuckliu/AM207 development by creating an account on GitHub.
I just need to understand the concept
gilded dagger
Question about pandas: I know how to apply a function to a column (.apply()), but how do I apply a function to an index?
For example what if my index is IDs and I want to change them with the actual names for more readibility?
Ok I cast the index as a series so it gained .apply
I guess that works lol
supple ferry
You can reset the index, apply the function and set it back again @gilded dagger
lapis sequoia
hi
gilded dagger
Sounds about the same as what I did :p
I did Series(df.index).apply(function)
lapis sequoia
i'm a professional data scientist
who needs answers?
pd.Series.to_frame('name_here")
w/e
gilded dagger
Well I could use some help on how to use Tensor Flow properly for a classification problem \o/
lapis sequoia
easy
hyperparameter optimization is so 2018
now it's all about architecture optimization
via evolutionary algorithms + DL
 lyric canopy
That's not really helpful
lyric canopy
No, just slinging some buzz words around is not super helpful. Please stop trolling.
lapis sequoia
god damn i'm not a troll
why does everyone think that?
ok. so you want to use TensorFlow. What is the classification problem? image data?
cause xgboost is a great algorithm for non image data
gilded dagger
Non image data. Precisely, indexes (150 values total), with only a Boolean as output.
The problem I'm trying to represent is to predict which teams win in a game depending on the characters played on both side.
So my result is a boolean representing if the first team won or not, then I have two arrays of IDs for the characters played by the teams.
How would you represent that properly? 10 ordered one-hot vectors?
One zeros vector with 1 for a team's character and -1 for the opposing team?
(that's what I think I'm gonna do, but that might be stupid. Not sure)
And then, using Tensorflow, which kind of layers would you use for this problem?
gilded dagger
0   False    [37, 61, 121, 54, 498]    [412, 429, 13, 36, 68]
1    True  [202, 201, 113, 42, 240]    [498, 90, 59, 40, 157]
2    True      [60, 6, 21, 38, 267]    [131, 12, 18, 141, 57]
3    True  [131, 91, 202, 113, 432]     [92, 498, 421, 4, 44]
4   False       [18, 44, 60, 8, 41]     [79, 92, 267, 67, 56]
5   False    [134, 60, 126, 51, 89]   [427, 18, 13, 412, 112]
6   False     [64, 16, 54, 115, 51]  [36, 126, 498, 201, 112]
7   False    [36, 498, 35, 117, 45]     [4, 113, 16, 29, 240]
stuff like that
gilded dagger
Well I'm gonna add many more input variables later, at the moment it's more for PoC and getting used to the environment
5000
gilded dagger
Well seeing there's only 150 indexes possible, and 10 appear each game, I am pretty optimistic
I means humans already have a good understanding and euristics about the problem at hand with this volume of data so a machine should do decently, or at least I hope
lapis sequoia
each character has to be a column
srsly give me the data i'mma build a quick model
i'm starting new job next Friday. lol so i've been craving the d
lapis sequoia
can someone tell me what's uniform prior and what's beta prior
lyric canopy
Ah, Bayesian statistics
So, uniform just means that you prior probability distribution has a uniform distribution (so, the probability is equal for all possible outcomes)
Likewise, the beta distribution is another common distribution.
(Or, a family of distributions, actually)
lapis sequoia
right.. I'm not getting a whole lot of it..
GitHub
Contribute to therealchuckliu/AM207 development by creating an account on GitHub.
could you help me understand how they're using it to solve the unbalanced voting problem here? it's the last one (Problem 5)
Is the 5th percentile a good indicator for the ranking I don't understand.. how do they attribute it to ranking here
supple ferry
@lapis sequoia , If your 25% percentile is 50, it means that, 25% of your data is below 50
is that what you were asking ?#
lyric canopy
@lapis sequoia Do you understand the methodology they're using? The Markov chain Monte Carlo?
lapis sequoia
No.. I need to learn
I don't understand how they used the existing array of in unbalanced votes.. and also something they generated from random numbers I think? And somehow related that to ranking videos
By rank I'm guessing it's whether a video is popular or not..
@supple ferry no.. I know what percentiles are but here they are taking the 5th percentile of something
lapis sequoia
anyone?
I understand Bayesian methods help when frequentist methods can't be used.. like in this case where number of respondents are skewed against each video..
 polar acorn
@lapis sequoia
Okay so it seems to me like for every video you fit a posterior distribution of the like/dislike ratio. The 5% percentile will for each video be a number fro 0 to 1 that can be used to rank the videos right?
lapis sequoia
in the code output.. it says this
print sorted(percentiles_uni, key=lambda x: x[1])
and
(array([2, 2]), 0.18441838077560296)....
so the 5th percentile here is 0.18
is that right
polar acorn
Yes
lapis sequoia
I'm not sure what they mean here by ranking.. I'm wondering if it's only related to whether a video is good or not
oh no..its sorted
I guess you're right... it is a rank by the percentile
polar acorn
That percentile gives you an indication if the video is good or bad of course
lapis sequoia
but what does this mean.. higher rank means higher percentile value?
polar acorn
Yes. According to your model there is 5 probability that the true like/dislike ratio is equal to or smaller than the 5% percentile value.
So a high 5% percentile means you can be relatively sure that the like/dislike ratio is high and the video is good.
lapis sequoia
where's a probability of 5 mentioned?
polar acorn
Woops my fault 5 percentile not 5% percentile.
lapis sequoia
this isn't my model.. I'm just trying to understand it so I can apply it to something related
polar acorn
But it means the same of course. Thats where the 5% comes from
Okay, but do you understand that for each video we make a distribution for the like dislike ratio?
lapis sequoia
yes.. I see that part
wait
what do you mean distribution
I see the votes in the first numpy array
video_votes = np.array([[3,0],[300,100],[2,2],[200,100]])
polar acorn
Yes thats the likes and dislikes for each video.
lapis sequoia
then we pass each like dislike to those two functions..
polar acorn
Yes, which gives us many samples. These samples represent a distribution
lapis sequoia
ok.. but i'm not sure why we do this..
polar acorn
Okay are you familiar with bayesian statistics? Like the fundamental thought behind it?
lapis sequoia
like.. 100000 as number of samples.. and calculate mean and standard deviation for this somehow.. using the upvote and downvote
polar acorn
The issue is that we want a distribution for the like ratio of each video. We can just calculate the ratio, right? But a video with 3 likes and 1 dislike would have the same ratio as one with 300 likes and 100 dislikes. But the first videos ratio is really uncertain right? The second is much more certain since we have more data.
We make a distribution for each of these videos so that we can say something about that uncertainty. Thats the main thought here. Makes sense?
polar acorn
The distribution gives a measure of the uncertainty. So that if you only want to watch videso you are 90% sure has a like ratio of at least 0.8 for instance you can do that.
lapis sequoia
ok..and how do we use the actual upvote downvote
polar acorn
Those influence the distribution. In the bayesian framework we use two things, a prior distribution and data. Those two gives us a posterior distribution (when i have written distribution over here it has always been the posterior distribution i've been talking about)
The prior in this case is either uniform or beta. And the prior represents how you think the like ratio distribution of any random video looks like.
lapis sequoia
ok.. I understand a prior is something I'm predicting for a random video..
so isn't my prediction random?
polar acorn
Okay, I'll try to define things from the start maybe that's cleaner.
You want a distribution of the like ratio of a video.
The prior distribution is what you think this distribution will look like.
You have data about likes and dislikes.
By combining your assumptions, the prior dist, and the data you get a posterior distribution.
The posterior distribution is different for all the videos. (the prior is the same for all videos)
It's the posterior that you use when you want to talk about the probability of the true like ratio being bigger than something, smaller than something or some specific ratio.
lapis sequoia
ok..
so why is the prior fixed.. and the posterior is different for each
is the prior fixed based on the entire list of upvotes and downvotes?
polar acorn
The prior is independent of the like and dislike list. It's what you think a general distribution for a general youtube video looks like.
Its fixed for all videos because it's a general assumption for all videos. It's generally made before you gather any data such as likes and dislikes
lapis sequoia
ok
what's return mcmc here
I see it's received by test = prior_uniform(v[0], v[1])
and test = prior_beta(v[0], v[1])
I looked up the module..and it says markov chain monte carlo.. but in value terms, what is it
polar acorn
I'm not quite sure exactly whats in the mcmc object. But from the use we can at least see that it contains samples for the posterior distribution.
The posterior distribution can often be some distribution which we can't write in closed form but we can get many samples from it and describe with a histogram, calculate mean, std etc. Which still gives us a good picture of the posterior distribution.
lapis sequoia
Ok got it..
So this can only be used for ranking?
I have some queries that have upvotes and downvotes, I want to judge the queries based on these votes.. but not necessarily rank them against each other
What do you suggest..
polar acorn
Depends, judge in what way?
lapis sequoia
So I have Queries that I need judged.. whether they're good queries or not..
Good as in natural and not like a robot..
And against each query I have a total of 20 votes (True+ False + sometimes Null votes)
So I'm just trying to find a way to do this.. because in cases where there's a lot of null votes, the upvote(True) downvotes(False vote) number is skewed.. like 3-1, etc..
And sometimes it's 16 to 4 .. sometimes 8 to 2
My goal is to draw meaningful numbers to show these votes can be a viable way of judging the queries
polar acorn
I see, you can use this method to get a confidence interval of ratio of good to total non null votes.
Or you can say that if the ratio of good to valid votes is 90% likely to be above some threshold say 0.85 the query is good if not it's bad.
lapis sequoia
how do I get that confidence interval..
and the second thing you mentioned
0.85? how would I arrive at that threshold
polar acorn
The thresholds you have to set yourself. You could find these stats from the samples. But if you have a maximum of 20 votes that can have one of 3 values this approach seems like an overkill.
lapis sequoia
each query has a maximum of 20 votes
and I have queries under different categories.. each category can have number of queries from 50 to 400
there are around 13 categories
 mossy dragon
are 9,000 rows enough to do multiple linear regression?
lyric canopy
How many independent variables?
Although, I guess, the answer is probably going to be yes
lyric canopy
That should be more than enough
mossy dragon
Video game name, release date, sales data, esrb rating, critic score, user score, publisher and platform
I think if i include games where I can't get critic score I can probably get a couple more thousand but idk if its a good idea
gilded dagger
Searching for a Monte Carlo Tree Search implementation in Python but I'm either finding untested libraries or abandoned ones. Anybody got any recommendations?
void anvil
@supple ferry off the top of your head do you know which ML classes support weights in sklearn?
besides decision tree
supple ferry
unfortunately, no
void anvil
Looking into weights, reframing, and rewriting loss function
under/over sampling isn't really effective
 small pumice
I’m making a genetic algorithm neural network with Keras. I’m not going to breed the networks in the population, just mutate them (I’ve heard that this method can also work well). I have researched how to mutate weights in a neural network, but there are no detailed methods. For each weight, is there a chance that it is mutated (say, 50%), and then if it is mutated, there is another value that determines how much that weight is mutated? Also, would I mutate the weight by a percentage of the original weight, or would I mutate it by a random value that has nothing to do with the current value of the weight?
 wooden plover
Anyone savy with a basic binary classification NN. I have a question on trying to debug something
gilded dagger
Still searching for a good montecarlo tree search implementation somewhere. Do people just do those by hand?
It looks like a very useful tool for using Neural Networks for decision making
gilded dagger

GitHub
A simple package to allow users to run Monte Carlo Tree Search on any perfect information domain - pbsinclair42/MCTS
<- I might be misunderstanding, but isn't his getBestChild function pretty damn random? He appends any child that's better than what he had so far, then picks one randomly, so... The first node he explores can always be chosen randomly, irrelevant of the result???
mossy dragon
Call:
lm(formula = total_sales ~ user_score + critic_score + number_platforms,
data = full_data_no_plats)
Coefficients:
(Intercept) user_score critic_score number_platforms
-2881974 -385528 74158 846070
im so confused
supple ferry
@mossy dragon what is your confusion about? Your Beta values are very high. It is not good for the linear model to have very high betas. You can use regularized linear models which will punish high beta values. Try ridge and lasso first
How many data points you have?
mossy dragon
5,849
mossy dragon
y is discrete
its total video game sales, some games sold only 10,000 copies, gta 5 on the other hand sold 69 million copies
not sure how to handle that
mossy dragon
but the only reason i said I was confused is because I didnt expect the user score coeffecient to be negative
supple ferry
Y is not discrete in this case
You should not treat it as discrete. It is continuous
lyric canopy
The absolute size of your coefficients shouldn't matter that much, as it depends entirely on the relative scales of the variables. (Just think of predicting weight from length, using km for length, but micrograms for weight.)
So, by itself, it's not necessarily a sign of a overfitting in a simple multiple linear model
That doesn't say you don't want to consider them for a predictive model (if you're not that interested in inference)
Honestly, I think a bigger issue for you is the distribution of the variables you have
From what you've told, it seems that you have outliers and quite possibly a highly skewed distribution
Is your relationship even linear in the current form?
The beauty of linear regression is that it's fairly restrictive (not many parameters; lasso is obviously even more restrictive) and highly interpretable, but that doesn't mean that much if the true function isn't captured adequately by a linear model.
supple ferry
Yes I tend to agree with that
mossy dragon
im not sure what to do about the outliers
honestly this is the first time ive actually done any linear regression
supple ferry
You have lots of outliers. You should get rid of them :)
lyric canopy
Okay, so, you distribution looks skewed and heteroskedastic. It looks like a problematic dataset for simple linear regression and a transformation is probably not going to solve your problem.
Have you used any of the diagnostic tools to analyse the linearity, non-normality of the errors, and non-constant error variance?
mossy dragon
no
I will take a look at how to do that though
like i said i dont have much experience and when i learned in the classroom we had clean datasets so idk how to deal with messy ones much
lyric canopy
Yes, that's quite the task on its own. We have a full course on regression analysis and generalized linear models in our master's curriculum.
mossy dragon
yep
trying to put together a portfolio
to get an entry level job as a data analyst
problem is last time i did linear regression was 4 years ago and i used Stata, we never learned R/Python in any of my classes so learning on my own was a bit slow
lyric canopy
Yeah, I can imagine. If you want a somewhat wider view, a book like An Introduction to Statistical Learning (James, Witten, Hastie, Tibshirani) maybe something for you. If you want a more indepth view of the linear model, Applied Regression Analysis & Generalized Linear Models (Fox) may be a book to consider.
mossy dragon
I'm not sure if i want to do that indepth
as long as i can get a working knowledge of linear regression i can move on to other stuff
lyric canopy
mossy dragon
or at least thats my hope
lyric canopy
Yeah
mossy dragon
What about elements of statistical learning?
thats the one im thinking of picking up
lyric canopy
That depends a bit on your level in maths
ESL has an overlap in authors with ISL, but is much more math heavy
mossy dragon
I have a minor in math, took probability & statistics, linear algebra, calc 1-3 and differential equations
and intro to econometrics (where i learned linear regression)
lyric canopy
You can download a digital copy of ESL on the book's website so you can have a look
For free
mossy dragon
oh thatd be quite nice
i was really hoping i didnt have to go back into learning maths until i started a masters
but i dont think it can be helped
mossy dragon
thanks ill be taking a look at these during my commute
but going back to my linear regression
any suggestions on what to do with the outliers?
void anvil
Outliers are super important tbh
lapis sequoia
it depends
always depends on your end goal..
state your goal first.. never jump to the algorithm.. I wish I could pin this somewhere..
mossy dragon
https://cdn.discordapp.com/attachments/464543604728135691/549018386122801153/unknown.png
https://cdn.discordapp.com/attachments/464543604728135691/549018441789472770/unknown.png


this is log(total_sales) ~ avg critic score/avg user score
much better yea?
lapis sequoia
looks like a whole bunch of dots and a line..
what is the avg user score stand for
does*
mossy dragon
its percent
based on metacritic
user scores
a 100 would be an avg user score of 10
lapis sequoia
what are they using..
lapis sequoia
what is the total sales.. sales of what?
mossy dragon
video games
mossy dragon
this is total sales of video games
lapis sequoia
so you want to relate user score to sales..
mossy dragon
yes
well originally wanted to do user scores, but it seems like critic scores are much better
lapis sequoia
user scores seem very arbitrary.. how does it relate to sales.. in what sense
as in if they do more reviews, they're likely to have bought more?
mossy dragon
A game that has higher user score will encourage more people to buy it
I assume people dont buy random games and rely on reviews to see wether buying a game is worth it
lapis sequoia
ok.. so the correlation here is that a game with higher user score is likely to have more buyers..
mossy dragon
yes
lapis sequoia
but that doesn't relate to total sales..
by total sales I guess you might be including sales for all games
mossy dragon
total sales for that game across all platforms
lapis sequoia
ok.. while there may be a correlation.. this is not the right way to scale this.. perhaps you have other metrics to relate it to? but what is your end goal?
do you seek to understand what factors influence sales? do you want to find ways to increase sales?
mossy dragon
its a side project, I'm an avid video gamer and i hate it that publishers put so much weight on the critic scores and don't seem to care about user scores
so i was trying to prove that user scores are a better metric for gauging how many sales a game will have than critic scores
lapis sequoia
ok.. if there is data available on how those scores changed over time, you can plot that against sales over that period
mossy dragon
No that was one of the things i was aiming for
lapis sequoia
and if you're goal is to show that particular score affects sales, you can overlay multiple game sales over that
mossy dragon
price, scores over time and total budget allocated to the game (particularly marketing budget)
but i couldn't find that data
all i could find was sales, sales by region, user scores, critic scores, esrb rating, genre, platform, developer, publisher, release date
lapis sequoia
ok you kinda need that for your objective..
if you're doing it for one game.. or multiple games..
a less trustworthy correlation would be to plot point graph of your concerned scores vs total sales per game.. for multiple games.. in one graph..
that will show some sort of correlation, maybe.. but it's very loose..
or.. correlation plot, of the same game sales across multiple platforms .. include all the other data that you mentioned (and think probably relate to the sales) including the scores .. and you'll get a heat map of correlation along with some preliminary values
mossy dragon
Thats the same conclusion I reached.
Welp, like I mentioned this is the first time doing a linear regression project with data I gathered myself so I wasn't too optimistic
hopefully it shows that I do kind of have an idea of what im doing so i can put it in a portfolio/resume.
lapis sequoia
can someone help me understand the graphs here

GitHub
Contribute to christianjunge/AM207homework development by creating an account on GitHub.
at the very bottom
lapis sequoia
anyone? :<
I just need a simple explanation of the difference between the graphs..
lapis sequoia
Just gonna wait here.. I'm sure there's someone on here who understands this stuff
 hasty maple
What did you not understand @lapis sequoia?
 spare karma
Anyone willing to advise a newb working on a non-linear regression problem? I'm simply trying to emulate one of scikit's stock examples (https://scikit-learn.org/stable/auto_examples/svm/plot_svm_regression.html) with my own dataset.
I'm not sure why my RBF code plots multiple lines.
spare karma
made a post on r/learningmachinelearning as well to maximize exposure: https://www.reddit.com/r/learnmachinelearning/comments/aubvmo/help_a_newb_with_a_simple_regression_exercise/

reddit
0 votes and 0 comments so far on Reddit
lapis sequoia
@hasty maple how is the posterior being plotted for each vote and what does the graph mean when opinionated prior is above or below indecisive prior
lapis sequoia
anyone?
can someone explain the 5 percentile part to me..
I've been at this a while now :v
mossy dragon
Ok so, im trying to analyze total sales of video games, and one of the thing I've noticed is that all of the outliers are games that are played extensively in multiplayer, since I believe that sales in these games are exponential (because if one person gets it then their friends are more likely to get it and each of those person's friends are more likely to get it etc.), it would be appropriate to take the log of total sales when doing the regression?
I was going to try to add wether a game is multiplayer or not as a variable but I don't have the data unfortunately
supple ferry
@mossy dragon , you can get multiplier information via python script, parsing the game on https://www.igdb.com/discover for example

IGDB.com
IGDB.com is a video game community website, intended for both game consumers and video game professionals alike.
simple script will do the work
So, in every game page, you will find this tag.
<a class="block" href="/game_modes/multiplayer" itemprop="playMode" rel="tag">Multiplayer</a>
you welcome! I am not sure, how complex it is going to be, but I assume, in couple of lines, you can make it work
def multiplayerfinder(name):
    result = ;list(somestufftoparse)
    return 1 if "multiplayer" in result else 0
and then you can apply it as new column to your dataframe
kinda silly function, but should do the job
mossy dragon
im very heavily interested in budget info
you know another website that has budget info for games?
supple ferry
Not every game discloses that type of info afail
some very famous ones, do. Yet, 90 percent dont
mossy dragon
yea thats the issue
supple ferry
for AAA types, maybe you can find. for the others, dont even try 😃
mossy dragon
I think if i had that info my model might be halfway useful
supple ferry
you do not need to add new variables to improve your model. you should naturally make some initial assumptions, and one of them will be, budget info is missing e.g
 carmine lava
Hello @everyone Can any one say me what are activation function and how are they used in traning as simple as possible  because I have seen a lot of video on avtivation function some people says its just convert input signal to output but i did not undastand please any one here can tell me in simple way and with an example or refrence video or blog would be grate
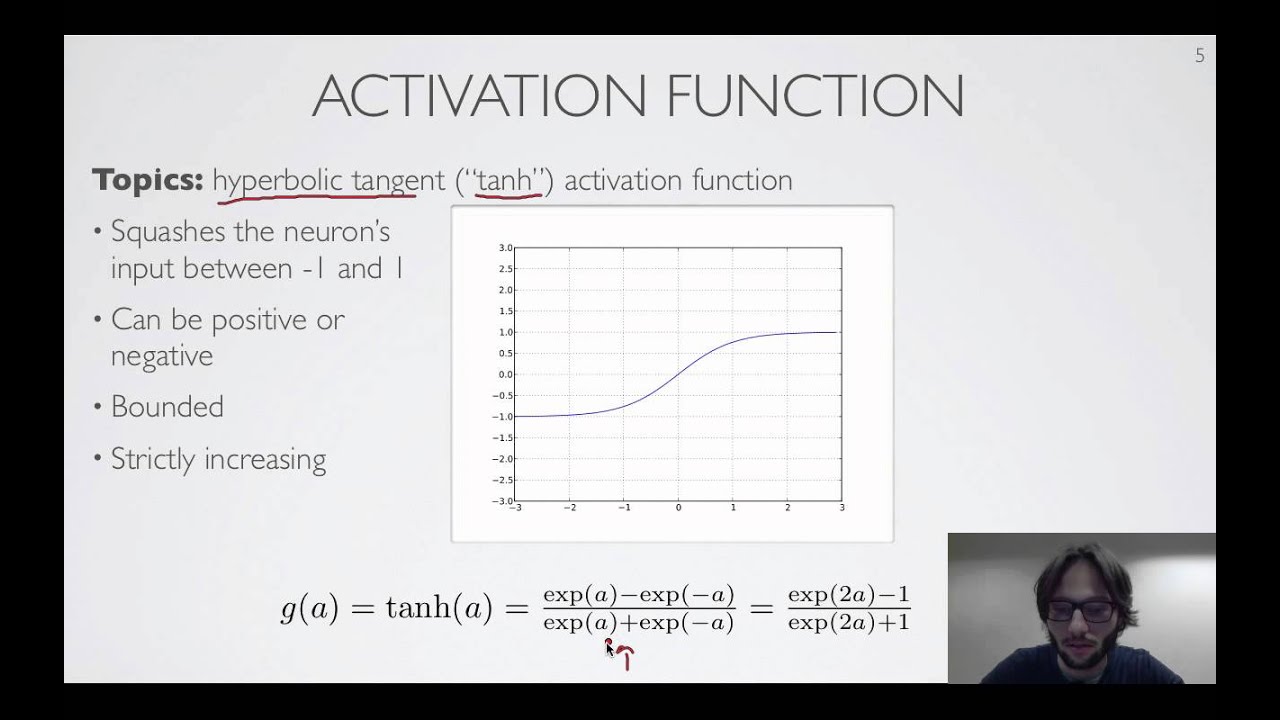 carmine lava
@supple ferry thanks but its saying about activaction function not how is it used when we should we use it
supple ferry
@carmine lava , if you want some mathematical details, you can check Ian Goodfellow's book on neural nets. It is free to read online here:
http://www.deeplearningbook.org/contents/mlp.html
lapis sequoia
I'm asking this here again in hopes that there's someone well versed in the subject who can help me. understand this.
https://github.com/christianjunge/AM207homework/blob/master/AM207_ChristianJunge_HW2.ipynb
GitHub
christianjunge/AM207homework
the last problem here.. help me understand the graphs
This much I understand:
they have an array of likes and dislikes for each video.. and want to decide a rating for the video
[3,0],[300,100],[2,2],[200,100]
the voting is skewed.. some have 300 likes and 100 dislikes.. and some have 3 likes..
then they use a uniform distribution and a beta distribution (not really sure what these are) to return two new arrays for each of the original votes
and they plot .... something...
GitHub
Contribute to christianjunge/AM207homework development by creating an account on GitHub.
lapis sequoia
anyone? atleast help me understand why they consider the 5th percentile
 small shore
Does anyone have a good database of pieces of arts labeled by the type of art, genre, and subject? or any type of those things preferably very large
one example is caltech 256, but preferably larger
large number of pieces not size of art*
hasty maple
@lapis sequoia I'm not too good with stats but from my understanding, if the data set is large then the priors( initial opinion ) that one has doesn't matter because of the effect of law of large numbers but if there is less data, then our priors( initial opinion ) causes the result to be skewed towards the extremes
how is the posterior being plotted for each vote
Fromscipy.stats.beta.pdffunction inIn [493]
what does the graph mean when opinionated prior is above or below indecisive prior
When one is opinionated, then the weights of the pdf is pushed to the opinions (bias), so if the data's result does indeed appear opinionated [3,0] then the opinionated pdf would be higher but if the data isn't opinionated [2,2] then the opinionated pdf you get would be lower than the indecisive pdf because the opinion isn't correct.
lapis sequoia
import random
i = int(input('Length: '))
lis = []
while i > 0:
    x = random.randint(0,10)
    i = i - 1
    lis.append(x)
q1=q2=q3=q4=q5=q6=q7=q8=q9=q10=0

for i in lis:
    if  i == 1:
        q1=+1
    elif i == 2:
        q2=+1
    elif i == 3:
        q3=+1
    elif i == 4:
        q4=+1
    elif i == 5:
        q5=+1
    elif i == 6:
        q6=+1
    elif i == 7:
        q7=+1
    elif i == 8:
        q8=+1
    elif i == 9:
        q9=+1
    elif i == 10:
        q10=+1

tot = q1+q2+q3+q4+q5+q6+q7+q8+q9+q10

def percy(x,y):
    return (x/y)*100

print('Are the percentages:\n','-1 %', percy(q1,tot),'\n-2 %', percy(q2,tot),'\n-3 %', percy(q3,tot),'\n-4 %', percy(q4,tot),'\n-5 %', percy(q5,tot),'\n-6 %', percy(q6,tot),'\n-7 %', percy(q7,tot),'\n-8 %', percy(q8,tot),'\n-9 %', percy(q9,tot),'\n-10 %', percy(q10,tot),)```so yea
i was trying to find out at which percentage each number is pseudo randomly produced
Length: 10000
Are the percentages:
-1 % 10.0
-2 % 10.0
-3 % 10.0
-4 % 10.0
-5 % 10.0
-6 % 10.0
-7 % 10.0
-8 % 10.0
-9 % 10.0
-10 % 10.0
I got this result
which just isnt right
: /
lyric canopy
!e
import random
i = 1000
lis = []
while i > 0:
x = random.randint(0,10)
i = i - 1
lis.append(x)
q1=q2=q3=q4=q5=q6=q7=q8=q9=q10=0
for i in lis:
if i == 1:
q1=+1
elif i == 2:
q2=+1
elif i == 3:
q3=+1
elif i == 4:
q4=+1
elif i == 5:
q5=+1
elif i == 6:
q6=+1
elif i == 7:
q7=+1
elif i == 8:
q8=+1
elif i == 9:
q9=+1
elif i == 10:
q10=+1
tot = q1+q2+q3+q4+q5+q6+q7+q8+q9+q10
def percy(x,y):
return (x/y)*100
print('Are the percentages:\n','-1 %', percy(q1,tot),'\n-2 %', percy(q2,tot),'\n-3 %', percy(q3,tot),'\n-4 %', percy(q4,tot),'\n-5 %', percy(q5,tot),'\n-6 %', percy(q6,tot),'\n-7 %', percy(q7,tot),'\n-8 %', percy(q8,tot),'\n-9 %', percy(q9,tot),'\n-10 %', percy(q10,tot),)
lapis sequoia
import random
i = int(input('Length: '))
lis = []
while i > 0:
    x = random.randint(0,10)
    i = i - 1
    lis.append(x)
q1=q2=q3=q4=q5=q6=q7=q8=q9=q10=0

for i in lis:
    if  lis[i] == 1:
        q1=+1
    elif lis[i] == 2:
        q2=+1
    elif lis[i] == 3:
        q3=+1
    elif lis[i] == 4:
        q4=+1
    elif lis[i] == 5:
        q5=+1
    elif lis[i] == 6:
        q6=+1
    elif lis[i] == 7:
        q7=+1
    elif lis[i] == 8:
        q8=+1
    elif lis[i] == 9:
        q9=+1
    elif lis[i] == 10:
        q10=+1

tot = q1+q2+q3+q4+q5+q6+q7+q8+q9+q10

def percy(x,y):
    return (x/y)*100

print('Are the percentages:\n','-1 %', percy(q1,tot),'\n-2 %', percy(q2,tot),'\n-3 %', percy(q3,tot),'\n-4 %', percy(q4,tot),'\n-5 %', percy(q5,tot),'\n-6 %', percy(q6,tot),'\n-7 %', percy(q7,tot),'\n-8 %', percy(q8,tot),'\n-9 %', percy(q9,tot),'\n-10 %', percy(q10,tot),)```i modified it
it sort of works but i dont know
lyric canopy
Oh
I see what you're doing wrong
for i in lis will already get you the elements itself, not the indices of the elements.
So, you can just do:
for number in lis:
    if  number == 1:
        q1=+1
    elif number == 2:
        q2=+1
   # and so on
Now, there's an easier way to do this, obviously, without that many if-statements
lapis sequoia

being a noob hurts
Are the percentages:
-1 % 16.666666666666664
-2 % 0.0
-3 % 16.666666666666664
-4 % 16.666666666666664
-5 % 0.0
-6 % 16.666666666666664
-7 % 0.0
-8 % 0.0
-9 % 16.666666666666664
-10 % 16.666666666666664

[6, 1, 1, 3, 3, 9, 6, 4, 0, 6, 10, 6, 10, 5, 3, 7, 6, 7, 8, 1, 7, 8, 1, 8, 7, 0, 0, 7, 10, 5, 0, 5, 4, 10, 2, 7, 7, 10, 7, 5, 7, 1, 3, 10, 3, 9, 2, 10, 5, 8, 1, 3, 3, 10, 3, 4, 2, 8, 1, 9, 0, 6, 1, 9, 3, 10, 7, 6, 5, 10, 9, 8, 1, 8, 1, 4, 7, 7, 10, 2, 3, 6, 6, 1, 6, 5, 2, 8, 9, 0, 2, 2, 9, 0, 2, 4, 2, 8, 0, 4]```something isnt quite right
why cant I see the 2,5,7 and 8
lyric canopy
!e
import random

from collections import Counter

i = 1000
result = [random.randint(1, 10) for _ in range(i)]
c = Counter(result)

for value, count in sorted(c.items()):
    print(f"{value:2d} : {count/i*100:.2f}%")
 arctic wedgeBOT
@lyric canopy Your eval job has completed.
001 | 1 : 11.10%
002 |  2 : 10.40%
003 |  3 : 10.40%
004 |  4 : 10.10%
005 |  5 : 10.60%
006 |  6 : 10.10%
007 |  7 : 8.40%
008 |  8 : 9.60%
009 |  9 : 9.40%
010 | 10 : 9.90%
writing a better script with 7 lines
lyric canopy
Well, I've been doing this for a while now, so I may not be the best comparison
!e
import random

from collections import Counter

i = 1000
c = Counter(random.randint(1, 10) for _ in range(i))

for value, count in sorted(c.items()):
    print(f"{value:2d} : {count/i*100:5.2f}%")
@lyric canopy Your eval job has completed.
001 | 1 :  9.60%
002 |  2 : 10.60%
003 |  3 : 11.20%
004 |  4 :  9.70%
005 |  5 :  9.40%
006 |  6 : 11.00%
007 |  7 : 11.50%
008 |  8 :  9.00%
009 |  9 :  7.80%
010 | 10 : 10.20%
Hmm, i doesn't align the first line nicely. I should look into that.
lyric canopy
Did you change your for-loop?
You were doing:
for i in lis:
    lis[i] == 1
but it should be:
for number in lis:
    if  number == 1:
        q1=+1
    elif number == 2:
        q2=+1
   # and so on
import random
i = int(input('Length: '))
lis = []
while i > 0:
    x = random.randint(0,10)
    i = i - 1
    lis.append(x)
q1=q2=q3=q4=q5=q6=q7=q8=q9=q10=0

for i in lis:
    if  lis[i] == 1:
        q1=+1
    elif lis[i] == 2:
        q2=+1
    elif lis[i] == 3:
        q3=+1
    elif lis[i] == 4:
        q4=+1
    elif lis[i] == 5:
        q5=+1
    elif lis[i] == 6:
        q6=+1
    elif lis[i] == 7:
        q7=+1
    elif lis[i] == 8:
        q8=+1
    elif lis[i] == 9:
        q9=+1
    elif lis[i] == 10:
        q10=+1

tot = q1+q2+q3+q4+q5+q6+q7+q8+q9+q10

def percy(x,y):
    return float(x/y)*100

print('Are the percentages:','\n-1 %', percy(q1,tot),'\n-2 %', percy(q2,tot),'\n-3 %', percy(q3,tot),'\n-4 %', percy(q4,tot),'\n-5 %', percy(q5,tot),'\n-6 %', percy(q6,tot),'\n-7 %', percy(q7,tot),'\n-8 %', percy(q8,tot),'\n-9 %', percy(q9,tot),'\n-10 %', percy(q10,tot),'\n')
print(lis)```You don't iterate over the indices, but the actual numbers
So, i is not the indice, but the actual number in the list
lapis sequoia
oh
lyric canopy
So instead of lis[i] you should just use i == 1
lapis sequoia
that was dumb
no
i think its correct
because it needs to check the value for that element of the list
lyric canopy
You are not getting the indices, but the actual elements when you iterate over a list
!e
my_list = [199, 3, 2, 5, 7, 3]
for i in my_list:
    print(i)
@lyric canopy Your eval job has completed.
001 | 199
002 | 3
003 | 2
004 | 5
005 | 7
006 | 3
huh
lyric canopy
Also, your operator is the wrong way around
It should be += not =+
So, now it's setting it to +1
!e
import random
i = 1000
lis = []
while i > 0:
    x = random.randint(1,10)
    i = i - 1
    lis.append(x)

q1 = q2 = q3 = q4 = q5 = q6 = q7 = q8 = q9 = q10 = 0

for i in lis:
    if i == 1:
        q1 += 1
    elif i == 2:
        q2 += 1
    elif i == 3:
        q3 += 1
    elif i == 4:
        q4 += 1
    elif i == 5:
        q5 += 1
    elif i == 6:
        q6 += 1
    elif i == 7:
        q7 += 1
    elif i == 8:
        q8 += 1
    elif i == 9:
        q9 += 1
    elif i == 10:
        q10 += 1

tot = q1+q2+q3+q4+q5+q6+q7+q8+q9+q10

def percy(x, y):
    return float(x/y)*100

print('Are the percentages:','\n-1 %', percy(q1 ,tot),'\n-2 %', percy(q2,tot),'\n-3 %', percy(q3,tot),'\n-4 %', percy(q4,tot),'\n-5 %', percy(q5,tot),'\n-6 %', percy(q6,tot),'\n-7 %', percy(q7,tot),'\n-8 %', percy(q8,tot),'\n-9 %', percy(q9,tot),'\n-10 %', percy(q10,tot),'\n')
@lyric canopy Your eval job has completed.
001 | Are the percentages:
002 | -1 % 8.799999999999999
003 | -2 % 11.3
004 | -3 % 10.100000000000001
005 | -4 % 11.3
006 | -5 % 9.1
007 | -6 % 9.9
008 | -7 % 9.700000000000001
009 | -8 % 9.6
010 | -9 % 10.7
011 | -10 % 9.5
import random
i = int(input('Length: '))
lis = []
while i > 0:
    x = random.randint(0,10)
    i = i - 1
    lis.append(x)
q1=q2=q3=q4=q5=q6=q7=q8=q9=q10=0

for i in range(0,len(lis)):
    if  lis[i] == 1:
        q1+=1
    elif lis[i] == 2:
        q2+=1
    elif lis[i] == 3:
        q3+=1
    elif lis[i] == 4:
        q4+=1
    elif lis[i] == 5:
        q5+=1
    elif lis[i] == 6:
        q6+=1
    elif lis[i] == 7:
        q7+=1
    elif lis[i] == 8:
        q8+=1
    elif lis[i] == 9:
        q9+=1
    elif lis[i] == 10:
        q10+=1

tot = q1+q2+q3+q4+q5+q6+q7+q8+q9+q10

def percy(x,y):
    return float(x/y)*100

print('Are the percentages:','\n-1 %', percy(q1,tot),'\n-2 %', percy(q2,tot),'\n-3 %', percy(q3,tot),'\n-4 %', percy(q4,tot),'\n-5 %', percy(q5,tot),'\n-6 %', percy(q6,tot),'\n-7 %', percy(q7,tot),'\n-8 %', percy(q8,tot),'\n-9 %', percy(q9,tot),'\n-10 %', percy(q10,tot),'\n')
print(lis)```works
thanks
kinda not as satisfying as i expected
lyric canopy
What did you want to do?
lapis sequoia
I wanted to know if the pseudo random munber generator was biased
i guess the range between 0 and 10 isnt enough to see a bias
hasty maple
how's all this data-sciencey?
lapis sequoia
wasnt sure which channel to ask help from
supple ferry
Does anyone have here some exp with Cython?
I have a code which I want to rewrite in Cython (as much as possible, with minimum python overlay) which involves Pandas, NumPy and Sklearn.
Sklearn and Numpy parts are more or less done. Now, what I want to do, to replace pandas concat function with NumPy or C-like function.
I am grouping the dataframe by column ID, then doing some stuff with it, create a new dataframe, and concatenate them afterwards
I would like to know, how you would approach this problem. Creating arrays and then concatenating them, or taking the original dataframe, filter it for id, and stick new generated columns to it
 orchid lintel
Not sure if this is technically math or programming, but - Is there a standard way of extracting interaction terms in Decision Tree models?
I know one of the benefits of decision tree models is that it'll find them on your own without having to explicitly make them, but it'd be cool to be able to see them along with the individual feature importances.
lapis sequoia
most of the time you need to use custom functions
but look up the libraries..
some of them do have ways to list feature importance
I think I implemented some here

GitHub
My final code submissions for competitions on DrivenData.org - RinzlerTron/Driven-Data
orchid lintel
Thanks! btw, forgot to mention I specifically was asking about Decision Trees (just edited my post to reflect that)
void anvil
All the cool kids are using Numba instead of Cython apparently
Is the word on the streets
supple ferry
@void anvil yes I know. I want to use cython for this. Also learn some C stuff along the way
lapis sequoia
use swig
 ripe sundial
Hello all. I have a data science related question. I have a sensor (UWB Impulse Radar sensor). It is capable of sending out waves that hits a target and receives feedback. The data received from the sensor is in the following format: https://hastebin.com/abiqekavac.json. Each element in the list corresponds to a distance, the list represents a total of 54 elements, which add up to a distance of 300 cm. So the first 5 0's in the row correspond to a distance of 27.5 cm
Now what I would like to use the data for is to predict the amount of people the sensor is sensing. In the data I have gathered, two people are always present, so the label of the data is 2 for each row, indicating presence of two persons. And thus I would like to make a model that is capable of classifying unlabelled data. I will later also gather data for 1 and more than two persons.
Currently what my challenge is I am not sure how to use the data (shown in the URL above) together with Random Forest. I figured random forest could be a good place to start. Any idea how to progress?
supple ferry
@ripe sundial , what is your data dimensions? how many samples you have
void anvil
Are there any good tools to print reports out of Python? I'd prefer a .pdf or something equivalent rather than screenshots of reporting
lyric canopy
You can generate pdf/tex from jupyter notebooks
ripe sundial
@supple ferry Samples I can generate, since I have access to the sensor, so it would just be a matter of collecting more data. The dimensions are: for each row I have 1 column and inside the column I have a list of 54 elements as seen in the link https://hastebin.com/abiqekavac.json. The full CSV has other data, such as timestamp but didn't find it to be important. I can upload a sample of the full csv if it helps: https://pastebin.com/HdZgD8R1 The second links shows a sample of the data I have. I specifically use the MovementFastItem
orchid lintel
@void anvil https://dev.to/goyder/automatic-reporting-in-python---part-1-from-planning-to-hello-world-32n1

The Practical Dev
I'd like to document and step through the execution of a simple concept in Pyth...
 sand lark
Hi, I'm trying to understand why, if I center a matrix, I get different eigen vectors (with swapped components) based on whether I take the spectral decomposition of X.T @ X vs the svd of X
here is a code sample
X = np.array([[1, 2, 3], [2, 2, 1]])
X_ = X
C = X_.T @ X_

S1, V1, = np.linalg.eig(C)
U, S2, V2t = np.linalg.svd(X_)

print('\nV1: {}\n\nV2: {}'.format(V1, V2t.T))

X_ = X - np.mean(X, axis=0)
C = X_.T @ X_

S1, V1, = np.linalg.eig(C)
U, S2, V2t = np.linalg.svd(X_)

print('\nV1: {}\n\nV2: {}'.format(V1, V2t.T))
in the second case, where I centered the data, V2t.T has swapped the first and third components of the singular vecs
sand lark
nevermind, they are just being returned in different order, but the column-wise components make sense 😄
 spark spire
Does anyone have experience with the Tensorflow input pipeline?
spark spire
No matter what I do, I cannot read a directory into tensorflow.
carmine lava
Hello everyone I have a question in Convolutional Neural Networks (CNNs) many people said that it search for edge, conner and more using filters so what are filters are the manule coded or system automatic generate it
 shrewd helm
Hello, I want to make ai bot that plays MK4 (fighting). Is PyTorch library is good for this task?
I want to show my ai only possible keyboard moves and the goal that he have to reach (how to fight he needs to learn alone)
this is called regression programming or what?
is there are some code examples of python that plays some game?
carmine lava
@shrewd helm you can try gym if you want we can cloab and work on it 
@shrewd helm The gym library provides an easy-to-use suite of reinforcement learning tasks.
shrewd helm
@carmine lava gym are too easy, let’s collab on mk4 bot)
@carmine lava it’s not super hard to do. computer vision + pytorch = job done)
At least it didn’t sounds hard
 hybrid dew
Is this a good place to discuss numpy
lyric canopy
Sure, go ahead
hybrid dew
I am trying to subclass ndarray to a create an nice hierarchy of classes (The idea is to add various metadata). It's just about works in the first level, but when I subclass further I get errors "like the object doesn't own it's data". The documentation is sparse at this point and I don't see many examples around. I wonder if it's a wise approach at all. Is there some project where I can study this pattern in detail?
gilded dagger
<- I WAS RIGHT
https://github.com/pbsinclair42/MCTS/issues/3

GitHub
def getBestChild(self, node, explorationValue): bestValue = float("-inf") bestNodes = [] for child in node.children.values(): nodeValue = child.totalReward / child.numVisits + exploration...
(I pinged people here to ask if he royally screwed up his implementation. He did)
lapis sequoia
Good noon to all! Does any of you know any psychology or behavioral studies related resource of publically availabe data?
 rocky prawn
How can I take only the 3 biggest rows in my table (mysql)
I mean
I have a column called points
i want to take like the top 3
most points
lapis sequoia
SELECT *
FROM yourTable
ORDER BY points DESC
LIMIT 3;
 storm vigil
Hello everyone, I've been forwarded here to ask my inquiry, it seems tensorflow wont install on my pc
lapis sequoia
I was hoping when someone mentioned tensorflow..it'd be interesting
what do you intend to use it for
storm vigil
Petroleum engineering data I guess
storm vigil
@lyric canopy
What i have for now, got cuda 9.0, cudnn 7.4.2. cudnn is copy-pasted in the bin folder of cuda
lyric canopy
Which version of Python are you using in that project?
storm vigil
I assume 3.7
lyric canopy
Okay, yeah, that's probably the problem
lyric canopy
The installation page of tensorflow mentiones it supports/requires Python 3.4, 3.5, or 3.6
storm vigil
Ah
lyric canopy
Probably the 64-bit version as well
storm vigil
I did not find any python requirements so I just downloaded the latest
i see maybe i should start over
lyric canopy
Yeah, it's here: https://www.tensorflow.org/install/pip

TensorFlow
It has some information on which dependencies you'll need as well
storm vigil
bingo
storm vigil
damn. if I just reinstall python to 3.6 will I lose all the scripts?
lyric canopy
What do you mean? You should be able to keep the scripts you've written
But, you may have to install the dependencies for Python 3.6
I don't think there's anything for P3.7 that's not available for P3.6 though
storm vigil
What's a dependency haha
lyric canopy
Oh, a package/module
lyric canopy
With just the standard library of Python?
Then you should probably have no issue using it on Python 3.6. You can also have both versions installed and select which one you want for your projects
Are you using PyCharm?
lyric canopy
Ah, okay, that's also fine
storm vigil
made this little program the first time haha
lyric canopy
I don't think you'd have an issue with that script in Python 3.6
storm vigil
Yeah the module i only have is uszipcode so prolly wont affect
Okidoki I shall return
lyric canopy
Anyway, that wheel you've linked above is not for installing Python 3.6 itself
But rather to install all the things you need for Tensorflow in P3.6
storm vigil
I need to add you
Is it okay to download 3.6.8 and not specifically 3.6.7?
Pretty confused why did they release 3.7 in parallel to 3.6
lyric canopy
It's mostly because some projects rely on older versions, so just like Microsoft still releases maintenance updates for Windows 7, the PSF still releases maintenance updates for Python 3.6 (although 3.6.7 is the last maintenance release they'll have))
lyric canopy
Did you try with the wheel you screenshotted above?
storm vigil
Hello Ves, looks like some compatibility issues. My road to learning all of these starts here haha
 obtuse kettle
 inland viper
Hello
In pandas' .rolling().sum(), how do I pass a value to rolling to have the window be the current value and every value before it?
lapis sequoia
give me an example
inland viper
I want to take a column and return a column with values that are the current value plus every value before it
lapis sequoia
ok.. what you want is apply
hmm let me think
you can define a function.. pass window and the series to the df.rolling_sum
inland viper
So if I have 1, 2, 3, 4, 5 in a column, I would want 1, 3, 6, 10, 15 to be returned
What does window do?
lapis sequoia
hmm doesn't seem like you need window for your application..
can you try
df.rolling(window=2, min_periods=1)['yourcolumn_of_interest'].sum()
I got a type error: "TypeError: 'DataFrame' objects are mutable, thus they cannot be hashed"
lapis sequoia
df2 = df.rolling(window=2, min_periods=1)['yourcolumn_of_interest'].sum()
inland viper
The third value and onward are incorrect
It returns the sum of every two consecutive values
lapis sequoia
lemme think
do you need to use rolling or just need the solution
because if it's the later you could just do cumsum
df2['new_col'] = df.your_column_here.cumsum()
inland viper
I need to plot all the values
inland viper
There will be a date column and the column that will be returned here
mossy dragon
CISC 5450 Mathematics for Data Analytics
CISC 5500 Data Analytic Tools and Scripting
CISC 5800 Machine Learning
CISC 5835 Algorithms for Data Analytics
CISC 5900 Information Fusion
CISC 5950 Big Data Programming
CISC 6930 Data Mining
Im looking for a masters program with the goal of becoming a data scientist in the future
this core curriculum seems a bit light on the statistics doesn't it?
lapis sequoia
depends where you want to go..
if it's statistics heavy, you go into finance, banking, research.. if it's programming heavy you go into business analytics, marketing intelligence or building data engineering pipelines..
mossy dragon
Statistics heavy would give me more flexibility though wouldnt it?
I feel like the programming i can just pick up with practice
I mean i can learn how to code a bunch of different models but if i don't know what to use in the right situation then its all for naught right?
I'd love to hear from someone's personal experiences on how their job prepared them or didn't prepare them enough, these are just my thoughts with a few stats classes and a couple of months of self teaching programming
lapis sequoia
you don't need to understand the entire breadth of programming
but it's best not to be limited to what you can apply with just methods related to ml packages
stat packages require basic to intermediate programming knowledge and a limited number of different data structures to apply them efficiently
and about the models.. understanding where they are to be applied, the business cases and optimization is more important
 heavy crow
im having some real problems installing tf... im on windows 10, x64, python3.6, Nvidia Driver 418.81, cuda 9.2, newest tf-gpu (not nightly) version. installed via pip in a venv
im on windows because it has a real desktop-gpu unlike my linux laptop :/ so if anyone could explain a bit more in detail. i dont use windows a lot....
 cursive sun
@heavy crow install PyTorch instead
 earnest prawn
PyTorch and tensorflow are fundamentaly different
cursive sun
Unless you NEED tf in which case you need to build a new conda environment
Yeah i know
Lmao
One is more of a rising star than the other tho, and i cant name one thing that TF can do that PyTorch cant
Anyway if you need to use TF for your project and cant use something else, new environment, install the CUDA stuff, then pip install
cursive sun
Its easier to read imo and the autograd is a little faster
Also its more popular now, so when it comes to debugging i can share code easier with my friends
Also the setup is easier and it actually has a conda install
heavy crow
i use pip anyways
 sharp jetty
scaler = StandardScaler()
scaler.fit(x_train)
train_img = scaler.transform(x_train)
test_img = scaler.transform(x_test)

run_times = []
scores=[]
for i in range(1,300,50):
    start = timeit.default_timer()
    pca = PCA(n_components=i).fit(x_train)
    lgr = LogisticRegression(solver = 'lbfgs')
    lgr.fit(x_train,y_train)
    stop = timeit.default_timer()
    print(i, stop-start)
    run_times.append(stop-start)
im running the following code for PCA run time using MNIST dataset
for each n_component im trying to see how it affects run time
but my results are not what i would expect
as theoretically my run time should increase as the n_components increases
 terse pewter
I think I'm gonna jump on the PyTorch train as well
TensorFlow is just headaches with the million different APIs
lapis sequoia
do you think so
I was just about to learn tensorflow in depth.. because they were coming out with tf 2.0
and support for text stuff
 wind wasp
Any idea why my validation loss is fluctuating soo much?
cursive sun
Failure to generalize properly or validation set too small?
heavy crow
@cursive sun so ive got pytorch installed, was pretty simple tbh
now, ive got around 5k img that look like this:
i want to read the top number but also as many of the bottom ones as i can
so that would be 00264.6515m3
ive got them all labled in a sqllite db
cursive sun
Just build a CNN is like 30 lines of code
All images are the same size yeah?
And you seperated the digits i trust? Youll want this to be solved as multiple classification problems
heavy crow
@cursive sun no, the digits are not sperated, thats the hard part
If I had that the dials would just be the angle lol
I wish it were that easy
cursive sun
No you have the labels
Seperate the digits in the labels
Instead of trying to identify a 3 digit number identify 3 1 digit numbers
heavy crow
@cursive sun i have that img and the corresponding number
i do not have the position of every number
cursive sun
You dont need the positions
heavy crow
?
what do you mean by splitting it into 3 numbers then?
if i dont know where they are
how should i split them
void anvil
How can I leave a model in memory and call fits every period of time. The general script should look like:
#load feature engineering
Every X minutes:
    Connect to DB for information
    Engineer features
model.predict()```Or how can I wrap the code so that I don't need to load the model into memory each time want to call it with an outside script
heavy crow
@cursive sun ok so ive done some more work. i have the value in a db and i have the pics. all the same size, grayscale, all the same orientation
but i dont have more info about the pic or the value
void anvil
ValueError: Classification metrics can't handle a mix of binary and continuous targets
Do I turn my 1/0 bins to floats or?
     79     if len(y_type) > 1:
     80         raise ValueError("Classification metrics can't handle a mix of {0} "
---> 81                          "and {1} targets".format(type_true, type_pred))
     82
     83     # We can't have more than one value on y_type => The set is no more needed

ValueError: Classification metrics can't handle a mix of binary and continuous targets```

calling with ```classification_report(y, model.predict(x))```y.asfloat isn't working either
 dry dew
How would you make a function to generate all possible strings of x length accoring to ascii
I can't think of any straghtforward way
(using ascii in decimals, 0-127)
polar acorn
@void anvil If you print out y and model.predict(x) and inspect their types you might find what is wrong.
void anvil
it was something irrelevant
my ensemble model wasn't saving the second stage and errored out as it wasn't fit when I called evaluate
so that error came
then 50+ lines of error messages
then that one
so I was looking at the wrong problem
void anvil
Updated to sklearn .21, tons of deprecation warnings, feelsbadman
polar acorn
Heh the old 50+ lines of error messages, classic.
void anvil
Yeah I usually scroll to the red at the bottom because that's the most enlightening. Turns out that there was a second line of red in the middle of all the code calls being executed
lapis sequoia
guys
anyone alive
I'm trying to understand log likelihood
I used a language model to calculate log likelihood, the values are in negative.. but they are good queries
void anvil
Understanding the log-likelihood function: what it is, how it is derived, why it is helpful, examples.
gilded dagger
HeyGuys
Anybody knows how to make a ribbon chart in Python?

(before you ask if it's the right visualisation for my data, yes it is. I'd just like to do it outside of PowerBI)
void anvil

Towards Data Science
Scikit-learn is an intuitive and powerful Python machine learning library that makes training and validating many models fairly easy…
@lucid hornet
This looks like a very good solution for loading scripts and running smaller loops. You can push info /calls into an already loaded python script.
 lucid hornet
Oh yeah that does seem pretty handy. I'll keep that in mind next time this comes up. I'm glad you were able to find a solution
Sorry I wasn't more help on it
void anvil
No worries, can't expect people to know everything. Comes in handy knowing a few people with Ph.D.s in machine learning lol
 vale hedge
anyone know if headers in pandas columns are always strings?
 obtuse skiff
Does anyone understand how to use RandomUnderSampler from imblearn???
I have a 2d array of integers for my data and a 1d array of the correlating classifications. How do I go about undersampling this?
 magic pecan
@obtuse skiff do you have categorical data?
obtuse skiff
what do you mean by that
magic pecan
your y
obtuse skiff
the classifications?
obtuse skiff
[[12312, 123123 ,12351, 642],[123, 515, 6234],[16312,514,69127]]
but ALOT bigger
its just a 2d array of integers
each row correlates to the classifier in the second class array
magic pecan
what does the second array look like ?
obtuse skiff
[[1],[0],[1],[1]]
magic pecan
can you just paste what the interpreter says?
obtuse skiff
899, 98032, 98266, 98277, 98301, 98342, 98353, 98413, 98419, 98448, 98458, 98468, 98635, 98892, 99118, 99337, 99621, 99625, 99739, 99745, 99755, 99828, 99955, 99967])].
Reshape your data either using array.reshape(-1, 1) if your data has a single feature or array.reshape(1, -1) if it contains a single sample.
oh apparently its actually like ths
list([190, 191, 354,
its an array of lists
not 2d
is there a difference in python?
magic pecan
can you paste all the command line session? on https://ptpb.pw/f for example
include a line that prints your data
magic pecan
good
obtuse skiff
[list([123]),list([1232])]
magic pecan
there is no difference
obtuse skiff
hmm
magic pecan
if you type [list([123]),list([1232])] in the interpreter
if returns [[123], [1232]]
obtuse skiff
So I have my 2d array of training set data (integers), each row has a different number of values
when I go to fit it into a sklearn Decision tree it says "ValueError: setting an array element with a sequence." I looked this up and it looks like that each row needs to have the same number of elements
How do I got about doing that? would I just add zeros on to the end of each shorter row to make them equal?
ripe sundial
Hello I have the following code: https://hastebin.com/fewanaxeru.py . What I am trying is I would like to use 1D Convolutional Neural Network but I am unsure about how to feed my data into the model.
My data is the following:
Number of columns in the dataframe: 53 (Last column is label's 'Class')
Number of rows in the dataframe: 615
I am following this tutorial: https://towardsdatascience.com/human-activity-recognition-har-tutorial-with-keras-and-core-ml-part-1-8c05e365dfa0 I am basically stuck at the Reshape Data into Segments and Prepare for Keras. Unsure how to use the <def create_segments_and_labels> function with my data and code.
 summer plover


 woven matrix
Hi all - quick question about scikit learm/ machine learning in general. I've done a ton of ML work in the past but never had to worry too much about outliers in the training/testing set. Does Scikit have a any nice functions for taking a whole dataset, analysing it for outliers, and removing the offending instances/examples/rows from the dataset as a pre-processing step to training? Note - I don't mean simple scaling of the features - I'd like to straight up remove any outlier instances that are making my model harder to train/test.
I was looking at some isolation forrest examples, but I'm not sure if that's the right approach to be using for this task
 kind orchid
From what I know, there is no automated way to remove outliers as outliers can be wrong and need to be changed (data entry error) or good and need to be kept if they can be explained with features. I usually start ML projects with a variety of plots, like pairplots, boxplots, etc to understand your data.
Hope this helps
woven matrix
Yeah I've plotted some of the features but it's just too many to go over manually. I was hoping to just try a harsh automatic removal of outlier-looking instances to see how it impacts my algorithm. Also as kind of a sanity check - my live/production data comes various live sources that might have some errors on them so I'd like a bit of a pre-screen check on my input before I throw it at my model to get a prediction, in case the data im putting in is nonsense
for example - if one of the data sources has fallen over and is spitting out nonsense, I currently wouldn't detect that and still feed that data to the model to get a prediction (and then carry out an action based on that prediction). I could implement something crude/manual to look for acceptable ranges for each feature, but was hoping for something a bit more pretty.
kind orchid
If you know the distribution of some feature, you can compare given value to theoretical distribution to get alerts when possible outliers. Depending on the application, it may not be a good idea to automatically change the values if they fall outside of a range.
woven matrix
yeah that's kind of what I was thinking. Might look at using a one-class model as another method - if I train it on known good examples, it might/should be able to detect data that looks unusual
void anvil
Outliers are generally way more important than the 'normal' info
if you really wanted to, you could drop stuff based on z scores or distance
 heavy apex
Hi strange request, and not sure if this is the place to ask, but I was looking for a professional in the field of data science to conduct a text interview of 8 questions for a class assignment. Just send me a DM if interested. Thanks in advance.
 placid snow
We offer code help, not... Well this is basically recruitment
supple ferry
#career-advice is a place for this I presume
placid snow
Not really, we dont offer any place for recruitment
supple ferry
@placid snow , then my bad. I mistaked it with r/python
 potent phoenix
Any handholding guides to creating a Unet implementation in Keras?
I see a few different examples online but I'm completely new to this.
lapis sequoia
whats a unet
void anvil
half of a wnet
@potent phoenix https://www.kaggle.com/keegil/keras-u-net-starter-lb-0-277

GitHub
unet for image segmentation. Contribute to zhixuhao/unet development by creating an account on GitHub.
lapis sequoia
Anyone been doing work with Anaconda on Win? Somehow it seems I messed it up when installing and can't seem to access conda or the navigator
void anvil
uninstall and reinstall
lapis sequoia
yeah at my 3rd time heh, Well I will come back if i got anything more concrete
supple ferry
Hey there! A question. I searched for fixed effect modeling in python, and found ´linearmodels´ for this. There is no implementation of Logit model though. Anyone has exp for this? I can build it myself too, yet I am interested if there is any ready implementation
lyric canopy
I haven't read the page, but I assume this one includes the logit link: https://scikit-learn.org/stable/modules/linear_model.html#logistic-regression
supple ferry
@lyric canopy these are simple logit models. What I am interested is conditional logit model, or logit with fixed effects.
void anvil

Stack Overflow
Is there an existing function to estimate fixed effect (one-way or two-way) from Pandas or Statsmodels.
There used to be a function in Statsmodels but it seems discontinued. And in Pandas, there is
Looks like they cut out panel models
supple ferry
Unfortunately they did cut it out. Now looking for alternatives
void anvil
I think pypi might have it

Medium
Identifying causal relationships from observational data is not easy. Still, researchers are often interested in examining the effects of…
Pew has an article
There’s also “linearmodels”
lapis sequoia
Hey,
Does anyone know of any good tool to "automatically" (lack of beter word. Machine aided maybe?) tune the hyperparametera of a keras + tensorflow Convoluted NN?
void anvil
gridsearch cv or write a similar one
create a dict of each train/test combo you want, save the precision/recall/accurracy, etc. into a dataframe then choose
lapis sequoia
@void anvil can you do that for i.e. Activation as well?
Is there a way to alternate properies of the model, or so you need to generate a new model with the changed parameters?
I'm not sure how high accuracy I should expect to get,it is binary classification with 2.1k images. And regardless how well I can up the acc in the end the data don't represent the general case fairly.
void anvil
it would look like
features = {
learner: {adam, relu}
...
}
then
my_dict={'A':['D','E'],'B':['F','G','H'],'C':['I','J']}
allNames = sorted(my_dict)
combinations = it.product(*(my_dict[Name] for Name in allNames))
print(list(combinations))
Stack Overflow
I would like to generate all combinations of values which are in lists indexed in a dict, like so :
{'A':['D','E'],'B':['F','G','H'],'C':['I','J']}
Each time, one item of each dict entry would be
then run the ml and append to alist of the models
then
for i in combinations:
learner, param_1, etc. = combination
ml (learner, param_1, etc.)
ml_results.append(ml stuff)
lapis sequoia
I well the neural nets dont have features in the same way iirc, the network is suuposed to pick up on that on its own and in general i can only control the structure of the network(layers) , activation, density, overfitting protection (dropout (dropoff?) and whether i preprocess the data or not.
That said I think I can take what you just suggested and alter it slightly to fit my case. Thanks @ragepope
lapis sequoia
Oh and of i am wrong, feel free to correct me :)
void anvil
'layers': [100,50,50,]. [200,25,25]...
you can put in whatever you want
then use the dict to generate all possible combinations
then cycle through training the model using those parameters
then create a dataframe / list which has the parameters used to train the model + the model precision/recall/accuracy
lapis sequoia
Would it be dumb to have an array of different model proposals, and then just loop though them and test them one at a time?
void anvil
no
lapis sequoia
that's actually what we do
you test all of them then you take the one with the best results..
hyperparameter optimization..
void anvil
that's really bad practice
lapis sequoia
no it aint
Then I might do that initially, to get a feel which parameters have a higher effect oj the result before I fine tune
void anvil
it is
lapis sequoia
experimental results are experimental
void anvil
you're p-hacking
if you run 100,000 trials you're going to get some that work
even if your model inputs are shit
lapis sequoia
Well to safeguard against p-hacking cant you isolate some additional data, like a 3rd set (the others train and test/validate) when you only when you have good candidate models?
Disclosure: my assignment is quite basic as it is a University course but I find the subject quite interesting so im building on the quite easy assignment i was given
void anvil
Sure, just depends on how stringent your methodology needs to be. You can also draw heatmaps (lazy method) or use methods like probability of backtest overfitting / other statistical tools which I don't remember off the top of my head.
 reef bone
if you're just a beginner you should try to get a feel for it yourself, rather than automating it
trying every possible combination is just not feasible at all unless you use an extremely primitive architecture / data
that would literally take you weeks or months
void anvil
^ that
reef bone
you can do some reading on the topic https://papers.nips.cc/paper/4443-algorithms-for-hyper-parameter-optimization.pdf
void anvil
usually you rent a ton of server time on the cloud to do stuff
or a university's computing cluster
although research shows randomly searching is the most effective
reef bone
i mean if you just try every possible combination of course you're going to find the best one eventually
but we don't do that for the same reason why we use stochastic gradient descent
lapis sequoia
@reef bone yeah I get that, but I felt that e.g SVC had more features that I could identify itself - while the NNs from what I understood was a bit more; well less straight forward
reef bone
it's just not feasible in terms of computational cost
i would say learning how and why certain parameters affect the performance in various ways is part of the fun
and eventually leads to better understanding
lapis sequoia
And yeah indeed I need to stay within reason, there is no reason to go to the extreme.
What I got is that I set up tensorboard to track the development of each model, and what I would have liked to do is to run through a set of hyperoarameters and the analyser the data to gain undeatanding on what each parameter effect :)
Sorry my spelling broke heh, on my phone
reef bone
oh yeah absolutely, it would be a fun experiment to do
it's just that fully training a model can take hours to days even on massively powerful hardware
so once you start dealing with more complex problems, you need to be careful, and it's good to develop some idea of where to start with the parameters early on
lapis sequoia
Uhu, I will have to take a look at it tomorrow with a fresh set of eyes.
Any advice to keep in mind what parameters are interesting in conv2d CNNs?
Well I only have 2.3k images, and with my GPU it goes pretty fast (980TI)
Yeah, thats why I thought that this could be an interesting case to analyse.
That said, if I understand it right CNNs are a bit tricky in the sense that data set might enjoy benefits from very different parameters
reef bone
i would first make sure you have some understanding of what convolution is, and why it's useful
then you can play with the size of the kernel, stride, etc
it's more of a feature extraction method
so if it's not done properly, the dense layers don't have much to work with
lapis sequoia
I do know that, at least in a theoretical manner. I will play around a bit more tomorrow.
What I still find rather enigmatic is how many layers, how many neurons etc. I can't see a clear connection between data - > structure - >result
Uhu, @reef bone thanks I will keep that in mind when I look at it again :)
reef bone
it comes with practice, no worry
lapis sequoia
Speaking of practice, do you know of any public datasets that I can take a look at after this course is done?
reef bone
a good rule of thumb i see mentioned often is that the layers should form sort of a smooth ish transition between the input layer and the output layer in terms of size, so maybe something like 100 -> 50 -> 10
reef bone
kaggle has some fun datasets, for CNN the CIFAR-10 dataset is canonical
lapis sequoia
@kwzrd yeah that's the approach i took, having an image prepocessed to 256x256 - >(NN) - >256 - >128 - >64 - >32 - >1.
Or something along those lines, dont recall the exact numbers
reef bone
i would also probably recommend you start from a small network and slowly build it up and see if the performance increases, when i first started i was guilty of using needlessly huge networks for simple problems, its an easy mistake to make since we have access to a lot of computational power now
sometimes you really dont need that much
many problems are actually quite simple to solve for the NN, and using overly complex architectures will make it train slower and overfit heavily
lapis sequoia
I haven't checked out kaggle. Oh and that also brings me to the question of what other modules are interesting to look into except tensorflow + keras +skilearn
I see, yeah that is why I wanted to graph it to see if I overfit.
Hehe that said I do the same approach as I do when overclocking (lots of parameters) - i try to go for something on the heavy side, and then try to improve the network by reducing size. That said that appriach won't work well for bigger datasets but in order to get some indights.
Question, how big network would you go for if you had :
1600 train
578 test
?
@reef bone mind if I pm you tomorrow when I'm looking at it if I have any questions?
reef bone
kaggle is a community that also has datasets, they host competitions and discussions, though i never found it to be a particularly great place to learn. i'm just mentioning it for the datasets, which they do have plenty of, just need to make an account with them
gensim is a really fun package if you have any interest in natural language processing
you mean 1600 training samples and 578 testing samples? those numbers won't give you much information about what the structure should look like
you're mainly interested in the complexity of the problem you're trying to solve, and the complexity of the data you use
you can pm me but i can't guarantee a response, i'm very busy lately (finishing a dissertation in ML 👀 )
lapis sequoia
Oh yeah my prof talked about gensim
reef bone
generally it's probably better to ask here as there're plenty people ready to answer questions
but you're welcome to slip in my dms regardless
regarding the testing samples, you might also want to look into the difference between validation and testing, and why we sometimes use different data for each. if you're doing this for an assignment then you're probably expected to validate on the testing dataset and that is ok, but for serious competitions or real life problems you might not have access to the actual testing dataset until after your model is tuned
that helps ensure you're trying to solve the actual problem and not just minmaxing the dataset in question
 golden gyro
Can I also sneak some math in this chat? Or should I go to help channels for maths questions?
reef bone
i think math is probably most welcome here 
lapis sequoia
@reef bone ywah no problem I understand.
Also cool that you are studying at that level . I thought about going for a phD a few years back in but now in my masters i need to have a change in scenery. What you doing your dissertation in?
I rly appriciate that.
My data set is split up into roughly 70% train, 30% test/validate. You suggesting you would have an additional strict validation test?
Or that you split up your data into train and test/validate because thats what we are doing :)
brb
reef bone
@golden gyro perhaps try one of the off-topic channels with general, non-ML math
@lapis sequoia i've actually been blessed with a funded phd in ML offer, and a brilliant job offer, i have about 2 more weeks to decide which route to go, and i've never felt more lost in my life
my dissertation topic is themed around NLP, i probably wouldn't feel comfortable saying more than that, sorry
lapis sequoia
@reef bone oh so you are doing you masters theisis now?
cursive sun
Hey Kwzrd, I'm a PhD too, im gonna say do the PhD
You can take contract work worth more than any job quite easily
void anvil
100% not worth doing a phd
lapis sequoia
Yesh no problem @kwzrd , I was just curious!
void anvil
you'll make way more in the 4 years than your bump by getting a phd
cursive sun
No you can earn a lot during the PhD man
void anvil
you will earn more by working a full time job than in a phd program
reef bone
the reasoning behind the validation is that when it comes to real-life problems, you often don't have the actual testing data available when you're training the network. therefore you might need to use a subset of the data available for training for validation (not train on it, only validate against it to evaluate your performance on unseen data), and determining the correct split for training / validation is a skill in and of itself - too much validation data and you might lose important training data, too little and you won't have a good idea of how your network performs on unseen data. for these reasons, many competition actually won't give you access to the training data until after you submit your network, as when you have access to the "target" you often end up tuning your parameters exactly for the purposes of this data and not the actual problem
cursive sun
I literally make a touch over $1000 a day man
You can earn respectable amounts
A full time job will be maybe 120k/yr
The industry contacts you make in a phd are extremely valuable
reef bone
i've spoken to a lot of people and going industry is 100% more profitable
that doesn't mean it's automatically the best choice
cursive sun
Its only more profitable if you dont take advantage of what you can do in a PhD
reef bone
that is perhaps true
cursive sun
Its very true, im living proof
Doing a PhD only means less money if you dont work outside your PhD as well
reef bone
i'm not terribly concerned about the finances to be honest
lapis sequoia
@kwzrd: Yup that's what we are doing - feels good that we are doing actual industy practices. That said it is applied machine Learning so.
I have to head off, thanks for giving me some indights - I appreciate it. Have a good weekend! :)
cursive sun
Yeah, im not saying you should be
Im saying that 'you earn less' is a broken argument
reef bone
@lapis sequoia no problem, feel free to come back anytime!
lapis sequoia
@reef bone oh I will, I like this place :)
reef bone
my studies so far have taken a toll on me, i feel incredibly blessed to have the opportunities i have, i've moved countries to pursue my studies so i've been living a very unstable life, moving every couple of months, not really having a home, trying to balance work and studies to pay rent but still do well in school, the everyday uncertainty is starting to get to me a little bit, so although i'm entirely aware that a fully funded phd in my preferred field is a massive opportunity, i'm also tempted to just go the easy route of having a job, being able to settle a bit and start living again
thanks for the insight regardless
cursive sun
Huh, do you need to earn money now @reef bone ?
reef bone
i've been doing surprisingly ok lately, have a part-time job i can do remotely and a scholarship to help with rent
but not financially secure enough to feel comfortable
cursive sun
Ah fair, I only ask because I usually have a lot of extra work sitting about (usually small, self contained packets of work)
If you're at all interested I'd be happy to pay for some of these to be completed. Lately it's been a lot of straightforward stuff like image analysis
reef bone
i greatly appreciate the sentiment! but i'm now mainly focusing on making sure i can deliver a good dissertation, and my part-time job is enough to get me by
its still super awesome of you to mention that
i think we might have gone a bit off topic 👀
 storm gate
If I am a freshman studying DS in college what kind of internships should I be looking at? This summer I am essentially a database grunt for postdocts doing research...
What should I have my sights on for say next summer?
lapis sequoia
fuck the postdocs..
do something in industry..
depending on your area of interest.. choose an industry
people who do research get by on math.. if you're planning to do DA or DE work you should be learning about industry.. if you plan to do ML, do projects, kaggle and solve business cases at hackathons
cursive sun
hackathons
Haha those always seem so gross
100 unshowered dudes in one room for 2 days? Nah fam
 thorn vector
i had a question about using sympy for complex numbers
i was trying to make a complex number z in which the affixes were variables
therefore z=a+bi
i know there is a fuction I in sympy
but when i use it in idle for python three it doesnt seem to work very well
also when asked for the imaginary and real part using im or re functions it doesnt give good answers
i was wondering if there was in anaconda a dedicated complex number package
or anything that would help
thanks 😃
orchid lintel
How do I set the number of xticks in Seaborn? I want the x axis to show all 24 ticks instead of skipping any
lapis sequoia
question answered in help0
ripe sundial
I have the following from softmax activation function for my classification in CNN:
[9.16161060e-01, 4.37439530e-06, 8.38107169e-02, 2.37891982e-05]
How can I translate this to percentage? I know that 9.16161060e-01 equals to 91,616% but would be nice to have the other values in percentage as well.
void anvil
e^ whatever is scientific notation for 10^ whatever
if you multiply everything by 100 it'll come out in correct
ripe sundial
I tried that, it still came out in e-XX
but I found a different way: https://stackoverflow.com/questions/29849445/convert-scientific-notation-to-decimals
Stack Overflow
I have numbers in a file (so, as strings) in scientific notation, like:
8.99284722486562e-02
but I want to convert them to:
0.08992847
Is there any built-in function or any other way to do it?
Thanks however
supple ferry
I think there should be a global setting in numpy which allows you to change such stuff
void anvil
^
ripe sundial
Aye this was from softmax output though
supple ferry
Anyone having exp with our long time friend Cython here? 😄
void anvil
unfortunately not
Switching over to numba once this set of projects is complete
Is there any way to recreate the old rolling(x) framework? EWM uses the garbage methodology of weighting the new sample as X and the previous mean of the last period as (1-x).
 neat cipher
Is Dataquest or DataCamp better?
supple ferry
@void anvil good question. Don't think there is out of box solution to that
void anvil
Yeah, I'm really pissed it was deprecated
Probably just going to roll a method myself
void anvil
and my code is memory leaking while doing shifts
ERROR:root:Internal Python error in the inspect module.
Below is the traceback from this internal error.
mossy dragon
hey guys, I've been thinking about asking some of my old econ professors if I could help out with some of their research if it involves working with large data sets. I figured this would be good experience in analyzing and just working with real life data in general, plus it would give me something to put on a resume, good idea yay or nay?
lyric canopy
Sounds like a good idea. Are you still a student at that institute? We usually have a lot of students that have a job as research assistant and what you're describing sounds almost like that. It's also a great way to network in academics, especially if the research you working on is a collaboration of researchers from different universities. If you're doing this for your personal portfolio, do discuss what you can or cannot publish on our your own on, say, your GitHub.
supple ferry
@mossy dragon idea is good. I can hardly add something to Zappa's point. Usually, academics don't like black box models for obvious reasons. Just heads up
Not only working model is important, but also well interpretable ones
mossy dragon
@lyric canopy I graduated 3 years ago but I stood out a lot and my proffessors still remember me
I was planning on getting a phd in economics so i developed a very good rapport with a couple of proffessors. I should also be a bit ahead in terms of programming ability and stats knowledge than the other people who would ask
my school doesnt offer that much stats/math classes and the econ dept didn't even offer a masters until last year.
@supple ferry thanks, I was leaning toward trying this anyways becuase at least this way I should have someone that can point out my mistakes
something thats not easy as learning data science by myself for now.
supple ferry
@mossy dragon i wore the same shoes as you did. In 2017 I had no idea about what python was, data science and etc. I was good at math though. After learning it myself I found a job as analyst first, and after a year I was offered a PhD position in economics, but with heavy accent on big data and AI. I can share with you my exp if needed
lyric canopy
Sort of, but what it actually means depends on the country. In my country, it's a paid position, usually at a university, you can apply for after completing your Master degree, but the competition is though. Many apply, but the number of places is limited. It's a requirement for an academic career here, though.
supple ferry
usually you are both enrolled at the university and also work on a project as an employee
lyric canopy
Here, you're not enrolled as a student during your phd, but you work as a phd candidate and are part of the academic staff
The exact details vary a bit, depending on where the funding comes from
The position is usually for about 4 years and you're expected to publish a couple of papers during that time
Although it's not a strict requirement for your dissertation
lapis sequoia
hmm I get it..
lyric canopy
I was reacting to what QWERTY said in the conversation.
It's interesting, because there are a lot of international differences
lapis sequoia
Im wondering if it would be ok to pursue a phd while being employed.. or maybe just another masters..
hmmmm
there is..
plenty of places.. you can't be employed because a phd would overqualify you for positions
lyric canopy
It's no guarantee for a higher pay as well. Those years you lose in commercial work experience usually matters for the companies as well. At least here, because pursuing a phd here is really a fulltime thing. You can do it while being employed for a company, but that usually means you're doing your phd-research at/for that company, they provide the funding, and you have a promotor at the university.
lapis sequoia
yeah makes sense..
people I know who stay in tech usually pursue an exec mba or masters
 pale eagle
I want to learn data analytics using python
Suggest me something online is prefered
Is data camp a good choice ??
mossy dragon
Do you have previous coding experience?
@pale eagle
I learned R and Python through Datacamp and in my experience the Python courses really jumped into it super fast, if you have no previous coding experience it might be a bit hard to keep up and I'd suggest looking elsewhere
otherwise I found datacamp pretty usefull and intuitive, as long as you work on projects by yourself at the same time, its hard to make everything stick without working on your own projects at the same time.
pale eagle
@mossy dragon yes i code in c++ for 3 years
mossy dragon
I don't think you should have any problems learning python for data science using datacamp then
although i don't know how it compares to others
pale eagle
@mossy dragon ok i will go with data camp
After that course can u suggest me some projects which will help me in getting job
mossy dragon
mate
im in the process of learning as well
only been at it a few months lol
I'm only sharing with you my experiences so far, I have no data science job.
pale eagle
@mossy dragon can we chat in personal
supple ferry
@lyric canopy , I am doing mine in France and I am enrolled as PhD student too. However, my work permit is for research employee. It depends on country of course
France has a bit different organisation in these terms
lyric canopy
Yeah, it's really interesting to hear about all those differences. We have a very international student population here and it's always interesting to discuss the differences.
mossy dragon
No sorry its late here an I'm trying to get some work done before I go home
Ves you are european?
America's international student population is tanking I think
thanks to the trump administration
pale eagle
@mossy dragon no i am an indian
lyric canopy
Yes, I live in the Netherlands.
mossy dragon
Lol, I've played video games with someone from friesland for the last 10 years
you people are pretty cool.
supple ferry
İ think it is almost the same in Germany whee I did my masters. But in Germany funding finding (haha) is harsh
anyone used Numba here?? some exp?
question is, can I make it work and compile sklearn classes?
 placid galleon
Tesseract not crying at grayscale, how would I achieve this? 😐 I really need to remove that background for a number recogniser to work 100% efficiently 😫
void anvil
Yes you can qwerty
void anvil
but it's probably faster to pipe to tenserflow or keras
 lament imp
I want to sum up a nested list in the following way: I want [[ 1,4,3 ], [ 9,6,2 ]] to give [ 20, 15 ] , which is 1+4+9+6 and 4+3+6+2
I want to use map, reduce or some other functional method because I want to run it on spark.
However, with map I struggle to take into account multiple elements at a time, and with reduce I tried the following:
reduce(lambda x,y: x[0]+y[0]+x[1]+y[1], [[1,4,3],[9,6,2]])
but this collapses the result into a single number after the first iteration, and so there is no access to the middle elements in the second iteration.
I feel I must take a different approach or a different function, could anyone please give me a hint?
 silk acorn
is it always 2 sets of 3?
lament imp
no it should scale
silk acorn
what should it do if it's 4 elements
lament imp
function( [[ 1,4,3,7 ], [ 9,6,2,8 ]] ) = [ 1+4+9+6, 4+3+6+2, 3+7+2+8] = [20,15,20]
so it is always 2 sets of n elements
silk acorn
https://more-itertools.readthedocs.io/en/latest/api.html#windowing
This would be a great function for this
lament imp
that looks promising, but would it work on a spark dataframe?
silk acorn
it works on iterables
 midnight oracle
Traceback (most recent call last):
  File "C:\Users\Omer Kural\Desktop\Times Data Project\base.py", line 13, in <module>
    df['female'] = df['female.male.ratio'].apply(lambda x: x.split(':')[1])
  File "C:\Users\Omer Kural\AppData\Local\Programs\Python\Python36\lib\site-packages\pandas\core\series.py", line 3194, in apply
    mapped = lib.map_infer(values, f, convert=convert_dtype)
  File "pandas/_libs/src\inference.pyx", line 1472, in pandas._libs.lib.map_infer
  File "C:\Users\Omer Kural\Desktop\Times Data Project\base.py", line 13, in <lambda>
    df['female'] = df['female.male.ratio'].apply(lambda x: x.split(':')[1])
IndexError: list index out of range```
this is the error im getting on this code:
```py
import pandas as pd
df = pd.read_csv('timesData.csv')
df.dropna(inplace=True)
for cl in list(df.columns):
    df.rename(columns={cl:cl.replace('_', '.')}, inplace=True)
df['female'] = df['female.male.ratio'].apply(lambda x: x.split(':')[1])
df['male'] = df['female.male.ratio'].apply(lambda x: x.split(':')[0])```when i do it without the indexes it seems to work just fine
lament imp
in my (limited) understanding, you would have to collect() the numbers from a spark dataframe to construct the iterables, which I hope to avoid.
anyway, I'll try to make it work with the windowing and that might give me new ideas. thanks for the suggestion!
 abstract reef
Hello,
I want to replace the "Left" string from the 'PropertyName' column with another string and so far I managed to do that but the approach seems a little forced:
df_poly['PropertyName'] = df['PropertyName'].str.replace('Left', 'FlipHorizontal')
What if it wasn't left and it was another string?
The problem though, lies in the 'PropertyValue' column. I can't seem to figure out how to replace ANY numeric value with a certain string.
Table in question
supple ferry
is there any rule in replacing? or you just replace 3 with string "3"
?
@midnight oracle , what you mean when say without indexes?
old_cols = df.columns
new_cols = [x.replace("_", ".") for x in old_cols]

df.columns = new_cols
this will change col names if both lists have the same length
you dont need a for loop for that
 desert cradle
@abstract reef wdat do you mean by some other string? if you only want to use exact matches, use .replace instead of .str.replace
and what exactly do you want to do with PropertyValue?
abstract reef
I will be a little more specific. I want to replace 504 and 784 with a string( e.g. "TRUE")
I figured it out tho, but would love to see your approach
supple ferry
you can make a function and use apply:
df.new_col = df.old_col.apply(lambda x: True if x in [504, 784] else False)
@abstract reef
midnight oracle
@supple ferry I mean without the [0] and [1]
Thanks for the tip too
I figured it out somehow
supple ferry
@midnight oracle , other way can be to use converters parameter when reading your csv file and use dictionary to seperate these two values,
midnight oracle
turns out there are some nulls in there
like '-'
what do you mean by converters?
supple ferry
it is a rule of thumb to df.isnull().sum()
when you read your csv file with pd.read_csv() there is a parameter called converters it is for advanced use though
midnight oracle
oh ok
I solved my problem by df = df[df.female_male_ratio != '-'] but this only removes the rows in female_male_ratio column. is there a way to remove them all in one line? or do i have to hard code it one by one
supple ferry
can you paste the first 3 rows of the data?