#data-science-and-ml
1 messages · Page 178 of 1
 solemn frigate
 opaque condor
It can images be created by a transform or is that just for language and I need a separate transform to do the task
Of image generation
 twilit prism
I'm trying to wrap my head around pytorch, tensorflow, and how the concepts like training the embeddings, how attention applies to the overall implementation used to assess input, and all of the granular steps in order to understand how each type of parameters affect the model etc.
I'll call that set of concerns, A-principles.
Then wrap my head around how tensforflow and pytorch as libraries handle computations efficiently using the gpu etc.
I'll call this set of concerns B-concepts.
Then wrap my head around how A-principles can be done similarly to what they acheive in the overall implementation of the models and how they execute, except applied in a different way, and then see about using pytorch/tensorflow for lifting to GPU land.
Is there anyone here who's that familiar with LLMs/standard transformer concepts that could validate my understandings so I don't misunderstand or get mislead by chatgpt explaining the gist of things but not going into fine detail?
Either that, or i'm too smoothbrained for this lol
 lime grove
I mean, you could implement a transformer from scratch, on PyTorch, and then inspect the code
But I think that you won't be able to get this granular with the B-principles without looking at the underlying C
I feel that PyTorch does a fine job of representing the math involved in NNs with the right abstractions. You might even be able to look at the pertinent formulism, as found in a book, and connect it somewhat easily to the implementation
twilit prism
lime grove
I feel that PyTorch does a fine job of representing the math involved in NNs wit...
Yeah, figured that, for both points
lime grove
but, for the B-concepts, my thinking goes along the lines of "here is a matrix diagonalization, so I need to see how this is invoking LAPACK in the backend". How that is handled by a GPU is left as an exercise to the reader (you)
twilit prism
is matrix diagonalization the part were you have...
tokens: [Q1,Q2,Q3,Q4,....]
attention
[K1, -> _]
[Q2,Q3,Q4...],
[K2, -> _]
[Q2,Q3,Q4...],
[K3, -> _]
[Q2,Q3,Q4...]

Like
_ = previously computed
[K1, ...]
[_, K2, ...]
[_, _, K3, ...]
[_, _, _, K4, ...]
Or
starting V token list of 50K [...]
[{50K elements}, top-K->V as nth element beyond 50k]

That causes the stair case concerns of the context window losing initial tokens, and gaining next ones
Let me know if i'm way off
of just dot product -> summing [Vn, Vn+1], and re-norming or something
lime grove
I couldn't say.
twilit prism
ah mkay all good
lime grove
I was simply providing a sort of study plan
is why I suggested implementing a toy transformer as a pedagogical exercise.
twilit prism
lime grove
is why I suggested implementing a toy transformer as a pedagogical exercise.
yeah, i'm tackling that rn
lime grove
plus, I am busy implementing RAGs as practice
twilit prism
❤️ that's a fun concept
lime grove
I am deep in the sauce rn
I have 2 things going on: causal machine learning, and large language models.
 dim gyro
I would like learn bsc applied artificial intelligence.is that good in current market
 serene scaffold
dim gyro
I would like learn bsc applied artificial intelligence.is that good in current m...
serene scaffold
dim gyro
I would like learn bsc applied artificial intelligence.is that good in current m...
from what university?
dim gyro
Germany
serene scaffold
dim gyro
Germany
hmm? I asked which university, not which country
 plush shuttle
dim gyro
plush shuttle
dim gyro
Oke sry
 short imp
sensei, how is everything going? @serene scaffold
 lofty tendon
Hey guys,
My name is sangeet, and i am curious about Machine learning........... so i have a question (Think of me as your junior), i just wanted to know that is it mandatory to learn ML at intermediate level to get a job ? i also even heard that companies ask for experience regarding this field, so in that case how can i have a job ?
serene scaffold
lofty tendon
Hey guys,
My name is sangeet, and i am curious about Machine learning..............
There aren't well defined boundaries between beginner, advanced, and intermediate.
Jobs in ML usually require a masters degree that's related to ML.
 boreal nebula
hello did you guys learn scikit from tutorial or from the website documentation itself?
lofty tendon
serene scaffold
There aren't well defined boundaries between beginner, advanced, and intermediat...
If its requires master degree then what's the point of learning it who don't have masters....
serene scaffold
lofty tendon
If its requires master degree then what's the point of learning it who don't hav...
For your personal satisfaction. It's always a great thing to learn about things that interest you
lofty tendon
That's a good point, but i wanted to know is it possible to get job as a fresher?
I think you have experience in this domain more than me, so i am just curious
serene scaffold
lofty tendon
That's a good point, but i wanted to know is it possible to get job as a fresher...
If you don't have relevant academic credentials, probably not
lofty tendon
serene scaffold
If you don't have relevant academic credentials, probably not
Okayy... Will keep it in mind
serene scaffold
You can always apply and see what kind of response you get.
lofty tendon
serene scaffold
You can always apply and see what kind of response you get.
Definitely, trying is always better than not trying.
Btw what you do now?
Are you doing job or freelancing? Or startup?
serene scaffold
lofty tendon
Btw what you do now?
I work for a non-profit in Washington DC that does research for the federal government
lofty tendon
serene scaffold
I work for a non-profit in Washington DC that does research for the federal gove...
Sounds Interesting... I would like to know more, if you don't mind.
 hybrid shore
Hello
 wheat snow
hey, i'd like to ask the chillers here if anyone is willing to help out in #1455278681516806144, it was too big of a post to slot it in here
reinforcement learning
 hardy wren
Currently I am working on research-based project , " Physics-Informed Explainable ML for Early Cavitation Risk Prediction in Marine Centrifugal Pumps"
https://github.com/OWL60/marine-pump-cavitation-ml
I'm looking for feedback, ideas and collaborators. 😛

GitHub
Physics-Informed Explainable ML for Early Cavitation Risk Prediction in Marine Centrifugal Pumps - OWL60/marine-pump-cavitation-ml
 unkempt apex
hardy wren
Currently I am working on research-based project , " Physics-Informed Explainabl...
unkempt apex
hardy wren
Currently I am working on research-based project , " Physics-Informed Explainabl...
which type of physics is this? particularly
hardy wren
unkempt apex
which type of physics is this? particularly
This project applies applied physics, specifically vibration, mechanics and fluid dynamics.
It's focused on how physical phenomena like cavitation in marine pumps generate measurable vibration signal.
Which then are analysed by using ML.
 wooden sail
hardy wren
Currently I am working on research-based project , " Physics-Informed Explainabl...
wooden sail
hardy wren
Currently I am working on research-based project , " Physics-Informed Explainabl...
i'm curious which definition of "physics-informed" you're using here
hardy wren
"The physics informed" refers to how you embed physical principle of cavitation and vibration behavior into the data generation.
wooden sail
yes, so i'm asking for more details about that 😛
because ~6 years ago, physics-informed meant something as simple as e.g. using convolutional layers when you expect spatial invariance, whereas some 3 years ago it meant your cost function included using automatic differentiation to apply the differential operator of your problem to a neural network so that the network would satisfy the governing eqs
these are only 2 examples of very different things that people call "physics-informed", so i was curious what you actually mean
whenever you point to a gap in the research and propose a solution that involves some sort of well established terminology, you usually back it up with clear definitions and references. that'd be my feedback, since your readme does not make it clear what you're doing and i'm also not gonna sift through your code to figure out what you mean
unkempt apex
wooden sail
because ~6 years ago, physics-informed meant something as simple as e.g. using c...
fuild dynamicos is great example of physics informed
 vale field
Quick question, basically if my dataset is skewed and I'm supposed to be training classifiers e.g. Random Forrest etc, is it important to get rid of it? What happens if I don't?
serene scaffold
vale field
Quick question, basically if my dataset is skewed and I'm supposed to be trainin...
get rid of what? do you mean that you want to get rid of samples in such a way that all classes have as many samples as the least frequent class?
you can try that, but make sure that the test dataset matches the true distribution. otherwise you're making the problem it's trying to solve easier than it really is.
 warm lily
Okay so humor me all on career advice I wasn't really looking for a new job this year, I did a few DeepLearning.ai certs and updated my LinkedIn with those and some more details from a prior work project. Are companies really this strapped for AI RAG engineers? You know I wasn't exactly expecting to get head hunted for a Microsoft gig right away and be received as semi-knowledgeable, is a little more training with math and some repos the ticket here? (I have about 9 years SWE exp in C# FYI)
 spring tartan
Hey guys I'm new to python and have no idea on what to do. Can someone kindly help me?
plush shuttle

GitHub
Contribute to Ansh-droid-glitch/GPTArm development by creating an account on GitHub.
or
GitHub
GPTArm. Contribute to Intuex/GPTArm development by creating an account on GitHub.
 frigid niche
Hey everyone! I promise this question is on topic for AI. Have any of you heard of Mafia / Werewolf / Town of Salem type of social deduction games?
 fair solar
frigid niche
Hey everyone! I promise this question is on topic for AI. Have any of you heard ...
fair solar
frigid niche
Hey everyone! I promise this question is on topic for AI. Have any of you heard ...
yep
frigid niche
I have made a simulation of Mafia where a group of LLMs play against each other, make strategies, accuse each other, vote, whole nine yards!
It's really interesting, I never thought it would be possible to simulate a social deduction game
fair solar
frigid niche
I have made a simulation of Mafia where a group of LLMs play against each other,...
i've seen a yt channel do it and it was very dumb in practice iirc
frigid niche
fair solar
i've seen a yt channel do it and it was very dumb in practice iirc
They aren't terrible at the game, but it is definitely a little silly sometimes
fair solar
the one i saw was very terrible ngl, channel name was turing games
frigid niche

The 10 smartest AIs in the world play a game of Mafia. You will not be able to predict how this ends.
Livestream this Saturday: https://www.twitch.tv/turing_games
fair solar
ye
frigid niche
I didn't think they did terrible, except GPT 4o who is dumb as a sack of rocks
Here's the most recent log from my sim, I noticed a few inconsistencies and changed the prompting a lil bit since this though
 arctic wedgeBOT
frigid niche
Here's the most recent log from my sim, I noticed a few inconsistencies and chan...
arctic wedgeBOT
frigid niche
Here's the most recent log from my sim, I noticed a few inconsistencies and chan...
Click here to see this code in our pastebin.
 main tide
https://huggingface.co/datasets/webxos/ionicocean/blob/main/README.md
THIS DATASET WAS CREATED USING IONICSPHERE Ionic Ocean Simulator a state-of-the-art neural network model trainer, trains synthetic data sets generated from ionic ocean simulations. The model predicts ionic stability and simulated quantum state transitions in ionic environments. Trapped-ion quantum simulators, typically involve physical hardware for tasks like entanglement measurement or Hamiltonian engineering. This dataset is desgined as a fully synthetic browser-based alternative for developers without lab access. FREE to use. LINK: webxos.netlify.app/IONICSPHERE

 rich moth
frigid niche
Was it dis vidya?
https://www.youtube.com/watch?v=JhBtg-lyKdo&t=143s&pp=ygUOYWkg...
rich moth
frigid niche
Was it dis vidya?
https://www.youtube.com/watch?v=JhBtg-lyKdo&t=143s&pp=ygUOYWkg...
It looks very insulting to the mafia community
😂
 coarse pond
Is there a library in Python that can draw any kind of Dashboard? I thought matplotlib but i am sure there are better out there?
rich moth
I can reimagine it in a environment like https://github.com/codenamecpp/carnage3d

GitHub
Reimplementation of Grand Theft Auto 1 [GTA1]. Contribute to codenamecpp/carnage3d development by creating an account on GitHub.
rich moth
coarse pond
Is there a library in Python that can draw any kind of Dashboard? I thought matp...
Panel is pretty good
lime grove
main tide
https://huggingface.co/datasets/webxos/ionicocean/blob/main/README.md
THIS DATA...
WTH is this for? What is an Ionic Ocean Simulator even for?
 glacial root
hey, i just tried setting up a neural network and it seems i've messed up pretty badly. i'm not exactly sure what i did wrong with the gradients, is anyone able to take a look and guide me in fixing it? Thank you
Here is my code
import numpy as np
import pandas as pd
from ucimlrepo import fetch_ucirepo

energy_pred = fetch_ucirepo(id = 374)

X_df = energy_pred.data.features
y_df = energy_pred.data.targets

X = X_df.iloc[:10000, 1:].to_numpy()
y = y_df.iloc[:10000, :].to_numpy()

input_layer_w = np.random.normal(0, np.sqrt(2 / 8), size = (12, 27))
input_layer_b = np.random.normal(0, np.sqrt(2 / 8), size = (12, 1))

hidden_layer_w = np.random.normal(0, np.sqrt(2 / 12), size = (1, 12))
hidden_layer_b = np.random.normal(0, np.sqrt(2 / 12), size = (1, 1))

hidden_layer_x = input_layer_w @ X.T + input_layer_b
hidden_layer_x[hidden_layer_x < 0] = 0
output_layer_x = hidden_layer_w @ hidden_layer_x + hidden_layer_b

loss = np.sum((output_layer_x - y.T)**2)
learning_rate = 0.1
while loss > 100:
    if loss < 1000:
        learning_rate = 0.01
    else:
        learning_rate = 0.1

    hidden_layer_delta = (output_layer_x - y.T)
    hidden_layer_w_gradient = hidden_layer_delta @ hidden_layer_x.T
    hidden_layer_b_gradient = np.sum(hidden_layer_delta)

    input_layer_delta = hidden_layer_w.T @ hidden_layer_delta
    input_layer_delta[hidden_layer_x < 0] = 0
    input_layer_w_gradient = input_layer_delta @ X
    input_layer_b_gradient = input_layer_delta @ np.ones((10000, 1))

    input_layer_w -= (learning_rate * input_layer_w_gradient / 10000)
    input_layer_b -= (learning_rate * input_layer_b_gradient / 10000)
    hidden_layer_w -= (learning_rate * hidden_layer_w_gradient / 10000)
    hidden_layer_b -= (learning_rate * hidden_layer_b_gradient / 10000)

    hidden_layer_x = input_layer_w @ X.T + input_layer_b
    hidden_layer_x[hidden_layer_x < 0] = 0
    output_layer_x = hidden_layer_w @ hidden_layer_x + hidden_layer_b

    loss = np.sum((output_layer_x - y)**2)
    print(loss)
the total squared loss is increasing for some reason
 wooden sail
glacial root
hey, i just tried setting up a neural network and it seems i've messed up pretty...
wooden sail
glacial root
hey, i just tried setting up a neural network and it seems i've messed up pretty...
your learning rate is probably too large, try smaller values. you can also double-check your math if that doesn't work, but step size is usually the culprit when your gradient blows up
i'd expect the step size to have to be smaller than the largest norm squared of your X feature examples
glacial root
wooden sail
your learning rate is probably too large, try smaller values. you can also doubl...
oh okay i'll try that and then recheck the gradient formulas if that doesn't work
thank you
wooden sail
advertising and money transactions are not allowed in this server
 hollow agate
lime grove
hollow agate
lime grove
hey, streamlit is kinda cool!
warm lily
Whoaz I had a realization on the possibilities of homographic encryption and training llms. Some literature exists. https://arxiv.org/abs/2410.02486

arXiv.org
Large language models (LLMs) offer personalized responses based on user interactions, but this use case raises serious privacy concerns. Homomorphic encryption (HE) is a cryptographic protocol supporting arithmetic computations in encrypted states and provides a potential solution for privacy-preserving machine learning (PPML). However, the comp...
lime grove
I stuffed Moby Dick into Smollm2:360m, so now I am learning all about that book. Of course, the answers are slightly off (comparing the LLM w/ SparkNotes), but still fun
(running locally, on a 4 year old laptop that has an RTX-3070 w/ 8GB VRAM
 grand minnow
solemn frigate
Any one help me to learn data science together
grand minnow
solemn frigate
Any one help me to learn data science together
Try here: https://cs50.harvard.edu/ai/
This course explores the concepts and algorithms at the foundation of modern artificial intelligence, diving into the ideas that give rise to technologies...
solemn frigate
grand minnow
Try here: https://cs50.harvard.edu/ai/
But this is for AI
grand minnow
solemn frigate
But this is for AI
You're right. Have you tried Kaggle? https://kaggle.com/learn

Practical data skills you can apply immediately: that's what you'll learn in these no-cost courses. They're the fastest (and most fun) way to become a data scientist or improve your current skills.
solemn frigate
I'm finding a data science buddy .
arctic wedgeBOT
Please react with ✅ to upload your file(s) to our paste bin, which is more accessible for some users.
main tide
came up with an idea last night to see how I could convert some of my HTML based FPS games into datasets generators, for BCI study. This is the conceptual first dataset I made with a custom game I made just to to test the idea. Seems to work. Would love some feedback considering how complicated BCI is and im by no means trained in this. https://huggingface.co/datasets/webxos/BCI-FPS
 opaque condor
Is it possible to train and transfer data between transforms
lime grove
does anyone know of a website that gives a good sense of how to optimize LLM runtimes?
glacial root
wooden sail
i'd expect the step size to have to be smaller than the largest norm squared of ...
hey, i left the model to train overnight, and it seems like the mean squared error is converging to around 119221617
is this likely because i did something wrong, or is it because the model is too simple to capture greater accuracy?
nevermind, it reached a trough of around 119128499 and then it started increasing for some reason
but yeah 119128499 was the lowest it reached
wheat snow
Small question, i am currently asked to evaluate and test my monte carlo rl agent (some gridworld task)
I am using linear epsilon decay aswell as a decaying learning rate.
When computong the öearning curves for low alpha (0,01) and decaying epsilon, the graph took 13min
I am now sitting at 13 mins for high alpha of 0.942 and only 8 repliactions of 28 are done...
I thought high alpha was the fast learning method?
Or is it because i become sguck in local maxima and the agent just keeps maxing out the step count before getting resettet becauae he can not even find the goal?
i have old graphs laying arround: low alpha: (shaded is standard variation

and alpha= 0.942

also one thing that is odd, the given maze class resets the agent after 500 steps, each step=-1 (+ absorbign states that can grant -50 max) i do not get how e.g. first picture variance is beyond -550
vale field
Hey guys quick question, for dealing with imbalanced datasets, is there an ideal class ratio I should be aiming for?
serene scaffold
vale field
Hey guys quick question, for dealing with imbalanced datasets, is there an ideal...
You should try training on the actual distribution and see what happens.
And no matter what you do, don't change the distribution of the test data. The test data needs to represent the actual problem space.
vale field
serene scaffold
You should try training on the actual distribution and see what happens.
Ok so would it be ok to try both undersampling and oversampling after i train on the actual distribution?
serene scaffold
vale field
Ok so would it be ok to try both undersampling and oversampling after i train on...
If training on the actual distribution results in bad performance, you can try other distributions, as long as the test set is the true distribution.
vale field
serene scaffold
If training on the actual distribution results in bad performance, you can try o...
alr
opaque condor
Should I hook a full model transform to the internet?
opaque condor
Also happy new years
 jaunty helm
vale field
Ok so would it be ok to try both undersampling and oversampling after i train on...
jaunty helm
vale field
Ok so would it be ok to try both undersampling and oversampling after i train on...
ngl, I still haven't encountered a dataset where any sort of oversampling helped it perform better
undersampling can sometimes cut training time without much loss of performance though
 outer cloak
Happy new year 🎊
 hollow coral
Has anyone read the 100 pages machine learning book
I wanna start it but would like someone's company while going through it

 ashen ridge
Hello Im starting my first project today
After mocking people who do the cliche projects, im starting with spaceship titanic project in kaggle🙂🤌🏻🤌🏻 It involves machine learning, which im not very familiar with but i have done the basics from andrew ngs course, if u know about it
Any opinions.?
Should i do it in kaggle?
Is kaggle worth it , today?
grand minnow
 rare scaffold
Can anyone help me with this error?
rare scaffold
Can anyone help me with this error?
Your filename does not match as with the code.
grand minnow
ashen ridge
Should i do it in kaggle?
Do it in Kaggle.
 red slate
I'm working on a project that uses qwen 2.5 and llama 3.2 as AI models, I am actually using Ollama to interact with them. Is there a better package to work with those AI models that is faster than ollama?
unkempt apex
red slate
I'm working on a project that uses qwen 2.5 and llama 3.2 as AI models, I am act...
try localAI, otherwise you can directly pull from HF and use that template code to run
 mossy pond
red slate
I'm working on a project that uses qwen 2.5 and llama 3.2 as AI models, I am act...
mossy pond
red slate
I'm working on a project that uses qwen 2.5 and llama 3.2 as AI models, I am act...
ollama is fine or use lm-studio ... but you can also install a local prewheel llama.cpp and code in python 20 lines 😉
who is interested in a multi database ... i have the base ... and working so long
maybe it is not quite now a good pipeline, i am not a trained programmer (but the first results are promising) - all python.
ok, in short words ... you can chose any embedder as gguf, create a database if not already existent (every embedder its own) ... now you can emebdd txt files with each chunk length you want even same file with different length ... thats one python file (with a small gui) ... the next without gui, you chose an embedder, the matching database is load and for you query the top 100 or 50 are found ... now 3 tuning steps can be made ... 1 simple cosine similarity, 2 rerank by cross encoder model, or 3 use a ~4b instruct model - set to max 10 token and instruct answer the query for each chunk with "yes" or "no" or "at most" ... and score it, need ~30sec for 50chunks ...
after all top 10 chunks are selected and then searched for among the remaining 90 chunks that overlap and merged together. Finally, the model can now generate the answer to your query.
only to complete: to build up a graph based database i think its oversized and need extreme long time you need to analyse every chunk you have in the whole database.
Let me hear your thoughts 😉
rich moth
I built a KAN from the ground up I was gonna turn it to some type of risk engine for trading. Thought I'd share the results or the code if anyone wants to play with it. I actually used my RAG to research and build the test code and the foundation for it. While it wasnt perfect it was a great start.


 rich moth
I made a active inference dashboard to watch it build a mental model of bitcoins volatility in real time. Im gonna let it run for a bit and analyze its formulas.
 lime grove
rich moth
I made a active inference dashboard to watch it build a mental model of bitcoins...
lime grove
rich moth
I made a active inference dashboard to watch it build a mental model of bitcoins...
how are you defining volatility? or is this about visual inspection?
I recently built a RAG that reads PDFs, and then lets you ask questions about it. Small LLMs are atrocious, like Smolm2:1.5b, but they all seem to take too long self-hosting
Like, I had to get a copy of "Moby Dick" because DeepSeek wouldn't let me use newer books - they have copyright guardrails in there
this is using langchain toolsets
rich moth
lime grove
how are you defining volatility? or is this about visual inspection?
Its defined as a 10 period rolling standard deviation of logarithmic returns and scaled by 1000. But thats really funny that model is blocking it considering should be in the public domain. Ive had some success with qwen 2.5 code 14b even for non coding task, but im starting to see the limitations of its size.
Ive been reading about MoE models recently maybe thats something you should look into
lime grove
MoE in a self-hosting scenario
that volatility sounds straightforward enough. Could you then take that function, the volatility metric, fit a certain amount of history to a suitable polynomial, and then see if it has some sort of a predictive value/
usual bias/variance arguments apply here, ofc
simple polynomial fitting is lightening quick, the results are interpretable, and you can even code up a rolling estimator trainer in a loop.
I've had some success with those forecasting load profiles in electricity utility grids
on a related note: improved my car price prediction task in a standard Kaggle problem by 2% by switching from a DecisionTreeRegressor to a GradientBoostingRegressor. So that's nice 😉
lime grove
rich moth
I built a KAN from the ground up I was gonna turn it to some type of risk engine...
Kolmogorov Action Networks? niiiiiiiice
lime grove
rich moth
Ive been reading about MoE models recently maybe thats something you should look...
I think that part of the problem is that Moby Dick is a sizeable book, it's too long. I am going to see if the small LLMs are better at handling short documents. Still exploring the problem
rich moth
lime grove
that volatility sounds straightforward enough. Could you then take that function...
you might have to get aggressive with the chunking for you RAG. Im thinking that smolm2 model might be too tiny. but for the KAN that prettty much the logic for the "dream" cycle for the polynomial fitting. but instead of just a fixed degree poly, the KAN finds the best spline function to fit that recent volatility history. then saves it as a reusable formula.
lime grove
here's a question: is there a smooth curvature requirement in B-Splines?
rich moth
lime grove
here's a question: is there a smooth curvature requirement in B-Splines?
it depends on the degree you pick, but im using degree 3 (cubic) which it enforces C2 continuity, its basically keeps the curvature smooth so the model doesnt overfit to every jagged price jump.
lime grove
The reason I asked was because enforced continuity at that degree can introduce artifacts
Monotonicity lacks that problem, but I'm not sure how you'd change the KAN formulation. Nor if this is actually a concern
rich moth
lime grove
The reason I asked was because enforced continuity at that degree can introduce ...
ya, but since im filtering for low loss if the curve gets too weird form artifacts it just gets rejects as noise anyways
lime grove
You throw out overfits?
rich moth
lime grove
You throw out overfits?
ya if its underfits or overfits it gets trashed during the dream cycle. I have a loss threshold which it needs to meet
lime grove
Ok
That's a hyperparameter
My reasoning re. ignoring curvature discontinuitues when adopting something like PCHIP was that these aren't smooth functions. It's discrete values that are assumed to be causally connected to each other, thusly motivating the use of an interpolator. The discontinuity is always there because that's just data
The benefit being that you don't get the artifacts, and you don't need any more dials
rich moth
thats a really good point but for my method it think it has more advantages for pattern discovery
but ya its one less dial to tune, but maybe i can maybe i can harness both
lime grove
Yeah, I'm not suggesting do something else. Time series are very experimental
rich moth
 rich moth
lime grove
Yeah, I'm not suggesting do something else. Time series are very experimental
rich moth
lime grove
Yeah, I'm not suggesting do something else. Time series are very experimental
no these are good suggestions and points. thanks for taking a look
vale field
jaunty helm
ngl, I still haven't encountered a dataset where any sort of oversampling helped...
If you mean values in the minority class would be exact duplicates by using random oversampling and there are better ways of solving the imbalanced dataset then I agree. There are other techniques that I can use for sure. But if we have extermely imbalanced dataset we do need some way to ensure that any model trained does not favour the majority class if we are talking about class ratio e.g. 90%-10% etc. I dont see anything bad with SMOTE other than risk of overfitting.
main tide
main tide
came up with an idea last night to see how I could convert some of my HTML based...
more info about this BCI Intent study: ### Key Uses of the BCI-FPS Dataset for BCI Intent Testing
https://huggingface.co/datasets/webxos/BCI-FPS
Research suggests the BCI-FPS dataset offers a scalable way to simulate and test intent recognition in brain-computer interfaces, though its synthetic nature may limit direct applicability to real-world biological variability.
- It seems likely that the dataset can train ML models for decoding motor imagery-based intentions, such as imagined movements in virtual environments, addressing data scarcity in BCI development.
- Evidence leans toward using it for augmenting real EEG datasets, enhancing model robustness through synthetic variations that mimic noisy or diverse neural signals.
- The dataset may support algorithm testing and calibration, allowing developers to validate intent recognition pipelines in controlled, high-frequency scenarios before human trials.
- It appears promising for assistive tech prototyping, like prosthetic control, by simulating intent contexts from gameplay interactions, though real-world validation is essential.
 vale field
I've been trying to train models on multiple datasets. I have quite a few datasets and I also have few models I want to train per dataset to see their performance etc for each so I didn't want to write functions to train each model for each dataset. I made a shared training function but i just realised that the hyperparameters for each model would differ for each dataset e.g. knn would have different value of k. Is there any way people approach this problem? I really tried to solve it myself and i tried to find solutions online but I haven't found anything relevant yet.
The only way I can think of is by making seperate functions one for each dataset that trains model like KNN to get the best value for k. This was something i was trying to avoid tho because i would end up with too many functions. Would appreciate advise plz.
mossy pond
lime grove
I think that part of the problem is that Moby Dick is a sizeable book, it's too ...
what is your goal with RAG?
jaunty helm
vale field
If you mean values in the minority class would be exact duplicates by using ran...
ensure that any model trained does not favour the majority class
SMOTE
yes, what I mean is you solve the issue of favoring majority throughclass/sample_weight, or say focal loss for nn
when I try SMOTE almost certainly the only thing it does is introduce more bias and makes stuff worse
SMOTE adds 0 new information as it just spawns more minority classes through linear interpolation between existing ones
jaunty helm
vale field
I've been trying to train models on multiple datasets. I have quite a few datase...
yes, hyperparam tuning libraries like optuna, hyperopt, flaml should all have an easy interface for you to specify multiple models, each with their specific parameters to search through
 woven prairie
Has anyone made a chatbot which gives a voice reply
And in Ui you hear audio and see text synchronously
plush shuttle
guys im new to building ai's
 quasi echo
Hie could you guys suggest me some data science courses ( udemy Or coursera mybe 🙂 that you think are really good ?
wheat snow
can someone explain me why in Q learning a decaying epsilon is a bad choice. i was VERY surprised when seeing this: all this was done with alpha =0.4

this graph is e=0.1
and teh one im gonna sent in is with decaying epsilon ove rteh episode count, i only averaged across 3 runs to just experiment a bit
lime grove
mossy pond
what is your goal with RAG?
Familiarity with the stack right now
mossy pond
for me after top 100 with embedding model found ... run a step with an reranker model (bit slow ) but good results
opaque condor
For AI how do I implement rules so it can learn to walk or generate text to a specific degree
serene scaffold
opaque condor
For AI how do I implement rules so it can learn to walk or generate text to a sp...
walking and generating text are fundamentally different. which do you want to do?
opaque condor
Walking
I want to teach the anti to walk so I can have a robotic farm hand but the basics I need to teach
serene scaffold
opaque condor
I want to teach the anti to walk so I can have a robotic farm hand but the basic...
do you have the means to build a robot?
opaque condor
Yes I have a 3D printer and I could salvage some parts from a scrap yard if it requires metal in some areas the motors I would have to find specifically for that robot but it's possible
I'm what rules should add
lime grove
general question about k-folds cross validation: is there an off-the shelf module of some sort that allows one to determine the value of K? In other words, a statistically sound method that depends on some quality of the data set itself, such as n_samples
I understand that the way to do this is via bias-variance balance, but I am not sure how you would get that knowledge without also running the whole thing.
Usually, the advice is to set K=5 or K=10. But there is nothing that I can find that states how to connect a particular K to something inherent to the dataset
 iron basalt
opaque condor
Walking
iron basalt
opaque condor
Walking

AI Teaches Itself to Walk!
In this video an AI Warehouse agent named Albert learns how to walk to escape 5 rooms I created. The AI was trained using Deep Reinforcement Learning, a method of Machine Learning which involves rewarding the agent for doing something correctly, and punishing it for doing anything incorrectly. Albert's actions are con...

In machine learning and optimal control, reinforcement learning (RL) is concerned with how an intelligent agent should take actions in a dynamic environment in order to maximize a reward signal. Reinforcement learning is one of the three basic machine learning paradigms, alongside supervised learning and unsupervised learning.
While supervised l...

Optimal control theory is a branch of control theory that deals with finding a control for a dynamical system over a period of time such that an objective function is optimized. It has numerous applications in science, engineering and operations research. For example, the dynamical system might be a spacecraft with controls corresponding to rock...
In this general direction.
If you don't want to use machine learning at all, use classical control theory. Get a book on control theory.
iron basalt
iron basalt
https://www.youtube.com/watch?v=L_4BPjLBF4E
(This is a video game, much easier than IRL, this is a hard problem (I recommend not walking, but using wheels instead))
opaque condor
If I make a "real world"
I could save many headaches by building a robot and having the AI destroy its shell
By simulating reality the ai learns to work with a real world format
iron basalt
opaque condor
By simulating reality the ai learns to work with a real world format
Yes, but note it does not transfer well to reality. This is non-obvious and would make for an interesting research topic.
Unsolved problem.
But it can be used to improve your RL method before taking the dive into having something working IRL.
 lime grove
here's another lol

 solemn whale
twilit prism
rich moth
solemn whale
twilit prism
rich moth
bruh, i had it doing crazy stuff like that in april except not data science exactly. it was doing stuff with phi and golden ratio then imaginary numbers and exploring stuff like perpendicular time computations. LOL. (thing was hallucinating like crazy)
twilit prism
wheat snow
can someone explain me why in Q learning a decaying epsilon is a bad choice. i w...
how's yours setup? I typically just split up the concerns and make it do hierarchical/topologically scoped Q-learning lookup tables.
lime grove
so, I am working on a Jupyter Notebook, and I have some internal hyperlinks, which I've set up in the following manner
5.2.1 [Hyperparameter Tuning](5_2_1_hyperparameter_tuning)
Which points to
<a id="5_2_1_hyperparameter_tuning"></a>
#### 5.2.1 Hyperparameter Tuning
This should work, but it doesn't, because the actual URL I see, if I hover it on the first link looks like this
http://localhost:8888/files/notebooks/5_2_1_hyperparameter_tuning?_xsrf=2%7Ca52454da%7Cdc526a9b7c4cb78eabec4467e8f95112%7C1765922425
there is an ?_xsrf token added to the URL that breaks notebook navigation
and, for the life of me I cannot figure out why it decided to add that token to that specific internal URL.
what is going on?
twilit prism
you're in a chrome or ff or some browser?
oh this is local okay sec, right duh
you guys are datascience of couuuurse
twilit prism
lime grove
what is going on?
so what version is it and where did you get your distro to run it so i can read the docs or whatever
lime grove

Firefox - but I spawn it from inside WSL2
mind, this only happens in that one internal link. I have more in the same notebook that are not going through this
twilit prism
maybe it's cached?
lime grove
restart FF
twilit prism
just an out of the box build and run, and you open it and it just does that? 
ctrl + shift + r
lime grove
nope, still there.
twilit prism
or incognito/in-private browsing to get a clean context
lime grove
there's nothing in the JSON that is causing this
twilit prism
open up devtools in FF, and inspect the linkerino?
when I go to localhost:8888, nothing shows up, is the site down btw? /s
href attribute, not sure if it needs # or not, but I would ask gemini fosho
<a id="5_2_1_hyperparameter_tuning"></a>
Did you bake this into the page, or is that automatically done for you? I would have though it'd be href, not id
lime grove
I baked it in manualy
twilit prism
id->href
lime grove
no fucking clue how that ended up there.
twilit prism
yeah maybe
href="the path" or href="./the path not sure which should be the case but if your path is 1 url segment away, it should route you fine
lime grove
this is all internal
twilit prism
uh
lime grove
it's a hyperlink to something further down in the same notebook
twilit prism
okay
twilit prism
href="#the thing you want to scroll to
oh, just find the other ones that do it fine and show me the html
[Link to my section](#my-section)
so the link is this, in markdown:
  5.2.1 [Hyperparameter Tuning](5_2_1_hyperparameter_tuning)<br>
and the target is this, in markdown
<a id="5_2_decisiontreeregressor"></a>
### 5.2 DecisionTreeRegressor
that markdown, inspected, looks like that snapshot I posted above.
the link, that is
lime grove
no, don't think so. I tested another cell with identical formats, but different words and location in the notebook, and this funny stuff didn't happen
twilit prism
you got it switched?
lime grove
what do you mean
twilit prism
case sensitivity maybe and....
lime grove
delete all notebook outputs, shut down FF, the Jupyter server, and then reboot the stack
twilit prism
erm
lime grove
because, there is nothing in the notebook JSON telling the server to do this
twilit prism
is the full content of that MD file identical? just different values in the ()[]?
twilit prism
the link to your section, should be #5_2_decisiontreeregressor likely
twilit prism
## My Destination    The target heading.
[Go there](#my-destination)    The link to the heading.
<a id="target_cell"></a>    An HTML anchor for a non-heading location.
[Go to HTML anchor](#target_cell)
But the google ai says this...
so..
5.2.1 [Hyperparameter Tuning](#5_2_1_hyperparameter_tuning)
<a id="5_2_1_hyperparameter_tuning"></a>
#### 5.2.1 Hyperparameter Tuning
we have the same thing it seems if that's what you have now :\
sec let me try it in my browser
lime grove
I am doing some pretty boring stuff with the markdown anchors
which is what surprises me about this behavior. It works for other internal hyperlinks, but not this one
twilit prism
do you have a brace in front of the 5.2.1, and the br at the end maybe put it on a new line?
lime grove
  5.2.1 [Hyperparameter Tuning](5_2_1_hyperparameter_tuning)<br>
the full line
restarted the whole thing, and the funny stuff remains
the   is just a way to force jupyter to honor the tab indentation
it refuses to keep the contents properly indented otherwise
twilit prism
5.2.1 [Hyperparameter Tuning](5_2_1_hyperparameter_tuning)

Which points to
<a id="5_2_1_hyperparameter_tuning"></a>
#### 5.2.1 Hyperparameter Tuning
<a id="5_2_1_hyperparameter_tuning"></a>
#### 5.2.1 Hyperparameter Tuning
if you look at the snapshot from the inspector above you will notice that it mangled the markdown, and inserted a search for something a nonexistent /files directory
twilit prism
[Hyperparameter Tuning](#5_2_decisiontreeregressor)
modulo_cero: so the link is this, in markdown:
5.2.1 Hyperparameter Tuning<br>
[3:13 AM]modulo_cero: and the target is this, in markdown
<a id="5_2_decisiontreeregressor"></a>5.2 DecisionTreeRegressor
You want it to go to the decisiontreeregressor?
lime grove
no, that was an error
5_2_1 should point to 5.2.1, my bad, sorry
a copypaste into here error, that is
twilit prism
it's not going to itself? lol
lime grove
I can edit the html in the inspector, save it, and it works. But if I re-open the notebook, the mangling returns
yeah, it is pointing to a non-existent location in localhost
twilit prism
1 less #? from #### in the 5.2.1 Hyperparameter Tuning?
twilit prism
lime grove
I can edit the html in the inspector, save it, and it works. But if I re-open th...
sheesh wow
lime grove
there's nothing wrong with my markdown. Something fucky is going on with jupyter
twilit prism
lime grove
so, I am working on a Jupyter Notebook, and I have some internal hyperlinks, whi...
if that's 4 # in your md, that might be it but idk. might be a typo in disc
twilit prism
lime grove
so, I am working on a Jupyter Notebook, and I have some internal hyperlinks, whi...
[Hyperparameter Tuning](#5_2_1_hyperparameter_tuning)
should be correct.
do you not have it like this?
yeah @lime grove I tried it with the # in front of the 5_2_1 [](#5_2_1...), so, if you don't have that, it might be the solution
lime grove
5.2.1 [Hyperparameter Tuning](5_2_1_hyperparameter_tuning)
twilit prism
yeee you put the # in front of the 5 in the smooth curved braces
5.2.1 [Hyperparameter Tuning](>>>#<<< 5_2_1_hyperparameter_tuning)
twilit prism
but like, did it work tho?
lime grove
i think that fixed the mangling. Checking
all the hyperlinks work. That was it.
you gotta be kidding me. I need to go to bed
so now, on to GitHub and whatever it decides to throw my way lol
wheat snow
twilit prism
how's yours setup? I typically just split up the concerns and make it do hierarc...
I actually do not know what that means but i can share more of the code later
Im in a dilemma about tuning my hyperparameter rn i dont just want to guess but idk what a representing plot for comparison might be to chpode an alpha epsilon combo
 foggy jay
Hi everyone 👋
I want to build a streamlit dashboard please suggest some project ideas
I have good knowledge of python numpy pandas matplotlib streamlit
 stable oasis
@foggy jay are you beginner or intermediate 🔰
@foggy jay if you are beginner go for heartattack predict model
serene scaffold
foggy jay
I want to build a streamlit dashboard please suggest some project ideas
have you trained a model before? if not, what have you already done with pandas and matplotlib?
 heavy crow
For those of you working in data science, what do you use to track experiments, version datasets, a/b testing etc? How has your experience been?
serene scaffold
heavy crow
For those of you working in data science, what do you use to track experiments, ...
have you heard of mlflow?
heavy crow
yup, thats what i was going to go with, how was your experience with it? Any hickups?
serene scaffold
heavy crow
yup, thats what i was going to go with, how was your experience with it? Any hic...
it makes it very easy to put data into it. the experience for getting data back out of it is kinda shit (imo)
I've also encountered a lot of bugs.
not to the point of making it unusable, however.
but it's the only open source software where I've apparently been the one to discover bugs (I posted issues on their github)
heavy crow
I probably prefer a solution that is hosted in the cloud so that i dont have to deal with setting things up at work. but i think mlflow and wanddb both offer hosted solutions right?
wandb was the other one i had looked into
serene scaffold
I think so, but it's easy to deploy mlflow with docker.
heavy crow
this would be for work so its easier to ask for a service to be purchased compared to getting it set up 😅
serene scaffold
I don't think you realize how easy it is to deploy with docker, but okay.
or even without, tbh.
heavy crow
but for playing around with it on my workstation you are right 🙂 probably worth trying it
yeah, but i have to ask the devops team for a machine to host it on, get the right permissions bla bla bla
serene scaffold
I don't think there's a better alternative. mlflow has become the focal point of discourse about experiment tracking.
heavy crow
heavy crow
yeah, but i have to ask the devops team for a machine to host it on, get the rig...
less about actually hosting it and more about the process of hosting something at a company :/
serene scaffold
whatever works for you
heavy crow
serene scaffold
I don't think there's a better alternative. mlflow has become the focal point of...
even over wandb or weights and biases?
serene scaffold
idk what those are.
serene scaffold
@spiral peak I just tried marimo for the first time and I think I'm already sold.
yesterday I was trying to make a report for a coworker in jupyterlab, and one of the columns in a dataframe was exceptionally wide and it ruined everything.
vale field
Guys is it possible for classifier to be perfect e.g. recall 1.0 and precision 1.0 etc? I never came across something like this. I made sure my dataset is balanced and i didnt change anything in the test data set. All the metrics are using test set. Can these sort of results be due to outliers or something if left untreated?
 jaunty helm
vale field
Guys is it possible for classifier to be perfect e.g. recall 1.0 and precision 1...
jaunty helm
vale field
Guys is it possible for classifier to be perfect e.g. recall 1.0 and precision 1...
well if your classifier perfectly distinguishes between the 2
that's very rare in real life tho, I'd double check maybe for data leakage, or I mean just plotting your data and looking at whether it's actually that easy to classify could help
foggy jay
stable oasis
<@1386971806178476072> if you are beginner go for heartattack predict model
I haven't done ML
Currently I am learning about linear regression
foggy jay
serene scaffold
have you trained a model before? if not, what have you already done with pandas ...
Made dashboard
foggy jay
stable oasis
<@1386971806178476072> are you beginner or intermediate 🔰
I am a beginner for ML
lime grove
what is the meaning of random_seed dependence of the outcome of a k-folds crossvalidation?
serene scaffold
lime grove
what is the meaning of `random_seed` dependence of the outcome of a k-folds cros...
Do you know what randomization seeds are in general?
lime grove
yeah, different sequence of the pseudorandom numbers
serene scaffold
Not quite
lime grove
I am thinking of this more in terms of whether it is turning into an MC-ish thing
serene scaffold
MCish?
serene scaffold
Look into what randomization seeds are.
It's the same concept everywhere that you see it in sklearn, or anywhere else.
lime grove
what is bothering me about this reproducibility question, e.g. not letting numpy provide the random state based on the system time, is that setting it to something arbitrary, like 42, will produce an outcome that is slightly different from when you set it to, say, 41
the key here is if I generate a regressor that is producing an R2 of 0.89 w/ random_state=42 how can I trust that value more than whatever comes out with a different val.
you can squeeze the hyperparameters s/t you max out that R2 val, but it seems like a better interpretation (given the nature of what randomness is) would be that you have an R2 range that is dependent on an optimized set of hyperparameters + range(random_state)
worse yet if the other hyperparameters are somehow dependent on this random_state
rich moth
This things ability even with a 8b model is pretty remarkable. Anyone got any suggestions for prompts?


 lime grove
rich moth
This things ability even with a 8b model is pretty remarkable. Anyone got any ...
lime grove
rich moth
This things ability even with a 8b model is pretty remarkable. Anyone got any ...
can it replace that obnoxious little twit, Stephen Wolfram?
outer cloak
Can someone help me out in building a chess analysis bot?
Its a bot which can make up free chess analysis for any match played in any chess platform even in web or mobile chess applications. but idk how to make it. i just had the idea... and where can i even collect text data for it?
for the help i will give away a book on DL
jaunty helm
lime grove
the key here is if I generate a regressor that is producing an R2 of 0.89 w/ `ra...
which is why you did cross validation that trains & validates the model on different folds of data, giving you like say 5 r2 values
if they're all around 0.89 then it seems pretty stable and you can trust the results more
if they vary wildly then your model is not very stable and maybe you conclude that the model isn't that trust worthy, maybe you might want to investigate what's causing all the variability
if you feel like 5 folds isn't good enough you can always increase the number of folds
or even use repeatedkfold which by default would train & validate on 50 sets of data for your model
jaunty helm
lime grove
worse yet if the other hyperparameters are somehow dependent on this random_stat...
that happens often if you do hyperparameter tuning, at which point you should do nested cv to ensure you're not getting optimistically biased results
you're basically saying, my final estimator is (model + hyperparameter tuning), where you don't care as much about which specific hyperparams were selected for your model per se, but whether adding this step of hyperparam tuning on average made for a better model than if you didn't have a tuning step
 cold zodiac
Hi 👋
 woven river
outer cloak
Can someone help me out in building a chess analysis bot?
Its a bot which can m...
woven river
outer cloak
Can someone help me out in building a chess analysis bot?
Its a bot which can m...
That's very interesting!
I can help you.
I am a senior AI and bot developer.
Build the bot by ingesting chess game data in PGN format from public sources, analyzing positions with a chess engine (e.g., Stockfish), generating move-by-move evaluations and explanations via rule-based logic or an LLM fine-tuned on annotated games, and exposing the pipeline through an API or chat interface that accepts game input from any platform.
serene scaffold
woven river
Build the bot by ingesting chess game data in PGN format from public sources, an...
what model do you suggest they use?
outer cloak
I recently got to know about text data by using PGN format but still it's pretty hard to teach a computer about PGN format. And how can we even import a chess engine? I mean stockfish is the only engine I will bow to because of its greatness...
But still building a llm model for this is tuff
I just learnt sk learn bro
woven river
serene scaffold
what model do you suggest they use?
I will use a hybrid system: a deterministic chess engine (e.g., Stockfish) for accurate move evaluation combined with a language model (LLM) to convert engine outputs into clear, human-readable analysis.
outer cloak
And how will we do that in python?
I mean creating a hybrid model is a good idea though
serene scaffold
Just out of curiosity, how many years have you been employed as an AI developer, @woven river?
woven river
serene scaffold
Just out of curiosity, how many years have you been employed as an AI developer,...
about more than 7 years
Why?
serene scaffold
I've never seen anyone call themselves a "senior AI and bot developer"
serene scaffold
outer cloak
And how will we do that in python?
that's a pretty big question. I would start by looking for a Python API for stockfish.
woven river
outer cloak
And how will we do that in python?
If you wanna make it in Python, parsing game input as PGN, analyzing each position with the Stockfish engine via python-chess, and passing the engine’s evaluations and principal variations to an LLM or rule-based formatter to generate natural-language explanations exposed through an API or bot interface.
woven river
serene scaffold
I've never seen anyone call themselves a "senior AI _and bot_ developer"
sorry
I am a junior.
okay?
@serene scaffold ?
serene scaffold
Alright
woven river
outer cloak
I mean creating a hybrid model is a good idea though
So, have you solved your problem?
outer cloak
Kinda
What about using an ai generated CSV file converted from PGN format?
@woven river ?
woven river
outer cloak
What about using an ai generated CSV file converted from PGN format?
okay
That's okay too.
outer cloak
But that feels kinda weird...
Like see
PGN is
- e4 e5 2. Nf3 Nc6 3. Bb5 a6
And CSV is
game_id,move_number,side,move_uci,move_san,fen_before,fen_after,result
1,1,W,e2e4,e4,rnbqkbnr/pppppppp/8/8/8/8/PPPPPPPP/RNBQKBNR w KQkq -,rnbqkbnr/pppppppp/8/8/4P3/8/PPPP1PPP/RNBQKBNR b KQkq -,1-0
1,1,B,e7e5,e5,rnbqkbnr/pppppppp/8/8/4P3/8/PPPP1PPP/RNBQKBNR b KQkq -,rnbqkbnr/pppp1ppp/8/4p3/4P3/8/PPPP1PPP/RNBQKBNR w KQkq -,1-0
1,2,W,g1f3,Nf3,rnbqkbnr/pppp1ppp/8/4p3/4P3/8/PPPP1PPP/RNBQKBNR w KQkq -,rnbqkbnr/pppp1ppp/8/4p3/4P3/5N2/PPPP1PPP/RNBQKB1R b KQkq -,1-0
1,2,B,b8c6,Nc6,rnbqkbnr/pppp1ppp/8/4p3/4P3/5N2/PPPP1PPP/RNBQKB1R b KQkq -,rnbqkbnr/pppp1ppp/2n5/4p3/4P3/5N2/PPPP1PPP/RNBQKB1R w KQkq -,1-0
1,3,W,f1b5,Bb5,rnbqkbnr/pppp1ppp/2n5/4p3/4P3/5N2/PPPP1PPP/RNBQKB1R w KQkq -,rnbqkbnr/pppp1ppp/2n5/1B2p3/4P3/5N2/PPPP1PPP/RNBQK2R b KQkq -,1-0
1,3,B,a7a6,a6,rnbqkbnr/pppp1ppp/2n5/1B2p3/4P3/5N2/PPPP1PPP/RNBQK2R b KQkq -,rnbqkbnr/1ppp1ppp/p1n5/1B2p3/4P3/5N2/PPPP1PPP/RNBQK2R w KQkq -,1-0
Well, this is what I got from chatgpt
woven river
U can solve that by treating PGN as input only, converting each move into a FEN-based per-ply internal record, running a chess engine like Stockfish for evaluations, and generating analysis from those structured results rather than relying on raw PGN or CSV alone.
@outer cloak
understand?
woven river
outer cloak
Not at all
OMG!
Then I'll make it myself.
Can you pay for the development costs?
outer cloak
No bro
I wanna learn it and make it
So I was just asking for a little help
And I don't mean to offend you
woven river
outer cloak
And I don't mean to offend you
okay
 manic sentinel
Hey everyone
Anybody from India willing to start genai? And have MLOps and data science skills, can join me.
outer cloak
I was wondering....
woven river
outer cloak
I was wondering....
I also cann't explain it in more detail than that theoretically.
outer cloak
If we could just use the API directly rather than training a whole new model...
I mean using stockfish's api directly will be much faster
Right?
woven river
outer cloak
Right?
of course!
outer cloak
(don't tell me that you were trying to say the same thing or I will ragebait)
serene scaffold
woven river
Then I'll make it myself.
Can you pay for the development costs?
You can't ask for payment here. This will be your only warning.
woven river
serene scaffold
You can't ask for payment here. This will be your only warning.
okay
sorry
woven river
outer cloak
And also I am broke
Bye
manic sentinel
Hey everyone
Anybody from India willing to start genai? And have MLOps and data science skills, can join me.
serene scaffold
manic sentinel
Hey everyone
Anybody from India willing to start genai? And have MLOps and dat...
can you be more transparent? is there a github repo you can share?
woven river
outer cloak
I got stockfish's API
sorry, I am busy now.
lime grove
jaunty helm
which is why you did cross validation that trains & validates the model on diffe...
I'm referring specifically to the random_state parameter in the GridSearchCV cross validator.
outer cloak
woven river
sorry, I am busy now.
Okay!
vale field
I was working with imbalanced dataset and I wanted to try class weights to see if model performance is increased, Basically, the performance looks roughly the same and for other models on other datasets (the models that have class_weight) the performance sometimes did not improve. Is it common to use oversampling with class_weight or something? I was expecting model performance to be better```Adult Dataset -- Decision Tree (with class_weight = "balanced")
precision recall f1-score support
       0       0.88      0.86      0.87      4503
       1       0.61      0.63      0.62      1496

accuracy                           0.81      5999
macro avg 0.74 0.75 0.74 5999
weighted avg 0.81 0.81 0.81 5999
accuracy score: 0.806467744624104 andAdult Dataset -- Decision Tree (without class_weight = "balanced")
precision recall f1-score support
       0       0.87      0.87      0.87      4503
       1       0.61      0.62      0.62      1496

accuracy                           0.81      5999
macro avg 0.74 0.74 0.74 5999
weighted avg 0.81 0.81 0.81 5999
accuracy score: 0.8051341890315052 ```
jaunty helm
lime grove
I'm referring specifically to the `random_state` parameter in the `GridSearchCV`...
sure, similar idea there
it finds the best hyperparam, in terms of working the best on average across all the folds
so the idea is by doing this the hyperparams you find should have some robustness
jaunty helm
vale field
I was working with imbalanced dataset and I wanted to try class weights to see i...
well 1 you should never only look at accuracy if you alr know you're working with an imbalanced dataset
but 2, this isn't that imbalanced to begin with, so by setting a higher weight for the "minority," the rise in recall could be offset by the drop in precision such that the final f1 score looks about the same (or worse, sometimes)
vale field
jaunty helm
well 1 you should never only look at accuracy if you alr know you're working wit...
i know i shouldn't look only at accuracy i also looked at precision and recall etc. Also how can you tell the dataset isnt that imbalanced? Im confused
jaunty helm
vale field
i know i shouldn't look only at accuracy i also looked at precision and recall e...
3:1 usually isn't that bad, and also looking only at ratios don't tell the full story
the issue coming from imbalanced datasets is more that the model can't really get a good grasp of the difference between the majority/minority
for example, assume a trivial example of a dataset where y = 1 - x, and x can only be 0 or 1, and you have 100 samples of x = 0 and 1 sample of x = 1, trying to classify y
that is imbalanced 100:1, but I mean it's so easy to separate that you def don't need to set any weights
vale field
ok ill check each of my datasets again
vale field
jaunty helm
3:1 usually isn't that bad, and also looking only at ratios don't tell the full ...
on a side note tho, wouldn't 3:1 be bad for KNN or naive bayes?
jaunty helm
basically it's not a given that imbalanced dataset = weights will make my model better
jaunty helm
vale field
on a side note tho, wouldn't 3:1 be bad for KNN or naive bayes?
again it depends on how much the model can learn to distinguish between them
imbalanced just means that there's less data for the model to build an understanding about the minority class, however it might still be enough just from these few samples to learn a good boundary
vale field
alr
vale field
jaunty helm
the issue coming from imbalanced datasets is more that the model can't really ge...
i think i understand what u mean, by looking more than just accuracy like recall and precision, i can tell if a majority class is being favored or not like here I think: ```Model (Decision tree)precision recall f1-score support
       0       0.89      1.00      0.94      1130
       1       0.00      0.00      0.00       135

accuracy                           0.89      1265
macro avg 0.45 0.50 0.47 1265
weighted avg 0.80 0.89 0.84 1265
accuracy score: 0.8932806324110671 ```
mossy pond
I'm working on a rag pipeline (embedd and receive), who wants to join in? that what you see is all with llama.cpp (gguf) ready to check out but need some fine tune


 limber ibex
Hey I'm new to Data Science and I'm currently learning Data Cleaning with pandas. But I have a question about the right Process. What comes when? Like first is obvious: Looking at the Data but what is the Order after that?
serene scaffold
limber ibex
Hey I'm new to Data Science and I'm currently learning Data Cleaning with pandas...
There isn't a specific order. You look at the data and think of ways you need to adjust it for what you're trying to do.
limber ibex
Ahh ok, thanks for the answer, that helps
serene scaffold
limber ibex
Hey I'm new to Data Science and I'm currently learning Data Cleaning with pandas...
If you read something that says "this is the exact order of steps for data analysis", or something like that, it's just bullshit that that author wrote as portfolio fodder.
I sometimes see people in here asking questions like "what do you do in between data cleaning and data normalization" and I'm just like "huh?"
limber ibex
Yeah, I get that haha. I didn't saw it anywhere I just thought there was an Order or sum
 naive river
serene scaffold
I sometimes see people in here asking questions like "what do you do in between ...
naive river
serene scaffold
I sometimes see people in here asking questions like "what do you do in between ...
that's when you frobnicate the data
 warm fossil
Did anyone try courses from DeepLearning.ai?
 gritty vessel
will gaussian blur help in this case?
I am trying to predict lightning from historical data of water in clouds and some thermal bands
target is point data and its 0 or 1 and other image is with gaussian blur
and also how to decide the value of sigma for gaussian blur?

 mossy pond
gritty vessel
will gaussian blur help in this case?
I am trying to predict lightning from hist...
mossy pond
gritty vessel
will gaussian blur help in this case?
I am trying to predict lightning from hist...
better to train an ai with that?
gritty vessel
mossy pond
better to train an ai with that?
yeah model will be able to learn area where lightning is happening thats what I am thinking
I performed some analysis and it seems it will be difficult to capture the patterns
MEAN VALUES
TIR1 lightning: 255.05815 no‑lightning: 260.71198
TIR2 lightning: 252.76395 no‑lightning: 258.33685
WV lightning: 233.7588 no‑lightning: 236.1475
this is avg values of values of my features whenever there is lightning and no lightning ,it's in kelvins
mossy pond
hmmm... I don't think the details are important... What's important is that when you query the AI after training, you attach your new images in the same way you trained it.
gritty vessel
Oh yes yes
My question was regarding if gaussian blur will help capture more patterns as I plotted the distribution


And I think if I train a model on this data it will not be able to differentiate between lightning and no lightning cases properly
mossy pond
gritty vessel
My question was regarding if gaussian blur will help capture more patterns as I ...
if really only binary data is the input i dont think it make a differ to blur it...
and in that case you must also blur your images if you make a query later
mossy pond
gritty vessel
And I think if I train a model on this data it will not be able to differentiate...
why not ai finds pattern you cant imagine ^^ (my guess)
gritty vessel
mossy pond
if really only binary data is the input i dont think it make a differ to blur it...
Features are continous so I think Its fine If I dont apply blur on it and yeah you are right I will try training it and see how it goes
There are some patterns actually
wherever there was a lightning
Cooling rate (K):
Lightning: -7.374458
No lightning: -2.045267
There is quite a diff in cooling rate I took past 6 frames and checked the trend it cools quickly during a lightning event
mossy pond
gritty vessel
There are some patterns actually
your first time ever train images on ai?
gritty vessel
mossy pond
your first time ever train images on ai?
yes
I was working on this project like one year back but left it and now I got curious about it again
gritty vessel
gritty vessel
yes
I have like started working with images in past but for some and some reason I dropped them so this time I decided to complete it and be conclusive about it
mossy pond
gritty vessel
I was working on this project like one year back but left it and now I got curio...
hmmm I'm wondering whether you can create or find a template yourself to roughly estimate the parameters for the “right training.”
gritty vessel
mossy pond
hmmm I'm wondering whether you can create or find a template yourself to roughly...
It's trial and error right?
I will start with Unet first with historical data as input and lightning frame as output and later explore Convlstms
mossy pond
gritty vessel
I will start with Unet first with historical data as input and lightning frame a...
for more hints may you can go on help-channel on huggingface (discord)
gritty vessel
mossy pond
for more hints may you can go on help-channel on huggingface (discord)
I will check that out after trying
warm lily
Thanks to everyone who chimed in, DeepLearning.ai courses have been interesting so far, been doing the machine learning and the corresponding math course the past week. Haven’t had time to string along a fully fledged project just yet but I’ve gotten some code written out for RAG 🙃
arctic wedgeBOT
Pasting large amounts of code
So that everyone can easily read your code, you can paste it in this website:
https://paste.pythondiscord.com/
After pasting your code, save it by clicking the Paste! button in the bottom left, or by pressing CTRL + S. After doing that, you will be navigated to the new paste's page. Copy the URL and post it here so others can see it.
rich moth
im using the ollama moondreamv2 for the visual model, the feedback isn't very good, im thinking its related to the systems prompt for the model and need a more generalized approach when it comes to the prompt for identifying the objects differently, liked included rules from a couple primitives for examples. i thought above even using unsloth for fine tuning a model with with the successful primitives, i got 61/400 solved but I imagine its just going to get harder and harder but those easy ones our foundational I imagine. This version doesnt include the DSL and other features I included but, Im trying to figure out really what sticks

anyone got ideas for a visual model or coding models?
i limited to 24GB VRAM between two models
lime grove
no idea what editor that is
rich moth
lime grove
no idea what editor that is
its jsut a custom visual dashboard for this project
lime grove
gotcha. Looks good
rich moth
thanks you, appreciate it.
rich moth
lime grove
gotcha. Looks good
have you ever play with the ARC challenge?
its a fun, hair pulling expereince.
Fun thought experiment. have you guys heard of infantile amnesia? Its a strange phenomenon. But I feel it was a powerful experience for us when we were all younger, but something that doesn't escape us. But my theory is this where consciousness is born, that moment where it all makes sense?
Like what were those primative building blocks that lead to that "big bang" for us all.
lime grove
no, never
I think I tracked myself to age 6 or so
the ARC challenge is interesting. There are also competitions hosted by Abu Dhabi (ADIA) on time series topics
rich moth
That's roughly where I remember my earliest memories.
lime grove
I have memories earlier than that, but that is when I recall "thinking rationally", or somesuch
rich moth
Ok well I googled it a bit and there is a bunch of research called the 5-to-7 shift that basically points to a fully formed prefontal cortexx.
But i'd have too look into it more
lime grove
Neuroscience isn't my background, altho this is indeed interesting
 high needle
Hey everyone! 👋
Hope your holidays were great and you're feeling recharged for 2026. Mine was solid - good food, family time, zero notifications, and some offline reading. Ready for whatever comes next.
Quick intro so people know who they're talking to:
I’m a senior engineer working across backend, full-stack, blockchain, and AI.
Been shipping production-grade systems for years - the kind that handle real traffic, real money, and real edge cases without falling over.
I usually get pulled in when things start getting tight: scale issues, performance bottlenecks, architectural debt, security concerns, or when a prototype needs to become something reliable and maintainable fast.
Areas I’m strongest in:
• Backend: Python (FastAPI/Django/Flask), Node.js, Go
• APIs: REST, GraphQL, high-throughput async services
• Data: PostgreSQL, Supabase, MySQL, MongoDB, Redis
• Infra/DevOps: Docker, Kubernetes, AWS, GCP, CI/CD, observability
• Blockchain: Solidity, EVM chains, Solana/Rust, smart contracts, on-chain tooling
• AI/ML: LLM integrations, RAG pipelines, agent systems, automation workflows
• Frontend (when needed): React, Next.js, TypeScript
Not here to sell or spam - just sharing what I do in case it overlaps with something you're building. I’m direct, move fast, and care more about working systems than titles or hype.
If something lines up and you want to bounce ideas, debug a problem, or chat architecture
If not, all good - just happy to be here with people who actually ship.
Looking forward to the conversations this year! 🚀
rich moth
Anyone ever mess with structural break detectors for time series? I have a couple questions
 lime grove
that competition ended, and the winning result is being closely guarded
someone on LinkedIn demanded I send him an email justifying the req
altho.... I feel that something could be done with the matrix profile approach
matrix profile, dynamic time warping, there's a few ideas
or you could have a running parameterization of an ARIMA type regressor, and track a change in the parameters.
I did something like that polynomial fits on daily data of a certain thing. I clustered the time series based on the properties of the polynomial coefficients. This was cool because you had a sort of requirement that prevented overfitting: too high degree of polynomial --> too many dimensions --> not enough data.
the reason I think tracking parameters is interesting (haven't done this) is because - presumably - the DGP maps onto the time series via those parameters.
but, while the time series is a single feature, you have several parameters that contribute to each data point
rich moth
lime grove
the reason I think tracking parameters is interesting (haven't done this) is bec...
I'll keep playing with it tomorrow, gotta goto bed. later man

 opaque sphinx
Does anyone here uses google colab? I’m now learning federated learning with differential privacy,
https://www.tensorflow.org/federated/tutorials/federated_learning_with_differential_privacy
somehow I can’t run the code, apparently it’s python version issue as google colab uses python3.12 but this only runs on python 3.08 to 3.11, how do I fix this? I’ve been trying to change the version but it just comes with errors after errors like compatibility issue or run time error even though I have already changed the version to 3.10

 gusty swallow
This seems insane to me, can anyone maybe explain how this was probably done?

Like it says in the title.
For the record, this is an HD reupload. The original 480p video proved to be too crunchy: youtu.be/_4n7sUFI3L8
I spent 13ish hours in total generating the images and... less than 15 minutes editing it and rendering it.
I DO NOT condone the use of AI image generation for personal gain, I suggest you draw inspiration fr...
 odd meteor
opaque sphinx
Does anyone here uses google colab? I’m now learning federated learning with dif...
odd meteor
opaque sphinx
Does anyone here uses google colab? I’m now learning federated learning with dif...
I briefly did ML research in Privacy-Preserving ML (PPML) it's nice to hear you're learning FedML and DP 😊
I don't use TensorFlow, but from your observation, you probably have to wait for the TensorFlow guys to make the DP code compatible with python version >= 3.12.
Idk if it's possible to downgrade the python version in Colab to match the version in TensorFlow code. Haven't tried it before.
If you're framework agnostic (I need to subtly add, you should come over to PyTorch 😀), then you should try Opacus + PyTorch for Differential Privacy.
I've since moved to Flower since I discovered that framwork. It makes working on FedML, PPML, FedML + DP so seamless and fun. You should try it (I recommend 💯)

A unified approach to federated learning, analytics, and evaluation. Federate any workload, any ML framework, and any programming language.
opaque sphinx
odd meteor
I briefly did ML research in Privacy-Preserving ML (PPML) it's nice to hear you...
nice, its nice to meet others whos into data privacy in ML space, not that many people are into this field from where im from
the reason I use TF is cuz its just what I found and what I use to learn, since the paper Im reading on used TF initially and im still in the middle of understanding it
and yes im having some serious issue with compatibility and its seems like colab is quite limited in this case, been trying the whole day but its just bug after bug after bug
may I ask whats a framework agnostic? sorry im a newbie in this ml world so theres a lot of things that idk especially some frameworks and terms
may I send you a friend request to know more about these? might be looking into these in the next few days figuring out what are these things xD. these seems hard
manic sentinel
Hey everyone
Anybody from India willing to start genai? And have MLOps and data science skills, can join me.
grand minnow
manic sentinel
Hey everyone
Anybody from India willing to start genai? And have MLOps and dat...
what are you building?
grand minnow
where are you learning gen ai from?
manic sentinel
Building small projects using MLOps n all nothing
manic sentinel
grand minnow
where are you learning gen ai from?
Yt and Udemy
grand minnow
manic sentinel
Yt and Udemy
You could also try and learn from Google skills https://www.skills.google/catalog?keywords=machine+learning&locale=
Google Skills
Explore the Google Skills catalog. Get temporary Cloud credentials and earn badges to showcase your skills. Learn, certify, and grow with Cloud.
manic sentinel
grand minnow
You could also try and learn from Google skills https://www.skills.google/catalo...
They don't provide end to end learning
grand minnow
manic sentinel
They don't provide end to end learning
what do you mean? its pretty verbose
manic sentinel
Okay will try
 spiral falcon
hello eveyone, I have just finished learning python about 3 libraries for data science, namely numpy, matplotlib and panadas. Should I do the next step to improve my skilss?
wheat snow
Hi, can sm1 judge from that wether i did something wrong, i have a gridworld reinforcement learning agent evaluation here. Temporal difference learning used the Q-learning algorithm from Sutton. Mc learning is first visit ɛ-greedy MC control.
For exponential epsilon decay for monte carlo and td learning i used the following formula:
ɛ(x) = e^((-1/decay_speed) * x)the finction for a decay speed of 2500 is also plotted. Now question: is there a non code issue/plot issue reason why the green exponensial epsilon decay td learning agent converges super fast


Alpha = 0.4, epsilon 0.1 for the constant epsilon td
Learning rate Alpha is dynamic (it was given that way by suttons pseudocode) for MC implementation
gritty vessel
spiral falcon
hello eveyone, I have just finished learning python about 3 libraries for data s...
practice them build some data analysis projects using them
 left tartan
rich moth
Fun thought experiment. have you guys heard of infantile amnesia? Its a strang...
left tartan
rich moth
Fun thought experiment. have you guys heard of infantile amnesia? Its a strang...
fnord
 keen monolith
rich moth
i limited to 24GB VRAM between two models
keen monolith
rich moth
i limited to 24GB VRAM between two models
limited to makes me sad
 cedar quartz
can anyone offer a case study or project that is doing simulations with cpython? physics ideally 🙏
odd meteor
opaque sphinx
nice, its nice to meet others whos into data privacy in ML space, not that many ...
It's always nice to meet someone working / exploring FedML or PPML! It’s a niche field, so you’re already on an exciting path.
Being framework-agnostic just means you’re not tied to one library (like TF or PyTorch) and are open to using whatever works best.
You’re doing great so far! It can feel like a lot, but it gets clearer the more you explore. Happy to help anytime!
opaque sphinx
odd meteor
It's always nice to meet someone working / exploring FedML or PPML! It’s a nich...
sent a friend request! I figured to use TF just now is cuz I found a published paper and its by google and they were using TF, so i thought it was the most optimal one, turns out time is fast and there are now others
 molten badger
hi , everyone , I know basic python and oop , maths , and basic supervised and unsupervised models , I want to know what should i do next? and i also have one question , i don't know much about generative ai , but can we use something like tokenization and prediction for creating videos , like llm use to predict text , can we create ai which guesses where the pixel should go using past training and this way we don't have to use frame by frame video generation model , instead we can make model directly manipulate the pixels by prediction to create a video
 agile cobalt
directly predicting each pixel would be extremely inefficient
remember that a high quality video has millions of pixels per frame, with dozens of frames per second
autoregressive video generation models do exist though, just predicting tokens instead of individual pixels
random example: https://bitterdhg.github.io/NOVA_page/
molten badger
agile cobalt
random example: <https://bitterdhg.github.io/NOVA_page/>
oh it already exists
how much time does it takes to become ml engineer
 winter canyon
[Newbie][Pandas vs SQL]
i have heard pandas are better than sqlite for data related stuff but i have learned sqlite would that work?
agile cobalt
winter canyon
[Newbie][Pandas vs SQL]
i have heard pandas are better than sqlite for data rela...
depends on what you are doing
for data analysis, dataframe libraries like pandas or polars are much more practical than sqlite
but just for storing and managing data, databases like sqlite work great
opaque condor
Has anyone ever published a data set?
serene scaffold
opaque condor
Has anyone ever published a data set?
yeah, why?
((don't ask to ask))
serene scaffold
so your question isn't about publishing datasets, it's about acquiring them?
opaque condor
I want to know if anyone has made these types of data sets because I'm willing to trust everyone here
I couldn't make one it wouldn't be very big it would be a hundred .txt files
Images have been a pain for me
grand minnow
opaque condor
I couldn't make one it wouldn't be very big it would be a hundred`` .txt`` files...
Does none of Kaggle's dataset fit your need? https://www.kaggle.com/datasets Could use those as examples/samples for making your own dataset
opaque condor
I have heck I even made a web scraper so I can get more data in a shorter amount of time I need for a data set
 slender crown
I wanna get opinions of y'all
Will Mamba be more popular than Transformer models in future?
 maiden osprey

Histogram equalization enhances image contrast by remapping pixel intensities to spread them out, making the histogram more uniform (flatter).
It works by compressing densely populated intensity levels (where contrast is low) and stretching sparse levels, effectively utilizing the full intensity range to improve visibility, especially in imag...
warm lily
Let's say I have data that can be plotted on a line chart that represents a cryptographic operation in milliseconds, what's a good library for anomaly detection https://github.com/yzhao062/pyod seems decent

GitHub
A Python Library for Outlier and Anomaly Detection, Integrating Classical and Deep Learning Techniques - yzhao062/pyod
serene scaffold
!warn @manic sentinel your message was removed for soliciting a business relationship.
arctic wedgeBOT
:incoming_envelope: :ok_hand: applied warning to @manic sentinel.
vale field
Hi guys, quick question, basically for k means clustering when making scatterplot is it normal for there to still be data points that are far away from the centroid even after removing outliers in each column? This happened to me and I don't really understand why.
 late lichen
I'm doing some mp stuff.... is this looks correct._.??? I'll not know for now cus I'm still doing bunch of research about the topic
``` whatwhy I can't out it on code block...
step = 0.4
# 2nd layer
w1 = rd.randrange(-5,5)
# 2nd neuron
b1 = rd.randrange(-5,5)

# output layer
w2 = rd.randrange(-5,5)
# output neuron
b2 = rd.randrange(-5,5)

# number of gradient step
for _ in range(5)
    # no mini batching for now
    t_cost = 0
    dw1 = db1 = dw2 = bd2 = 0
    for i in range(10000): # sample size
        data = (i/1000.0) # range from -5.0 to 5.0

        # calculate the cost
        c_cost = (forward(data,w1,b1,w2,b2,relu) - (data*2))**2

        # calculate negative gradient of second layer
        layer2_g = calc_ngradient(data*w1+b1, c_cost       , w2,b2,lambda x: 1,relu)

        layer1_g = calc_ngradient(data      , layer2_g["a"],w2,b2,lambda x: 1,relu)
    t_cost = t_cost / 10000 # average
def forward(x, w1,b1,w2,b2,f):
    # first apply the first layer
    x = (x * w1) + b1
    # then apply activation function
    x = f(x)

    # output layer and we use ReLU
    x = (x * w2) + b2
    x = f(x)
    return x


def calc_ngradient(prev_act : float,
                   cost     : float,
                   w        : float,
                   b        : float,
                   act_func_d, # function
                   act_func
    ) -> dict[str,float]:
    """compute the negative gradient of each component
    """

    zl = prev_act * w + b

    d_b = 1        * (act_func_d(zl)) * cost
    d_w = prev_act * (act_func_d(zl)) * cost

    # compute the negative gradient of previous activation
    d_a = w        * (act_func_d(zl)) * cost

    return {"a":d_a,
            "w":d_w,
            "b":d_b}
 trim saddle
late lichen
I'm doing some mp stuff.... is this looks correct._.??? I'll not know for now cu...
trim saddle
late lichen
I'm doing some mp stuff.... is this looks correct._.??? I'll not know for now cu...
for i in range(10000): # sample size
        data = (i/1000.0) # range from -5.0 to 5.0
The range of data would be [0,10) no, and not -5 to 5?
late lichen
trim saddle
```python
for i in range(10000): # sample size
data = (i/1000.0) # range...
well that will work if I keep the relu....
trim saddle
late lichen
well that will work if I keep the relu....
true, but the comment is misleading then
vale field
Guys, I was doing k-means clustering and I have a question about it. Is it still possible for k means clustering to still have few data points that are far away from the centroids of each cluster group even after removing outliers and scaling data? Is this an problem from my side or a downside of k means clustering for the specific dataset I'm using?
I initially thought the error from my side was due to the preprocessing of the dataset and that I didn't scale the data, but after i scaled it, there are still few data points far away from centroid and Im confused. I would appreciate some advise to help me understand the reason why.
late lichen
trim saddle
true, but the comment is misleading then
oh my bad I'm not sure where the -5 goes.....
 arctic inlet
Is keras no longer bundled with tensorflow?
 viral falcon
opaque condor
I have heck I even made a web scraper so I can get more data in a shorter amount...
viral falcon
opaque condor
I have heck I even made a web scraper so I can get more data in a shorter amount...
Hope my message doesn’t bother you. Have you used traditional python tools for that ? Because usually sits block scraps.
 kindred yew
I came across word embedding using Word2vec, but I didn't fully understand how the vector weight system is formed and I want to understand it more deeply, any materials recommendation?
Also i wold like to work with technics that analise more then one word at the time, like neigboor words, phrases and paragraph, any recommentio of materials that presents this solutions/techiniques ??
opaque condor
viral falcon
Hope my message doesn’t bother you. Have you used traditional python tools for t...
No I just got up from sleeping traditional python tools for that no I've been trying to use selenium to scrape for images but most of them could be AI so I have to download a data set so all the images come out True
vale field
kindred yew
I came across word embedding using Word2vec, but I didn't fully understand how t...
Personally I look at published journals/research papers about such topics. I also use few books as well, one of the ones I recommmend is: Introduction to Data Mining (What's New in Computer Science) by Pang-Ning Tan (Author), Michael Steinbach (Author), Vipin Kumar (Author). These helped me massively. I hope you will find them useful as well.
You can also look for few courses as well online if you are not a big fan of reading. Pretty sure there are tons of walkthroughs on YouTube.
 forest flame
guys my friends want a roadmap for data science and he just completed the basic python
 bronze wyvern
Hello, I will soon start my second semester in uni and I will be learning "NLP", I want to already start learning it a bit so that I can get use to it, how things work etc. Can anyone has a recommended resource where I can get started please.
kindred yew
bronze wyvern
Hello, I will soon start my second semester in uni and I will be learning "NLP",...
https://web.stanford.edu/class/cs224n/ Its a Stanford CS course in NLP
kindred yew
vale field
Personally I look at published journals/research papers about such topics. I als...
thx,
kindred yew
forest flame
guys my friends want a roadmap for data science and he just completed the basic ...
I recommend searching on YouTube, not to learn, but to explore the technologies in the field. Then, look for basic materials and use a project-based learning approach. Create a project with a specific and modular goal ('use this concept X in a simple way'), achieve it, and from there, build new projects, adding another goal to the same project or in other project.
grand minnow
forest flame
guys my friends want a roadmap for data science and he just completed the basic ...
Check the pinned messages on this channel
warm lily
Integrated my first little ML project with Python.NET and Pyod, works wonders on anomaly detection on cryptographic operation benchmarks that are measured in milliseconds. I think unsupervised learning is coming up in Andrew Ngs course next.
 vocal glacier
ive been covering mathematical foundations for neural networks this semester from deep learning by ian goodfellow sadly the book has less to do w coding. Can any one recommend me someplace to get that done from ?
 mellow vector
just spent an hour trying to figure out why my untrained model was giving me random logits 🙁
I shouldn't discount myself, I told myself I didn't need to fuss with the sigmoid because I'm getting good enough at this stuff to sanity check with a glance (which is pretty obvious on a trained model), unfortunately, I'm not good enough to recognize when the logits are coming from an untrained model.
@valid basalt read your message from a few months back, it would be a fascinating topic to explore. Would have been interested to see what you intended to share.
bronze wyvern
kindred yew
https://web.stanford.edu/class/cs224n/ Its a Stanford CS course in NLP
thanks, I'm going to watch the spring 2024 video, thanks a lot !
molten badger
guys suggest some books on ml and dl
plush shuttle
anybody tried neat?
 abstract wasp
Guys what can make me stand out for mle roles I’ve been applying and they’ve been rejecting me 😭 not even one interview 😭
I’ve been applying for jobs in Canada and I need a work visa do u think that’s why I’ve been getting the rejections? Too much work for them?
I satisfy the requirements but they don’t accept me lmao
bronze wyvern
Hello, does anyone know what this slide is trying to convey about center and outside thing? I'm confused, I'm trying to understand how word2vec work based on this slide
 agile cobalt
bronze wyvern
Hello, does anyone know what this slide is trying to convey about center and out...
agile cobalt
bronze wyvern
Hello, does anyone know what this slide is trying to convey about center and out...
think of it like a sliding window
if you mask the word in the [||center||], which word is the "[]" most likely to refer to given the context?
 raw hare
bronze wyvern
Hello, does anyone know what this slide is trying to convey about center and out...
raw hare
bronze wyvern
Hello, does anyone know what this slide is trying to convey about center and out...
I interpret word2vec as given a window size and predict the word (center) that most align with the context within window(outsize)
vale field
Hi guys quick question, i was watching a youtube video on DBSCAN clustering algorithm because i wanted to know more about the 2 important parameters: min_sample and ep. Is the min_samples being 2*dimension of dataset (2 x df.shape) a general rule that is widely used when doing DBSCAN?

yk what nevermind im just being dumb i needed more time to think about it mb
 empty bough
Does anyone have any ideas for projects to learn deep learning?
serene scaffold
empty bough
Does anyone have any ideas for projects to learn deep learning?
people often start with making a network to classify hand-written digits
empty bough
serene scaffold
people often start with making a network to classify hand-written digits
yes thats a good idea
viral falcon
opaque condor
No I just got up from sleeping traditional python tools for that no I've been tr...
Thank you
 mild dirge
vale field
Hi guys quick question, i was watching a youtube video on DBSCAN clustering alg...
mild dirge
vale field
Hi guys quick question, i was watching a youtube video on DBSCAN clustering alg...
I don't think that should be a rule of thumb. It largely depends on the point density, so on the data itself, not just dimensionality.
I've used DBSCAN before for trying to find the largest cluster in a 3D point cloud, and use min_points of 1 sometimes to just find the largest connected cluster f.e.
 summer river
me when the rmse of my regression model is 1.5 but the average of the thing im predicting is 2:
bronze wyvern
agile cobalt
think of it like a sliding window
if you mask the word in the [||center||], whi...
Based on current sentence/context we are trying to predict the word in the center? But with vectors, do we have context?
do we have a "vector dictionary" where we have some kind of mappings?
bronze wyvern
Hello, I'm currently learning about word vectors and word2vec. Earlier, I thought that we kind have some sort of "vector dictionary" where we can perform some mappings for some words and base on that predict things but this isn't that at all. From what I've understood, we have a sentence, say I love pizza, what would happen is we would first convert each word into a random vector. Then we would use a neural network and optimization techniques like gradient descent to figure out what's the closest output that will match the surroinding of a particular target word. At the end of the day we will have the probability distribution representing how much we believe that word "I" is before love or how word pizzais after "i"?
So steps are:
- Convert to random embeddings
- Use neural nets to find most accurate embedding (training part)
Now we need to generalize on unseen data, in this case, unseen data would be whatever we can write as text?
Also, one thing, computers don't understand text, so when say we predicit a particular thing, computer is predicting a particular embedding, we would then perform some kind of mappings to get the actual word? This is what we refer to as encoder-decoder?
viral falcon
If I want to share my project about ai agent I built with people on this discord server. Where can do that?
 wet dome
I've just started to build a project which predicts future prices for commodities, I haven't worked with time series data before and it's harder than I thought.
Normally in supervised learning, I have a set of features and I'm trying to predict an outcome but in time series are my features now all the previous dates/rows and the prices on those days?
jaunty helm
wet dome
I've just started to build a project which predicts future prices for commoditie...
that would be one possible feature yes (usually called lags)
basically, you just need to ensure that when you're trying to predict say day 5's price, you're not accidentally using any features that you can only obtain in the future
for example you can not make "average of the entire series" a feature, because you're peeking into the future for that information
wet dome
jaunty helm
basically, you just need to ensure that when you're trying to predict say day 5'...
Yes cause I was going to make a random train test split but obviously can't do that with time series
jaunty helm
wet dome
Yes cause I was going to make a random train test split but obviously can't do t...
yep
make sure you set shuffle to false
or just use TimeSeriesSplit
wet dome
@jaunty helm I've done some feature engineering and found some features I made which I would like to train on
Some of these features are like the past 7 day average price for example, however this now means that some rows have missing values for this column, because there are not 7 days before it.
Should i drop these rows?
vale field
Quick question guys, basically if I opt for using stratifiedkfold (e.g. k folds = 5 instead of 80%-20% train_test_split and I just so happen to use accurac_score, recall_score etc amd store those values in a dataframe) do people usually use 5 confusion matrix (one for each fold) or have just 1 confusion matrix??
 elfin bone
warm fossil
elfin bone
warm fossil
have someone handled optimization in computer vision that needs C++ but in python? and if so, how was it?
 granite pebble
Hello, I have made an AI application which can answer from both your unstructured and structured data. You can upload any number of files, any size of files. You can question anything across your files. It gets updated live if you change anything from your data. I wanna show you for getting a review about my application. Plzzz, let me know if anyone of you all interested in seeing my project. I would love to show you.
jaunty helm
wet dome
<@208918673178492929> I've done some feature engineering and found some features...
sure
or you can try imputing some sensible value
or some other methods
it comes down to your dataset as to which will work out the best
jaunty helm
vale field
Quick question guys, basically if I opt for using stratifiedkfold (e.g. k folds ...
you can collect all the oof predictions and build 1 confusion matrix out of that
plush shuttle
 frank oar
Hi my fellow developers...
I need help with an AI task. I'm a software developer but haven't worked with AI/LLM systems before, so I'd appreciate your guidance. We're extracting structured data from PDFs (image-based, not text-searchable) using OpenAI's vision API. Current flow:
- Convert each PDF page to an image
- Process images in batches (e.g., 10 pages per batch) due to API limits
- Send each batch to OpenAI with a prompt asking for specific fields in JSON format
- Consolidate results from all batches
The Challenge:
Some fields can span multiple pages/batches. For example (just example) :
- referral_summary
- medical_history
- referral_details_reason_for_referral
Current Issues:
- No context between batches each batch processes independently
- Incomplete extraction our consolidation logic only takes the first non-empty value, so we miss information from later batches
- We don't know which fields will be scattered until processing. The JSON schema comes from a user-configurable prompt, so field distribution varies by document type and prompt.
serene scaffold
frank oar
Hi my fellow developers...
I need help with an AI task. I'm a software developer...
you're sending personal medical data to a third-party service?
frank oar
serene scaffold
you're sending personal medical data to a third-party service?
Its deployed within our private cloud environment, ensuring that all data remains within our secure and compliant infrastructure
serene scaffold
frank oar
Its deployed within our private cloud environment, ensuring that all data remain...
I'm not sure what to suggest other than to do a sliding window over the pages, so that there's never a hard break in context between adjacent pages.
frank oar
serene scaffold
I'm not sure what to suggest other than to do a sliding window over the pages, s...
I thought the same but looking for something else
wet dome
Im working with time series data and I have just tested my model on my testing data and it performed pretty badly, despite doing well on cross-validation. My model is vastly underestimating the price of the commodity.
Could this be because in my training data, all the values of prices are much lower than the testing data, as they are in the past, and so these two datasets arent iid?
because in ml dont we assume training and testing data is identically distributed, but in time series data the prices in the future are actually much higher
its like the model is learning parameter values which minimise error on the training data but because values on the testing data are much higher (as prices go up), they don't really work
 calm thicket
your model might not be able to capture the trend, or perhaps you are selecting the training data poorly. there could be many explanations
wet dome
calm thicket
your model might not be able to capture the trend, or perhaps you are selecting ...
it did well on cross-validation though
 worldly dawn
wet dome
Im working with time series data and I have just tested my model on my testing d...
worldly dawn
wet dome
Im working with time series data and I have just tested my model on my testing d...
How do you go from stock price to feature?
wet dome
what?
worldly dawn
wet dome
what?
what is the input of your model?
just the raw price without any transformation?
wet dome
I think its more about the fact that I'm training on old data and so when it comes to predicting prices now, the learnt parameters are irrelevant to current market conditions
like you need to train on up to date data
mellow vector
So I have a hypothesis, that valuable training information is lost when restructuring a model for transferred learning (EMNIST letters -> EMNIST digits for example). I wonder if this is a topic anyone else here has looked into?
If not, I guess I wonder if anyone will be interested to see the results of my experiment while I learn about transfered learning.
worldly dawn
wet dome
I think its more about the fact that I'm training on old data and so when it com...
The usual way is to scale and transform your prices so your model can learn from them.
That might mean using a starting point of 1 (or 0), scaling between 0-1 (or -1,1), applying a diff of the log prices, applying percentage of the changes, etc.
Otherwise, there is nothing that can be generalized between going from 20->20.5 and 532->545
jaunty helm
wet dome
Im working with time series data and I have just tested my model on my testing d...
and you did cv through time series split right? just to make sure
if your model is tree based, like rf, gbtrees, etc. then note that they physically can't extrapolate - for example if the max price in your training set was like 100 then a tree model won't ever predict something above that
one idea is to first fit a linear model to capture the trend; then find y_residuals = y_true - y_trend and fit your tree on that
if your input features only consist of lag, very simple stuff like exponential smoothing can have surprisingly competitive performance
worldly dawn
jaunty helm
if your model is tree based, like rf, gbtrees, etc. then note that they physical...
And I am sure @jaunty helm had it in mind, but in case, make sure that y_trend is computed only on past data as to avoid look ahead bias. Not based on the overall y_trend
vale field
quick question, i previously said here that i was working with kmeans clustering on dataset and basically i also used few metric for evaluation for each clustering algorithm. I have 2 questions. First one, in my scatter plot some of the points are quite far away from its centroid and closer to another centroid (like for the light green and brown data points). It really annoys me after all this time. Would it be wrong to leave it as this? I wanted to see which clustering algorithm is best. This is the calculated metrics for kmeans on this dataset: K-Means Clustering Metrics Silhouette Score: 0.3464
Davies-Bouldin Index: 0.9623
Calinski-Harabasz Index:1065.6234

I read that metrics alone doesn't necessarily prove an algorithm is better than another. I tried to plot the scatter graph of 2 features but apart from that idk what else to do.
Any advise would be appreciated. I really tried to understand it myself.
jaunty helm
vale field
quick question, i previously said here that i was working with kmeans clustering...
assuming the clustering is calculated on more than these 2 features, it's to be expected
what looks "far away" in a 2d plot, doesn't necessarily mean they're far away in the full dimensional space
for example, assume your data is distributed like these 2 balls, and your kmeans correctly identifies that each point belongs to one of these balls
if you just so choose to do a 2d plot of the x-y axis (so you're looking from above basically), you'd see that kmeans seemingly arbitrarily assigned points 'in the same region' to 2 different groups, when in reality they're far apart

 opaque condor
Wouldn't be bad if I had an AI that anything that happens on a graph is equal to a point
 fading wigeon
Definitely don't have the context to understand what you're referring to
 lapis sequoia
Yo, so how do you like prompt agentic rag? Do you have to use like a search engine or something with the agent
serene scaffold
lapis sequoia
Yo, so how do you like prompt agentic rag? Do you have to use like a search engi...
you can use any information retrieval system that you want.
lapis sequoia
serene scaffold
you can use any information retrieval system that you want.
😄 thank you.
Like RLHF, do you have to get preferences to all align or something? Is that even possible
opaque condor
Has anyone ever used mpl 3d with images?
In blender it's called projection modeling I want to do the same thing with mpl
 light fractal
I’ve been exploring a way to unify quantization, pruning, and semantic compression using information theory (IDM). I open-sourced a framework implementing this idea and I have achieved exciting results. Feedback is welcome.
https://github.com/makangachristopher/Information-Transform-Compression

GitHub
Contribute to makangachristopher/Information-Transform-Compression development by creating an account on GitHub.
short imp
answer this question guys
if information gain is high then purity of data (entropy) will be less or high?
jaunty helm
short imp
if information gain is high then purity of data (entropy) will be less or high?
information gain is a function of 2 random variables while shannon entropy is a function of 1
agile cobalt
short imp
if information gain is high then purity of data (entropy) will be less or high?
I'm not quite sure what you're trying to ask, but this might help: https://www.youtube.com/watch?v=v68zYyaEmEA
(+ the followup to that video)

An excuse to teach a lesson on information theory and entropy.
These lessons are funded by viewers: https://www.patreon.com/3blue1brown
Special thanks to these supporters: https://3b1b.co/lessons/wordle#thanks
An equally valuable form of support is to simply share the videos.
Contents:
0:00 - What is Wordle?
2:43 - Initial ideas
8:04 - Informat...
vale field
jaunty helm
for example, assume your data is distributed like these 2 balls, and your kmeans...
Oh, i didn't think of it like that. I was considering trying to implement a 3d plot as well.
jaunty helm
vale field
Oh, i didn't think of it like that. I was considering trying to implement a 3d p...
it could help, but ultimately wouldn't always solve the issue
the 3d-2d case was easier to see so I used that; but you can imagine even with a 3d plot, 2 4d hyperspheres could be far apart but appear close in your 3d plot
vale field
jaunty helm
it could help, but ultimately wouldn't always solve the issue
the 3d-2d case was...
There's always something to deal with, isn't there? lol.
I guess I can compare the performance of each algorithm making use of my calculated silohuette score, davies bouldin index etc for moreinsight to the clusters and performance of each algorithm.
serene scaffold
!warn 725836040048476210 Your message was removed for advertising. Please do not do this again.
arctic wedgeBOT
:incoming_envelope: :ok_hand: applied warning to @fierce scarab.
 dusty valve
<@&831776746206265384>
 zenith nova
!ban 587257837726597122 advertising
arctic wedgeBOT
:incoming_envelope: :ok_hand: applied ban to @cinder ruin permanently.
wheat snow
Hey, i wanted to ask wether someone here would be willing to skim/read a university assignment (Reinforcement Learning) to give me feedback/possible critique ect. Before i submit. It is a implementation and a written report about 3 different agents dynamic programming (with given T and R matrix) a Monte carlo agent using on policy first visit epsilon greedy MC control. And a temporal difference learning agent using Q learning. We were asked to built thoose agents reason our parameter choise and evaluate performance in a simple gridworld enviroment.
I have a carefully written report with lots of good plots and would like someone to read over the report and point out critical parts, i can also share my code for the project but i tho it would be too much work also trying to understand my implementation (so the reader should probably skip the the questions where i explain my code). Please dm if someone is willing to help a student out.
 coral yew
Hi! I am creating a tg bot for studing eglish with test and I have a problem: I dont know how to create a test which be hard(like some words must be similar). I try to do it with embeddings, but I dont get how to do it. Maybe I must to add any AI. If yes so please tell me some free variants. Iwrite it in Python
vale field
Is it possible for machine learning models to perform better (both in performance of model and not misclassifying) on imbalanced datasets without any resampling techniques compared to when resampling techniques are applied?
serene scaffold
vale field
Is it possible for machine learning models to perform better (both in performanc...
it's hard to say, because there are so many types of models.
vale field
serene scaffold
it's hard to say, because there are so many types of models.
I just find it very weird for example classifiers like RandomForestClassifier and DecisionTreeClassifier etc etc when I do not use resampling, they give me less false positive/false ngatives and i still have good recall and precision
If i compare that to when i use resampling techniques, it almost always gives me a lot of false negatives/false positives on the confusion matrix and can decrease some of the performance metrics sometimes
jaunty helm
vale field
Is it possible for machine learning models to perform better (both in performanc...
yes
usually I try weights first over resampling cause the latter fails for me way more often than not
vale field
jaunty helm
yes
usually I try weights first over resampling cause the latter fails for me wa...
im doing that rn but i was just curious, if the results are nearly the same/ if i still get good results without resampling and class weights, would people use those results? especially when evaluating models
jaunty helm
vale field
im doing that rn but i was just curious, if the results are nearly the same/ if ...
I mean why not? if there's no problem training 'naively' on the dataset don't fix it
vale field
jaunty helm
I mean why not? if there's no problem training 'naively' on the dataset don't fi...
alr cool, i wish i thought of this sooner instead of procrastinating
 muted vine
Hello guys, I have made my first Agent project using LangGraph + FastAPI. I am graduating with my CS degree this month and looking for an entry-level position for python developer + AI. I am doing some projects for that. If someone can take a look at the project and give some feedback on what I can improve, I would be grateful: https://github.com/torreslucs23/Rito-Bank-Agent

GitHub
Contribute to torreslucs23/Rito-Bank-Agent development by creating an account on GitHub.
 iron lark
Im working on a project for detecting ASL. Currently I have it setup with opencv and mediapipe, so it can extract hand landmarks. Could anyone point me in the way of some resources to learn how to do the machine learning part of the project?
 limpid ember
iron lark
Im working on a project for detecting ASL. Currently I have it setup with opencv...
limpid ember
iron lark
Im working on a project for detecting ASL. Currently I have it setup with opencv...
try hugging face models like ViT, ConvNext, DINO etc, requires deep learning/transformers knowledge tho
Btw, whats ASL ?
iron lark
american sign language
limpid ember
iron lark
american sign language
Ah got it, then you can try simpler models (or a custom CNN model) for this
iron lark
limpid ember
Ah got it, then you can try simpler models (or a custom CNN model) for this
what if i wanted to train it by myself?
limpid ember
iron lark
what if i wanted to train it by myself?
depends on the amount of training data then, how much is it ?
iron lark
it wont be much
limpid ember
Then prefer either pytorch or tensorflow to create the model, and then train it
iron lark
isnt tensorflow dead
limpid ember
iron lark
isnt tensorflow dead
Not sure abt this one, I prefer pytorch ngl
iron lark
I was leaning on the pytorch side but then again no clue how exactly to do it regardless 🥀
limpid ember
iron lark
I was leaning on the pytorch side but then again no clue how exactly to do it re...
Create a basic architecture of model, create a custom dataset and dataloader, then training pipeline, and then inference
iron lark
could you point me to resources on how to do it
limpid ember
iron lark
could you point me to resources on how to do it
Take any course of pytorch in yt, you will sufficient idea on how to build one, I have playlists in hindi lang. not english
iron lark
ah ok thx 👍
lime grove
is there a practical purpose to plotting the outcome of fitting a kernel density estimator to data? You can look at a pretty picture, but ultimately I feel that simply calculating skew, kurtosis, and so on, give you what you need for a further decisions
like, would periodically check some sort of a kolmogorov-smirnov statistic drift, comparing the actual vs. the kde-estimator result be it?
that would still be simple values, not pictures, however
limpid ember
lime grove
is there a practical purpose to *plotting* the outcome of fitting a kernel densi...
I mean, is there any downside if we draw one ?
lime grove
I am not sure I would call it a downside
it is always good to look at a picture
but, aside from the visualization, KDE produces the score_samples which can then be used to perform KS-tests. However, this can always be done purely programmatically, no plotting needed
Now, if you plot the KDE output, you can get a sense of how well your data aligns with a whetever a given kernel can approximate. For instance, you can get a sense of the skew, etc. But if you want a quantitative value for the skew, you just use scipy.stats
there is no need to look at the plot. It seems superfluous, is all
wooden sail
lime grove
is there a practical purpose to *plotting* the outcome of fitting a kernel densi...
just that any single goodness/error metric doesn't tell the whole story
lime grove
Of course not
wooden sail
in many cases you never even care about the error values, but rather the parameters that describe the kernel
the practical purpose is that maybe you catch by eye something that got past all your chosen metrics
lime grove
You have a number of descriptive metrics. Taken in the aggregate you can make decisions
wooden sail
yeah, but you first need to validate your metrics
once you'Ve done that, sure, you can skip it
lime grove
It sounds like plotting it addresses some kind of a gap in information retrieval
Although what that gap is might be poorly defined
Because, you can see that your data has, for instance, a right skew. And that it is somewhat multimodal
But that can always just be calculated without looking. Maybe exploratory data analysis is too fuzzy
wooden sail
you're definitely right, it's never necessary to look at plots
but the intuition can help. you said yourself: "you can see that your data ... has a right skew"
you can compute a truckload of metrics and descriptive statistics and hope they're useful, do several tests to see which of those metrics best correlate with the performance you want to get
looking at it by eye can give you an educated guess of which metrics to test first. not guaranteed to work, at any rate
 silk acorn
I've deleted your post since it breaks our rules against advertising.
 delicate crystal
silk acorn
I've deleted your post since it breaks our rules against advertising.
delicate crystal
silk acorn
I've deleted your post since it breaks our rules against advertising.
Apologies and thank you for letting me know.
 wicked gust
Hey, does anyone know how I would go about swapping the LSB of values held in a numpy NDArray, in my case, I have 2 NDArrays, both holding uint8's, one only containing 1s and 0s, assuming there the same length, how can I go over the data array, and set each LSB to the corresponding bit in the bits array, apologies if this isn't worded to well, thanks
jaunty helm
wicked gust
Hey, does anyone know how I would go about swapping the LSB of values held in a ...
by lsb I assume you mean least significant bit?
so you have an array of uint8's, and you want to set each elements' lsb using another array of same length containing only 0's and 1's (and those 0's and 1's will become the matching elements' lsb)
in which case, you can clear out the last bit of the uint8's and just replace it with the lsb array
like new_value = old_value & (~1) + lsb_value, since ~1 should be 1...10
wicked gust
I'll give it a go now, thanks 🙂
wicked gust
jaunty helm
in which case, you can clear out the last bit of the uint8's and just replace it...
Hi, I've tried this method, and it seems to mostly work, however I've noticed it does not seem to work on the number 2, for whatever reason, if LSB mask is 1, the value does not change, do you happen to know why, thanks
jaunty helm
wicked gust
Hi, I've tried this method, and it seems to mostly work, however I've noticed it...
forgot some order of operation shenanigans
>>> import numpy as np
>>> a = np.array([2, 2])
>>> lsb = np.array([0, 1])
>>> a & (~1) + lsb
array([2, 2])
>>> (a & (~1)) + lsb
array([2, 3])
and technically this should work as well without the ugly parens
>>> a & ~1 | lsb
array([2, 3])
>>>
Yeah, this pattern works great, thanks so much
lime grove
wooden sail
looking at it by eye can give you an educated guess of which metrics to test fir...
It's analogous to that "technical analysis" nonsense that people like to do with stocks. You draw pretty lines that show trends, wave your hands around and chant "Fibonacci" a few times, imagine support levels, etc. But if you want to do things programmatically you rarely - if ever - can use those visual tools in practice. Visual intuition that exists outside the space of programmatic tools is useless because all the tools available within a computer are necessarily programmatic. I know that this is circular, but you're stuck with it.
 nova peak
who likes some econometrics in ml pipelines
 fierce creek
hey guys quick question. so basically im working on my own version of swingvision (its basically a tennis analyzer) and i need to detect court points. most data i found is all from the same exact position bc it was trained on official matches, but typically it would be from the court level if ametuers use it. so this basically eliminates a cnn (unless someone has any other ideas) so i decided i would try classical cv. would the hough transform work best for detecting large rectangles? another thing i was thinking was using a canny edge detector and combining it with hough to make labels for a cnn. any help is appreciated!
limpid ember
fierce creek
hey guys quick question. so basically im working on my own version of swingvisio...
Just to confirm, u want to detect court points based upon large rectangles using hough transform, right ?
fierce creek
yeah
rich moth
i had a random thought I wanted to share. What if complexity isn't something we measure. But, it's a medium intelligence moves through. Any thoughts?
lime grove
rich moth
i had a random thought I wanted to share. What if complexity isn't something we...
watch this great video on complexity - lots of math!
https://www.youtube.com/watch?v=__aFwrR702U
The Biggest Ideas in the Universe is a series of videos where I talk informally about some of the fundamental concepts that help us understand our natural world. Exceedingly casual, not overly polished, and meant for absolutely everybody.
This is Idea #23, " Criticality and Complexity." Having spend a lot of time on the basic ingredients of our...
rich moth
lime grove
watch this great video on complexity - lots of math!
https://www.youtube.com/wat...
ill check it out thanks
lime grove
rich moth
ill check it out thanks
emergence is a property of complex systems, and consciousness is theorized as being an emergent property of the systems that we exist thru. So, maybe I agree with you.
rich moth
lime grove
emergence is a property of complex systems, and consciousness is *theorized* as ...
Maybe emergence is a phase transistion , or "Critical Point" to these complex systems.
lime grove
rich moth
Maybe emergence is a phase transistion , or "Critical Point" to these complex sy...
no idea. Criticality, phase transitions, complexity, this is all very fyzzicsy. I don't like getting touchy feely with topics I know are extremely rigorous
rich moth
lime grove
no idea. Criticality, phase transitions, complexity, this is all very fyzzicsy. ...
I totally get it. 🙂
 civic horizon
Hello everyone
 vale elbow
anyone know any beginner friendly unsupervised learning courses/tutorials (free) with scikit learn ? I can access linkedin courses and datacamp thanks to my school account
fierce creek
vale elbow
anyone know any beginner friendly unsupervised learning courses/tutorials (free)...
yeah this is the one i used to learn sklearn (its on yt): https://www.youtube.com/watch?v=hDKCxebp88A&t=1s
its pretty long but watching in 2x speed and skipping sections can help. word of advice, dont just copy code, after learning a new algorithm, try using it on a dataset by yourself and then implementing it only using math (difficult at first but helps a ton)

This course is a practical and hands-on introduction to Machine Learning with Python and Scikit-Learn for beginners with basic knowledge of Python and statistics.
It is designed and taught by Aakash N S, CEO and co-founder of Jovian. Check out their YouTube channel here: https://youtube.com/@jovianhq
We'll start with the basics of machine lear...
 magic imp
hello world , is thier sequnce to learn ai for ex data science Ml ai or something else ,, can u tell me free corse u find in ai thats not regret about time spend in it , what do u think about cs50ai ?
fierce creek
magic imp
hello world , is thier sequnce to learn ai for ex data science Ml ai or somethin...
i havent done the cs50 course, but there is a sequence i would recommend for ai in general. first you should have a surface level understanding of math concepts (vectors, matrices, gradietns, derivatives and you can always go deeper later). the second thing is to learn data science (especially pandas) and how to clean/visual data. EDA is hella underrated and super useful. the next this is to start trying out the different ml models from sklearn and maybe try implementing a few of them from scratch. next a good idea would be to learn either tensorflow or pytorch, i personally prefer tensorflow but pytorch is more beginnner friendly. now im not a pro and you shouldnt trust me, but this is similar to what i did
 plucky condor
I'm looking to get into RL using jax. There seem to be quite a bit of different libraries for this (Rlax, gymnax, jumanji). Any suggestions which one to learn?
lime grove
plucky condor
I'm looking to get into RL using jax. There seem to be quite a bit of different ...
search for JAX on GitHUB, and see which one appears to be prevailing
and numpy just pulls this notation out of thin air
np.mgrid[xmin:xmax:100j, ymin:ymax:100j]
Notice the j in the slice. First time noticing this.
wheat snow
fierce creek
yeah this is the one i used to learn sklearn (its on yt): https://www.youtube.co...
remember that one asian kid that wrote a neural network using only numpy and math on pen and paper? stuff was so insane
fierce creek
wheat snow
remember that one asian kid that wrote a neural network using only numpy and mat...
my god dude i watched that video when i was starting out and was geniunely like dammmmm
wheat snow
fierce creek
my god dude i watched that video when i was starting out and was geniunely like ...
kinda reminded me when u mentioned applying sklearn stuff to ur own stuff
fierce creek
yeah that helped me a ton
wheat snow
thats like in general the most fun way to learn. i started out by downloading my netflix data, following an article to find out my #1 series only to go soo much deeper i ended with 4k lines of terrible code and an ugly ass tkinter data dashboard to interactivly stalk every accounts habits ect.
i am still looking for a pracitcal applience of any ML project that has liek some personal impact towards me, i am currently taking a reinforcement learning course and it's a lot of fun aswell but yet again i struggle to find a project myself
fierce creek
wheat snow
i am still looking for a pracitcal applience of any ML project that has liek som...
yeah rl is pretty cool
fierce creek
wheat snow
thats like in general the most fun way to learn. i started out by downloading my...
lmao thats soo reall
fierce creek
wheat snow
i am still looking for a pracitcal applience of any ML project that has liek som...
when i tried learning rl the project i tried was a geometry dash agent
its pretty fun and its a good starting point bc it only has 2-3 commands (nothing, click, hold)
and its scaleable bc of the level difiiculty increasing
wheat snow
fierce creek
lmao thats soo reall
my 2nd project was a bit more proffesional tho. i discovered 🌠 jupyter notebooks 🌠
so i wrote a long one about spotify data
fierce creek
ahh yes the glorious jupyter notebook
wheat snow
the company sucks ass tho, there used to be an API endpoint where you could pull audio analysis data from a track such as key, bpm, energy level, dancable lvl, decibels ect. but they deprecated that
fierce creek
when i first tried jupyer notebook i didnt know what a cell was so i had like a single gigantic block of code 😭
wheat snow
fierce creek
when i first tried jupyer notebook i didnt know what a cell was so i had like a ...
AHHH
fierce creek
wheat snow
the company sucks ass tho, there used to be an API endpoint where you could pull...
wait frr that would acc be so cool
wheat snow
fierce creek
when i first tried jupyer notebook i didnt know what a cell was so i had like a ...
horror
fierce creek
yeah ikr i found it on one of my old repos and just stared at it for a while
wheat snow
it had so much funny data
i mapped out heatmaps that showed at what time of the day i listen to more dancable and louder tracks ect
wheat snow
fierce creek
yeah ikr i found it on one of my old repos and just stared at it for a while
lemme find that old ah netflix project
fierce creek
thats deadas funny
fierce creek
wheat snow
lemme find that old ah netflix project
i wanna see ts 😭
wheat snow
that one was also pretty informative:

but i can say you, one thing that is so much ruining my stuff is that like my top 5 song are my alarms that go off in the morning with a spotify song 300 times a year
fierce creek
wait this is lowk cool
wheat snow
fierce creek
i wanna see ts 😭
okay i gotta get da harddrive
fierce creek
bro had to hide it on a hard drive 😭😭 😭
wheat snow
fierce creek
bro had to hide it on a hard drive 😭😭 😭
it was running on ym old laptop i didnt transfer everythign smh
fierce creek
makes sense

 fierce creek
fuzzywuzzy is some wild stuff
wheat snow
i think its some graphical stuff
fierce creek
lmao
bro this cannot be real https://github.com/seatgeek/fuzzywuzzy
GitHub
Fuzzy String Matching in Python. Contribute to seatgeek/fuzzywuzzy development by creating an account on GitHub.
wheat snow
apperently i used the imdb data base to get some rating or titles?
AHH STRING match
smth withs ome titles having weird names so i couldnt match them to the same series
fierce creek
that makes sense now bc ur prob looking for title matching
but why fuzzywuzzy out of all names 😭 looks like a troll
 fierce creek
bro u might have the wrong name
wheat snow
fierce creek
but why fuzzywuzzy out of all names 😭 looks like a troll
hey, that shitshow of a project was before ai
but my code says imdb
 wheat snow
püackage got renamed
fierce creek
so maybe something similar?
wheat snow
cinemagoer
fierce creek
bro i think imdb was better
i had to read that msg like 4 times before i understood what it was
fierce creek
😭
wait rq i got a question for u
r u good at cv? bc i was wondering what the best way would be to detect tennis court lines and not the players
fierce creek
dam what
wheat snow
can u vc
fierce creek
yeah sure
 wheat snow
i cant stream :/
serene scaffold
wheat snow
i cant stream :/
we pretty much don't give streaming perms.
wheat snow
serene scaffold
we pretty much don't give streaming perms.
hmm, probably good reasons haha
wheat snow
fierce creek
r u good at cv? bc i was wondering what the best way would be to detect tennis c...
absolutly no idea
 cedar tusk
wheat snow
cedar tusk
wheat snow
python ui moment
 loud fjord
hello
im new to DS can anyone help me out with a proper roadmap of all the major topics in PY i should cover for DS
 lavish kraken
Do most of you compute P-values in your machine learning project
 fierce creek
bro I'm not that smart 😭😭
 cold fulcrum
loud fjord
hello
cold fulcrum
loud fjord
hello
If you're learning python for DS, you should check out 'Python Data Science Handbook' on GitHub:
https://github.com/jakevdp/PythonDataScienceHandbook
It's a roadmap with working code for most libraries you'll need, and the book is also available online.
cold fulcrum
lavish kraken
Do most of you compute P-values in your machine learning project
P-values are sometimes used in inferential settings to assess evidence against specific hypotheses, but, in my opinion, they play little role in most predictive machine learning tasks.
lime grove
any thoughts on this aesthetic?

this is a gaussian kernel density estimation on a data set. The raw data is represented on the bottom (some vertical spread is added to de-densify the output)
 waxen kindle
An histogram would be much better
lime grove
I avoided a histogram because the choice of bin size is basically arbitrary. There are no user-defined parameters in this, and it provides a clearer picture of the data shape & tendency (in my opinion)
the KDE is also a ML method, you can use it to estimate the density of any point on the x-axis (smooth, i.e.). I like it more for a bunch of reasons
lime grove
cold fulcrum
P-values are sometimes used in inferential settings to assess evidence against s...
pvalues are used regularly to compare CDFs, and can be used to track population drift. As you said, i.e., reject the null hypothesis, etc.
cold fulcrum
lime grove
any thoughts on this aesthetic?
It depends on what you're analyzing, the context is important. But it's a great graph to show the distribution and data points. One thing that could improve it would be adding reference lines for the mean/median, or maybe some percentile markers. Which help viewers quickly grasp the central tendency and spread. In Python you can add extra lines with axvline()
lime grove
cold fulcrum
It depends on what you're analyzing, the context is important. But it's a great ...
I need to make it look better, and those 2 vertical lines (mean + median) would be super appropriate.
here is another use for p-values (and the KDE derived density). You can impute a data point where needed, and then run the resulting dataset thru a KDE procedure, then see how much the new distribution varies from the old (Kolmogorov). This produces a p-value.
this is analogous to the hot-deck imputation, which is basically picking a random value from a distribution of well-chosen values.
lime grove
it's almost as if though age in years ought to be a categorical

 delicate night
cold fulcrum
If you're learning python for DS, you should check out 'Python Data Science Hand...
delicate night
cold fulcrum
If you're learning python for DS, you should check out 'Python Data Science Hand...
Hello, do you have something similar for people learning Python for building something in the AI sector?
 echo marsh
Looking for people native or fluent in English who enjoy talking about Artificial Intelligence (ML/DL).
I like discussing ideas and explaining things as I’m also trying to improve my English speaking. Feel free to DM.
worldly dawn
echo marsh
Looking for people native or fluent in English who enjoy talking about **Artific...
why not here?
echo marsh
worldly dawn
why not here?
If my msg is not of your business, you can skip it 😊
worldly dawn
echo marsh
If my msg is not of your business, you can skip it 😊
You sent messages to a public forum. So your messages are everyone's business 
echo marsh
worldly dawn
You sent messages to a public forum. So your messages are everyone's business <:...
I asked if someone is interested, he/she can DM me so we can plan vc sessions based on our time zones.
worldly dawn
echo marsh
I asked if someone is interested, he/she can DM me so we can plan vc sessions ba...
sure, so why not doing here where you can reach to more people, get more input and fantastic conversations?
echo marsh
worldly dawn
sure, so why not doing here where you can reach to more people, get more input a...
coz this chat would get cluttered.
worldly dawn
echo marsh
coz this chat would get cluttered.
We have had plenty of interesting discussions here. I would suggest to try it once at least 🙂
 chrome basin
Fav algorithm?
worldly dawn
chrome basin
Fav algorithm?
genetic algorithm
chrome basin
Hmmm, interesting choice. I like the ideas of it, but didnt have good results with it in practice on the problems i tried it on. Which area did you apply it in the past?
I'm still a sucker for locality sensitive hashing, even though thats outdated nowadays, it blew my mind at some point
worldly dawn
chrome basin
Hmmm, interesting choice. I like the ideas of it, but didnt have good results wi...
bunch of them, from symbolic regression, to classification, to generating paintings to generating behaviors.
worldly dawn
chrome basin
I'm still a sucker for locality sensitive hashing, even though thats outdated no...
how is it outdated now that everything is about latent space and finding nearest neighbors?
chrome basin
I was guessing 🙂 last time i used it was a few years ago. Okok
No one else an interesting pick here? 🙂
chrome basin
worldly dawn
bunch of them, from symbolic regression, to classification, to generating painti...
Alright alright, tried it only on a few basic things like variable selection but ended up a computational overkill more than anything at the time
Probably not configuring it right as is often the case when just playing around
 lapis drum
Hi guys! I am doing a logistic classification on a minst of 1000 classes and the accurate and f1 score is 0 whilst when I did a cnn classification it wasa high score. Is there something wrong with my code that it is producing 0 or is it just logistic classification isn’t built for how big the database is?
 serene scaffold
lapis drum
Hi guys! I am doing a logistic classification on a minst of 1000 classes and the...
serene scaffold
lapis drum
Hi guys! I am doing a logistic classification on a minst of 1000 classes and the...
Hello, remember to always show code as text. Never as a screenshot.
!code
mild dirge
lapis drum
Hi guys! I am doing a logistic classification on a minst of 1000 classes and the...
A score of 0 means it did worse than random
arctic wedgeBOT
mild dirge
Perfectly mis-predicting the actual class every single time
lapis drum
serene scaffold
Hello, remember to always show code as text. Never as a screenshot.
Oh my bad sorry!
mild dirge
Nws, it's readable anyways
lapis drum
mild dirge
A score of 0 means it did worse than random
So it isn’t something to do with my code? it’s just that the logistic classification just did very poorly with the amount of classes there were?
mild dirge
No, I say that because it is very weird
It's probably not the model because of that
Because just a bad model would get probably some correct by random chance
lapis drum
Yeah! I tried a decision tree and it did the same thing
mild dirge
For this task, every input should produce a single class?
Or can every input belong to multiple classes?
mild dirge
logistic regression produces a value between 0-1 for each possible class
So per class it will predict if the input belongs to it
So it is generally used for multi-label classification, where an input can belong to multiple classes
If you want one class, you want to use softmax in the end, to make sure you get a probability distribution over all possible classes
And then you take the class with the highest value (argmax) and that's your prediction
lapis drum
So shall I add this into my code : lr_model = LogisticRegression(
max_iter=1000,
solver='saga',
multi_class='multinomial',
n_jobs=-1,
verbose=1
)?
As it has softmax applied internally
chrome basin
Can you just print your predictions in the test and put them next to the observed test set? Perhaps the creation of your test set is corrupt?
lapis drum
lapis drum
So shall I add this into my code : lr_model = LogisticRegression(
max_iter=1...
i tried adding this, but it is taking so long to run.
arctic wedgeBOT
 steel spindle
Can someone explain how does nural networks learn?
I know they use gradient descend but I do not understand it
 fiery dust
Hi! Wan't to start studying how ML works with Python examples. I've got all the necessary maths.
Having said this, what do you guys recommend?
Like I'm watching StatQuest for example, but I think I prefer a course/yt playlist or book which explains the concepts and gives code examples.
serene scaffold
steel spindle
Can someone explain how does nural networks learn?
neural networks take a long time to wrap ones head around, so there's no succinct answer that will be very informative for you.
but basically, a neural network is a really big function with two kinds of variables: the instance that it's making a prediction for (which change every time), and the weights of the network (which are an inherent part of the network). for each training instance, you calculate the disparity between the function's current output and the expected output. and then you use the derivative of the whole neural network function to modify the weights slightly in the direction that would have brought the function closer to the expected output.
steel spindle
serene scaffold
neural networks take a long time to wrap ones head around, so there's no succinc...
Oh ok thx!
serene scaffold
steel spindle
Oh ok thx!
did any of that make sense to you?
fiery dust
fiery dust
Like I'm watching StatQuest for example, but I think I prefer a course/yt playli...
Adding to what I said, I wont use TensorFlow, so maybe that helps you help me 🙂
And I want to know how the models work but I dont want to spend an eternity learning everything of it. Ideally, a good understanding is enough and then I'd like to go directly to examples
fierce creek
steel spindle
I know they use gradient descend but I do not understand it
basically the easiest way to explain gradient descent is a ball moving down a hill (you've probably heard it before, its pretty simplified). basically nns have loss functions, telling the model how wrong they were. these loss functions can be mapped into a loss landscape using different weights and biases. gradient descent intially begins with a random point, and from there, the partial derivative is calcualted, which basically is the slope of the function at that point. by taking the opposite (we want to minimize the loss), we can adjust the weights by the gradient which is typically dampened by some scaling factor (alpha). this scaling factor is also known as the learning rate, and it controls how fast the model learns (typically something like 1e-3 is good, but it all depends in the situation). after iterating over this a lot of times, the ball eventually reaches the minima, or the most optimal parameters. it wont always be the absolute best, but itll be better than the start. this video by 3blue1brown explains it really well. https://www.youtube.com/watch?v=IHZwWFHWa-w
now it can get stuck in local minima, but that rarely ever happens, as these networks operate in such high dimensionality spaces that the model would need to be stuck in every single one for that to happen. this diagram is extremely simplfiied, only showing one parameter


Cost functions and training for neural networks.
Help fund future projects: https://www.patreon.com/3blue1brown
Special thanks to these supporters: http://3b1b.co/nn2-thanks
Written/interactive form of this series: https://www.3blue1brown.com/topics/neural-networks
This video was supported by Amplify Partners.
For any early-stage ML startup fou...
steel spindle
serene scaffold
did any of that make sense to you?
Yea
steel spindle
fierce creek
basically the easiest way to explain gradient descent is a ball moving down a hi...
Alr thx, I will check it out
lime grove
I don't agree with the statement that Gradient Descent rarely gets stuck in local minima
and, as a matter of fact, the higher the dimensionality of the problem, the less knowable the global minima is. In a way, you are stating that you know everything about your optimization landscape when you state that you've arrived at the global minima.
stochastic gradient descent is great at arriving at an optimum that is good enough for the purposes of the overall problem. But don't make the error that this is the same as a global optimum
there are very few algorithms that are guaranteed to find the global optima, one of them being brute force searching. There are others, none of which are computationally efficient.
Take the Rastrigin function, for instance. It has a global minimum, but it also has 1000s of local minima, each with varying convexity. If you take the basic math of gradient descent, where you take the opposite direction of the local slope, you can see where it would fail.
https://en.wikipedia.org/wiki/Rastrigin_function
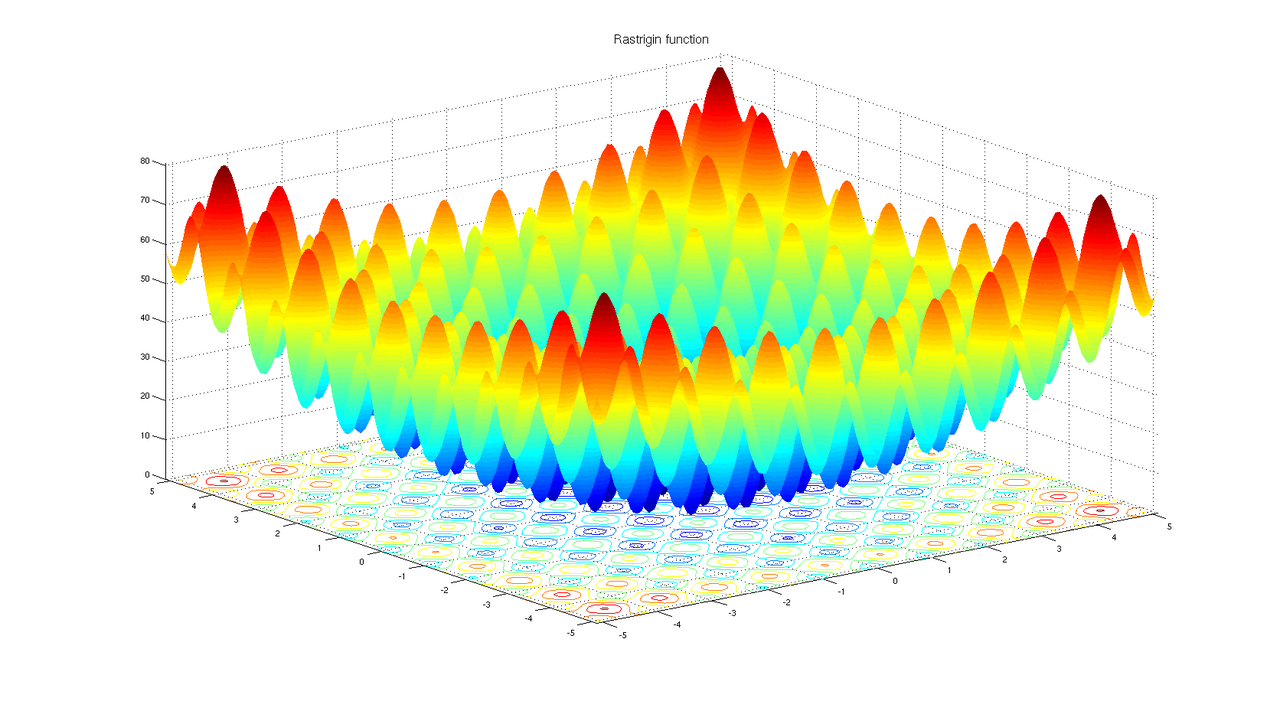
In mathematical optimization, the Rastrigin function is a non-convex function used as a performance test problem for optimization algorithms. It is a typical example of non-linear multimodal function. It was first proposed in 1974 by Rastrigin as a 2-dimensional function and has been generalized by Rudolph. The generalized version was popularize...
And this is a low dimensional problem. You can see the solution.
Another tricky one that is used as a benchmark, is the Ackley function, which has a pretty deep global minimum. You can parameterize the generating function s/t the central well is very narrow, leading to what is known as a golf hole minimum. This would make the step function (e.g. the value needed for finite differences) critical for finding it.
https://en.wikipedia.org/wiki/Ackley_function

In mathematical optimization, the Ackley function is a non-convex function used as a performance test problem for optimization algorithms. It was proposed by David Ackley in his 1987 PhD dissertation. The function is commonly used as a minimization function with global minimum value 0 at 0,.., 0 in the form due to Thomas Bäck. While Ackley give...
There is a HUGE literature on this problem inside the protein structure community.
Global optimization is probably one of the hardest problems out there.

 languid chasm
fierce creek
basically the easiest way to explain gradient descent is a ball moving down a hi...
languid chasm
fierce creek
basically the easiest way to explain gradient descent is a ball moving down a hi...
Christ I can’t believe it’s been 8 years already!!
 slender radish
Hi all,
where is a good place to get feedback on a scientific computing pipeline
this is biology specific
 torpid mirage
I've had the pleasure of being picked (voluntold) to develop a piece of a project involving MAS
https://en.wikipedia.org/wiki/Multi-agent_system
To be entirely honest, AI isn't my thing—but I'm willing to make the most of it.
I'm planning for a basic brush-up on the foundational topics before tackling this
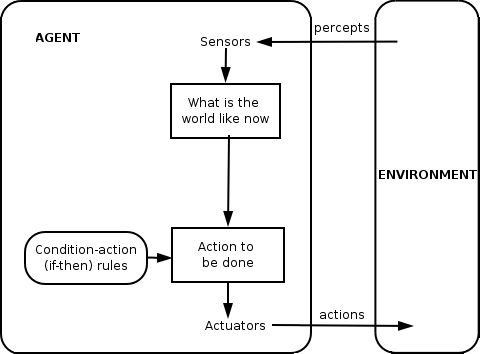
A multi-agent system (MAS or "self-organized system") is a computerized system composed of multiple interacting intelligent agents. Multi-agent systems can solve problems that are difficult or impossible for an individual agent or a monolithic system to solve. Intelligence may include methodic, functional, procedural approaches, algorithmic sear...
So, my list consists of:
- Statistics, both descriptive and probabilistic
- FSMs
- Discrete timing, variables, and stochastic processes
And that's about it.
I'm not entirely knowledgeable on the topic so, I'm unsure what else to study before tackling MAS in itself as a topic.
Is there anything that would be relevant and helpful to that?
chrome basin
Haha i also had myself in this situation in the past
I enjoyed it, but, depending on which library you use, it can be annoying to debug for sure 🙂
But, fun!
chrome basin
steel spindle
Can someone explain how does nural networks learn?
Just minimizing an error like any regression. Just a more advanced non linear function to optimize. And optimizing that, as highlighted above already, can get stuck in local optima. But, other than that, same old regression, minimizing a loss function..
steel spindle
chrome basin
Just minimizing an error like any regression. Just a more advanced non linear fu...
Do u use local or global minimum?
chrome basin
So, we are trying to learn a non linear function from data. Of course our goal is to find 'the truth', and we split a dataset into train and test in order to optimize on a training set and then get an independent estimate of our expected error on a test set. Naturally, we wish to find the global optimum. A local optimum is just an algo getting stuck somewhere, you wish to avoid that. But already mentioned above as well, sometimes a local optima is good enough (depends what you want to achieve). But in general, you would like to find the best optimum that still generalizes well on a test set , i.e. doesnt overfit
Tough task, one might say indeed ...
Fun task, but tough !
I think you made a spelling mistake in your status
But go forth and spread this ML wizardry!
lime grove
Claiming you found the global optimum is equivalent to claiming you know everything about the surface. This is probably, usually, a pointless thing. It's better to claim you've found the best state that satisfies your overall goal. This might not even be a local optimum, because gradient descent is known to occasionally stop at metastable stationary points, like a saddle between two valleys. This might nevertheless be a good enough estimator for the overall goal.
You can diagonalize the Jacobian matrix of your system at this metastable point, and any imaginary eigenvalues found would indicate that it is not a minimum (either local or glbal). Slight perturbations in the imaginary directions would then send you in the direction of a better solution. But this is all local in nature, nothing is global which is what's desired, so some artifice that would magically sample other regions in the surface would have to be designed.
fierce creek
lime grove
I don't agree with the statement that Gradient Descent rarely gets stuck in loca...
sorry for the confusion, that was completely my fault
lime grove
fierce creek
sorry for the confusion, that was completely my fault
No worries. It's subtle stuff
fierce creek
lime grove
No worries. It's subtle stuff
👍
@lime grove u seem like u know ur stuff, im pretty decent at building projects, but my theory isnt amazing. got any good resources to learn for free?
lime grove
It's just experience
Can't think of a good structured resource tbh. And you're gonna have to understand the math
fierce creek
lime grove
Can't think of a good structured resource tbh. And you're gonna have to understa...
no worries, ig ill just learn as i go lmao
fierce creek
lime grove
It's just experience
how long have u been doing ai/ml?
lime grove
Dealing with optimization since roughly 2004
lime grove
this is really on the edge of a pretty huge field
https://en.wikipedia.org/wiki/Global_optimization
Global optimization is a branch of operations research, applied mathematics, and numerical analysis that attempts to find the global minimum or maximum of a function or a set of functions on a given set. It is usually described as a minimization problem because the maximization of the real-valued function
    g
    (
...
So a I made a tool an measured the complexity (shape) of its brain, which is its entire nervous system of a worm, the data I ran it on. The results were pretty intesting.

Anyone got any other suggestions to measure it on? data that is available to download.
The tool works on any network, I mean brains are just graphs. But that was just the first test, makes me think though. If feeback loops are where computation happens, what does β₁ say about intelliegence? Makes me think
lime grove
rich moth
The tool works on any network, I mean brains are just graphs. But that was just...
Brains are Bayesian Belief Networks
lime grove
rich moth
The tool works on any network, I mean brains are just graphs. But that was just...
The trick is how to map the physical connections to a dynamic growing graph that can create a knowledge system. IOW, the neurons are one thing, but how they handle inputs and outputs is another. Kinda mysterious, IMO
I mean, this is where it makes sense to go the LLM route, because the brain is essentially a forecasting machine. LLMs come out of the RNN world.
oh cool, SNAP, the Stanford Network Analysis Platform
https://snap.stanford.edu/data/C-elegans-frontal.html
rich moth
lime grove
I mean, this is where it makes sense to go the LLM route, because the brain is e...
ya i agree with the forecasting machine but what's the Bayesian loop without a physical loop?
lime grove
rich moth
ya i agree with the forecasting machine but what's the Bayesian loop without a p...
physical graph --> <mystery abstraction> --> Bayesian Loop
and, what is more, how to do that extremely efficiently. There hasn't been a single worm in the entire history of the universe that has needed a GPU
rich moth
I got an idea TCI-NET.
 rich moth
 lime grove
rich moth
lime grove
rich moth
there is no such thing as a duplicated trade. You don't backtest a single strategy, but a family of them, and then finagle the stats.
worldly dawn
lime grove
there is no such thing as a duplicated trade. You don't backtest a single strate...
why wouldn't you backtest a single strategy?
lime grove
worldly dawn
why wouldn't you backtest a single strategy?
Because you are effectively sampling a single data point from sort of a distribution
lime grove
worldly dawn
why wouldn't you backtest a single strategy?
and market dynamics are irreproducible, even with L3.
worldly dawn
lime grove
Because you are effectively sampling a single data point from sort of a distribu...
what do you mean? you are effectively looking at many trades
lime grove
the history is the single datapoint.
worldly dawn
what does that mean?
rich moth
lime grove
there is no such thing as a duplicated trade. You don't backtest a single strate...
good called
 worldly dawn
your history of trades will be many points
rich moth
*call
lime grove
No, it will be a single "data point". It could be a true positive, a false positive, etc. It's basically a chaotic function that is sensitive to initial conditions, so you need to understand the degree of robustness of the chaotic trajectory
worldly dawn
lime grove
No, it will be a single "data point". It could be a true positive, a false posit...
are you a llm?
explain it like a pirate
lime grove
oh, ffs.
rich moth
hmm
worldly dawn
found the llm
lime grove
same asset, same model, same statistical structure

clearly a bad model, given that spread.
what you are saying is that a single path is enough. What I am saying is that one single path is not enough. You need to know what the behavior of your strategy will be in a statistically meaningful snese
@rich moth pretty picture is closer to what things ought to look like
What happens if I start in a different month?
What happens if volatility doubles?
What if slippage increases by 2x?
What if I remove one filter or one asset?
worldly dawn
lime grove
what you are saying is that a single path is enough. What I am saying is that on...
Right, so you do work at the scale of a single strategy that you want to test. You do not work at the scale of multiple strategies to get the behavior of a single strategy because of its asymptotic chaotic features
lime grove
worldly dawn
Right, so you do work at the scale of a single strategy that you want to test. Y...
the goal is to try to break the strategy by changing whatever parameters it has. This is very similar to the scientific method, where a hypothesis is formulated using some sort of model, and then experiments are run that try to disprove it
in a way this leads to simpler strategies, which is what quants usually prefer. It has to be parsimonious, like science.
worldly dawn
lime grove
the goal is to try to break the strategy by changing whatever parameters it has....
okay, I think I get what you are trying to say.
When you say:
You don't backtest a single strategy, but a family of them, and then finagle the stats.
You don't mean a family of strategies as in, different strategies. You mean the same strategy in different conditions/parameters so that you aren't overfitting
In this case, I would agree
lime grove
I think we got stuck in semantics.
worldly dawn
Perhaps, but that is quite important. Sometimes you do want to run multiple strategies for their correlation properties (or rather lack of)