#data-science-and-ml
1 messages · Page 116 of 1
 desert oar
 coral lotus
it says no module named jsonschema, but pretty sure that exists
coral lotus
it says no module named jsonschema, but pretty sure that exists
what are the setup/installation instructions for this project?
if you followed them and you are sure that you installed jsonschema, you might be using the wrong python environment in vscode
did you create a venv? conda env? did you pip install some things?
coral lotus
there instructions are almost non-existent, would you mind taking a look to see if you understand anything? because i dindt really get much out of it (https://github.com/broadinstitute/keras-rcnn)
GitHub
Keras package for region-based convolutional neural networks (RCNNs) - broadinstitute/keras-rcnn
coral lotus
desert oar
did you create a venv? conda env? did you pip install some things?
yes
i pip installed all the requirements
like numpy, keras, scikit-image, etc
wait im unsure about the env
desert oar
coral lotus
i pip installed all the requirements
okay. and you're on windows -- how did you install python? python.org installer? windows store? something else?
coral lotus
windows store
desert oar
ok. in the future i recommend the python.org installer. i've seen people have problems with the windows store in the past. but it's fine for now
coral lotus
ok i mean, i could change it if necessary but i dont think thats where the problem comes from
desert oar
did you do anything that looked like python -m venv or anything that otherwise looked like a "virtual environment"?
coral lotus
nope
venv: error: the following arguments are required: ENV_DIR
tried running that right now but got this
desert oar
coral lotus
```venv: error: the following arguments are required: ENV_DIR```
don't just run commands randomly. pause
desert oar
coral lotus
nope
on the command line, what does py ---list show?
coral lotus
desert oar
on the command line, what does `py ---list` show?
Try `python -h' for more information.
desert oar
coral lotus
says py isnt recognized, should i try python ---list
no. this is why the windows installer is a bad idea
the official python installer includes a helper script called py that helps you manage multiple python installations
the windows store apparently does not
so it will be harder to debug if you happen to have multiple python installations on your PC coexisting
coral lotus
oh i see, should i switch to the official python?
desert oar
for now it's fine because i assume you only have 1 version of python installed
coral lotus
yeah
desert oar
but in the future yes, i suggest uninstalling this and installing the official python instead from python.org
so you just ran pip install without any futher setup?
coral lotus
yeah pretty much, ok wait i just did pip install jsonschema and it worked
so ill try rerunning the program
desert oar
it's possible you just missed it. but in the future i strongly suggest creating a "virtual environment" for each project. this ensures that libraries from different projects do not conflict with each other. it sounds like a vague threat until you're in the middle of something for school or work and your python stops working.
coral lotus
ok yeah its working a bit better, but i think the versions of the install being the latest isnt necessarily a good thing because now theres another issue
coral lotus
desert oar
it's possible you just missed it. but in the future i _strongly_ suggest creatin...
sure ill do that for the next one
Traceback (most recent call last):
  File "c:\Users\parth\OneDrive\Desktop\keras-rcnn0\keras-rcnn\main.py", line 28, in <module>
    target, _ = generator.next()
                ^^^^^^^^^^^^^^^^
  File "c:\Users\parth\OneDrive\Desktop\keras-rcnn0\keras-rcnn\keras_rcnn\preprocessing\_object_detection.py", line 90, in next
    return self._get_batches_of_transformed_samples(selection)
           ^^^^^^^^^^^^^^^^^^^^^^^^^^^^^^^^^^^^^^^^^^^^^^^^^^^
  File "c:\Users\parth\OneDrive\Desktop\keras-rcnn0\keras-rcnn\keras_rcnn\preprocessing\_object_detection.py", line 171, in _get_batches_of_transformed_samples
    x = self._transform_samples(batch_index, image_index)
        ^^^^^^^^^^^^^^^^^^^^^^^^^^^^^^^^^^^^^^^^^^^^^^^^^
  File "c:\Users\parth\OneDrive\Desktop\keras-rcnn0\keras-rcnn\keras_rcnn\preprocessing\_object_detection.py", line 236, in _transform_samples
    image = skimage.transform.rescale(
            ^^^^^^^^^^^^^^^^^^^^^^^^^^
  File "C:\Users\parth\AppData\Local\Packages\PythonSoftwareFoundation.Python.3.11_qbz5n2kfra8p0\LocalCache\local-packages\Python311\site-packages\skimage\_shared\utils.py", line 438, in fixed_func
    return func(*args, **kwargs)
           ^^^^^^^^^^^^^^^^^^^^^
TypeError: rescale() got an unexpected keyword argument 'multichannel'```says unexpected keyword argument multichannel, just searched this up and apparently a fix was using an older version of scikit or smth like that
desert oar
coral lotus
sure ill do that for the next one
you can do it for this one too. a virtual environment is a folder that acts like a "virtual" python installation. you run python -m venv the\folder\name. then you can run the\folder\name\Scripts\pip and the\folder\name\Scripts\python, and you can configure your vs code project to use those
coral lotus
because the project repo hasnt been updated in years
desert oar
coral lotus
because the project repo hasnt been updated in years
they list specific requirements, did you install those? https://github.com/broadinstitute/keras-rcnn?tab=readme-ov-file#requirements
GitHub
Keras package for region-based convolutional neural networks (RCNNs) - broadinstitute/keras-rcnn
keras-resnet==0.2.0

numpy==1.16.2

tensorflow==1.13.1

Keras==2.2.4

scikit-image==0.15.0
brb a min
coral lotus
desert oar
they list specific requirements, did you install those? https://github.com/broad...
cant it be anything later than those requirements, according the the setup file at least?
install_requires=[
        "jsonschema>=3.2.0",
        "keras>=2.3.1",
        "keras-resnet>=0.2.0",
        "scikit-image>=0.17.2",
],```Try changing that to match the exact version in the readme just to see
coral lotus
how do i do that again 😭
pip uninstall jsonschema and then pip install jsonschema version==3.2.0?
desert oar
no need to uninstall first
coral lotus
ok ill try that but im not sure it will work because those versions are several years old
desert oar
just pip install jsonschema==3.2.0
coral lotus
alright lemme try
desert oar
this is a great example of why installing everything in the base python environment is a bad idea. you can't have multiple versions of a package installed at the same time
coral lotus
it worked for jsonschema, ill do it for the rest
Installing collected packages: pyyaml, keras-preprocessing, keras-applications, keras
  Attempting uninstall: keras
    Found existing installation: keras 3.2.1
    Uninstalling keras-3.2.1:
      Successfully uninstalled keras-3.2.1
ERROR: pip's dependency resolver does not currently take into account all the packages that are installed. This behaviour is the source of the following dependency conflicts.
tensorflow-intel 2.16.1 requires keras>=3.0.0, but you have keras 2.3.1 which is incompatible.
Successfully installed keras-2.3.1 keras-applications-1.0.8 keras-preprocessing-1.1.2 pyyaml-6.0.1```i dont think the tensorflow will work?
keras-resnet==0.2.0
numpy==1.16.2
tensorflow==1.13.1
Keras==2.2.4
scikit-image==0.15.0
should i just try doing all of these
desert oar
if this were a virtual environment I would say to just delete it and start over, but you installed into the base environment so it's hard to fix this
desert oar
coral lotus
keras-resnet==0.2.0
numpy==1.16.2
tensorflow==1.13.1
Keras==2.2.4
scikit-ima...
yes
coral lotus
ok ill try these then
coral lotus
oh ok lemme try it one sec
desert oar
better yet put those lines into a file requirements.txt and then run pip install -r requirements.txt. the name requirements.txt is a longstanding convention for this purpose
coral lotus
pip install keras-resnet==0.2.0 numpy==1.16.2 tensorflow==1.13.1 Keras==2.2.4 scikit-image==0.15.0, just ran this
coral lotus
desert oar
better yet put those lines into a file `requirements.txt` and then run `pip inst...
oh ok ill do that if this doesnt work
tensorflow-intel 2.16.1 requires keras>=3.0.0, but you have keras 2.3.1 which is incompatible```so i got thsi error
desert oar
coral lotus
oh ok ill do that if this doesnt work
they will work the same, but the requirements file is easier
coral lotus
ERROR: Could not find a version that satisfies the requirement tensorflow==1.13.1 (from versions: 2.12.0rc0, 2.12.0rc1, 2.12.0, 2.12.1, 2.13.0rc0, 2.13.0rc1, 2.13.0rc2, 2.13.0, 2.13.1, 2.14.0rc0, 2.14.0rc1, 2.14.0, 2.14.1, 2.15.0rc0, 2.15.0rc1, 2.15.0, 2.15.1, 2.16.0rc0, 2.16.1)
ERROR: No matching distribution found for tensorflow==1.13.1```and this as well
desert oar
coral lotus
```ERROR: pip's dependency resolver does not currently take into account all the...
yes this is because you already installed later versions into the environment
coral lotus
oh shoot
desert oar
coral lotus
and this as well
ugh, it looks like tensorflow 1.x is removed from pypi? that's ridiculous
what Python version are you using?
try an older one like 3.8
coral lotus
desert oar
yes this is because you already installed later versions into the environment
would i be able to fix this if i just deleted the project, forked it again from the public repo and restarted?
desert oar
- install 3.8 from python.org
- create a venv
- get again using the venv
coral lotus
or would it not work since i installed these (using pipinstall) to my computer
desert oar
coral lotus
would i be able to fix this if i just deleted the project, forked it again from ...
the git repo has nothing to do with it
desert oar
coral lotus
or would it not work since i installed these (using pipinstall) to my computer
correct
coral lotus
desert oar
correct
but would using a venv this time around bypass this
desert oar
i actually suggest just uninstalling 3.11 as well
coral lotus
would i have to do that? or would just making a venv be enough do you think
desert oar
coral lotus
but would using a venv this time around bypass this
it won't bypass the problem of the package being unavailable for your python version, but it will bypass the problem of accidentally installing the wrong thing once and being left with a busted environment that will be hard to clean up
coral lotus
ohh, ok so the repo just says it required python 3
desert oar
coral lotus
would i have to do that? or would just making a venv be enough do you think
venv would be fine. but you now also have some weird stuff installed into the base 3.11 environment and you might as well clean it up at some point
coral lotus
doesnt specify which version
desert oar
coral lotus
ohh, ok so the repo just says it required python 3
right, but they might not have packaged older unsupported versions of tensorflow for newer versions of python
coral lotus
ok so i found on python.org that the latest is 3.12.3
but i should install python 3.8 right
desert oar
tensorflow is complicated and requires a large amount of compiled code to work, so it needs to be packaged for a specific python version
coral lotus
the repo is from 6 years ago, should i just research which python version was the latest at the time in 2018

yeah so 3.7 or 3.8
wait theres tons of versoins
desert oar
 coral lotus
like 3.8.1, 3.8.2 etc, which one do i get
desert oar
go to "download files" - you can see which python versions are supported based on the file names
coral lotus
desert oar
https://pypi.org/project/tensorflow/1.13.1/
only goes to python 3.6?
ok sure let me check
desert oar
CPython 3.7m Windows x86-64
coral lotus
 desert oar
so 3.8 wouldn't work here either. try 3.7
coral lotus
so what would that mean
desert oar
so you might be able to try this with a later version of tensorflow, just avoid going beyond 2.0
desert oar
coral lotus
so what would that mean
nothing really, but definitely avoid using it for new projects
 desert oar
yeah, its end of life was last year
coral lotus
oh i see, ok ill install that right now
https://www.python.org/downloads/release/python-3717/, what do i even click on
desert oar
it looks like they don't offer an installer anymore
that's unfortunate. you can probably download it from somewhere but that might not be worth the effort
try 3.8
coral lotus
but the tensorflow version required wouldnt work with 3.8 right?
desert oar
yeah, try tensorflow<2.0 instead of tensorflow==1.13.1
you will need to put that in quotes
or use the requirements file
coral lotus
ok yeah ill just use the requirements file
desert oar
usually the requirements file makes it easier to manage things
desert oar
i'm going to log off, good luck with this
 neon onyx
Hi, can someone help me to find something like Excel's GRG Nonlinear solver in Python?
 spring field
neon onyx
Hi, can someone help me to find something like Excel's GRG Nonlinear solver in P...
spring field
neon onyx
Hi, can someone help me to find something like Excel's GRG Nonlinear solver in P...
something like this? https://numpy.org/doc/stable/reference/generated/numpy.polyfit.html
neon onyx
I tried using this, https://docs.scipy.org/doc/scipy/tutorial/optimize.html#unconstrained-minimization-of-multivariate-scalar-functions-minimize, but I am not getting the same results as when I am running it through excel's GRG solver function.
neon onyx
spring field
something like this? <https://numpy.org/doc/stable/reference/generated/numpy.pol...
I am quite new to this. How would you model an optimization problem with constraints to be solved using this ?
spring field
I'm sorry, but I have no clue about what you just said and not because you weren't clear enough, but rather my lack of understanding of any of those terms 😅
 leaden narwhal
Hey guys so i did my lstm code and plotted these results

i want to get the predictions
in a table like this
(without the grid_id)

how can i do this
 severe inlet
may i ask what are considered "higher level libraries" for collaborative filtering? ive implemented my own matrix factorization, thinking of what libraries to compare it to
 past meteor
severe inlet
past meteor
severe inlet
thank you
is the surprise package/library considered higher level?
im not exactly sure whats higher/lower levels
past meteor
me neither and I'm not sure it matters 😄
If the package is ergonomic enough to get the task done quickly it's fine
and that depends on who is using it of course
leaden narwhal
leaden narwhal
(without the grid_id)
@past meteor do you know how you can help me with this
past meteor
leaden narwhal
Hey guys so i did my lstm code and plotted these results
Can't you make the input of whatever you're plotting a column in a dataframe?
I don't fully understand your question
leaden narwhal
past meteor
Can't you make the input of whatever you're plotting a column in a dataframe?
basically im trying to predict for every grid the far right column for future date times
and im so lost
past meteor
Can you show like the last 3-5 lines of code before you make that plot
You can put it in 3 backticks ``` like this to make a code block
leaden narwhal
past meteor
You can put it in 3 backticks \`\`\` like this to make a code block
nvm that code block cause i was trying to make a prediction with lstms only on a tempora level and it isnt correct
im super burned out i cant even rationalize properly kkkkkk
 lapis sequoia
scam
severe inlet
past meteor
me neither and I'm not sure it matters 😄
gotcha, thanks
past meteor
<@&831776746206265384>
 sudden canyon
!ban 1216487487313281138 Scam
 arctic wedgeBOT
:incoming_envelope: :ok_hand: applied ban to @rain patrol permanently.
past meteor
leaden narwhal
im super burned out i cant even rationalize properly kkkkkk
Consider going back to the basics so you're sure you know what you're doing 🙂
leaden narwhal
past meteor
Consider going back to the basics so you're sure you know what you're doing 🙂

 pearl marlin
Hi everyone, I am new here and I started teaching myself to become a data scientist. Does anyone have some tips and recommendations when it comes to self study and practicing. I kind of have the roadmap to get me there but I don’t necessary know how to apply the knowledge. I am currently learning Python and my next steps are: learn Math skills (statistics), learn SQL, data visualization, applied machine learning, business knowledge. I am planning on using the Coursera courses. Anything else to consider? Also, how do I apply any of the knowledge best way? Thanks
 wary vine
👋 Hi everyone!
I'm working on a sentiment analysis problem using PyTorch in Google Colab, and I need some assistance to solve some issues I'm encountering. Specifically, I'm trying to adapt a BiLSTM model to a GRU model, but I'm having some difficulties with training the model on the GPU.
I've prepared a Jupyter notebook with my code and details of the problem I'm facing. Could you help me take a look and suggest how to resolve this issue?
Also, if anyone has experience using PyTorch with GRU models and has suggestions on how to use it more effectively, I would greatly appreciate it!
Thanks a lot in advance for your help!
why don't you aswer me? I do something against the rule?
 wooden sail
nope, but here are some tips:
- maybe the pytorch experts are currently unavailable
- if you could already show the error message or describe the problem you're having, that'll make people more likely to take interest in the problem, instead of having to extract info from you 😛
 serene scaffold
wary vine
👋 Hi everyone!
I'm working on a sentiment analysis problem using PyTorch in Go...
serene scaffold
wary vine
👋 Hi everyone!
I'm working on a sentiment analysis problem using PyTorch in Go...
Hello, be sure to always show the code and the error message as text (not a screenshot).
 long canopy
brace for Llama3
 paper gull
Is an i3 Intel CPU adequate for running artificial intelligence applications?
 lofty thorn
import cv2
import numpy as np
img1 = cv2.imread(hello1.png)
img2 = cv2.imread(hello2.png)

img1 = cv2.resize(img1(300,300))
img2 = cv2.resize(img2(300,300))

new = cv2.bitwise_and(img1,img2)

h = np.hstack(img1,img2)

cv2.imshow('WIZARD', h)

cv2.waitKey(0)
cv2.destroyAllWindows()```
i can't find any error in this`--------------------------------------------------------------------------
NameError Traceback (most recent call last)
Cell In[16], line 1
----> 1 img1 = cv2.imread(hello1.png)
2 img2 = cv2.imread(hello2.png)
4 img1 = cv2.resize(img1(300,300))
NameError: name 'hello1' is not defined`
serene scaffold
lofty thorn
`--------------------------------------------------------------------------
Name...
you have to put file paths in quotes.
unless you already have it as a variable
!paste
arctic wedgeBOT
Pasting large amounts of code
If your code is too long to fit in a codeblock in Discord, you can paste your code here:
https://paste.pythondiscord.com/
After pasting your code, save it by clicking the Paste! button in the bottom left, or by pressing CTRL + S. After doing that, you will be navigated to the new paste's page. Copy the URL and post it here so others can see it.
serene scaffold
@wary vine please follow the instructions here ^
lofty thorn
---------------------------------------------------------------------------
TypeError                                 Traceback (most recent call last)
Cell In[17], line 4
      1 img1 = cv2.imread('hello1.png')
      2 img2 = cv2.imread('hello2.png')
----> 4 img1 = cv2.resize(img1(300,300))
      5 img2 = cv2.resize(img2(300,300))
      7 new = cv2.bitwise_and(img1,img2)

TypeError: 'numpy.ndarray' object is not callable```what type is img1?
lofty thorn
png?
serene scaffold
that's the file extension of "hello1.png". but img1 is a numpy array
past meteor
lofty thorn
```
---------------------------------------------------------------------------
...
img1 = cv2.resize(img1, (300,300))
serene scaffold
past meteor
`img1 = cv2.resize(img1, (300,300))`
giving away the answer smh 😛
past meteor
Oh I thought it was a typo and they just forgot the comma's
serene scaffold
it is
@lofty thorn since you forgot the comma, you did img1(300,300), which tried to call img1 like it's a function. so that's why the error message says "numpy array object is not callable"
Python treated it the same way as print(300, 300)
lofty thorn
ok
wary vine
serene scaffold
<@770659613091692594> please follow the instructions here ^
Where I can find the rules to send code?
serene scaffold
wary vine
Where I can find the rules to send code?
the message immediately above that message, from the Python bot.
serene scaffold
@wary vine If your code is too long to fit in a codeblock in Discord, you can paste your code here:
https://paste.pythondiscord.com/
After pasting your code, save it by clicking the Paste! button in the bottom left, or by pressing CTRL + S. After doing that, you will be navigated to the new paste's page. Copy the URL and post it here so others can see it.
 tiny venture
Hi, can anyone please help with this. I have been stuck on it for a long time and can't figure out why it isn't working. It's about using Pandas in Python and creating pie plots in a single figure. Thanks!

 wary vine
serene scaffold
what's the error message?
wary vine
serene scaffold
what's the error message?
Can I send a screen of the error?
serene scaffold
wary vine
Can I send a screen of the error?
Please always share text as actual text, not a screenshot
tiny venture
It keeps saying "pie requires either y column or 'subplots=True'" but I literally have subplots=True
wary vine
serene scaffold
Please always share text as actual text, not a screenshot
Always with link?
serene scaffold
tiny venture
Hi, can anyone please help with this. I have been stuck on it for a long time an...
Hello, please share the code and error message as actual text. Also, your second screenshot doesn't show the full error message.
serene scaffold
wary vine
Always with link?
if it's too big to put in the chat then yes
tiny venture
serene scaffold
Hello, please share the code and error message as actual text. Also, your second...
Hi, so sorry about that. I'll do that now. Thanks
Code:
import pandas as pd
import numpy as np
import matplotlib.pyplot as plt
plt.rcParams["figure.figsize"] = (6,5)
import seaborn as sns
states = pd.DataFrame([[2523924, 2667130, 'Perth', 'WA'],
[1723030, 5184847, 'Brisbane', 'QLD'],
[1334404, 246500, 'Darwin', 'NT'],
[979651, 1770591, 'Adelaide', 'SA'],
[801137, 8166369, 'Sydney', 'NSW'],
[227038, 6680648, 'Melbourne', 'VIC'],
[64519, 541071, 'Hobart', 'TAS'],
[2358, 431215, 'Canberra', 'ACT']],
columns=['area','population','capitals', 'state'])
plot = states.plot.pie(subplots=True, figsize=(11, 6))
serene scaffold
!paste
arctic wedgeBOT
Pasting large amounts of code
If your code is too long to fit in a codeblock in Discord, you can paste your code here:
https://paste.pythondiscord.com/
After pasting your code, save it by clicking the Paste! button in the bottom left, or by pressing CTRL + S. After doing that, you will be navigated to the new paste's page. Copy the URL and post it here so others can see it.
serene scaffold
@tiny venture I guess your error message has "TypeError: '<' not supported between instances of 'str' and 'int'"?
tiny venture
tiny venture
serene scaffold
<@446920351356813312> I guess your error message has "TypeError: '<' not support...
Yup that's the one
I am so lost on how to fix it
It's driving me insane to be honest
serene scaffold
yeah, so the problem is that it doesn't make sense to have pie charts of the capitals and states columns, since they're non-numeric
tiny venture
serene scaffold
yeah, so the problem is that it doesn't make sense to have pie charts of the cap...
I thought subplots=True makes it so only the numeric columns are counted?
But I guess not
serene scaffold
tiny venture
I thought subplots=True makes it so only the numeric columns are counted?
guess not. I was able to produce this, though (thanks for giving the data!)
 tiny venture
This is what the pandas thing said
 serene scaffold
I also set states as the index.
tiny venture
But it isn't working as they said
serene scaffold
weird. what version of pandas are you using? and what version is that docs for?
wary vine
wary vine
https://paste.pythondiscord.com/XVMA
that's my error @serene scaffold
tiny venture

 tiny venture
serene scaffold
weird. what version of pandas are you using? and what version is that docs for?
tiny venture
serene scaffold
weird. what version of pandas are you using? and what version is that docs for?
To be honest I have no idea
Is there a way I can check?
serene scaffold
tiny venture
To be honest I have no idea
print(pd.__version__)
serene scaffold
tiny venture
yeah, well your only columns are numeric. the index isn't a column.
tiny venture
serene scaffold
yeah, well your only columns are numeric. the index isn't a column.
Would you know how to fix this by any chance
serene scaffold
tiny venture
Would you know how to fix this by any chance
when you make the states dataframe, make it so that capitals is the index
and then make pie charts for just the two numeric columns separately
and it looks like the docs are indeed wrong.
tiny venture
serene scaffold
and it looks like the docs are indeed wrong.
Oh wow that really sucks
serene scaffold
I can submit a ticket for them to fix it. I'll credit you. what name should I use for you?
tiny venture
serene scaffold
I can submit a ticket for them to fix it. I'll credit you. what name should I us...
You don't have to credit me it's all good
serene scaffold
@wary vine I haven't forgotten you
tiny venture
I don't mind at all
serene scaffold
@wary vine so you have hidden = torch.cat((hidden_state[-2,:,:], hidden_state[-1,:,:]), dim = 1), but hidden_state is two-dimensional. and [-2,:,:] is a three-dimensional slice.
if you want to insert a new "empty" dimension, you do None instead of :
tiny venture
states = pd.DataFrame([[2523924, 2667130, 'Perth', 'WA'],
[1723030, 5184847, 'Brisbane', 'QLD'],
[1334404, 246500, 'Darwin', 'NT'],
[979651, 1770591, 'Adelaide', 'SA'],
[801137, 8166369, 'Sydney', 'NSW'],
[227038, 6680648, 'Melbourne', 'VIC'],
[64519, 541071, 'Hobart', 'TAS'],
[2358, 431215, 'Canberra', 'ACT']],
index=['area','population','capitals', 'state'])
I tried this now but I don't think this is working either
serene scaffold
tiny venture
states = pd.DataFrame([[2523924, 2667130, 'Perth', 'WA'],
...
that's not right. the index are the labels for the rows. but those are supposed to be the labels for the columns
serene scaffold
tiny venture
So we want area, population, capitals, state as the columns?
right. add .set_index('state') to the end of the expression that creates the dataframe
tiny venture
import pandas as pd
import numpy as np
import matplotlib.pyplot as plt
plt.rcParams["figure.figsize"] = (6,5)
import seaborn as sns
states = pd.DataFrame([[2523924, 2667130, 'Perth', 'WA'],
[1723030, 5184847, 'Brisbane', 'QLD'],
[1334404, 246500, 'Darwin', 'NT'],
[979651, 1770591, 'Adelaide', 'SA'],
[801137, 8166369, 'Sydney', 'NSW'],
[227038, 6680648, 'Melbourne', 'VIC'],
[64519, 541071, 'Hobart', 'TAS'],
[2358, 431215, 'Canberra', 'ACT']],
columns=['area','population','capitals', 'state'].set_index('state'))
Like this?
I'm so sorry I'm quite lost with this stuff
serene scaffold
tiny venture
import pandas as pd
import numpy as np
import matplotlib.pyplot as plt
plt.rcPar...
no. it would be columns=['area','population','capitals', 'state']).set_index('state')
it's called method chaining. it's the same as doing something like " hello ".strip().upper()
tiny venture
serene scaffold
it's called method chaining. it's the same as doing something like `" he...
I've never learnt this so I'm not quite sure what it is
import pandas as pd
import numpy as np
import matplotlib.pyplot as plt
plt.rcParams["figure.figsize"] = (6,5)
import seaborn as sns
states = pd.DataFrame([[2523924, 2667130, 'Perth', 'WA'],
[1723030, 5184847, 'Brisbane', 'QLD'],
[1334404, 246500, 'Darwin', 'NT'],
[979651, 1770591, 'Adelaide', 'SA'],
[801137, 8166369, 'Sydney', 'NSW'],
[227038, 6680648, 'Melbourne', 'VIC'],
[64519, 541071, 'Hobart', 'TAS'],
[2358, 431215, 'Canberra', 'ACT']],
columns=['area','population','capitals', 'state']).set_index('state')
Okay I think this worked
wary vine
serene scaffold
<@770659613091692594> so you have `hidden = torch.cat((hidden_state[-2,:,:], hid...
So I've to write like this hidden = torch.cat((hidden_state[-2:], hidden_state[-1:]), dim=1)?
serene scaffold
tiny venture
I've never learnt this so I'm not quite sure what it is
!e
x = "           hello          ".strip()
print(x)
x = "           hello          ".upper()
print(x)
x = "           hello          ".strip().upper()
print(x)
@serene scaffold :white_check_mark: Your 3.12 eval job has completed with return code 0.
001 | hello
002 |            HELLO
003 | HELLO
I can't say for sure if that does exactly what you want. did it at least not cause an error?
tiny venture
Okay so that worked, I tried states.plot.pie again but it's not working
wary vine
serene scaffold
I can't say for sure if that does exactly what you want. did it at least not cau...
https://paste.pythondiscord.com/NTFA there is another error
serene scaffold
wary vine
https://paste.pythondiscord.com/NTFA there is another error
here are two random arrays of shape (2, 3), and we'll say that that's (b, h)
In [24]: a = np.random.random((2, 3))

In [25]: a
Out[25]:
array([[0.49570709, 0.7367471 , 0.05931812],
       [0.79563205, 0.3979543 , 0.77776812]])

In [26]: b = np.random.random((2, 3))

In [27]: b
Out[27]:
array([[0.15381671, 0.722523  , 0.78980366],
       [0.81253715, 0.40874489, 0.42280707]])

In [28]: np.concatenate((a, b))
Out[28]:
array([[0.49570709, 0.7367471 , 0.05931812],
       [0.79563205, 0.3979543 , 0.77776812],
       [0.15381671, 0.722523  , 0.78980366],
       [0.81253715, 0.40874489, 0.42280707]])

In [29]: np.concatenate((a, b), axis=1)
Out[29]:
array([[0.49570709, 0.7367471 , 0.05931812, 0.15381671, 0.722523  , 0.78980366],
       [0.79563205, 0.3979543 , 0.77776812, 0.81253715, 0.40874489, 0.42280707]])

In [30]: np.concatenate((a, b), axis=1).shape
Out[30]: (2, 6)
so this is how you'd concatenate them to get an array of shape (b, 2h)
note that this is using numpy instead of torch, but the logic is the same.
can you print hidden_state.shape @wary vine and tell me what it is?
wary vine
serene scaffold
can you print `hidden_state.shape` <@770659613091692594> and tell me what it is?
after the concat right?
serene scaffold
wary vine
after the concat right?
the concat won't change the shape of hidden_state, since you write the result as hidden. so, either.
wary vine
serene scaffold
the concat won't change the shape of `hidden_state`, since you write the result ...
so I print before?
serene scaffold
wary vine
so I print before?
sure
serene scaffold
tiny venture
Okay so that worked, I tried states.plot.pie again but it's not working
show the updated code and error message
tiny venture
import pandas as pd
import numpy as np
import matplotlib.pyplot as plt
plt.rcParams["figure.figsize"] = (6,5)
import seaborn as sns
states = pd.DataFrame([[2523924, 2667130, 'Perth', 'WA'],
[1723030, 5184847, 'Brisbane', 'QLD'],
[1334404, 246500, 'Darwin', 'NT'],
[979651, 1770591, 'Adelaide', 'SA'],
[801137, 8166369, 'Sydney', 'NSW'],
[227038, 6680648, 'Melbourne', 'VIC'],
[64519, 541071, 'Hobart', 'TAS'],
[2358, 431215, 'Canberra', 'ACT']],
columns=['area','population','capitals', 'state']).set_index('state')
plot = states.plot.pie(subplots=True, figsize=(11, 6))
So that was my code
Actually it says the same thing as before
serene scaffold
tiny venture
Actually it says the same thing as before
right, so you'll have to do the plot.pie thing twice--once for each of the two numeric columns
tiny venture
TypeError: '<' not supported between instances of 'str' and 'int it says this again
tiny venture
serene scaffold
right, so you'll have to do the `plot.pie` thing twice--once for each of the two...
Then is there a way to get them into a single figure?
I think that's what the people want
serene scaffold
tiny venture
Then is there a way to get them into a single figure?
try states.drop(columns='capitals').plot.pie(subplots=True)
tiny venture
Okay I got this now

 wary vine
serene scaffold
sure
wary vine
serene scaffold
sure
I can't print(hidden_state.shape), he didn't show me anything
serene scaffold
and you can include that figsize if you want
serene scaffold
wary vine
I can't print(hidden_state.shape), he didn't show me anything
you're in a notebook, right?
wary vine
serene scaffold
you're in a notebook, right?
Yes
tiny venture
Oh I think I got it maybe
 serene scaffold
wary vine
Yes
serene scaffold
wary vine
Yes
so just make a new cell and run print(hidden_state.shape)
serene scaffold
tiny venture
Oh I think I got it maybe
idk how to make it look right. I hate matplotlib.
tiny venture
Yeah honestly this is all good. Thank you so so much man I appreciate it more than you could ever imagine. Thanks so much.
serene scaffold
tiny venture
Yeah honestly this is all good. Thank you so so much man I appreciate it more th...
you are welcome 💚
soon you'll be obsessed with pandas, too
tiny venture
serene scaffold
idk how to make it look right. I hate matplotlib.
Luckily the next one is Seaborne thing so hopefully it isn't as bad
It's some weird histogram thing
 tiny venture
serene scaffold
you are welcome 💚
soon you'll be obsessed with pandas, too
tiny venture
serene scaffold
you are welcome 💚
soon you'll be obsessed with pandas, too
Yeah I don't know I really doubt it haha
wary vine
No but hidden_state is in GRUModel class
serene scaffold
oh, I see. you need to put the print statement in the forward method.
        packed = pack_padded_sequence(embeds, sequence_lengths, batch_first=True, enforce_sorted=False)

        # comments blah blah
        print(hidden_state.shape)
        packed_output, (hidden_state, cell_state) = self.gru(packed)
and then try running trainer.train so that the print statement gets executed.
wary vine
Training ...
Epoch 1
torch.Size([2, 64])
torch.Size([1, 64])
wary vine
serene scaffold
and then try running `trainer.train` so that the print statement gets executed.
Is this one?
serene scaffold
yeah, that looks right
wary vine
serene scaffold
yeah, that looks right
Training ...
Epoch 1
UnboundLocalError Traceback (most recent call last)
<ipython-input-73-2d42fe55062e> in <cell line: 1>()
----> 1 losses = trainer.train(training_dataloader, validation_dataloader, epochs=10)
3 frames
<ipython-input-69-ba5a76add051> in forward(self, batch)
64 # hidden_state is of size [2 * num_layers, B, H], where the 2 is because we are using BiLSTMs instead of LSTMs.
65 # cell_state has size [2 * num_layers, B, C] where C is the cell dimension of the internal LSTMCell.
---> 66 print(hidden_state.shape)
67 packed_output, (hidden_state, cell_state) = self.gru(packed)
68
UnboundLocalError: local variable 'hidden_state' referenced before assignment
tiny venture
Hey man, sorry to come back again so soon. I just really need to get these tasks done right now. Do you know how to load pre-included sets in Seaborn?
serene scaffold
tiny venture
Hey man, sorry to come back again so soon. I just really need to get these tasks...
no
tiny venture
"Note that the following two exercises use mpg dataset included in Seaborn. You will need to load this data before attempting them."
Ah okay, all good. Thanks so much.
serene scaffold
tiny venture
"Note that the following two exercises use mpg dataset included in Seaborn. You ...
try googling "load mpg dataset seaborn"
serene scaffold
wary vine
Training ...
Epoch 1
---------------------------------------------------------...
okay, put the print statement under packed_output, (hidden_state, cell_state) = self.gru(packed)
tiny venture
Thanks so much.
wary vine
serene scaffold
okay, put the print statement *under* `packed_output, (hidden_state, cell_state)...
torch.Size([128, 64])
serene scaffold
wary vine
torch.Size([128, 64])
is it always that?
wary vine
wary vine
Training ...
Epoch 1
torch.Size([2, 64])
torch.Size([1, 64])
-----------------...
No before was that
serene scaffold
so it's always (n, 64)
In [48]: arr.shape
Out[48]: (128, 64)

In [49]: arr[-2:].shape
Out[49]: (2, 64)

In [50]: arr[-1:].shape
Out[50]: (1, 64)
so doing [-2:] and [-1:] produces 2d arrays/tensors with different sizes in the first dimension. so it's not (b, h) for both
wary vine
serene scaffold
so doing `[-2:]` and `[-1:]` produces 2d arrays/tensors with different sizes in ...
Ok so what I have to do?
serene scaffold
wary vine
Ok so what I have to do?
so you have hidden_state as a tensor with shape (n, 68). if you do hidden_state[-1], that will give you a one-dimensional tensor with 68 elements. and it will be the same as the last row of hidden_state
whereas if you do hidden_state[-2:], that will give you a (2, 68)-shape tensor of the last two rows
        # We take the last two hidden representations of the BiLSTM (the second-to-last layer's output is forward; last
        # layer's is backward) by concatenating forward and backward over dimension 1.
        # Both tensors have shapes of [B, H], so concatenating them along the second dimension (dim 1) results in a new
        # tensor of shape [B, 2 * H]
this seems wrong to me unless we are to assume that B is guaranteed to be 1.
wary vine
yes, in fact, before I used a BiLSTM model:
Then we pass it to the BiLSTM
    # The first output of the BiLSTM tuple, packed_output, is of size B x S x 2H,
    # where B is the batch size, S is the sequence length and H is the hidden dimension
    # hidden_state is of size [2 * num_layers, B, H], where the 2 is because we are using BiLSTMs instead of LSTMs.
    # cell_state has size [2 * num_layers, B, C] where C is the cell dimension of the internal LSTMCell.
    packed_output, (hidden_state, cell_state) = self.bilstm(packed)
Now I'm changing it to self.gru(packed) but I'm not sure how it works
serene scaffold
wary vine
yes, in fact, before I used a BiLSTM model:
# Then we pass it to the BiLSTM
...
remember to use a code block so your comments aren't interpreted as markdown headers
!code
arctic wedgeBOT
wary vine
serene scaffold
remember to use a code block so your comments aren't interpreted as markdown hea...
ok sorry
# Then we pass it to the BiLSTM
        # The first output of the BiLSTM tuple, packed_output, is of size B x S x 2H,
        # where B is the batch size, S is the sequence length and H is the hidden dimension
        # hidden_state is of size [2 * num_layers, B, H], where the 2 is because we are using BiLSTMs instead of LSTMs.
        # cell_state has size [2 * num_layers, B, C] where C is the cell dimension of the internal LSTMCell.
packed_output, (hidden_state, cell_state) = self.bilstm(packed)```I would print the shapes of all of those so that you know what they are. and then you know what B, S, and H are.
wary vine
serene scaffold
I would print the shapes of all of those so that you know what they are. and the...
It seems to print always torch.Size([4,128,64])
serene scaffold
wary vine
It seems to print always torch.Size([4,128,64])
all three?
packed_output, (hidden_state, cell_state) this is three
wary vine
https://colab.research.google.com/drive/1QyBiN35Ix2wzC0g9WVOKkVtyGp6R13Ep
this is the original notebook

 stiff urchin
any good YouTube video recommendations for learning numpy, pandas, matplotlib and tensorflow
serene scaffold
stiff urchin
any good YouTube video recommendations for learning numpy, pandas, matplotlib an...
https://www.youtube.com/playlist?list=PLQVvvaa0QuDfSfqQuee6K8opKtZsh7sA9
https://www.youtube.com/playlist?list=PLQVvvaa0QuDfKTOs3Keq_kaG2P55YRn5v
make sure that you're actively engaging with the video and writing code. you won't passively learn by watching the videos.


 stiff urchin
serene scaffold
https://www.youtube.com/playlist?list=PLQVvvaa0QuDfSfqQuee6K8opKtZsh7sA9
https:/...
stiff urchin
serene scaffold
https://www.youtube.com/playlist?list=PLQVvvaa0QuDfSfqQuee6K8opKtZsh7sA9
https:/...
thank you so much!!
and is there anyway to practice codes? could anyone tell me how can i practice?
 hushed mulch
Anyone know how i can normalize data for a monte carlo simulation? Tracking day to day of revenue and it can range from $0 to $1.9mm. Log normalization isn’t cutting it
 untold hare
@rich condor Since the topic isn't really career related anymore, let's move it here. There are several interpolation and downsampling techniques ranging from the very simple to the very complicated.
If the wizards will excuse my departure from traditional jargon for a moment,
Interpolation can be seen as essentially filling holes in incomplete data.
Downsampling is sortof the opposite, you can picture it as removing data that you might not need to use.
You can read a bit about the easiest form of interpolation (imo) here
https://en.wikipedia.org/wiki/Linear_interpolation

In mathematics, linear interpolation is a method of curve fitting using linear polynomials to construct new data points within the range of a discrete set of known data points.
 random fox
I am trying to make a streamline plot with: plt.streamplot(x_cent, y_cent, u_cent, v_cent). All of those variables have dimensions (16, 16) and are defined as follows:
import numpy as np
from numpy import pi

M, N, L = 16, 16, 2
Δx = L/M; Δy = 1/N

x_cent = np.empty(shape = (M, N))
y_cent = np.empty(shape = (M, N))
for i in range(0, M):
    for j in range(0, N):
        x_cent[i, j] = (i + 1/2)*Δx
        y_cent[i, j] = (j + 1/2)*Δy
u_cent = np.sin(2*pi*x_cent/L)
v_cent = np.sin(pi*y_cent)

import matplotlib.pyplot as plt
plt.streamplot(x_cent, y_cent, u_cent, v_cent)
plt.show()
```But I get a wierd error:
```Traceback (most recent call last):
  File "[filepath]/streamline_test.py", line 17, in <module>
    plt.streamplot(x_cent, y_cent, u_cent, v_cent)
  File "/opt/homebrew/lib/python3.12/site-packages/matplotlib/pyplot.py", line 3888, in streamplot
    __ret = gca().streamplot(
            ^^^^^^^^^^^^^^^^^
  File "/opt/homebrew/lib/python3.12/site-packages/matplotlib/__init__.py", line 1465, in inner
    return func(ax, *map(sanitize_sequence, args), **kwargs)
           ^^^^^^^^^^^^^^^^^^^^^^^^^^^^^^^^^^^^^^^^^^^^^^^^^
  File "/opt/homebrew/lib/python3.12/site-packages/matplotlib/streamplot.py", line 91, in streamplot
    grid = Grid(x, y)
           ^^^^^^^^^^
  File "/opt/homebrew/lib/python3.12/site-packages/matplotlib/streamplot.py", line 331, in __init__
    raise ValueError("The rows of 'x' must be equal")
ValueError: The rows of 'x' must be equal
```I'm having some difficulty determining why this is the case. Any ideas?If I plot the grid this uses:```
plt.scatter(x_cent, y_cent)
plt.plot(np.array([0, L, L, 0, 0]), np.array([0, 0, 1, 1, 0]), linestyle = 'dashed')
 random fox
As it turns out, streamplot does not want ij indexing. Easy enough to fix:py plt.streamplot(x_cent.T, y_cent.T, u_cent.T, v_cent.T)
 hidden reef
Anyone know just how large a dataset would be before pandas/python crashes/slows down with 0 optimizations. Like a rough estimate. This is hypothetical but my program should be able to handle 10-30 million entries with certain fields being like 140k words in size....
 mossy otter
hey guys i am good in python and mathematics ... can i start Machile learning from it
or should i go for other languages also
 tidal bough
hidden reef
Anyone know just how large a dataset would be before pandas/python crashes/slows...
tidal bough
hidden reef
Anyone know just how large a dataset would be before pandas/python crashes/slows...
well, pandas can't by itself process datasets that don't fit into your memory (well, not without writing your code for that). if the dataset comfortably fits into your RAM, you should be fine. if not, you'll need a different library like dask, or polars in streaming mode.
 flat token
need help with my problem for crank nicolson implementation of black-scholes transformed heat equation https://colab.research.google.com/drive/15vN9621QVy36_prErLeX40tvOWRXdybs?authuser=2#scrollTo=BfFRdeysDdL- i cant seem to properly transform my variables (commented out code at the bottom under function crank_nicolson_heat_matrix() and I could use some help
desert oar
hushed mulch
Anyone know how i can normalize data for a monte carlo simulation? Tracking day ...
what kind of monte carlo simulation?
desert oar
hidden reef
Anyone know just how large a dataset would be before pandas/python crashes/slows...
it depends on what you're doing with all that data. pandas can handle it and it won't be too horribly slow, but 10+ million is where it definitely starts to slow down on a typical dev workstation. and of course you are limited by memory, as reptile said. i'd suggest dask, polars, or duckdb for higher performance on bigger datasets. but maybe if you have 30 million long text documents you might want to avoid "data frames" all together and just stream content in chunks from the filesystem (the gensim library used to have support for this kind of thing, not sure if people still use that)
the simple days when topic models and word vectors were state of the art
desert oar
mossy otter
hey guys i am good in python and mathematics ... can i start Machile learning fr...
yes, this is a good foundation for machine learning. you don't need other programming languages.
 junior trail
hi, not sure if this is the right channel to ask, please redirect me if it is, but thanks for taking a look!
i'm trying to create a packed bubble chart distributed across x axis and sorted by magnitude. see attached image for example of what i'm envisioning.
I found something close to what i'm looking for on matplotlib https://matplotlib.org/stable/gallery/misc/packed_bubbles.html#packed-bubble-chart, but i'm having trouble getting the distribution on the x-axis (horizontally) and sorted (decreasing). would appreciate any help please 🙏

 fallen steppe
Hey I'm trying to convert my resnet50 .h5 file to .tflite but I'm getting this error. Please help ASAP. I've got a tight project deadline coming up. Thankyou.
 junior trail
fallen steppe
Hey I'm trying to convert my resnet50 .h5 file to .tflite but I'm getting this e...
junior trail
fallen steppe
Hey I'm trying to convert my resnet50 .h5 file to .tflite but I'm getting this e...
i mean you got a nice error output to help you right there. what don't you understand?
Exception encountered: Unrecognized arguments: ['batch_shape']
i'm just guessing off intuition, but whatever is consuming your config doesn't recognize your key 'batch_shape'
fallen steppe
I'm not a AI person but I'm using ml for a project. I have retrained a model from kaggle with my dataset. But I'm trying to convert and inget this error
And the batch_shape is none, it's running on Google colab
I've got this same error try every possible steps of conversion
junior trail
yeah sorry i have no idea. not enough context and isn't my area of expertise. i just read the error and it seemed to tell you exactly what the issue is
fallen steppe
Oh alright
junior trail
i'd check if you have the right dependencies first. i did an quick google search and found this https://community.st.com/t5/stm32-mcus-machine-learning-ai/unrecognized-keyword-arguments-batch-shape-with-loading-keras/td-p/650324
I have this working keras model: https://www.dropbox.com/scl/fi/544ma5tsndw3cjv8djem0/model.keras?rlkey=87845alu8vki9y81kb7tjgrab&dl=1 and I am trying to load it into X-CUBE-AI 8.1.0 When I hit Analyze I get this error: Neural Network Tools for STM32 family v1.7.0 (stm.ai v8.1.0-19520) E010(In...
looks basically identical to what your issue is since you're both using the same model
never heard of keras, but looks pretty cool. thanks fo rsharing
fallen steppe
Ye lme check
Nope not the fix 😭
Do i have to convert the .h5 to .tflite during training itself? Which i tried but that doesn't give me any error but it doesn't save the file nor do i get any error
This is that code
 severe inlet
how do i get from this multi index dataframe

to this? where ratings are the values in the previous image

ive tried .melt but it doesnt work. most likely due to me not knowing how to map the values to the 'rating' column from wide to long
 dim quartz
guys
how do i make a word suggester?
liike my program should analyze a sentence and suggest a word from a list of words that will fit in the sentence making it gramatically correct and also fitting the context?
 jaunty helm
severe inlet
ive tried .melt but it doesnt work. most likely due to me not knowing how to map...
jaunty helm
severe inlet
ive tried .melt but it doesnt work. most likely due to me not knowing how to map...
doesn't work
elaborate? seems fine to me
>>> import pandas as pd
>>> mi = pd.MultiIndex.from_tuples([('one', 'a'), ('one', 'b'), ('two', 'a'), ('two', 'b')])
>>> import numpy as np
>>> df = pd.DataFrame(np.random.randn(3, 4), columns=mi)
>>> df
        one                 two
          a         b         a         b
0 -0.449963 -0.346361  0.320374  2.424784
1  0.547282  0.320869  2.188978 -0.587914
2 -0.533678 -0.240189 -0.644123  0.504926
>>> df.melt()
   variable_0 variable_1     value
0         one          a -0.449963
1         one          a  0.547282
2         one          a -0.533678
3         one          b -0.346361
4         one          b  0.320869
5         one          b -0.240189
6         two          a  0.320374
7         two          a  2.188978
8         two          a -0.644123
9         two          b  2.424784
10        two          b -0.587914
11        two          b  0.504926
>>>
im on the commute now, dont have my laptop open. but i got some error about the keys being unavailable
also my df is alittle different from your example. the index are 'userID' with column name 'songID'
desert oar
junior trail
hi, not sure if this is the right channel to ask, please redirect me if it is, b...
it looks like your bubble algorithm needs to only "collapse" vertically and not horizontally, whereas theirs i think collapses in both x and y directions
 unkempt sky
Hi, all. I am very familiar with Python, but I'd like to learn AI.
How can I learn AI ?
serene scaffold
unkempt sky
How can I learn AI ?
AI is a broad technical area. Are you interested in AI in general, or in machine learning? most applications these days are in machine learning.
severe inlet
jaunty helm
> doesn't work
elaborate? seems fine to me
```py
>>> import pandas as pd
>>> mi ...
the userID column is not there after .melt()

i assume its the index, which has now blown up from 21k to 140mil
jaunty helm
severe inlet
the userID column is not there after .melt()
you can do .melt(ignore_index=False)
well actually that'll keep it as an index instead of a distinct column, which may not be what you want
>>> import pandas as pd
>>> mi = pd.MultiIndex.from_tuples([('one', 'a'), ('one', 'b'), ('two', 'a'), ('two', 'b')])
>>> import numpy as np
>>> df = pd.DataFrame(np.random.randn(3, 4), columns=mi, index=['x', 'y', 'z'])
>>> df
        one                 two
          a         b         a         b
x -1.061667 -0.548362 -0.280141 -0.210540
y  0.294772 -0.922063 -1.570218 -1.030330
z -0.273203  0.777485 -1.134205  0.463266
>>> df.reset_index()
  index       one                 two
                a         b         a         b
0     x -1.061667 -0.548362 -0.280141 -0.210540
1     y  0.294772 -0.922063 -1.570218 -1.030330
2     z -0.273203  0.777485 -1.134205  0.463266
>>> df.reset_index().melt(id_vars='index')
   index variable_0 variable_1     value
0      x        one          a -1.061667
1      y        one          a  0.294772
2      z        one          a -0.273203
3      x        one          b -0.548362
4      y        one          b -0.922063
5      z        one          b  0.777485
6      x        two          a -0.280141
7      y        two          a -1.570218
8      z        two          a -1.134205
9      x        two          b -0.210540
10     y        two          b -1.030330
11     z        two          b  0.463266
>>>
>>> df.melt(ignore_index=False)
  variable_0 variable_1     value
x        one          a -1.061667
y        one          a  0.294772
z        one          a -0.273203
x        one          b -0.548362
y        one          b -0.922063
z        one          b  0.777485
x        two          a -0.280141
y        two          a -1.570218
z        two          a -1.134205
x        two          b -0.210540
y        two          b -1.030330
z        two          b  0.463266
kernel crashed 💀
jaunty helm
severe inlet
kernel crashed 💀
tbf you have a lot of data
jaunty helm
like 2.8e8 cells after .melting
severe inlet
im working on another thing with the dataset now
jaunty helm
alr gl
severe inlet
i dont even know if my pca implementation works
severe inlet
jaunty helm
alr gl
thank u very much for the help
 wary cosmos
With ReLU as the activation and assuming mean 0 and std 1 for the distribution of the outputs of layers does sparsity “double” from layer to layer due to half the activations on average going to 0 or do biases or other factors stop this?
 agile cobalt
wary cosmos
With ReLU as the activation and assuming mean 0 and std 1 for the distribution o...
agile cobalt
wary cosmos
With ReLU as the activation and assuming mean 0 and std 1 for the distribution o...
what exactly do you mean by "sparsity"?
each neuron is connected to multiple inputs and it output affects multiple other neurons
generally even if you kill some paths, others make up for it
wooden sail
sounds like regular sparsity from the context they gave: having the output after the relu have a large amount of 0s
agile cobalt
if so then yeah, not at all - you are setting some inputs to zero, but you still have all other non-zero inputs each connected to all of the next layer
wooden sail
i would also note it depends very strongly on the properties of the input data and the optimization target
no reason why after several layers you would necessarily have a normal dist with those parameters
the activation function directly affects the distribution after each layer
wary cosmos
agile cobalt
if so then yeah, not at all - you are setting some inputs to zero, but you still...
Oh yeah sorry, brain fart moment
wary cosmos
wooden sail
no reason why after several layers you would necessarily have a normal dist with...
If you use he initialization it shouldn’t be too far off
wooden sail
wdym?
agile cobalt
initializating the model weights in specific ways can help get activations closer to a normal distribution, but that still does not guarantees anything
wary cosmos
^
wooden sail
you'd have to compute what the pdf looks like after passing your input through the layer and use that to find suitable weights, sure, but you can't guarantee what happens as you train the weights without imposing extra constraints
 gritty vessel
So like custom weights?
I got a similar problem not exactly same.My X_data is of shape 28,1536,1392,6 and my y_data(labels) is of shape 28,1536,1392,1 and I am using a unet 32-64-128-256-128-64-32 architecture.The thing is my labels have 0 for no lighting events and 1 for lighting events but each sample has 99%non lightning events and only 1%are lightning events
Any idea how can I solve this Im balance ?
I can't change or augument the data as I have to use past recorded data only
I also tried class_weights but it gave error that it is not supported for 3+ dim dimensions.
Another thing I tried is sample weights
And gave 1 (lightning event) value weight of around 2000
But the thing is it's not predicting properly
I tried creating custom loss and accuracy function also that works on calculating loss and accuracy based on actual positive values only that is 1(lightning event) in actual data and it compares it with ypred but I couldn't make it run
Any other approach you guys would like to suggest?
desert oar
gritty vessel
But the thing is it's not predicting properly
what is "not predicting properly"?
desert oar
gritty vessel
I also tried class_weights but it gave error that it is not supported for 3+ dim...
this is probably just a programming/user error. show your code. I will never understand the mindset of giving up on what seems to be the correct solution after 1 attempt fails with an error message -- yes, class weights are a great idea here, you might have just made a typo even
 exotic star
I took a break from programming for a month, i wanna get consistent and dedicated with it to hopefully be able to freelance on a low level after 4 months of dedicated learning,I also wanna start with ai tho idk anything about ai.Any resources,tutorials...to help me on that?
serene scaffold
exotic star
I took a break from programming for a month, i wanna get consistent and dedicate...
if you want to be a freelancer in four months, AI is probably the worst domain to pick, unfortunately
exotic star
serene scaffold
if you want to be a freelancer in four months, AI is probably the worst domain t...
nah i just wanna learn ai, tho i wanna be able to make software with python
gritty vessel
desert oar
what is "not predicting properly"?
It is only learning non lightning events only i.e is 0 instead of lightning events
Anaconda\lib\site-packages\keras\engine\data_adapter.py:1385 _class_weights_map_fn *
raise ValueError("class_weight not supported for "
ValueError: class_weight not supported for 3+ dimensional targets
desert oar
gritty vessel
Anaconda\lib\site-packages\keras\engine\data_adapter.py:1385 _class_weights_map_...
it looks like keras is confused and thinks this is multi-output classification
show your model code
gritty vessel
Just a min
gritty vessel
desert oar
show your model code
from tensorflow.keras.layers import Input, Conv2D, MaxPooling2D, UpSampling2D, concatenate
import numpy as np

def unet(input_shape):
    inputs = Input(input_shape)
    conv1 = Conv2D(32, 3, activation='relu', padding='same')(inputs)
    pool1 = MaxPooling2D(pool_size=(2, 2))(conv1)
    conv2 = Conv2D(64, 3, activation='relu', padding='same')(pool1)
    pool2 = MaxPooling2D(pool_size=(2, 2))(conv2)
    conv3 = Conv2D(128, 3, activation='relu', padding='same')(pool2)
    pool3 = MaxPooling2D(pool_size=(2, 2))(conv3)
    conv4 = Conv2D(256, 3, activation='relu', padding='same')(pool3)

    up1 = UpSampling2D(size=(2, 2))(conv4)
    up1 = Conv2D(128, 2, activation='relu', padding='same')(up1)
    merge1 = concatenate([conv3, up1], axis=3)
    conv5 = Conv2D(128, 3, activation='relu', padding='same')(merge1)
    up2 = UpSampling2D(size=(2, 2))(conv5)
    up2 = Conv2D(64, 2, activation='relu', padding='same')(up2)
    merge2 = concatenate([conv2, up2], axis=3)
    conv6 = Conv2D(64, 3, activation='relu', padding='same')(merge2)
    up3 = UpSampling2D(size=(2, 2))(conv6)
    up3 = Conv2D(32, 2, activation='relu', padding='same')(up3)
    merge3 = concatenate([conv1, up3], axis=3)
    conv7 = Conv2D(32, 3, activation='relu', padding='same')(merge3)


    output = Conv2D(1, 1, activation='sigmoid')(conv7)

    model = Model(inputs=[inputs], outputs=[output])
    return model

input_shape = (28, 1536, 1392, 6)
model = unet(input_shape)

class_weights = {0: 1, 1: 2000}

model.compile(optimizer='adam', loss='binary_crossentropy', metrics=['accuracy'], class_weight=class_weights)
model.fit(X_train, y_train, batch_size=1, epochs=10, class_weight=class_weights)```I used this one
Asked gpt about the imbalance it said that class weights will work but when I checked on github and stack overflow
Many people were facing same issue of getting error with class_weights some one wrote about sample_weights in guthub issues I used that in my code but it didn't made any change in it
Then I read that sample weights are not useful if you have a large dataset
desert oar
gritty vessel
```from tensorflow.keras.models import Model
from tensorflow.keras.layers import...
I can take a look at this a bit later. In the future I strongly recommend using code formatting for code
!code
arctic wedgeBOT
gritty vessel
desert oar
I can take a look at this a bit later. In the future I strongly recommend using ...
Done 👍
gritty vessel
desert oar
I can take a look at this a bit later. In the future I strongly recommend using ...
Oje thing I forgot to mention input shape is 1536,1392,6 this is.mentioned in code
And output shape is 1536,1392,1
 hallow sphinx
Can anyone suggest a good book for data science and AI for beginners in this field (not a beginner in python)
Something like a hands on approach
 agile owl
I'm developing a map-reduce algorithm based economy simulator.
I have a few Spark schemas like this and I want to be able to reduce all the Firms and Workers associated with a Bank by the bank id in their struct to come up with net loan and deposit changes for the bank. In order to do that, I would have to first construct a set of key value pairs mapping each bank to its Firms and Workers and then reduce them separately with different UDFs right?
BankSchema = StructType(
    [
        StructField("id", IntegerType(), False),
        StructField("loans", DoubleType(), False),
        StructField("deposits", DoubleType(), False),
        ...
    ]
)

FirmSchema = StructType(
    [
        StructField("id", IntegerType(), False),
        StructField("financial_capital", DoubleType(), False),
        ...
        StructField("bank", IntegerType(), False),
    ]
)

WorkerSchema = StructType(
    [
        StructField("id"
, IntegerType(), False),
        StructField("wealth", DoubleType(), False),
        ...
        StructField("bank", IntegerType(), False),
    ]
)
🆘
hallow sphinx
I am currently reading Introduction to Statistical Learning with Python
 teal lance


Hey guys! How's it going? In this video I'll be showing you how to create a .exe in Pycharm using Python. Cool right? Let me know how it goes in the comment section below!
This video helped me in 2 minutes 🔥

 vagrant root
is there a good tokenizer for computerlanguage/assembly
 buoyant shoal
Hi guys, could someone help me with this question?

https://paste.pythondiscord.com/CEIQ
(This is the data)
Could someone share what they have in mind and maybe i can try to implement that in code(?) The real problem is that i don't understand the question
spring field
I think it asks you to figure out what is the value above which, the probability of it being a signal instead of bg noise is > 99%
so if you remove all the values less than or equal to this threshold, you're left with data where 99% is a pure signal
for some reason I want to think that this can be solved using a binomial distribution, but I'm not sure how you'd calculate the probability of success for each signal value
possibly just normalize the x2 values in range [0, 1]
spring field
if I do that, I get something like this, so yeah, hope that helps somewhat (if binomial distribution can actually be used for this of course 😁)
 spring field
frankly I think this has to be computed iteratively in the end anyway
buoyant shoal
spring field
frankly I think this has to be computed iteratively in the end anyway
hi, sorry i didn't get to see your message
buoyant shoal
spring field
I think it asks you to figure out what is the value above which, the probability...
okay yeah that's a fair interpretation for which i had something like:
import pandas as pd
import matplotlib.pyplot as plt

x1 = df['x1']
x2 = df['x2']
x3 = df['x3']
typee = df['Type']

count = 0
sig_events = 0
for i in range(len(x2)):
    # boundary condition setting
    if x2[i] > 3:
        count += 1
        if typee[i] == ' sig':
            sig_events += 1

efficiency = sig_events/count * 100

print(efficiency)
but if you look at this question, is this question supposed to be different?

their choice of word here is "efficiency" now instead of "purity"
 spring field
mmm, I had something very similar
import matplotlib.pyplot as plt
import pandas as pd

df = pd.read_csv("signal_data.csv", sep=", ", engine="python")
df.replace("sig", "green", inplace=True)
df.replace("bkg", "red", inplace=True)
df.sort_values("x2", ascending=True, inplace=True)

i = 0
for i in range(len(df["Type"])):
    if df["Type"].iloc[i:].value_counts()["green"] / len(df["Type"].iloc[i:]) > 0.99:
        print(df["x2"].iloc[i])
        break

plt.bar(range(len(df["x2"].iloc[i:])), df["x2"].iloc[i:], color=df["Type"].iloc[i:])
plt.show()
but instead of a specific threshold I iteratively checked whether at this point with the inputs that are left, is there a purity of over 99%
I don't know if this is correct or anything, but I got 2.93 which makes me think it might be D
but again, no clue 🤷♂️
wooden sail
what definitions are you given for purity and efficiency?
buoyant shoal
wooden sail
what definitions are you given for purity and efficiency?
none
for context, i'm just learning about curve fitting, pandas, numpy, matplotlib so this shouldn't isn't really physics/engineering centric
so i'm guessing it doesn't have to do with "signal purity" for example cuz that's something engineering
buoyant shoal
spring field
mmm, I had something very similar
```py
import matplotlib.pyplot as plt
import p...
oh lol, i just changed my bounds with the multiple choice answers and then one of them was 100%
wooden sail
the thing is that you're given terms with no definition, what are you expected to do then
buoyant shoal
and yes D is correct i think
wooden sail
because efficiency does have a meaning in statistical estimation, and it's not this 😛
buoyant shoal
😭 yes i understand
idk either bc the entire context is what i provided as well
unfortunately
buoyant shoal
wooden sail
because efficiency does have a meaning in statistical estimation, and it's not t...
but based on the data, would you "assume" that this more or less means the same as "purity"?
https://paste.pythondiscord.com/CEIQ (This is the data)
spring field
buoyant shoal
idk either bc the entire context is what i provided as well
well, where did you even pull these questions from then?
buoyant shoal
spring field
well, where did you even pull these questions from then?
it's from my class, but the teacher is very busy so there's no point asking him anyway lol
spring field
a class on?
wooden sail
buoyant shoal
but based on the data, would you "assume" that this more or less means the same ...
the question doesn't make any sense to me
buoyant shoal
wooden sail
the question doesn't make any sense to me
Lol that's good to know
I'll say the same thing as well and hopefully 😭 he addresses that
wooden sail
you can't quantify something without having a proper definition for it
you were given a guessing game
buoyant shoal
I think that's true but then purity and efficiency was never defined explicitly (like mathematically)
so i thought you'd just take the "english definition" at face value
but yeah 😭 i agree with you the question doesn't make any sense cuz they switched purity and efficiency
imo they're synonyms if we look at it from an "english" lens
at least in this context
 buoyant shoal
spring field
how was the efficiency question phrased then?
buoyant shoal
spring field
how was the efficiency question phrased then?
oh it's phrased the same way lol

but anyway dw i think
😭 thanks for the help @spring field and @wooden sail
desert oar
hallow sphinx
Can anyone suggest a good book for data science and AI for beginners in this fie...
what is your math background? and what are your goals?
@gritty vessel this is what you found on GH right? https://github.com/keras-team/keras/issues/3653
GitHub
Hi, I am using Keras to segment images to road and background pixels. As you can imagine percentage of road pixels are much lower than that of background pixels. Hence, I want to use class_weight= ...
It looks like you can try using sample weights as a workaround @gritty vessel
it doesn't look like you did anything wrong, this seems to be a longstanding design/documentation problem
and what a long confusing thread, yikes
I'm going away today and will be back tomorrow night, @ me if you don't figure it out by then and I can take a look
However there are lots of things to try in that thread. I suggest reading it carefully and slowly, and trying one thing at a time only after reading & understanding, not guessing with copy-paste
hallow sphinx
desert oar
what is your math background? and what are your goals?
I am a high school graduate who took PCM (Physics, Chemistry, and Maths)
desert oar
hallow sphinx
I am a high school graduate who took PCM (Physics, Chemistry, and Maths)
so you know limits, trig, and calculus on functions of 1 dimension?
any linear algebra (matrices & vectors) or probability or statistics?
hallow sphinx
yes
I have done most of it
Almost all of that I have done, but I still need recaps
desert oar
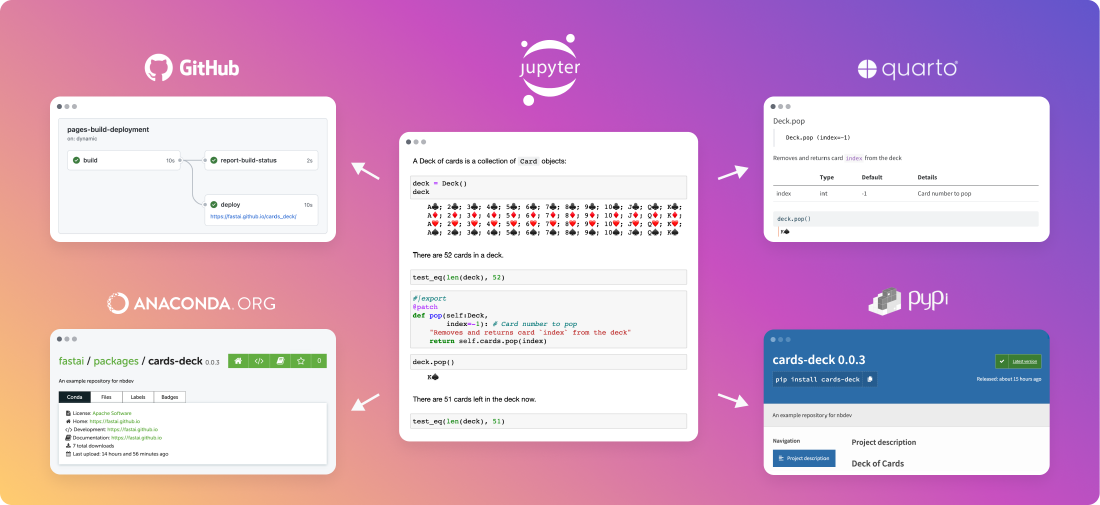
For AI and deep learning: Dive into Deep Learning (https://d2l.ai) or Practical Deep Learning for Coders (https://www.fast.ai/)
For a more general DS: Probabilistic Machine Learning (https://probml.github.io/pml-book/book1.html) which also includes a thorough review of all the foundational math you need in Chapter 1, so you can go through that to see where your math gaps are
 hallow sphinx
Okay, so how is AI different than ML?
and what is the goal of most people? What do they want to get a job in?
desert oar
hallow sphinx
Okay, so how is AI different than ML?
Historically they were very closely related.
Nowadays "ML" is kind of a meaningless catch-all term for automated predictive modeling and analysis that doesn't otherwise fall under the category of "statistics".
"AI" is the goal of creating systems and interfaces that behave as if they had some intelligence.
hallow sphinx
According to this definition, I want to get into AI development
long canopy
what library should I look into if I want to make a STT -> Local model -> TTS pipeline?
good ol' langchain?
hallow sphinx
desert oar
Historically they were very closely related.
Nowadays "ML" is kind of a meaning...
What is the current trend in this industry?
What should I go for?
Because these terms - AI/ML/DL are very new to me.
People just say - "AI career is booming" - but they don't know any specifics!
desert oar
hallow sphinx
What is the current trend in this industry?
In AI? It's everywhere you look. All of this LLM and chatbot stuff is under the category of "AI", specifically "generative AI"
spring field
desert oar
For AI and deep learning: Dive into Deep Learning (https://d2l.ai) or Practical ...
yooo, these are some crazy neat resources
hallow sphinx
desert oar
In AI? It's everywhere you look. All of this LLM and chatbot stuff is under the ...
What is the job most of the people wants to achieve in this industry?
I have heard things like data analysist, AI engineer etc.
serene scaffold
hallow sphinx
What is the job most of the people wants to achieve in this industry?
jobs that involve model development are probably the most prestigious, but they also require the most education. whereas jobs that involve deploying models are more accessible and focus more on programming.
hallow sphinx
serene scaffold
jobs that involve model development are probably the most prestigious, but they ...
Is this what you are talking about?
 serene scaffold
hallow sphinx
Is this what you are talking about?
serene scaffold
hallow sphinx
Is this what you are talking about?
I wouldn't put too much stock in this. there isn't really a clear difference between a "machine learning engineer" and an "AI developer", so all this tells you is that "companies that call their AI people 'ML engineers' pay more than companies that call their AI people 'AI developers'"
a "data analyst" definitely doesn't do AI or ML, however, so it makes sense that they'd be the lowest earners here. but a "data scientist" might have the same responsibilities as a data analyst, or as an ML engineer.
in this space, there aren't any rules about what job title you get based on what your actual job responsibilities are.
hallow sphinx

past meteor
hallow sphinx
What should I go for?
My 2 cents: don't overthink it and do stuff that you enjoy and you'll figure it out eventually
Titles etc. aren't standardized like stelergod says
hallow sphinx

serene scaffold
hallow sphinx
<:lemon_pika:754441880250613840>
what are you confused about?
also I'm not gonna be stelergod. I renounce my divinity. for now.
gritty vessel
I tried sample weights but I read some where it does not work that good on huge data set and also result was quite bad on that although accuracy was high and loss was low but still it was predicting very bad
gritty vessel
desert oar
it doesn't look like you did anything wrong, this seems to be a longstanding des...
Custom loss function and accuracy function I have to try
I tried it like only calculate loss and accuracy on predicting 1 values i.e lightning events and adjust weights on that but couldn't make it run I got errors like float32 != int64 after I fixed it then some tensor error lol I was confused
hallow sphinx
serene scaffold
what are you confused about?
Just normal confusion as I don't understand these job titles
past meteor
gritty vessel
I tried sample weights but I read some where it does not work that good on huge ...
I prefer not balancing at all and using ROC curves etc.
hallow sphinx
maybe because I am just beginning
serene scaffold
hallow sphinx
Just normal confusion as I don't understand these job titles
the short answer is that they're meaningless
gritty vessel
past meteor
I prefer not balancing at all and using ROC curves etc.
Alright I will try I read that also but instead I focused on balancing the dataset and it resulted in model predicting lightning events in excess as it gives lightning events high weights
past meteor
gritty vessel
Alright I will try I read that also but instead I focused on balancing the datas...
keep them unbalanced imo
that's your actual distribution
gritty vessel
Alright one thing I messed up is I forgot to plot outcome without any weights
serene scaffold
gritty vessel
Alright I will try I read that also but instead I focused on balancing the datas...
if the data isn't balanced in the real world, you don't want your model to depend on an idealized distribution. you want it to be prepared for how things actually are.
gritty vessel
All values were between 0 and 1 so wherever lightning is going to happen that are might have high intensity
past meteor
Don't follow the AUC or anything too much either, it's just indicative
gritty vessel
In that way also we can guess where lightning is going to happen
past meteor
gritty vessel
All values were between 0 and 1 so wherever lightning is going to happen that ar...
you mean your ground truth or what your model predicts?
gritty vessel
Ground truth is 0 and 1 only
But model is predicting values between 0 and 1
So I can compare them like wherever lighting is there that area in ypred will have high Intensity instead of a pin point location
past meteor
Yeah right so your model predicts p ∈ [0, 1]
gritty vessel
Yes
past meteor
by default you'd say 0.5 > is 1 and <0.5 is 0
you need to not do that when your dataset is unbalanced
methods like ROC and DET curves can help here
What mostly matters is common sense
Because a false positive and a false negative are typically not the same in terms of "damage" if your model gets it wrong
 magic steppe
how do i do a strided copy in numpy? i have U with U.shape = (n, n) and i want to get U2 such that U2[2j, 2k] = U and the odd entries of U2 are all 0
past meteor
You also have the AUC (area-under-the-curve) but it's also not perfect because of what I just mentioned, you only care about a small slice of the entire AUC and not the entire AUC
So, for these things you gotta take a step back and think about what you're trying to do precisely and then it gets easier 😄
gritty vessel
Yeah
wooden sail
magic steppe
how do i do a strided copy in numpy? i have `U` with `U.shape = (n, n)` and i w...
you can generate the indices explicitly or do it via slicing
let's see
gritty vessel
Actually I was following a research paper but then started doing my own thing
magic steppe
i wanted to avoid all of the interpeter overhead of an explicit loop
wooden sail
magic steppe
i wanted to avoid all of the interpeter overhead of an explicit loop
by explicitly i mean by using another array containing the indices. this does not mean using loops
gritty vessel
But I noticed actually I am also doing the same thing what the did was to predict the probability of lightning per pixel wise
And that's what I am doing also lol
wooden sail
!e
import numpy as np
x = np.random.normal(size=(4,4))
y = np.zeros((4,4))
y[::2, ::2] = x[::2, ::2]
print(x)
print(y)
@wooden sail :white_check_mark: Your 3.12 eval job has completed with return code 0.
001 | [[-0.83459187  1.07552909 -1.5654574  -0.93042818]
002 |  [-1.33795687  0.05380263 -1.08396724 -0.65824271]
003 |  [-0.67907671  0.38259435  0.44471116  0.1720681 ]
004 |  [-0.05002824  0.35279723  0.50656236 -1.96628031]]
005 | [[-0.83459187  0.         -1.5654574   0.        ]
006 |  [ 0.          0.          0.          0.        ]
007 |  [-0.67907671  0.          0.44471116  0.        ]
008 |  [ 0.          0.          0.          0.        ]]
@magic steppe this'd be the slicing version
gritty vessel
past meteor
So, for these things you gotta take a step back and think about what you're tryi...
Thanks for your advice .Discussing with others and figuring out feels good ngl
magic steppe
i think i want:
x = np.random.normal(size=(4,4))
y = np.zeros((4*2,4*2))
y[::2, ::2] = x[::1, ::1]
to expand the shape at the same time, right? but thanks!
wooden sail
ah
there's probably a padding flavor that does that directly. but yes, that would work
note that ::1 on all axes is the same as not indexing btw
so just y[::2, ::2] = x suffices
magic steppe
thanks!
agile owl
https://paste.pythondiscord.com/HXVQ should I use Structs for the Supply and Demand curves or just have multiple rows in the Supply and Demand dfs for each bank
 craggy agate
Has anyone here worked on an emotion detector CNN model?
I have trained my model on around 18k images 5 classes and am getting a final val accuracy of 65%
It wasn't really good at predicting obivious images.
How can I imporve this?
magic steppe
i want to write a 2D convolution that updates the input matrix in-place (so that updates are partially visible while the calculation takes place). is there anything that will support this?
(i.e. something that will run ~entirely in C)
tidal bough
huh, convolutions can be done inplace?
not sure what you mean by "will support this", though.
magic steppe
i'd like something that has an interface that lets me pass a buffer of some sort that the convolution will write the output to
the things i can find in scipy and numpy don't let you provide an output buffer
tidal bough
ah, that makes sense. hmm.
it indeed doesn't seem like the popular implementations provide an outparameter. Maybe you could make your own tiny library that wraps, say, https://docs.rs/convolve2d/latest/convolve2d/fn.write_convolution.html for use in python (via pyo3 and the rust numpy crate, in this case).
magic steppe
ok, thanks!
tidal bough
magic steppe
ok, thanks!
nevermind; while I was preparing to make a crime against good code as a test, I realised scipy.ndimage.convolve does have an outparameter.
(my evil plan was to temporarily override np.zeros or np.empty with my own function to provide it an already-existing array instead of making a new allocation 🥴 )
magic steppe
ah, i missed that, seems perfect
 lyric trail
hiiii
i want to upload my project on github.
how can i upload my csv file on github which is 50 mb
github does not accept file size larger than 50 mb
agile cobalt
upload the CSV to HuggingFace Datasets instead, you should only put your code in GitHub, not models, not datasets
 neon lintel
@lyric trail or you could just split your file in two, pretty straightforward solution
just make sure you copy the headers
 dusty valve
agile cobalt
upload the CSV to HuggingFace Datasets instead, you should only put your code in...
dusty valve
agile cobalt
upload the CSV to HuggingFace Datasets instead, you should only put your code in...
We doing that with this 🗣️🗣️🔥
 proven pier
Do yall have any servers you recommend for general accademic discussion of AI/ML?
 warm copper
Omgggggg
This is taking so long
Multivariate Imputation by Chained Equations are killing me
exotic star
I took a break from programming for a month, i wanna get consistent and dedicated with it to hopefully be able to freelance on a low level after 4 months of dedicated learning,I also wanna start with ai tho idk anything about ai.Any resources,tutorials...to help me on that?
craggy agate
exotic star
I took a break from programming for a month, i wanna get consistent and dedicate...
Start with learning python if you haven't
Then go to udemy and get a machine learning course
exotic star
craggy agate
Start with learning python if you haven't
im not all too bad at python
craggy agate
Once completed both of those things, learn Deep learning
craggy agate
exotic star
im not all too bad at python
I see, then you could start with ML
Learn concepts like linear algebra, statistics and calculus if you haven't
Only calculus 1 and 2 are required
And functions
exotic star
craggy agate
Learn concepts like linear algebra, statistics and calculus if you haven't
im first year in highschool so ig i'll need to go on yt for that one, u learn that in college in Macedonia
craggy agate
This seems a lot but you could start with deep learning within a month if you are dedicated and consistent
exotic star
craggy agate
This seems a lot but you could start with deep learning within a month if you ar...
so for now, could I just go for a yt tutorial?
craggy agate
exotic star
so for now, could I just go for a yt tutorial?
Yeah
exotic star
id even know the concept of how could an ai learn by itself
craggy agate
exotic star
id even know the concept of how could an ai learn by itself
You learn that with courses
exotic star
craggy agate
You learn that with courses
alr ty
craggy agate
exotic star
alr ty
Also maybe try yt and reading sklearn and tensorflow documentation if you don't want to do an online course(I recommend those)
exotic star
craggy agate
Also maybe try yt and reading sklearn and tensorflow documentation if you don't ...
will do, tysm for the guidence man
craggy agate
exotic star
will do, tysm for the guidence man
Np, I nearly gave up while learning and if I did, I would have regretted it a ton.
exotic star
craggy agate
Np, I nearly gave up while learning and if I did, I would have regretted it a to...
i just saw a quick video one of the past nights, and i didnt understand a think tho im still gonna try and understand haha
craggy agate
exotic star
i just saw a quick video one of the past nights, and i didnt understand a think ...
Instead of starting with the code, start with the concept and theoretical of each model, if you ever need help, feel free to reach out
exotic star
craggy agate
Instead of starting with the code, start with the concept and theoretical of eac...
thanks
i'll definitely do
 teal reef
hello i need urgent help in hackathon, is anyone available
serene scaffold
teal reef
hello i need urgent help in hackathon, is anyone available
always ask your actual question. don't ask to ask.
I'm not committing to helping, but no one will help unless they know what they're getting into.
teal reef
serene scaffold
always ask your actual question. don't ask to ask.
I'm not committing to helping...
okay
i need help in pre-processing a dataset of environmental impact assessment and create a model to predict and provide consulting services for sustainable development, also providing eia tools, gis mapping
serene scaffold
teal reef
i need help in pre-processing a dataset of environmental impact assessment and c...
what have you tried so far?
teal reef
serene scaffold
what have you tried so far?
i tried making the model but i am recieving the mse of 818
and the range of my target variable is from 1 to 100
serene scaffold
teal reef
i tried making the model but i am recieving the mse of 818
What is the structure of the dataset? is it a CSV or JSON or what?
serene scaffold
teal reef
csv
please copy and paste the first few lines of it into this chat as text
teal reef
serene scaffold
please copy and paste the first few lines of it into this chat as text
okay
serene scaffold
teal reef
okay
please only ping when you've completed an instruction; not to announce that you're going to do it
teal reef
serene scaffold
please only ping when you've completed an instruction; not to announce that you'...
sorry, the columns of the dataset are project_id, project_type, location, area_impacted, air_emissions, water_pollution, habitat_loss, carbon_footprint, mitigation_plan, impact_score, budget, duration, stakeholders, public_acceptance, sustainability_practices
serene scaffold
teal reef
sorry, the columns of the dataset are project_id, project_type, location, area_i...
you can't copy and paste the first few lines?
teal reef
serene scaffold
you can't copy and paste the first few lines?
of the dataset?
serene scaffold
teal reef
of the dataset?
of the CSV file
teal reef
serene scaffold
of the CSV file
okay
serene scaffold
knowing the names of the columns is helpful, but then I have to guess what their types are.
teal reef
serene scaffold
knowing the names of the columns is helpful, but then I have to guess what their...
should i send you the description of all the columns
 serene scaffold
teal reef
should i send you the description of all the columns
serene scaffold
teal reef
should i send you the description of all the columns
I wanted to see the first few lines of the CSV as text. Not as a screenshot.
teal reef
serene scaffold
I wanted to see the first few lines of the CSV as text. Not as a screenshot.
Project_ID,Project_Type,Location,Area_Impacted,Air_Emissions,Water_Pollution,Habitat_Loss,Carbon_Footprint,Mitigation_Plan,Impact_Score,Budget,Duration,Stakeholders,Public_Acceptance,Sustainability_Practices
Project_1,Urban Development,City_E,75.11,772.98,30.68,7.24,1973.07,Planned,94.57,2133438,32,"['Private Sector', 'Private Sector', 'Government']",Low,"['Green Infrastructure', 'Green Infrastructure']"
Project_2,Energy,City_E,39.16,519.98,43.21,1.21,4398.1,Implemented,83.8,9663668,6,"['Private Sector', 'Government', 'Local Community']",High,"['Waste Management', 'Green Infrastructure']"
Project_3,Energy,City_B,41.32,505.63,43.89,2.27,7310.0,Implemented,5.0,2710097,44,"['Local Community', 'Local Community', 'Private Sector']",Low,"['Renewable Energy', 'Waste Management']"
Project_4,Energy,City_A,73.48,970.94,24.86,4.19,8448.51,Implemented,50.26,6371545,58,"['Local Community', 'Government', 'Local Community']",High,"['Green Infrastructure', 'Green Infrastructure']"
serene scaffold
teal reef
Project_ID,Project_Type,Location,Area_Impacted,Air_Emissions,Water_Pollution,Hab...
thank you. what kind of model did you try to train on this data? and which feature is that model intended to predict?
teal reef
serene scaffold
thank you. what kind of model did you try to train on this data? and which featu...
i used randomforestregressor and i am predicting impact score in this model
serene scaffold
teal reef
i used randomforestregressor and i am predicting impact score in this model
how much have you learned about data encoding?
teal reef
serene scaffold
how much have you learned about data encoding?
i was mostly using chatgpt and i have general idea of pre-processing and training the model
serene scaffold
teal reef
i was mostly using chatgpt and i have general idea of pre-processing and trainin...
which columns, if any, have you encoded differently before passing the data to the model?
teal reef
serene scaffold
which columns, if any, have you encoded differently before passing the data to t...
i just changed non-numerical values, removed unnecessary columns
and then i trained the dataset
serene scaffold
teal reef
and then i trained the dataset
you don't "train a dataset". you train a model on a dataset.
serene scaffold
teal reef
i just changed non-numerical values, removed unnecessary columns
which columns did you deem unnecessary?
teal reef
serene scaffold
which columns did you deem unnecessary?
project id, location, project type, public_acceptance
serene scaffold
teal reef
project id, location, project type, public_acceptance
can you give an example of a non-numeric column that you re-encoded?
teal reef
serene scaffold
can you give an example of a non-numeric column that you re-encoded?
mitigation_plan, stakeholders, sustainability_practices
serene scaffold
teal reef
mitigation_plan, stakeholders, sustainability_practices
how did you encode mitigation_plan?
teal reef
serene scaffold
how did you encode mitigation_plan?
there are three values planned, implemented, not applicable so i used get_dummies
and made seperate columns for the values
serene scaffold
teal reef
there are three values planned, implemented, not applicable so i used get_dummie...
sounds good. what about Sustainability_Practices?
teal reef
serene scaffold
sounds good. what about Sustainability_Practices?
i also seperated its values and put in columns
but in array
serene scaffold
teal reef
i also seperated its values and put in columns
and those columns are also 0/1 (or true/false)?
serene scaffold
teal reef
yea
good. did you normalize any of the columns that were already numeric?
teal reef
serene scaffold
good. did you normalize any of the columns that were already numeric?
yea i normalized it
serene scaffold
teal reef
yea i normalized it
sounds like you did all the right preprocessing steps.
I have to go to sleep, unfortunately. try sharing information about your models. perhaps there are hyperparameters that you could change.
teal reef
serene scaffold
sounds like you did all the right preprocessing steps.
I have to go to sleep, un...
oh
 serene crystal
currently building a little script to show off the data collected by an automotive datalogger I built. The datalogger I built collects latitude, longitude, and then a bunch of random sensor data. Currently I use geopandas and matplotlib and it works but it's not very adaptable for when I either drive larger distances or in small areas. Also it's not super "pretty", I'd like to show satellite maps in the background (i.e. using google earth) to show this. Anyone know of any similar projects I can glean some information from? Or have some advice on ways to automatically snag a background map defined by my max/min latitude/longitude? Here are some examples of what I have so far, this is roughly how I want to format it too with the colorbar and the star for max and square for min value
Thanks all :)


 dawn light
Anyone here with any idea where to find some sort of dataset which has english novels/media (e,g, movies, etc.) and their correspinding human-labeled difficulty
I found one but the difficulty isn't human-labeled, it's calculated (https://corgis-edu.github.io/corgis/csv/classics/)
Github Pages for CORGIS Datasets Project
 vestal spruce
does anyone know a pretrained transformer-tranducer model? I need to fine-tune one for a small project
lofty thorn
anyone active right now?
serene scaffold
lofty thorn
anyone active right now?
Always ask your actual question. Don't ask to ask
serene scaffold
dawn light
Anyone here with any idea where to find some sort of dataset which has english n...
Isn't that better than a subjective statement about it's difficulty according to one person?
lofty thorn
serene scaffold
Always ask your actual question. Don't ask to ask
The query is solved...but i will take a note of that
dawn light
serene scaffold
Isn't that better than a subjective statement about it's difficulty according to...
yeah, i was wondering i there was a thing like maybe a few experts giving their subjective statements tho
I was thinking of trying to create an ML that predicts a text's difficulty better than the calculations (e.g. the linked dataset)
or i wonder if that's something too difficult?
 strong nymph
How int64 (in python) change or handle missing values/nan??
like does it generate new data for it?
jaunty helm
strong nymph
How int64 (in python) change or handle missing values/nan??
there's no int64 in python
python's int grows in memory as needed
strong nymph
# Int64 are pandas data types that can handle missing values
AirbnbData['year'] = AirbnbData['last_review'].dt.year.astype('Int64')
AirbnbData['month'] = AirbnbData['last_review'].dt.month.astype('Int64')
AirbnbData['day'] = AirbnbData['last_review'].dt.day.astype('Int64')
?
lofty thorn
import pandas as pd
import matplotlib.pyplot as plt
dataframe = {"Cause_of_delay":["Carrier","ATC","Weather","Security","Inbound"],
"Count":[23.02,30.40,4.03,0.12,42.43]"}
dfw = pd.DataFrame(dataframe)
data = dfw.transpose().plot.bar(x= "Cause_of_delay", y="Count",figsize = (4,4), legend = False)
data.set_xlabel("Cause_of_delay")
data.set_ylabel('Count')
plt.show()```
what is the error here??? grand minnow
lofty thorn
```py
import pandas as pd
import matplotlib.pyplot as plt
dataframe = {"Cause_of...
grand minnow
lofty thorn
```py
import pandas as pd
import matplotlib.pyplot as plt
dataframe = {"Cause_of...
+       "Count":[23.02,30.40,4.03,0.12,42.43]"}
-       "Count":[23.02,30.40,4.03,0.12,42.43]}
You got a " after the ]
grand minnow
lofty thorn
KeyError: 'Cause_of_delay'
try without transpose()?
lofty thorn


oh..i think in this refrence, data frame is horizontal... right?
and then transpose is used to make it vertical??
import pandas as pd
import matplotlib.pyplot as plt
dataframe = {'Cause_of_delay':["Carrier","ATC","Weather","Security","Inbound"],
    'Count':[23.02,30.40,4.03,0.12,42.43]}
dfw = pd.DataFrame(dataframe)
data = dfw.plot.bar(x= "Cause_of_delay", y="Count",figsize = (4,4), legend = False)
data.set_xlabel('Cause of delay')
data.set_ylabel('Count')
plt.show()```
This works..but i wanna know what is the diff bw reference code and the thisYoo guys what contour approach should i use for this to get it's area?

Any bounding box and stuff? Because I've tried it before but i get a lot of noise while contouring
Does it need more processing? Cuse I've only used adptthresholding
 fair warren
i'm developing a module that uses a component composition in a mixture to calculate chemical properties. the component composition is defined in a series, like so:
data = {'Water': 0.3,
'Methanol': 0.4,
'Ethanol': 0.3,
}
data = pd.Series(data)
the size of this series is small, at maximum 8-10 components, but they'll be used in a flash calculation, which is notoriously intensive mathematically, so performance is an issue.
agile owl
my loan market simulator advances
+-------+-------+--------------------+------------------+
|cust_id|bank_id|       interest_rate|       loan_amount|
+-------+-------+--------------------+------------------+
|    838|      0| 0.06000556848682509|  5.91030229012983|
|    760|      0| 0.06000313170361711| 3.323939813740198|
|    440|      0|  0.0600059433099785| 6.308133552299434|
|    422|      0|  0.0702174882887119|10827.230515772831|
|     45|      0|0.060033928532846365|36.011198675959385|
|     27|      0| 0.06002402808149029| 25.50301895655141|
|    117|      1|  0.0600095839458316|10.509306121862398|
|    994|      2| 0.06006032342145035| 67.67552360059527|
|    990|      2|0.060002718427968775|3.0497447215997138|
|    934|      2| 0.06001380936780574| 15.49242689451016|
|    817|      2| 0.06060007691284333| 673.2131285147242|
|    640|      2|   0.060001806893662|2.0271143732621786|
|    387|      2| 0.06008630544739569|  96.8241887090925|
|    347|      2| 0.06169746129701793|1904.3446029000302|
|    338|      2| 0.06416913104351082| 4677.256686465084|
|    196|      2|0.060028067731469195| 31.48857239508279|
|    887|      3| 0.06008290202762353|  101.557432569369|
|    778|      3|0.060132777241933374|162.65604329523813|
|     40|      3| 0.06576696340907158| 7064.700518622935|
|    876|      5| 0.07091703409364995|12032.992680272579|
+-------+-------+--------------------+------------------+
only showing top 20 rows
 fair warren
should I convert the series into a numpy array, or is the performance hit small?
agile owl
the issue with series is that accessing the data is a bit more expensive than just working with a numpy array directly
serene scaffold
fair warren
the size of this series is small, at maximum 8-10 components, but they'll be use...
what operations are you trying to perform on the Series?
A pandas series is a numpy array, so there should be no detectable performance difference.
agile owl
I think that every time you access the data in a series it has additional overhead though doesn't it
there's definitely more function calls aren't there
serene scaffold
but also @fair warren, one typically only sees any benefit from attempted optimizations when the size is large. if you're dealing with at most 10 elements, it will probably be "fast" no matter what.
agile owl
you use series for indexing purposes, if there is no need to index based on labels I would just use a numpy array
It sounds like the contents will change though
serene scaffold
agile owl
you use series for indexing purposes, if there is no need to index based on labe...
this is premature optimization. the size of the data is very small, so Diego should only be concerned with performance once it's confirmed that the performance is actually sub-par.
agile owl
The question is what is the nature of the problem and whether you are using key-based indexing or not
are you reducing on the keys or reducing on the positions
fair warren
the size of the series is not the issue, but the math behind it. i'll use the series data in a flash calculation. it's an iterative calculation with multiple nonlinear systems of equations.
for some systems, it can take 5s to solve. indexing would be desired because then I could call things like y['Water'] instead of remembering indices (the math is different depending on the component)
5s seems small, but it adds up on multiple calls
agile owl
I would use numba for it unironically
use numba typed dicts
where you have an integer key for each component and some mapping table for each component name to the integer key
Here's a demonstration of different implementations of dijkstra's algorithm with numba (orange and green) vs pure python (purple and red)

Here's an example of using numba typed dicts for dijkstra's algorithm without a queue
@njit
def get_mindist_c(dist, Q):
    dists = np.empty(len(dist), np.float64)
    for i in range(dists.shape[0]):
        a = boolean(i in Q)
        dists[i] = dist[i] * a + np.float64(1e9) * (1-a)
    return np.int64(np.argmin(dists))

@njit
def dijkstra_c(verts, edges, source, target):
    dist = Dict.empty(
        key_type = types.i8,
        value_type = types.f8
    )
    prev = Dict.empty(
        key_type = types.i8,
        value_type = types.i8
    )
    Q = list(range(len(verts)))
    for v in Q:
        dist[v] = np.float(1e9)
        prev[v] = np.int64(-1)
    dist[source] = 0
    while len(Q):
        u = get_mindist_c(dist, Q)
        Q.remove(u)
        if u == target:
            return dist, prev
        for i in range(len(edges[u])):
            v = edges[u][i]
            alt = dist[u] + np.linalg.norm(verts[u] - verts[v])
            a = boolean(alt < dist[v])
            dist[v] = alt * a + dist[v] * (1-a)
            prev[v] = u * a + prev[v] * (1-a)
    return dist, prev
@serene scaffold (sorry for ping but i saw you were talking about this before 😭 so i'm hoping it's okay)
serene scaffold
buoyant shoal
<@253696366952316929> (sorry for ping but i saw you were talking about this befo...
what?
buoyant shoal
but what's the "path" a beginner would follow to learning about AI and Data science
or where was the convo
serene scaffold
if you're going to ping someone, at least have a complete question in the message where you ping them
buoyant shoal
oh i was typing it
serene scaffold
right. it's rude to catch someone's attention and then make them watch you type, instead of just giving them a complete message all at once.
fair warren
agile owl
Here's an example of using numba typed dicts for dijkstra's algorithm without a ...
huh. knew about numba but didn't get deeper into the implementation. i'll check it out, thanks
agile owl
If you're doing lots of iterative calculations that are expensive numba is a great option
serene scaffold
it's like calling someone and then immediately putting them on hold.
anyway, the book I typically recommend to beginners is "data science from scratch". if you're a current university student, you might be able to get it online for free.
my public library in Washington, DC also has it online for free, so yours might as well.
serene scaffold
agile owl
oh where in DC are you
I'm not going to get that specific.
agile owl
I lived in Georgetown and Burleith it's really nice
really expensive tho
💀
there's like no stores for normal people on m street... except sketchy hookah shop
but I digress
buoyant shoal
serene scaffold
it's like calling someone and then immediately putting them on hold.
anyway, the...
okay sorry again
also is there a structured "roadmap" rather than books?
serene scaffold
buoyant shoal
also is there a structured "roadmap" rather than books?

roadmap.sh
Learn to become an AI and Data Scientist using this roadmap. Community driven, articles, resources, guides, interview questions, quizzes for modern backend development.
buoyant shoal
serene scaffold
https://roadmap.sh/ai-data-scientist
oh okay, thanks!
agile owl
my problem with my economy simulator is I'm basically just hallucinating supply and demand curves I need a way to tie it back to some actual data
 river cape
Could anyone say as to how does multiple linear regreesion works?
Can we actually plot a graph for it?
And how does the model know to pick the best features with high p value?
 empty furnace
hello i have a question.
if this code
print(len(tf.config.list_physical_devices("GPU")))
gives me 1, does tensorflow runs on gpu by default or should i do an extra step?
fair warren
river cape
Could anyone say as to how does multiple linear regreesion works?
fundamentally, the algorithms create a linear model (basically, c1feature1 + c2feature2 +...) and obtain the c1,c2... parameters by minimizing the error between model and observations.
https://docs.scipy.org/doc/scipy/reference/generated/scipy.linalg.lstsq.html is the mathematical method scikit uses to minimize the error.
tidal bough
river cape
Can we actually plot a graph for it?
well, (multiple) linear regression is just calculating a line that best fits the data. if you have even 3 independent variables (and 1 dependent one), then this is a line in 4-dimensional space. you might find this hard to plot on a 2d screen.
if you have 2, then it's just a 3d plot, nothing unusual.
fair warren
if you have more than 2 features it's hard to plot it, but there are ways to visually check if your regression is good, such as a parity plot.
fair warren
river cape
And how does the model know to pick the best features with high p value?
again using scikit-learn as an example, by default the models don't pick the best features, it's up to the modeler to choose them. if you give it 100 features it'll use all of them. however, scikit has some functionality to choose features automatically: https://scikit-learn.org/stable/modules/feature_selection.html

scikit-learn
The classes in the sklearn.feature_selection module can be used for feature selection/dimensionality reduction on sample sets, either to improve estimators’ accuracy scores or to boost their perfor...
i'd refrain from using those if you're still learning though
past meteor
fair warren
again using scikit-learn as an example, by default the models don't pick the bes...
even so, you would hope that good models find the signal (features that contribute) and not the noise 😄
 frozen oar
Hey anyone can help me in my code?
serene scaffold
frozen oar
Hey anyone can help me in my code?
always ask an actual question. don't ask to ask. copy and paste the code into the chat as text, and the error message, if you got one.
frozen oar
line 23, in <module>
flappy=Bird(100,int(screen_height/2))
^^^^^^^^^^^^^^^^^^^^^^^^^^^^^^
line 21, in init
self.rect.center={x,y}
^^^^^^^^^^^^^^^^
Where did I go wrong?
craggy agate
Hey y'all, I am getting a new laptop for ML and DL. I would have to run resource intensive models like BERT, GPT, RNN, CNN, etc. I am currently thinking of getting a macbook air 13.6 inch m3 chip 16gb ram 512 gb ssd. Should I go ahead with purchasing? My current laptop is an i7 10th Gen integrated graphics 12 gb ram and it works flawlessly but is getting a lil old and crashes sometimes. I wanna keep it as a backup to make sure it doesn't just die.
river cape
print("Accuracy: {:.2f}%".format(accuracies.mean()))
Is there any other to print this?
fair warren
river cape
print("Accuracy: {:.2f}%".format(accuracies.mean()))
print(f'Accuracies: {accuracies.mean():.2f}')
river cape
fair warren
print(f'Accuracies: {accuracies.mean():.2f}')
the f in the beginning means format?
fair warren
pretty much. f is for f string formatting. it's a different way of formatting strings that was introduced in Python 3.6

Python documentation
There are several ways to present the output of a program; data can be printed in a human-readable form, or written to a file for future use. This chapter will discuss some of the possibilities. Fa...
river cape
fair warren
pretty much. f is for f string formatting. it's a different way of formatting st...
Thank you
 potent meadow
i meant this pic lol..
i imported seaborn as sns and im getting this error, what am i doing wrong
 serene scaffold
frozen oar
line 23, in <module>
flappy=Bird(100,int(screen_height/2))
^^^^^^...
serene scaffold
frozen oar
line 23, in <module>
flappy=Bird(100,int(screen_height/2))
^^^^^^...
that's not the whole error message.
!traceback
arctic wedgeBOT
Traceback
Please provide the full traceback for your exception in order to help us identify your issue.
While the last line of the error message tells us what kind of error you got,
the full traceback will tell us which line, and other critical information to solve your problem.
Please avoid screenshots so we can copy and paste parts of the message.
A full traceback could look like:
Traceback (most recent call last):
  File "my_file.py", line 5, in <module>
    add_three("6")
  File "my_file.py", line 2, in add_three
    a = num + 3
        ~~~~^~~
TypeError: can only concatenate str (not "int") to str
If the traceback is long, use our pastebin.
serene scaffold
craggy agate
Hey y'all, I am getting a new laptop for ML and DL. I would have to run resource...
you won't be able to run "resource intensive models" on any laptop. the only consumer hardware that comes close would be gaming desktops.
craggy agate
serene scaffold
you won't be able to run "resource intensive models" on any laptop. the only con...
Well, desktops are out of the question cause of the prices and lack of mobility. as far as laptops go, could this be a decent option?
cause of the new neural engine on the m3
serene scaffold
craggy agate
Well, desktops are out of the question cause of the prices and lack of mobility....
I would give up on having a laptop that can run any serious ML stuff locally. You should plan on doing any experimentation on cloud platforms. At which point the performance of your local machine is less important.
craggy agate
serene scaffold
I would give up on having a laptop that can run any serious ML stuff locally. Yo...
See now here is the thing, everyone is saying that you need a really powerful GPU for this. But that's for extreme workload cases though like professional workstations I don't know if its applicable for individuals.
LIke my laptop can run CNN without a graphics card so maybe the mac can run BERT and other models...
serene scaffold
craggy agate
See now here is the thing, everyone is saying that you need a really powerful GP...
you need a CUDA-enabled GPU to do any deep learning. If the MacBook Air doesn't have one, it's effectively useless for doing deep learning locally
if you insist on getting a laptop, get one with the largest CUDA-enabled GPU you can find in a laptop.
craggy agate
serene scaffold
if you insist on getting a laptop, get one with the largest CUDA-enabled GPU you...
that would have to be a rtx 40 series and in a gaming laptop
serene scaffold
craggy agate
that would have to be a rtx 40 series and in a gaming laptop
then that's what you should get
craggy agate
serene scaffold
then that's what you should get
i see
serene scaffold
craggy agate
i see
unless you want a gaming laptop, your money might be better spent getting a less powerful laptop (as long as it's not a chromebook), and using the savings to pay for cloud computing. and you can do a lot for free on google colab.
craggy agate
serene scaffold
unless you want a gaming laptop, your money might be better spent getting a less...
colab can't really run big datsets and complex models but I see what you are getting at...
serene scaffold
craggy agate
colab can't really run big datsets and complex models but I see what you are get...
perhaps not for free. you could pay for more.
craggy agate
serene scaffold
perhaps not for free. you could pay for more.
Even with the neural engine you are saying the m3 won't be good enough?
craggy agate
serene scaffold
perhaps not for free. you could pay for more.
I see
serene scaffold
craggy agate
Even with the neural engine you are saying the m3 won't be good enough?
you can read the different answers here: https://www.quora.com/Is-the-Macbook-Pro-M3-Max-good-for-deep-learning-development-and-fine-tuning-models-Ill-use-a-local-workstation-with-48-GB-GPU-to-train-neural-networks#:~:text=The MacBook Pro M3 Max could be suitable for deep,preferable for training large networks.

Quora
Answer (1 of 3): Yes, the M3 Max chip in the latest MacBook Pro models should be quite capable for deep learning development and model fine-tuning. Here are a few key points:
- The M3 Max has an extremely powerful integrated GPU with up to 38 cores, which can handle complex neural network compu...
One answerer says "TLDR: I would definitely recommend against using your mac’s GPU. I do advise you consider getting a mac and use cloud computing instead."
craggy agate
serene scaffold
you can read the different answers here: https://www.quora.com/Is-the-Macbook-Pr...
thanks for the help
 lusty relic
"Hello everyone, I'm 18 years old and have been passionate about AI for about a year now. Although AI hasn't fully developed in Rwanda yet, I'm eager to dive deeper into learning. I'm wondering if I should start delving into more advanced concepts or if I'm getting ahead of myself, as some of these topics seem quite challenging."
craggy agate
Yeah AWS is pretty expensive, I will probably get the MacBook and if I feel it can't really handle my datasets and models I will use Google colab.
Honestly an M3 MacBook 16gb ram would be better than my i7 10thgen no graphics card with 12 gb ram
craggy agate
lusty relic
"Hello everyone, I'm 18 years old and have been passionate about AI for about a ...
What have you learned till now?
Completely depends on that
lusty relic
craggy agate
What have you learned till now?
I am on my last year of comsci of secondary school
craggy agate
lusty relic
I am on my last year of comsci of secondary school
I mean in AI and ML
Do you know R or python?
lusty relic
craggy agate
I mean in AI and ML
I learned some pandas, levenshtein …
craggy agate
@odd meteor you have been typing for like 2 years lmao
lusty relic
craggy agate
Do you know R or python?
I kno python
craggy agate
lusty relic
I learned some pandas, levenshtein …
I see
Python is great for ML and DL
I would say, branch out into ML
Once you are comfortable, start DL
You know what ML and DL means, right?
lusty relic
craggy agate
You know what ML and DL means, right?
I know the full meaning but I can’t differentiate them
craggy agate
Also, strengthen these math concepts - Statistics, linear algebra, calculus 1 and calculus 2
craggy agate
lusty relic
I know the full meaning but I can’t differentiate them
DL is basically making an artificial brain
 odd meteor
lusty relic
"Hello everyone, I'm 18 years old and have been passionate about AI for about a ...
odd meteor
lusty relic
"Hello everyone, I'm 18 years old and have been passionate about AI for about a ...
Hey Iranzi, I'll recommend you attend IndabaX Uganda this year. I've met some Ugandans who are doing great things in low-resource NLP.
If you're not so comfortable with the beginner level topics in data science, I'll suggest you start there.
Meanwhile, we hope to see you around more often. It's not everyday you get to meet someone from Uganda here. 😀
craggy agate
odd meteor
Lol
lusty relic
craggy agate
Also, strengthen these math concepts - Statistics, linear algebra, calculus 1 an...
Am still fighting to learn them but i am not paper math guy, but if that’s the way i’ll follow them
lusty relic
craggy agate
DL is basically making an artificial brain
Noted
lusty relic
odd meteor
Hey Iranzi, I'll recommend you attend IndabaX Uganda this year. I've met some U...
When
Cause I don’t have valid passport
craggy agate
lusty relic
Am still fighting to learn them but i am not paper math guy, but if that’s the w...
You should definitely invest time in learning it, those concepts are the building blocks of ML and DL
Good luck!
lusty relic
craggy agate
You should definitely invest time in learning it, those concepts are the buildin...
But do i have to learn both of them or i can even focus on one only?
craggy agate
lusty relic
But do i have to learn both of them or i can even focus on one only?
I would recommend starting with ML
Once you are comfortable then maybe branch out
odd meteor
lusty relic
When
https://twitter.com/indabaxug/status/1781366886548083085?t=hKTv7gJSA2-5T1GhSS3x6g&s=19
Please do apply. Do you know Bruno? The lead of Indaba X Uganda?
📢 Exciting news!📢
Applications for attending IndabaX Uganda 2024 are now open.
Apply not later than 19th May, 2024.
Application link 🔗 https://t.co/dVxtp0fHVh
@DeepIndaba @shakir_za @ulrichpaquet @richardpmann @johnilee @SunbirdAI
#IndabaXUganda2024 #EthicalAI

 Twitter
·
lusty relic
craggy agate
Once you are comfortable then maybe branch out
Twitter
·
lusty relic
craggy agate
Once you are comfortable then maybe branch out
Okay I appreciate for your help maybe in the meantime i would came back appreciating again 🙏
craggy agate
lusty relic
Okay I appreciate for your help maybe in the meantime i would came back apprecia...
Reach out if you ever need help
odd meteor
lusty relic
Cause I don’t have valid passport
It's in your home country man 😀 I suppose you don't need a passport to travel around Uganda.
lusty relic
odd meteor
It's in your home country man 😀 I suppose you don't need a passport to travel a...
Seriously? I don’t know man. Lol
lusty relic
craggy agate
Reach out if you ever need help
But if not being annoying how long can take me to make my first simple model to predict something
craggy agate
lusty relic
But if not being annoying how long can take me to make my first simple model to ...
Are you following a course?
Like a udemy course?
odd meteor
lusty relic
Seriously? I don’t know man. Lol
You should know 😂.
Meanwhile, try to get your passport so that you can attend DLI 2025 (Application for DLI 2024 is closed now. I'll be in Senegal this year, hopefully)
lusty relic
odd meteor
You should know 😂.
Meanwhile, try to get your passport so that you can attend...
I’ll try out
lusty relic
odd meteor
You should know 😂.
Meanwhile, try to get your passport so that you can attend...
But thanks to inform me i didn’t kno that
lusty relic
craggy agate
Are you following a course?
Yes am learning some fine tuning and algorithms on neuranine youtube channel
craggy agate
lusty relic
Yes am learning some fine tuning and algorithms on neuranine youtube channel
Okay good, make sure it's a full course though
agile cobalt
lusty relic
But thanks to inform me i didn’t kno that
you should not require a passport for travelling inside of the country, but you may still need to have some sort of identification document - which sort of document depends on the country though
(usually just anything the government can use to check that you are registered in their systems though)
edit; probably this National ID in the case for Uganda, but you may want to check with people that actually know how things work in your country
The National Identification & Registration Authority's mandate is to create, manage, maintain and operationeralise the National Identification Register by Registering all citizens of Uganda,
Registering non-citizens of Uganda who are lawfully residents in Uganda, Registering births and deaths, Assigning a unique
National Identificat...
craggy agate
What do you guys do to improve your CNN human facial expression classification model's val_accuracy?
I am currently getting about 70% val accuracy.
But it is not able to classify a really simple expression
It's just a picture of me smiling
And it's pretty obvious that my expression is happy
Has anyone faced this issue
serene scaffold
craggy agate
What do you guys do to improve your CNN human facial expression classification m...
how many classes are there?
if you're doing multiclass classification, I would look at the precision, recall, and f1 of each class. and the confusion matrix. a single "accuracy" score for the whole model isn't going to tell you the whole story.
 calm umbra
craggy agate
What do you guys do to improve your CNN human facial expression classification m...
calm umbra
craggy agate
What do you guys do to improve your CNN human facial expression classification m...
what is your whole process? can you explain it detailly? or You just use simple CNN network?
 proven wraith
Hi all, I wanted to try using a genetic algorithm on a three-player game. I've set up NEAT with a rudimentary config that's mostly defaults. However, I'm not sure how I should create matches. Creating permutations of 3 for all the genomes takes an absurd amount of time for even two generations. Simply pairing (tripling?) the genomes up for matches seems to potentially fail if the number of genomes isn't a multiple of 3.
 worldly dawn
proven wraith
Hi all, I wanted to try using a genetic algorithm on a three-player game. I've s...
worldly dawn
proven wraith
Hi all, I wanted to try using a genetic algorithm on a three-player game. I've s...
then don't?
You could make them all play against the best individual from last generation. Or Using a tournament selection of multiples of three.
lapis sequoia
(I'll paste this message here from the other chat xD)
Good morning everyone! ✨
I wanted to ask if someone could kindly advise me on what I should start learning if I want to become a good data scientist. I only know a bit about programming, mainly R and C++ (and very little Python). Any advice on what I should do first? Many people told me that I should learn SQL... Is that right?
Like... what advice would you give to a total newbie in this field? There's so much on the internet that I simply don't know where to start and I thought that asking people with real experience would maybe be better 💛
 main citrus
If I learned python, there is a reason to learn SQL too?
wooden sail
sure there is, you can pair up the two
main citrus
Sql is like using pandas on python?
wooden sail
not really. pandas' strength is imo the processing you can do with it bundled with the data reading/writing
craggy agate
serene scaffold
how many classes are there?
5
agile owl
Polars just uses all of the pandas IO methods it's kind of disappointing
especially how they do read and write database
spring field
so, obviously there are mean kernels, right?
well, what would be an example of a nice kernel?
wooden sail
spring field
so, obviously there are mean kernels, right?
well, what would be an example of a...
kernels for what? you're working with convolutions?
spring field
yes
should've specified
so like a standard mean kernel would be a 3 by 3 kernel with the same weights, so it's just the average of the pixel values around it
wooden sail
yeah
spring field
note that this is a bit of silly question obviously, but imagine what a nice kernel would be like
wooden sail
you mean like treating "mean" as a pun? 😛 or do you want actual examples of cool/useful kernels other than the mean/averaging kernel
spring field
yes, a pun
wooden sail
we can go for spectral properties. averaging is inherently low-passy. we can make a "nice" kernel by using weights that are high-pass
then they'd be opposites, as you'd expect from mean and nice
spring field
although if you have some cool ones (that are not just the regular edge detection or whatever, lol) you want to share, go ahead, I might as well go with those as well, I was just toying with some kernels because I wanted to produce a pixelated output and I found that a mean kernel with a stride equal to its size would be the appropriate one to produce such a result, but then someone jokingly asked for a nice kernel and so here I am 😁
wooden sail
you can in general write an optimization problem where the output is the kernel that produces a special effect you like
a big chunk of control theory, system design, and FIR filter design deal exactly with this question
the edge detection stuff you mentioned is one example
the most basic detection algorithms would use a flipped reference signal as a kernel, turning the convolution into a correlation
spring field
wooden sail
you can in general write an optimization problem where the output is the kernel ...
I see roughly how it could be done via ML as well
wooden sail
any time you use CNNs, that's exactly what you do, yeah
you can usually get pretty pictures of the kernels out of that
spring field
mmm, maxpool of kernel size 2 and stride 2 is basically a pixelator then, cool
wooden sail
right
you usually see pretty pics like these

kernels on the right, result of applying the kernels on the left
spring field
mmm, what would high-pass weights look like?
or rather, what makes averaging low-passy?
wooden sail
smth like this

my best explanation would be through fourier analysis
otherwise, you can think of it this way: "high frequency" components in a signal/image means that one pixel here and there suddenly has a very different value from the ones around it
averaging gets rid of those rogue pixels
through fourier analysis, averaging filters are convolutions with a rectangular function
the fourier transform of a rectangular function is a sinc whose width is inversely proportional to the width of the rectangular function, and convolution in the original domain turns into multiplication in the spectral domain
so the more you average, the wider a rectangular function you convolve with -> the narrower a sinc you multiply by in the frequency domain, eliminating everything outside of it
spring field
I think I found some holes in my math knowledge 😁, will have to study this a bit, but thank you very much 
craggy agate
calm umbra
what is your whole process? can you explain it detailly? or You just use simple ...
so, I have got 5 classes and get a val_accuracy of around 70% but my CNN model even with a decent accuracy cannot correctly classify a really easy expression(clear picture of me smiling...), even with decent sized dataset(3k+ images for each class and around 5k for angry, happy and sad)


 spring field
wooden sail
smth like this
spring field
wooden sail
smth like this
from this I understand that a high pass would simply be an inverse of a low pass? in case of pixel values in range [0, 255] that'd be just 255 - averaged_pixel?
wooden sail
spring field
from this I understand that a high pass would simply be an inverse of a low pass...
not quite, since these are convolutions
if we have pixels p-2, p-1, p, p+1, p+2, the average is related to the sum of all of these, which is low passy.
a high pass would be more like (p-2) - (p-1) + (p) - (p+1) + (p+2)
with alternating signs in the sum
spring field
mmm
so the top right is averaging and bottom right is alternating
(nice_pixelated_result = (np.sum(kernels[::2], axis=-1) - np.sum(kernels[1::2], axis=-1)) / kernel_size ** 2)

mmm, something's off
this is more like it I guess

 late shell
Hello everyone, I need some help with logic building. Really appreciate your time. Let me know if this is not the right place to ask my question.
PROBLEM STATEMENT:
I have comprehensive data on various points of interest (POIs) in a city, encompassing restaurants, cafes, entertainment venues, clothing stores, shopping malls, etc. This dataset includes the latitude and longitude coordinates, names of the places, and 'popular times data' extracted from Google Maps.
The 'popular times data' provides insights into the typical busyness of a location throughout the day, derived from average popularity over recent months. It's represented graphically, showing the popularity relative to peak times for the business during the week.
Additionally, I possess data on billboards and hoardings within the city, including their names and geographic coordinates. I've utilized K-means clustering on the POI data to identify clusters, followed by further clustering within each cluster to create sub-clusters.
Many of these billboards fall within these sub-clusters, while others are situated outside. My objective is to estimate the average impressions each billboard will receive, leveraging the POI data and considering the total population of the city. Impressions are defined as the number of times an advertisement on a specific billboard is viewed.
How can I effectively estimate the average impressions for each billboard, given this dataset and context?
I dont need accurate results, just some numbers that theoretically make sense.
Thank you very much
past meteor
agile owl
Polars just uses all of the pandas IO methods it's kind of disappointing
Kinda false
You can use connector-x
It's right there in the Polars docs
They renamed the function to read_database_uri
 versed pilot
spring field
or rather, what makes averaging low-passy?
versed pilot
spring field
or rather, what makes averaging low-passy?
You can get frequency responses of 1D transfer functions in scipy using https://docs.scipy.org/doc/scipy/reference/generated/scipy.signal.dfreqresp.html#scipy.signal.dfreqresp and if the nyquist plots are hard to understand, try the bode plots https://docs.scipy.org/doc/scipy/reference/generated/scipy.signal.dbode.html#scipy.signal.dbode
agile owl
past meteor
Kinda false
I mean you can just search all their source code for all the instances they use pandas by default
which is almost everywhere
I admit I didn't know there was even an alternative but if they are using pandas by default then yeah it's not false at all
lofty thorn
somone pleasee explain this in easy language
 wooden sail
what troubles you about it?
lofty thorn
from ' Model selection '
wooden sail
what exactly?
spring field
it's the knobs adjusted during training that will then make up what the model really is
 tired otter
you plot your data, see that its more or less linear and decide to find what is the equation of a line that more fit to a data. in this example y = a*x +b . a and b are decided from your data
spring field
like theta 0 and 1 in the Linear Regression example
wooden sail
lofty thorn
what are model parameters
we discussed this with the linear model last time
how y = mx + b is a linear model that can describe any straight line, then picking m and b (the parameters of the linear model) gives you a specific line just as tunecx says
past meteor
agile owl
I admit I didn't know there was even an alternative but if they are using pandas...
Hmm, honestly you should be reading from a db with the one I showed
I take for granted people don't always read the docs but to me it was clear that was the case but it's a fair point
lofty thorn
oh so model parameter is trend line?
lofty thorn
wooden sail
how y = mx + b is a linear model that can describe any straight line, then picki...
.
spring field
m and b are the parameters, not the line
the line is more a byproduct of plotting a function that uses the learned parameters
wooden sail
lofty thorn
oh so model parameter is trend line?
no
 little arrow
guys
if i have a dataset with some features that have a really high % of missing values
should i just remove the feature altogether?
im talking like 80% missing values
jaunty helm
little arrow
im talking like 80% missing values
depends, a missing value could have meaning in itself
e.g. if in a people dataset 80% of owned_luxury_car_brand is missing, maybe those missings just mean they don't own a luxury car
little arrow
the dataset is a crime stats one, and most of them are police stats, like number of patrol cars, num of police per pop etc
so the data unfortunately is pretty important
jaunty helm
little arrow
so the data unfortunately is pretty important
well sure, so what's the feature that's missing 80%? does a missing mean something or is it genuinely just missing?
If it's the latter I'd say just drop it
little arrow
jaunty helm
well sure, so what's the feature that's missing 80%? does a missing mean somethi...
i think its the latter, the dataset is organised by specific towns in each row, with their corresponding data. some of the towns have those police stats but most dont
jaunty helm
little arrow
i think its the latter, the dataset is organised by specific towns in each row, ...
if that's the conclusion then just drop it
lofty thorn
please help me understand this..
all i got is.
model word can be used with different functions.
like types of model(what brand of car you want) or a fully specified model architecture(modifying and selecting the car features) and a trained model(the ready car)...

but i am having difficulty understanding this
agile cobalt
lofty thorn
please help me understand this..
all i got is.
model word can be used with dif...
I would throw away the car metaphor
a trained model is constructed the same as a non-trained model, the only difference are the values of the model weights
type of model => broad categories (such as transformer, convolutional, diffusion)
model architecture => what are your inputs and outputs formats, which sort of layers/blocks and activation functions are you using
fully specified model architecture => what is the exact input format and dimension, what are you using in each specific layer, what is your exact output format and dimension
training => given a fully specified model architecture and a training hyperparameters configuration, you find parameters that fit the problem you are trying to solve (minimise the loss function)
lofty thorn
i need sleep..sorry, i will continue this tomorrow
 tough crag
Guys for some stange reason pandas is displaying wrong results when calculating quartiles.
import pandas as pd

# Create a DataFrame
data = pd.DataFrame({
    "data":[3, 9, 10, 12]
})

# Calculate quartiles directly
quartiles = data['data'].quantile([0.25, 0.5, 0.75])

# Print the quartiles
print(quartiles)```

is displaying
```0.25     7.5
0.50     9.5
0.75    10.5```
 which is wrong it should display 0.25 6 / 0.50 9.5 /  0.75 11

does anyone know why this is happening?there's more than one way to compute quantiles when the values don't coincide with a sample
sounds like you want "midpoint" interpolation, whereas pandas defaults to "linear"
@tough crag check out the interpolation argument https://pandas.pydata.org/docs/reference/api/pandas.DataFrame.quantile.html
!e
import pandas as pd

# Create a DataFrame
data = pd.DataFrame({
    "data":[3, 9, 10, 12]
})

# Calculate quartiles directly
quartiles = data['data'].quantile([0.25, 0.5, 0.75], interpolation="midpoint")

# Print the quartiles
print(quartiles)
``` let's give it a go@wooden sail :white_check_mark: Your 3.12 eval job has completed with return code 0.
001 | 0.25     6.0
002 | 0.50     9.5
003 | 0.75    11.0
004 | Name: data, dtype: float64
there we go
tough crag
thank you so much
wooden sail
helps a lot that you shared a nice minimal example right away 😛
vagrant root
Can anyone help me understand an assignment

Tf am I supposed to do here
Either it's just like a bs of buzzword or I'm dumb
little arrow
if my dataset is really huge with alot of features, how would i go about decreasing the number of features to just important ones
vagrant root
little arrow
if my dataset is really huge with alot of features, how would i go about decreas...
It is depeob dataset but you can just take random samples for starters
I had a data set of 2500+ samples and in it only one was actually filling up all 176 columns so I deleted that particular row and the column in it's entirety
You could do that @little arrow
vagrant root
vagrant root
Can anyone help me understand an assignment
@knotty cloak
 knotty cloak
vagrant root
<@255074198559391744>
knotty cloak
vagrant root
<@255074198559391744>
you posted a picture so I can't cut and paste, but isn't it simply do the things it tells you explicitly to do?
- find some data sources on a topic (use chatgpt o similar and explain why),
- suggest methods to scrape the data (see table 1)
- scrape data and build DP (see table 2)
little arrow
vagrant root
Is it that compute heavy?
im not worried about it being heavy, more just if the features actually matter
vagrant root
Yeea but it's filled with bs about gpt and llms
vagrant root
little arrow
im not worried about it being heavy, more just if the features actually matter
Lookup regularisation of data
vagrant root
vagrant root
Yeea but it's filled with bs about gpt and llms
@knotty cloak those are just buzzwords right?
They just want me to search up web for APIs and constantly update them
Here's the task in full

 shut yoke
Is llama better than OpenAI in terms of API? I used OpenAI's API and it sucks unless you pay for better versions, let alone the requests which you have to pay for but they aren't expensive
 iron basalt
spring field
I think I found some holes in my math knowledge 😁, will have to study this a bi...
iron basalt
spring field
I think I found some holes in my math knowledge 😁, will have to study this a bi...
I recommend looking into how JPEG works.

Visit https://brilliant.org/Reducible/ to get started learning STEM for free, and the first 200 people will get 20% off their annual premium subscription.
Chapters:
00:00 Introducing JPEG and RGB Representation
2:15 Lossy Compression
3:41 What information can we get rid of?
4:36 Introducing YCbCr
6:10 Chroma subsampling/downsampling
8:10 Image...
(If you like 3b1b-like animated math videos)
(It (JPEG) touches a bunch of topics that come up a lot in general (WRT image processing))
iron basalt
Also the relationship between convolution and the Fourier transform that Edd touched on is really important (one of the most import applied math concepts ever), it's used to understand and improve the performance of many algorithms (you just need to view the problem from the POV of signal processing).
 visual ridge
Is there any best way to format excel data properly for data processing?
Unorganized format*
spring field
iron basalt
(If you like 3b1b-like animated math videos)
love those 
 nimble stag
Hi, I'm making a scatter graph interface to draw map images. I'm keeping it simple rn, so I'm only using small drawings of landmarks and stuff with lots of dots.
I've looked at Matplotlib, but is there any alternative library to fit my criteria here that anybody knows of?
I was wondering that my problem seems to be a very basic use case of Matplotlib where the library seems a bit overkill for what I wanted.