#data-science-and-ml
1 messages · Page 88 of 1
 agile cobalt
 plush jungle
read up on the math behind neural networks and decision trees, then try to implement simple versions of them. there are a ton of ml architectures but most of them are just neural nets with extra steps
agile cobalt
I don't even know if spark supports it, but explicitly creating a composite index for the original dataframe might be able to speed up the join - if it is only 20k rows, maybe it is not even needed to filter before, and you can just include the studyLocusId on the inner join
 storm kelp
agile cobalt
~~you should be able to avoid loading the study from the file 95% of the time th...
storm kelp
agile cobalt
~~you should be able to avoid loading the study from the file 95% of the time th...
So df starts as 20,000 loci. It then gets exploded in a different step to include all the genetic variants around it. I've not count metrics on this, but it's large. When I group back to studyLocusId there will be the original unique 20,000 loci again.
The issue with the studyId reading, is that there is no way to tell what studyId the StudyLocusID requires until I've read it in. They can be in different orders etc.
agile cobalt
not gonna lie I don't really get what you mean ; collected_loci is lazily evaluated or something like that?
even if so, there is a non negligible chance that it would be more efficient to collect it before and sort it so that you do not have to re-read the sumstats
the main thing I would focus on are not re-reading the same file multiple times and looking for ways to optimise the filter/join (such as creating an index), but I do not know how you could implement that so good luck
maybe someone else will have an idea
storm kelp
agile cobalt
not gonna lie I don't really get what you mean ; `collected_loci` is lazily eval...
I guess sort collected_loci by studyId, then write some logic into the loop that it only reads in the sumstats file if it hasn't already got the correct ones?
I am going to remove the metadata.tsv/variant counting logic from it. It's not amazingly useful data and those two .count() calls and the write call are really time consuming.
 left tartan
agile cobalt
the main thing I would focus on are not re-reading the same file multiple times ...
left tartan
agile cobalt
the main thing I would focus on are not re-reading the same file multiple times ...
Everyone knows my answer, I’d rewrite as a duckdb (or whatever OLAP you want) query.
agile cobalt
tbh I was considering recommending to use parquet instead of csv
left tartan
agile cobalt
tbh I was considering recommending to use parquet instead of csv
Yah, that too, a combination of both
It’s unclear, looking at it, which step is slow
storm kelp
agile cobalt
tbh I was considering recommending to use parquet instead of csv
Yeah I wish. Downstream pipelines want it this way though 😦
eh I can always use ThreadPoolExector to speed up the loop, because each iteration is independent
 past meteor
left tartan
Everyone knows my answer, I’d rewrite as a duckdb (or whatever OLAP you want) qu...
past meteor
left tartan
Everyone knows my answer, I’d rewrite as a duckdb (or whatever OLAP you want) qu...
Me but with Polars
 mild ingot
any one is online
 drifting summit
plush jungle
read up on the math behind neural networks and decision trees, then try to imple...
drifting summit
plush jungle
read up on the math behind neural networks and decision trees, then try to imple...
can u recommend some good resources ? preferably free
storm kelp
drifting summit
can u recommend some good resources ? preferably free
youtube
3blue1brown or whatever his youtube channel is called is very good
past meteor
drifting summit
can u recommend some good resources ? preferably free
check the pinned post of this channel
storm kelp
past meteor
check the pinned post of this channel
mate
why did I pay £25 for my hardcopy of ISL!!!
I had no idea the pdfs were free online haha
very good stats textbook @drifting summit ^
past meteor
storm kelp
why did I pay £25 for my hardcopy of ISL!!!
Do you prefer hard copies? I'd actually pay money to not have a hard copy 😩
storm kelp
past meteor
Do you prefer hard copies? I'd actually pay money to *not* have a hard copy 😩
no not at all - I paid for it because I couldn't find a decent ebook version ~5 years ago when I bought that textbook
digital is much more convenient
plush jungle
drifting summit
can u recommend some good resources ? preferably free
I second 3blue1brown. especially this video https://www.youtube.com/watch?v=aircAruvnKk

What are the neurons, why are there layers, and what is the math underlying it?
Help fund future projects: https://www.patreon.com/3blue1brown
Written/interactive form of this series: https://www.3blue1brown.com/topics/neural-networks
Additional funding for this project provided by Amplify Partners
Typo correction: At 14 minutes 45 seconds, th...
also check out medium articles. they're often behind a paywall, but when they're not the quality of the explanation is usually pretty good
storm kelp
that was the video I was thinking of
He is very good at explaining unintuitive mathmatical concepts in an intuitative way
drifting summit
plush jungle
I second 3blue1brown. especially this video https://www.youtube.com/watch?v=air...
i saw this, very informative
drifting summit
plush jungle
also check out medium articles. they're often behind a paywall, but when they'r...
just a tip u can use 12ft.io to bypass paywalls 🙂
plush jungle
drifting summit
i saw this, very informative
if you have a solid grasp of neural nets, looking into CNNs and transformers is a pretty good idea, cause it'll get you into vision and nlp
plush jungle
drifting summit
just a tip u can use 12ft.io to bypass paywalls 🙂
oh nice
drifting summit
plush jungle
if you have a solid grasp of neural nets, looking into CNNs and transformers is ...
dont have a solid grasp just yet
only understood the basic concept of nural network
plush jungle
drifting summit
dont have a solid grasp just yet
yeah I don't think I really had a solid grasp until I coded one from scratch
drifting summit
plush jungle
yeah I don't think I really had a solid grasp until I coded one from scratch
yeah i saw this guy on yt coded one from scratch
ill also try that
past meteor
drifting summit
yeah i saw this guy on yt coded one from scratch
That's not a great place to start imo
I'm also a bit apprehensive of coding neural networks from scratch - it's very much not how they're actually used.
Typically when people code them from scratch they kind of do this thing where they manually-ish write out the equations for gradient computations. In reality NN's use autograd, if you want to code one from scratch imo you should handroll a basic autograd version.
 pulsar arch
What type of NLP would I want to look into to have something that could learn to parse arbitrary media descriptions from torrent descriptions and forum posts and things like that? I would want to get resolution, length and size in a structured way so that I could normalize them to width, height, size number/gb/mb/kb and hours/minutes/seconds.
 young egret
Hi how do I join 2 tables that have overlapping data?
Inner join to be exact. I've tried merge but I don't know why the new table has 2000+ rows while both of my tables have <1000 rows
 left tartan
young egret
Hi how do I join 2 tables that have overlapping data?
left tartan
young egret
Hi how do I join 2 tables that have overlapping data?
Can you explain your data/schema a little first? And share the query/code you tried?
agile cobalt
!e  but most importantly, are the columns you're joining on all unique or do they have duplicated values?
it is possible for the result of an inner join to contain more total rows than the sum of the original tables if you are doing a many-to-many join ```py
import pandas as pd
a = pd.DataFrame({'A': [1, 1], 'B': [10, 20]})
b = pd.DataFrame({'A': [1, 1, 1], 'C': [30, 40, 50]})
merged = pd.merge(a, b, how='inner', on='A')
print(merged)
 arctic wedgeBOT
@agile cobalt :white_check_mark: Your 3.12 eval job has completed with return code 0.
001 |    A   B   C
002 | 0  1  10  30
003 | 1  1  10  40
004 | 2  1  10  50
005 | 3  1  20  30
006 | 4  1  20  40
007 | 5  1  20  50
Unfortunately I deleted the merging part but this is my code
result_df = pd.merge(result_df1, result_df2, on='ID', how='outer')
result_df['difference'] = (result_df['End Date'] - result_df['Start Date']).dt.days
result_df = result_df.loc[result_df['difference'] >= 0]
min_diff_indices = result_df.groupby(['ID', 'End Date'])['difference'].idxmin()

min_diff_rows = result_df.loc[min_diff_indices]

def get_reason_group(row):
    if row['Reason_x'] == "APS":
        return "Sunset Program"
    elif row['Reason_x'] == "TEN":
        return "Term rollover"
    elif row['Staff Proc Code_x'] in ["IZ", "AN", "BN", "CN", "DN"]:
        return "Sunset Program"
    elif row['Sel Prcs No._x'] == "Sunset Funding":
        return "Sunset Program"

# Apply the custom function to create the 'Reason Group' column
min_diff_rows['Reason Group'] = min_diff_rows.apply(get_reason_group, axis=1)
min_diff_rows['Total Difference'] = min_diff_rows.groupby('ID')['difference'].transform('sum')

# Print the resulting DataFrame
print(min_diff_rows)

result_dfS = pd.merge(result_df1, result_df2, on='ID', how='outer')
result_dfS['difference'] = (result_dfS['End Date'] - result_dfS['Start Date']).dt.days
result_dfS = result_dfS.loc[result_dfS['difference'] >= 0]
min_diff_indices_S = result_dfS.groupby(['ID', 'Start Date'])['difference'].idxmin()

# Use the indices to select the rows with the smallest difference
min_diff_rows_S = result_dfS.loc[min_diff_indices_S]


# Apply the custom function to create the 'Reason Group' column
min_diff_rows_S['Reason Group'] = min_diff_rows_S.apply(get_reason_group, axis=1)
min_diff_rows_S['Total Difference'] = min_diff_rows_S.groupby('ID')['difference'].transform('sum')
print(min_diff_rows_S)


# Print the result DataFrame
print(result_df)```Yes they have duplicated values and I want to keep the duplicated values
I want to join min_diff_rows and min_diff_rows_S
left tartan
Let's just start at line 1: you said df1 and df2 each have about 1000 rows? And you're outer joining on ID?
How many rows do you get when you do an inner join?
In other words: tell us: how many rows in df1, how many rows in df2, and how many IDs are in both df1 and df2. I'm also assuming that ID is unique, but that's also important to confirm.
young egret
On the first outer join and based on my conditions I got 557 rows
The 2nd one I got 975 rows (min_diff_rows_S), which are exactly what I want
When I tried to inner join the 2 I got something like 2265 rows
left tartan
So you're saying: line 1 (result_df) yields 557 rows
And: result_dfS = pd.merge(result_df1, result_df2, on='ID', how='outer') yields 975 rows?
young egret
the min_diff_rows has 557 rows and the min_diff_rows_S has 975 rows
There is something wrong with my total difference I think but I'll fix that later
left tartan
And what was your question again?
young egret
How do I inner join min_diff_rows and min_diff_rows_S based on ID and Start Date and End Date
I want the similar rows to appear in my final table
left tartan
If you look at your screenshot, the IDs aren't unique in min_diff_rows_S
young egret
To do that I realize I'll need to drop the total difference for now
Yes they are not unique
left tartan
So, when you join ID=1264, you'll end up with two rows, not one row
young egret
Is there a way I can only have 1 row? Since I think it appears in the first table and not in the second one
left tartan
Oh, I gotcha. You want to join where ID is the same AND start date is the same AND end date is the same, right?
young egret
Yes!
left tartan
I get there eventually 🙂
So, if you look at merge: https://pandas.pydata.org/docs/reference/api/pandas.DataFrame.merge.html
You can pass multiple columns to the left_on and right_on clauses
Or, you can pass a list to "on"... if the columns have the same name in both
In your case, on=['ID', 'Start Date', 'End Date'] I think is what you want
But, if you're doing an outer join, you'll still end up with 2 rows for 1264:
Since, row has one 1264 for 1997-03-27, and row_S has two 1264's: 1991-06-10 and 1997-03-27.
young egret
...
Wait let me put them out in a csv
I think it looks right
I just do on=['ID', 'Start Date', 'End Date'] and OMG they are unique now
kind of
ty so much you guys are life savers ❤️
 echo mesa
Guys, would it be a good idea to have jupyter notebooks for every math concept that I'm learning and the way it would work is that I'd use the markdown to explain the math concept I would use matplotlib for graphs and I would use numpy to write the according code to that concept?
agile cobalt
if it works for you, sure
young egret
Is there a way to compare rows in Python?
echo mesa
agile cobalt
if it works for you, sure
I was just wondering cause so far I've been writing out a latex paper about the mathematics that ive learned, however i wanted to also get into numpy and get comfortable with it and also as Im getting into machine learning coding is a big part of it, only thing i dont know is whether jupyter notebooks are allowing you to display latex like equations and stuff
left tartan
echo mesa
I was just wondering cause so far I've been writing out a latex paper about the ...
It's not something I do, but it's a thing (I stole this from a stackoverflow): ```py
from IPython.display import display, Math, Latex
display(Math(r'F(k) = \int_{-\infty}^{\infty} f(x) e^{2\pi i k} dx'))
I'm not 100% sure if it has builtin support for latex, but if it doesn't, there almost definitely will exist an extension to add Latex support to it
sounds like it does though
if anything maybe check if Jupyter has a more elegant solution than generic IPython?
 mild dirge
matplotlib has something latex-ish
import matplotlib.pyplot as plt


plt.xlabel(r"$\sqrt{5}$")
plt.show()
 echo mesa
agile cobalt
if anything maybe check if Jupyter has a more elegant solution than generic IPyt...
echo mesa
agile cobalt
if anything maybe check if Jupyter has a more elegant solution than generic IPyt...
I think jupyter is more popular and easier to use, but ill check im not familar with IPython though
left tartan
Oh, interesting, it works in a markdown cell too. I guess i already knew this, I just never write it: ```py
My Header
Line 2
Here's some latex
$$c = \sqrt{a^2 + b^2}$$
ipython is the foundation of jupyter.
left tartan
echo mesa
which one would you prefer?
Which one of what?
echo mesa
left tartan
Which one of what?
ohh nothing I figured it out
young egret
Is there a way for Python to automate the task of running queries, downloading the file, and uploading the file to Sharepoint daily? Just in case that happens, what should I be looking at?
 serene scaffold
young egret
Is there a way for Python to automate the task of running queries, downloading t...
serene scaffold
young egret
Is there a way for Python to automate the task of running queries, downloading t...
not really a data science question, but it's doable if sharepoint has an upload API
 lone fractal
does anyone know how to set the label on a pyplot colorbar thats being generated automatically due to a c= argument in .plot() function


 desert oar
young egret
Is there a way for Python to automate the task of running queries, downloading t...
desert oar
young egret
Is there a way for Python to automate the task of running queries, downloading t...
when i used sharepoint i was able to mount it as an extra drive (i think i called it S: but it can have any letter), and i was able to read/write files there like normal. so if you can do that, then python can save files to the mounted drive and it doesn't have to know anything specifically about "sharepoint"
as far as running queries (presumably sql?) and downloading files, yes you can definitely do that in python
 grizzled locust
hello guys, i'm new to python. i wanted to use it for data analysis purpose
grizzled locust
 quiet seal
FreeCodeCamp has a good intro to data analysis with numpy
quiet seal
FreeCodeCamp has a good intro to data analysis with numpy
does it has instruction for jupyter notebook vs code?
grizzled locust
grizzled locust
does it has instruction for jupyter notebook vs code?
sorry it was a dumb question. if you create a lpnyb file it will automatically works just like google colab
quiet seal
yeah it's built around jupyterlab
note that you can just write code in python, jupyter lets you stitch it together in a document but it doesn't actually interact with your code, just your code's output
so you're not going to box yourself in "learning jupyter" and not knowing how to do things in python, aside from that you aren't going to be writing any big applications and libraries with just basic data analysis knowledge (but you probably don't need to, just like you don't need to be an applications developer if you work on microcontrollers all day)
 unique summit
hi, im trying to run the yolov3 model for this repo:
https://github.com/chenjshnn/Object-Detection-for-Graphical-User-Interface
and I can't figure out how to run the detect.py stuff.
This is what's tripping me:
parser = argparse.ArgumentParser()
    parser.add_argument("--image_folder", type=str, default="data/samples", help="path to dataset")
    parser.add_argument("--weights_path", type=str, default="weights/yolov3.weights", help="path to weights file")
    parser.add_argument("--dataset", type=str, default="rico", help="path to weights file")
    parser.add_argument("--conf_thres", type=float, default=0.8, help="object confidence threshold")
    parser.add_argument("--nms_thres", type=float, default=0.4, help="iou thresshold for non-maximum suppression")
    parser.add_argument("--batch_size", type=int, default=1, help="size of the batches")
    parser.add_argument("--n_cpu", type=int, default=0, help="number of cpu threads to use during batch generation")
    parser.add_argument("--img_size", type=int, default=416, help="size of each image dimension")
    parser.add_argument("--checkpoint_model", type=str, help="path to checkpoint model")
    opt = parser.parse_args()
    print(opt)
I currently understand that these are args that I have to pass in to run the code but having to understand what each of them do is a little hard. I read the requirement.txt and info but still am a little lost
 lapis sequoia
I am seeking a path to convince myself that it is not too late to enter the AI field, even with limited programming knowledge. I am eager to learn whatever is necessary. The issue is that I only have approximately 2-3 months to learn. This is why I need a customized curriculum that can be completed in a short period and also be relevant to my work area. Due to time constraints, I am willing to skip libraries or concepts that are not essential for my criteria, such as pygame (since I have no intention of creating a game at the moment). I am requesting assistance from experts in providing clear guidance. If possible, I would be grateful if someone could provide a detailed roadmap from beginning to end, including specific concepts and libraries.
Examples of tasks I want to accomplish:
Automation: Develop a tool that can create a social media post in Canva, retrieve it, and post it on Instagram with the appropriate description and hashtags. Additionally, it would be great if it could take comments and utilize an LLM to generate a response, then post the reply itself.
Deploy and maintain an open-source LLM in the cloud and connect it with my website, applications, or existing social apps like Discord and Telegram. Furthermore, I need to integrate it with a chatbot that can be utilized by creators or business owners. (APIs and related aspects are also important.)
mild dirge
lapis sequoia
I am seeking a path to convince myself that it is not too late to enter the AI f...
This sounds like botting, and almost definitely against TOS
And there are no shortcuts in AI, you start with the mathematics (calculus and linear algebra mostly) and then go on with statistics/probability theory. You will also need to develop programming skills to be able to implement anything.
lapis sequoia
mild dirge
This sounds like botting, and almost definitely against TOS
I'm actually bad in english that's why I refined my request using gpt
And I just wanna be more of an integrator, not an actual AI developer because I know that requires years of hard work and intellect. I'm learning front end web dev and I wanted to integrate AI in both platform bots and websites
grizzled locust
anyone here understand kmeans and clustering?
how do you read a clustering matrix?
mild dirge
What shape is the clustering matrix? @grizzled locust
grizzled locust
mild dirge
What shape is the clustering matrix? <@861578574381449278>
like this
 grizzled locust
mild dirge
Like 3 columns/features? (or x,y,z)
grizzled locust
mild dirge
Like 3 columns/features? (or x,y,z)
no, it's 2d using the scatter plot
mild dirge
So why are there 3 columns, A,B,C ?
grizzled locust
mild dirge
So why are there 3 columns, A,B,C ?
it's just, How do i say it?
there's a .csv data with column A, B and C.
mild dirge
And you try kmeans clustering on this data with 3 columns?
grizzled locust
mild dirge
And you try kmeans clustering on this data with 3 columns?
it's actually just an example from my bootcamp class
mild dirge
grizzled locust
no, it's 2d using the scatter plot
Right, but 3 columns means the data is 3D, so why do you think it is 2D?
There's 3 features right?
grizzled locust
mild dirge
There's 3 features right?
because of this, i guess?
 mild dirge
Hmm right. But that shows the scatter plots pairwise
But for the kmeans clustering you look at all 3 features at once
So each sample is basically a 3d point
And you try to find clusters in this 3D point cloud
grizzled locust
alright, my mind is blown.
mild dirge

So basically this. Here we have 3D points. And we have found 3 clusters, red/blue/green
And that amtrix of yours shows the center of each of those clusters
So in your case you have 4 clusters, 3 dimensions. Each row shows the x/y/z, or A/B/C coordinate of the center of a cluster
And there are 4 rows because there are 4 clusters
grizzled locust
sorry if this sounds like a dumb question, so what you're saying is that 3 columns should use a 3 dimensional scatter plot?
mild dirge
Well that is how you can interpret it with 3 columns yes
When you only have 2 features you can make a 2d scatterplot
mild dirge
grizzled locust
because of this, i guess?
Like these ones here shows the scatter plot of all the samples with only two features for each plot
So the plots are 2D
 fierce kiln

Hello guys, I was working on a computer vision model for a relatively challenging data. After the hyperparameter evolution, I got the following results.
How's the precision and recall curves? The mAP seems satisfactory. Can I still improve my results by increasing the number of epochs?
grizzled locust
I'll ask my instructor about this.
perhaps that's why the cluster matrix doesn't makes sense to me
mild dirge
What is confusing you right now?

 mild dirge
So cluster 0 has as center (1067., 66., 380.)

 mild dirge
I think it is pretty subjective to convert the cluster coordinates to some kind of description as in the image below
I guess you could say something about the relative values of the A,B,C coordinate of the center
grizzled locust
mild dirge
I think it is pretty subjective to convert the cluster coordinates to some kind ...
my instructor said that how do you makes cluster is subjective and depends on the stakeholder
if the cluster is represntative enough, then it's fine.
mild dirge
They seem to just want some generic information about the position of the cluster, so just do that I guess.
Can maybe also say something about the size and spread of the cluster
grizzled locust
mild dirge
They seem to just want some generic information about the position of the cluste...
okay, looks like how do you interpret a cluster is highly subjective, i guess?
mild dirge
Yeah pretty much. It depends on what information is "interesting"
And interesting is subjective
Depends on the goal of clustering in the first place
grizzled locust
mild dirge
Depends on the goal of clustering in the first place
my instructor said that He once make a 13 group of cluster for a car company for customer segmentation
but he says 6-7 group of cluster is enough for the business team
is that true?
mild dirge
Really depends on the usecase. I recently made a clustering algorithm that has like 400 clusters because it tries to find separate trees in a 3d point cloud of a forest.
And there are around 400 trees in the forest 😛
grizzled locust
aight, thanks for explaining kmeans clustering
i guess i'll stick to "if you can make it simple, why not?"
mild dirge
That's a good motto to live by
plush jungle
anyone here into RL? I've been getting really into it since I got stable baselines and mujoco up and running, but I'd love to collab with anyone if anyone has any cool ideas
the project I'm working on now is my own version of the boxing sim from this paper:
https://research.facebook.com/publications/control-strategies-for-physically-simulated-characters-performing-two-player-competitive-sports/
Meta Research
In this paper, we develop a learning framework that generates control policies for physically simulated athletes who have many degrees-of-freedom. Our framework uses a two...
with the end goal being to produce various different boxing agents and pit them against each other to see what happens
the study looks like it's pitting the same agent against itself, which is interesting, but I'd also like to see a really well trained agent just beating the tar out of a worse trained agent
right now I'm training a ppo model on the Humanoid-v4 mujoco environment
i figure once it learns to walk I can modify the environment to add a boxing ring and teach it to try to stay in the center of the ring
then from there add a training dummy and teach it to hit the dummy
and then use self learning to teach it to box against a copy of itself
 buoyant vine
If anyone has worked with pytorchtext before, I am trying to follow https://pytorch.org/text/stable/tutorials/sst2_classification_non_distributed.html but use PT Lighning and turn it into a multi-class classifier.
But when running I am having an issue:
  File "D:\work\epam_data_crawler\.venv\Lib\site-packages\torch\nn\modules\module.py", line 1518, in _wrapped_call_impl
    return self._call_impl(*args, **kwargs)
           ^^^^^^^^^^^^^^^^^^^^^^^^^^^^^^^^
  File "D:\work\epam_data_crawler\.venv\Lib\site-packages\torch\nn\modules\module.py", line 1527, in _call_impl
    return forward_call(*args, **kwargs)
           ^^^^^^^^^^^^^^^^^^^^^^^^^^^^^
  File "D:\work\epam_data_crawler\.venv\Lib\site-packages\torch\nn\modules\linear.py", line 114, in forward
    return F.linear(input, self.weight, self.bias)
           ^^^^^^^^^^^^^^^^^^^^^^^^^^^^^^^^^^^^^^^
RuntimeError: mat1 and mat2 shapes cannot be multiplied (64x1024 and 768x768)
The 64 is the dataloader batch size, but how do I go about fixing this? The model embedding size should be 768, I am not sure where the 1024 is coming from :/
The actual model setup:
        self.classifier_head = RobertaClassificationHead(num_classes=self.n_classes, input_dim=EMBEDDING_SIZE)
        self.model = XLMR_LARGE_ENCODER.get_model(head=self.classifier_head)
With validation step as:
    def validation_step(self, batch, batch_idx):
        text = batch["text"]
        label = batch["label"][:, -1, :]

        logits = self.forward(text)

        loss = self.loss_fn(logits, label)
        self.log("val_loss", loss)

        self.val_f1_score(F.sigmoid(logits), label)
        self.log("val_f1_score", self.val_f1_score, prog_bar=True)
    def forward(self, text):
        return self.model(text)
Is curerently the forward method, but i think this is wrong and I need to change it 😅
agile cobalt
buoyant vine
If anyone has worked with pytorchtext before, I am trying to follow https://pyto...
what is the size of your batch?
agile cobalt
buoyant vine
If anyone has worked with pytorchtext before, I am trying to follow https://pyto...
the XLMR_BASE_ENCODER encoder embeddings are sized 768
the XLMR_LARGE_ENCODER encoder embeddings are sized 1024
 Bruh how did I miss that
agile cobalt
Bruh how did I miss that
agile cobalt
I'm still confused though, shouldn't the input have three dimensions? oh wait nvm
agile cobalt
buoyant vine
<:notlikeduck:881458579033432094> Bruh how did I miss that
tbf it feels very poorly documented, I went digging into the paper to find it 
buoyant vine
Ikr, considering it supposed to be a guide
it also doesn't help that Lightning complicates things
 tired arch
what is data science, data scientist , data analytics
agile cobalt
tired arch
what is data science, data scientist , data analytics
- data science: the most generic name possible for a collection of fields focused on studying data and ways to make better use of it
- data scientist: professional that works with data (data analysis, machine learning etc - essentially make use of data to look for opportunities to improve existing processes)
- data analytics: find meaning in data (trends, outliers, inconsistencies etc) and make it more presentable
tired arch
agile cobalt
- data science: the most generic name possible for a collection of fields focuse...
python , R and sql are used for these ?
i was checking some courses on data science and the course contents , what data they are talking about ?
agile cobalt
SQL is ultra old but still extremely widely used ; it's used to work with data overall, not just within data science but literally in any program that needs to store information at all
python is used for analytics and machine learning amonst other things
R is mainly used for analytics
agile cobalt
tired arch
i was checking some courses on data science and the course contents , what data ...
probably just generic data ; as in, almost literally any information that may exists in any business
tired arch
i want to understand practically lets say someone a data scientist in IBM , what's his job ?
past meteor
Every company defines the data scientist title differently
At Meta "data scientist" is closer to etrotta's definition of data analystics etc. iirc
agile cobalt
tired arch
i want to understand practically lets say someone a data scientist in IBM , what...
I'd recommend looking up job openings at IBM and see what they list themselves
tired arch
ok let me check
buoyant vine
Is there a way of reducing the GPU memory usage pytorch consumes?
torch.cuda.OutOfMemoryError: CUDA out of memory. Tried to allocate 256.00 MiB. GPU 0 has a total capacty of 22.20 GiB of which 111.12 MiB is free. Process 8202 has 22.09 GiB memory in use. Of the allocated memory 21.73 GiB is allocated by PyTorch, and 71.37 MiB is reserved by PyTorch but unallocated. If reserved but unallocated memory is large try setting max_split_size_mb to avoid fragmentation. See documentation for Memory Management and PYTORCH_CUDA_ALLOC_CONF
Popping up only with a batch size of 64, which makes me a bit sad with the idea of possibly having to setup a distributed GPU cluster 
mild dirge
Lowering batch size 😛 @buoyant vine
or input resolution if the data is images
Or reduce the model size
agile cobalt
maybe double check that you do not have any memory leaks / dangling stuff and restart the kernel if you haven't yet?
mild dirge
Yeah don't use a notebook for anything cuda/pytorch
buoyant vine
it is the CI runner so it is effectively a blank canvas
 I shall lower the batch size xD
let's try 32 rather than 64
Maybe I should quantize it as well at some point
I think each data point atm is like 4KB by itself
agile cobalt
maybe using fewer layers of the pretrained network could work?
(like instead of putting the head after the 10th layer, put it in after the 6th and cut out 7,8,9,10 ; made up numbers, I don't know how many layers it actually has)
and/or use the smaller base instead of the large model
buoyant vine
I don't have a large amount of control over that, since this is a pre-built Pytorch model config
But I don't think it has many layers at all
Normally they are only a linear layer or two
 bronze flint
buoyant vine
Is there a way of reducing the GPU memory usage pytorch consumes?
```
torch.cud...
bronze flint
buoyant vine
Is there a way of reducing the GPU memory usage pytorch consumes?
```
torch.cud...
Could you be more specific
Your hyperparameters, task, layers etc
The first thing that pops out as solution to your issue on stack overflow is
https://stackoverflow.com/questions/59129812/how-to-avoid-cuda-out-of-memory-in-pytorch
Check if it helps

Stack Overflow
I think it's a pretty common message for PyTorch users with low GPU memory:
RuntimeError: CUDA out of memory. Tried to allocate X MiB (GPU X; X GiB total capacity; X GiB already allocated; X MiB fr...
bronze flint
mild dirge
Lowering batch size 😛 <@290923752475066368>
Lowering batch size decreases performance?
mild dirge
bronze flint
Lowering batch size decreases performance?
No, lowering batch size means you update the model more often.
It does not necessarily lower performance, that is why stochastic gradient descend exists f.e., it can even help
Unless you mean performance as in speed, in which case it would probably affect it yes
 mystic root
Hey everyone!
I currently have a list of dicts in the following format
[
    [{"field": "fieldName", "value": 14}, {"field": "field2, "value": 15}],
    [{"field": "fieldName", "value": 20}, {"field": "field2, "value": 25}]
]
I want to convert this to a DF of the following format
   fieldName  field2
0  14         15
1  20         25
Wondering how I could do this
I was able to find this: https://stackoverflow.com/questions/63058953/rotate-pandas-dataframe-with-rows-of-json-to-plain-dataframe
Which is somewhat similar which for my use case translates to
data = [
    [{"field": "fieldName", "value": 14}, {"field": "field2, "value": 15}],
    [{"field": "fieldName", "value": 20}, {"field": "field2, "value": 25}]
]

data_series = pd.Series(data)
data_series = data_series.explode()

pd.DataFrame(data_series.tolist(), index=data_series.index).set_index('field', append=True)['value'].unstack()
but this leaves the data frame without an index which isn't desirable
buoyant vine
 ../aten/src/ATen/native/cuda/Loss.cu:250: nll_loss_forward_reduce_cuda_kernel_2d: block: [0,0,0], thread: [3,0,0] Assertion `t >= 0 && t < n_classes` failed.
Traceback (most recent call last):
  File "/__w/epam_data_crawler/epam_data_crawler/classifier/models/reddit_glove_v3/model.py", line 71, in training_step
    loss = self.loss_fn(output, label)
  File "/__w/_tool/Python/3.10.13/x64/lib/python3.10/site-packages/torch/nn/modules/module.py", line 1518, in _wrapped_call_impl
    return self._call_impl(*args, **kwargs)
  File "/__w/_tool/Python/3.10.13/x64/lib/python3.10/site-packages/torch/nn/modules/module.py", line 1527, in _call_impl
    return forward_call(*args, **kwargs)
  File "/__w/_tool/Python/3.10.13/x64/lib/python3.10/site-packages/torch/nn/modules/loss.py", line 1179, in forward
    return F.cross_entropy(input, target, weight=self.weight,
  File "/__w/_tool/Python/3.10.13/x64/lib/python3.10/site-packages/torch/nn/functional.py", line 3053, in cross_entropy
    return torch._C._nn.cross_entropy_loss(input, target, weight, _Reduction.get_enum(reduction), ignore_index, label_smoothing)
RuntimeError: CUDA error: device-side assert triggered
Compile with `TORCH_USE_CUDA_DSA` to enable device-side assertions.
ahhhhhhhhh
 Why must this be so hard, why are the errors always kinda cursed tho?
mild dirge
buoyant vine
```py
../aten/src/ATen/native/cuda/Loss.cu:250: nll_loss_forward_reduce_cuda_ke...
This just means you have a class id that is higher than (or equal to) the number of output nodes
bronze flint
mild dirge
Unless you mean performance as in speed, in which case it would probably affect ...
resources consumption, yes
You are doing lots more computations
Though i suppose the stack overflow link solves their problem
left tartan
mystic root
I was able to find this: <https://stackoverflow.com/questions/63058953/rotate-pa...
Simple approach: flatten to a list of dicts, while inserting an id field for each row (each pair of dicts). Then create a df from the list of dicts. Then pivot on Field (using id for rows).
 golden oak
Howdy, I think this is the correct location to post this, since Ray. I have ray interacting with all my data 100% in my compile environment, but I really want to convert the project to a distributable standalone exe. Ive tried both nuitka and pyinstaller and neither seem to agree with ray. Anyone run into this? Anything that will let me make this an exe would be great. Nuitka is ideal because it also gives a bit of speed gains.
 misty flint
buoyant vine
<:PepeHands:734461705240707128> Why must this be so hard, why are the errors alw...
misty flint
buoyant vine
<:PepeHands:734461705240707128> Why must this be so hard, why are the errors alw...

its p bad
but is it more cursed than pyspark traces tho

buoyant vine
Honestly if ur using PySpark I think you deserve it 
 buoyant vine
```py
../aten/src/ATen/native/cuda/Loss.cu:250: nll_loss_forward_reduce_cuda_ke...
buoyant vine
buoyant vine
```py
../aten/src/ATen/native/cuda/Loss.cu:250: nll_loss_forward_reduce_cuda_ke...
Btw shout out to the model for producing this error in another place 2 hours into training 🙃
And now I go to sleep and hope it worked this time

Ha, lol, no servers available on AWS region, attempt 2
 hidden ferry
Anyone dealing with pandas ? For data cleaning
agile cobalt
don't ask to ask, just ask your question directly
hidden ferry
So this is the right channel , so basically I'm having this financial spreadsheet , let me think about the question very precisely
 umbral karma
Hi, how can I safely update a database from different threads? I am currently using a Queue to pass data to an extra thread that writes and removes from the database. The only problem is that it is not consistent, and sometimes the changes would not sync.
 hallow light
Hi, I'm using Isolation Forest for anomaly detection. The issue is that it is taking up to 40 minutes to check the data and predict. Is there anything I can do to speed up the process?
past meteor
hallow light
Hi, I'm using Isolation Forest for anomaly detection. The issue is that it is ta...
Are you using sklearn? You can start by setting n_jobs=-1 to use all of your cores. If you know how many you have one the top of your had I recommend using 1 or 2 less than the total amount.
I recently noticed RandomForest specifically was significantly slower when I was using a sparse matrix. If anything in your Pipeline is making your output sparse (think: one hot encoding) the entire output will be sparse. I'd check all your steps and set sparse_output=False. You might need to benchmark this one though! 🙂
Finally, I don't know the dimensionality of your problem but you can always consider throwing in a PCA somewhere. Be sure to hyperparameter tune n_components because it might destroy performance.
 quaint skiff
Hi, I am trying to make a model to predict or interpolate values of 2 D arrays using a few given indices. I want to get an accuracy of +-6 points to the predicted value, can someone suggest me how to increase my predicted accuracy
https://gist.github.com/Rishu026/ab934ff8bd57bfbd3323e5a94e9ab934
I have shared the code for the python code I have worked on till now.
I have used polynomial regression method and am basically training the model using 9 indices and predicting the rest 16 values under z_pred.
Gist
Below is the reference data for 2-D z array across x and y dimensions. x & y arrays are also specified below: xfull = ([0.00165436, 0.258037, 0.514419, 1.02718, 2.05269]) yfull = ([0.001654...
bronze flint
Anyone had experience with Apache Spark Streaming?
I am trying to set it up on windows but hadoop is sipping my blood
 azure wadi
Hey there! I would like to create a model to find anomalies into a time series, any idea? 🙏
 narrow tiger
chat bots and AI (like chatgpt or Dalle) how do they work? like i wanna learn the basics of them not fork a github watch magic
what's the most basic thing i can build to get started
mild dirge
narrow tiger
what's the most basic thing i can build to get started
Linear regression is probably the most basic model
It will probably take a few months/years from not knowing anything about ai to understanding the concepts underlying gpt
narrow tiger
then i better get started ,
but is there any guide where i can see the most basic models (which are trained on some data set) like i wana know what these so called "models" look like
agile cobalt
you might want to take a look at HuggingFace, but don't expect to understand the technical details without studying from the fundations first
narrow tiger
thanks i will
wait is anyone of u using your own personal little AI
i think AI bots designed for personal use and trained with personal data might be big market in future what do you guys think
past meteor
narrow tiger
what's the most basic thing i can build to get started
I think foundation models etc. mean if you're working on NLP/CVish spaces you can probably get a way by just knowing how to work with a high level API or some cloud service. It's not my preferred style but it can work.
agile cobalt
narrow tiger
wait is anyone of u using your own personal little AI
i think AI bots designed ...
RAG (retrieval augmented generation) chatbots are already a thing you can easily find tutorials for on Youtube (store the data in vector databases and feed it the the model when generating text), and some companies are even fine-tuning GPT 3.5 Turbo on their datasets, but training/fine tuning is hella expensive
past meteor
past meteor
I think foundation models etc. mean if you're working on NLP/CVish spaces you ca...
Maybe some of you will disagree with this, curious on your opinions. I think AI/ML will go towards say software where you have systems programmers doing lower level stuff (e.g., the people that still understand architectures, lin alg, calc, ...) and application programmers (orchestrating stuff).
People wanting to get in now probably should decide what they want to do because it means you might be able to skip a lot of the math/stats if you wan to just do the latter.
agile cobalt
past meteor
Maybe some of you will disagree with this, curious on your opinions. I think AI/...
I mean, OpenAI literally suggested for LLMOps to become a thing on their recent dev day event (akin to MLOps/DevOps, but specifically for generative models)
edit; not just OpenAI, if you throw LLMOps on Google you can find a github Awesome list and blog posts from a bunch of companies like WandB and databricks...
narrow tiger
past meteor
I think foundation models etc. mean if you're working on NLP/CVish spaces you ca...
i don't want to do that (use api) rather just learn what most basic model i can build my self and train on some data
this is just to understan how lower level stuff works
like how can you train a program
past meteor
If that's really the case then I encourage you to 1) do what etrotta suggested 2) interleave it with going through the math, stats, ml fundamentals
agile cobalt
training a large language model like GPT3 yourself from scratch is an unrealistic goal ; they take millions of dollars worth of compute
there are some open source projects that can train something on the level of GPT2 on consume grade hardware, but that's very far from being useful in practice
the best you can realistically do without using corporation APIs is fine tuning existing open source models
narrow tiger
agile cobalt
training a large language model like GPT3 yourself from scratch is an unrealisti...
yeah i can imagine
i don't want to make gpt3
i want to know how it works , like how can iit answer questiioiins, the "models" that can get traiined how are they made
past meteor
I'm going to do a talk about something similar to this soonish 😄
The tradeoffs of it all, maybe you can finetune a model but that means you need data. Do you want to gather, clean, etc. all the data. Is the performance increment worth it? If you like working on-prem or with something like an EC2 instance, can you afford renting a GPU? (note: the answer is no). If not, are you okay with paying for serverless in perpetuity
narrow tiger
narrow tiger
yeah i can imagine
i don't want to make gpt3
i want to know how it works , lik...
maybe i am asking the wrong qquestion or it doesn't make sense 😭
like i have used some opensource libs for background removal and 1 like chatgpt that can answer basic questions while running on local host somehow
i want to know how it works and how are these models created that can be trained
past meteor
narrow tiger
maybe i am asking the wrong qquestion or it doesn't make sense 😭
like i have u...
Then you should read this book: https://d2l.ai/
agile cobalt
narrow tiger
yeah i can imagine
i don't want to make gpt3
i want to know how it works , lik...
if you want something relatively short,
- https://www.youtube.com/watch?v=jkrNMKz9pWU
- some of https://www.deeplearning.ai/short-courses/ (in particular, a few explain embeddings and one or two might explain the human in the loop fine tuning they use for gpt-instruct and alike models)
if you want to learn it 'properly', take a long course or even a graduation on machine learning
narrow tiger
thanks i'll go through them
past meteor
dive into deep learning starts with lin reg and expands the idea all the way from feed forward neural nets to CNNs to RNNs to transformers etc.
But it's long
narrow tiger
i'll try to learn as much as i can
i trying to get into software engineering and trying different things you never know what u might end up liking
also having basic knowledge ain't gonna hurt
 iron basalt
past meteor
Maybe some of you will disagree with this, curious on your opinions. I think AI/...
iron basalt
past meteor
Maybe some of you will disagree with this, curious on your opinions. I think AI/...
We are kind of already there. I would guess that most AI/ML developers don't actually know how to implement their own CUDA kernels, but they do make heavy use of them. Most people use libraries like Pytorch, but do not write them. While there is a lot of flexibility with these kinds of libraries, the users are still limited to specific kinds of ML. But they don't need to know nearly as many (software) details. Messing around within something like deep learning, versus creating the something entirely new (like when deep learning was first created) are two very different things with different skill requirements. I do not see why there would not also be a third layer to this (or more) once we have more universal models that require even less knowledge to use correctly (we are getting there). So there are already at least 2-3 layers/options and it's important for someone to know which they want so they don't waste time on things they don't really need to know. But right now even the highest level still needs some basic understanding of statistics (or very bad over-confident decision making will follow).
past meteor
iron basalt
We are kind of already there. I would guess that most AI/ML developers don't act...
Yeah, I'd say GPU programming is a totally different beast to begin with. I have friends working on that and they barely know any AI/ML. It's totally something else. I don't think knowing it makes you a better data scientist / ML engineer either.
serene scaffold
past meteor
Maybe some of you will disagree with this, curious on your opinions. I think AI/...
I think that's where we're going.
iron basalt
past meteor
Yeah, I'd say GPU programming is a totally different beast to begin with. I have...
If you are on lets say "level 0," it does matter a lot. If you want to implement some entirely new thing, you need to be able to implement some kernels for it to scale so that it does something actually interesting.
The feedback loop of being able to write your own stuff is really valuable.
past meteor
But you can make something work as-is without having optimised versions for it on the CUDA level.
iron basalt
It also gives you a much better idea what kinds of ideas are actually feasible / work well on current hardware.
iron basalt
past meteor
But you can make something work as-is without having optimised versions for it o...
Yeah, if you want really optimized, it's time to get a GPU programmer.
past meteor
iron basalt
Yeah, if you want really optimized, it's time to get a GPU programmer.
Yeah, indeed. You can make something totally new, get it published and then get in a GPU programmer to optimise it. I don't think having optimized instructions are a bottleneck for trying things.
iron basalt
past meteor
Yeah, indeed. You can make something totally new, get it published *and then* ge...
Kind of. At some point you want to scale things to make impressive demos / papers. And for that you need GPU programmers and more.
And a lot of things only really shine at scale. At small scales many things are equally viable and work just as well.
past meteor
Not all of ML is deep learning and not all of deep learning is LLMs tbh
There's still tons of innovation to be done outside of the LLM space where hardware isn't the bottleneck
serene scaffold
past meteor
Not all of ML is deep learning and not all of deep learning is LLMs tbh
it's not?!?!?!?!?!?!?!
(the LLM part)
past meteor
Yeah, sometimes I feel like we've succesfully conflated AI with ML and now we're succesfully conflating ML with DL 😩
iron basalt
past meteor
There's still tons of innovation to be done outside of the LLM space where hardw...
Yeah, I happen to work on stuff that also scales down, not just up. Running ML on Raspberry PI zero and such.
agile cobalt
serene scaffold
(the LLM part)
~~the other way around but ~~ don't forget pr00mpt engineering 
iron basalt
Also even on the large scale side, LLMs are just a small part of all the kinds of ML that require scale.
They are currently in fashion though, so everyone is working on one.
past meteor
The reason why I'm a bit less attracted to this space is it's harder to get out of the PoC phase unless you're willing to pay OpenAI or HF in perpetuity
iron basalt
past meteor
The reason why I'm a bit less attracted to this space is it's harder to get out ...
Yeah OpenAI is really cornering it all, very monopoly style.
past meteor
Once it's time to deploy this stuff you'll have a service that is just totally bottlenecked by the number of GPUs you have.
iron basalt
Even with the new AI regulations, designed to benefit them...
past meteor
How do you scale that?
If it's some algorithm that can comfortably run on CPU you can just do the inference inside your application server on a different thread or so.
Nobody talks about this 🤷
iron basalt
past meteor
How do you scale that?
You can actually make it take way less processing power. The current methods used (deep learning and transformers) do not actually scale well, they waste a lot of processing power. But they work (for now) so people do them anyhow, easier than making something else.
past meteor
iron basalt
You can actually make it take way less processing power. The current methods use...
Quantisation and post-training pruning?
Afaik depending on the model you'll still need to run it on GPU or wait a very long time.
iron basalt
past meteor
Quantisation and post-training pruning?
Sparsification, more biologically accurate methods. They are much more efficient in training too.
(Orders of magnitude)
past meteor
I see sparsification is a synonym for pruning
iron basalt
A human's brain uses so little energy compared to what GPUs are doing, yet they work so much better, should a big hint that we are doing it very wrong.
iron basalt
past meteor
I see sparsification is a synonym for pruning
It's sparse from the start.
past meteor
How? Some sort of L1 regularization during training?
Is this being done already or is this hypothethical
iron basalt
past meteor
How? Some sort of L1 regularization during training?
There are many different sparse methods, but one that still uses deep learning (backprop) is routing (or whatever Google calls it now). You can think of it as selecting sub-networks.
It already exists, since like 1967~.
Implemented mostly in the 80s onward.
past meteor
Never heard of it, interesting.
iron basalt
(Not routing specifically, sparse methods)
Adaptive resonance theory (ART) is a theory developed by Stephen Grossberg and Gail Carpenter on aspects of how the brain processes information. It describes a number of neural network models which use supervised and unsupervised learning methods, and address problems such as pattern recognition and prediction.
The primary intuition behind the A...
Is sparse, and its own branch of ML (because there are so many different variants like how there are so many types of deep learning models).
One of my favorites.
 iron basalt
So there is some important distinctions to make.
young egret
Does anyone have a link or something I can read about lambda?
iron basalt
There are methods that have sparse regularization and such, and then there are sparse methods as in the computation itself is sparse.
This is key as it's what makes it much less costly computation-wise.
past meteor
Aha, so you mean sparse in the sense like how lin alg has sparse variants of algorithms
E.g., sparse PCA
iron basalt
Like sparse matrices, yeah.
young egret
especially .apply(lambda
past meteor
Isn't there a trade-off with SIMD?
iron basalt
Like you can have a sparse matrix multiplication the dense way, where you just do it normally like a dense matrix, or you can skip all the zeros, in the sparse way if stored correctly.
iron basalt
past meteor
Isn't there a trade-off with SIMD?
That depends on the method, but no, not really, we make heavy use of SIMD.
For example ART will still make perfect use of SIMD.
past meteor
So typically you're doing a space vs speed trade-off then
iron basalt
Yes.
past meteor
I had never heard of ART, I'm glad I did now 🙂
iron basalt
This can make things more difficult to implement if you scale really big btw, as you may now need some kind of database to retrieve memory / paging systems (mass storage).
Not too crazy though, already used to this kind stuff from batching probably.
past meteor
Well, it's still kind of a big system
Maybe someone has a trivial NLP problem that can be solved with SVD?
Sure it'll be worse than an LLM but the thing runs perfectly on CPU and will be several orders of magnitude easier to scale, maintain etc.
iron basalt
We have language models that run on the CPU (train on the CPU) with such methods.
It scales down and up.
past meteor
I kind of like doing my best to avoid these concerns all together. Again, unless we're happy with paying OpenAI in perpetuity because then this solution becomes easier.
iron basalt
One of the main benefits of sparse (in training) methods it that they tend to have online learning capabilities. The main downside is that this is not well understood at all, so unless you are really into research, maybe wait on it.
past meteor
Regular DL has online learning as well, no?
iron basalt
As there are far fewer people working on it too, it's harder to get into.
past meteor
Well, in the cases where you observe y_true after your prediction that is
iron basalt
past meteor
Regular DL has online learning as well, no?
No, not really, people have tried, it fails hard, and for fundemental reasons (I.I.D. assumptions).
A simple test for example is in-order MNIST, that is, rather than shuffle the data, sort it, and you can only see each sample once.
No epochs.
past meteor
iron basalt
No, not really, people have tried, it fails hard, and for fundemental reasons (I...
That's already running under the assumption test ~ D1 , train ~ D2 and D1 != D2
I did my thesis on online learning in a simulation setting. For what it's worth I'd not update online but rather in some controlled environment and then swap out a new model.
iron basalt
past meteor
I did my thesis on online learning in a simulation setting. For what it's worth ...
Yup, but consider that your environemnt is not controlled, you can't possibly collect data for all cases ahead of time, and your goal is also create some kind of AGI, humans are online learners, and so this is kind of a personal requirement.
past meteor
iron basalt
A simple test for example is in-order MNIST, that is, rather than shuffle the da...
This is an interesting case but here you've created a setting where D1 != D2 artificially
iron basalt
past meteor
This is an interesting case but here you've created a setting where `D1 != D2` a...
Yeah, it's an artificial example, but online learners can do it.
It's a common test in the world of online ML.
past meteor
In a way backprop can't?
iron basalt
past meteor
In a way backprop can't?
Yes. Backprop can, if you do routing actually. It's more so the sparsity actually.
Dense methods suffer from catastrophic forgetting.
past meteor
The most worrisome thing about online learning is that you're at the mercy of hyperparameters (learning rate, more specifically: how rapidly will I respond to change and how resilient will I be to noise) and you can't set them a priori as they're problem specific
iron basalt
past meteor
The most worrisome thing about online learning is that you're at the mercy of hy...
Actually, ART solves exactly this problem.
How to learn new things (one-shot) without disrupting existing knowledge.
past meteor
Then I'll have to read this soon, if not tonight
iron basalt
It was invented to solve the stability-plasticity dilema in neuroscience (that is what they call it there).
There are also many versions of ART, many that are even more resiliant to noise.
One of my favorites is TopoART which even learns the topology.
past meteor
The way I proposed solving it was having a "test suite" where different models are tried and then either a new one is selected with manual intervention or you have a heuristic
The use case was demand forecasting so it's something where you can feasibly manually intervene because orders etc. aren't made in real time, it's once per X
iron basalt
past meteor
The way I proposed solving it was having a "test suite" where different models a...
We have a test suite, we work on AGI and so we actually have a single model that does everything from lunar lander to language modelling, it must pass all of them.
past meteor
Are you at a Google / Meta / ... tier organization?
mild dirge
iron basalt
Actually, ART solves exactly this problem.
art?
iron basalt
mild dirge
art?
mild dirge
thanks
iron basalt
past meteor
Are you at a Google / Meta / ... tier organization?
Sorry, I am not willing to share information about that at this time. But if you want some pointers on these topics I can give you them.
past meteor
iron basalt
Sorry, I am not willing to share information about that at this time. But if you...
I'll just pick up a survey on ART together with a healthy level of scepticism 😄
I believed the core problem of concept drift / online learning / ... was a fundamentally unsolveable one so I'm curious.
iron basalt
past meteor
I'll just pick up a survey on ART together with a healthy level of scepticism 😄
There is finally a nice big book on it now: https://www.amazon.com/Conscious-Mind-Resonant-Brain-Makes/dp/0190070552

How does your mind work? How does your brain give rise to your mind? These are questions that all of us have wondered about at some point in our lives, if only because everything that we know is experienced in our minds. They are also very hard questions to answer. After all, how can a mind under...
(From the inventor)
past meteor
iron basalt
There is finally a nice big book on it now: https://www.amazon.com/Conscious-Min...
Great, I'll get this.
iron basalt
This one is more from the neuroscience side, but it's pretty easy to implement in code and has been used in industry for a long time now, so there are a bunch of code samples out there.
Here is a pretty nice survey: https://arxiv.org/pdf/1905.11437.pdf
past meteor
My partner is in neuroscience so I should ask. Adaptive resonance theory does sound like something she's spoken about 🤔
iron basalt
There are even less explored online learning capable methods than ART, with even less people working on them, but I think ART is pretty solid and will probably stick around for a long time. So ART is really just the tip of the iceberg.
lapis sequoia
numpy.core._exceptions._ArrayMemoryError: Unable to allocate 17.8 GiB for an array with shape (48901, 48901) and data type float64
The above exception was the direct cause of the following exception:
Traceback (most recent call last):
File "d:\bbbbbbbbbeeeeeeee\python practice.py\newtrail pod.py", line 27, in <module>
U, s, Vt = svd(reduced_data_matrix)
File "C:\Users\Vishal\AppData\Local\Programs\Python\Python310\lib\site-packages\scipy\linalg_decomp_svd.py", line 127, in svd
u, s, v, info = gesXd(a1, compute_uv=computeuv, lwork=lwork,
TypeError: ArrayMemoryError.__init() missing 1 required positional argument: 'dtype'
got this error while working with a file that contains data related to flow images, can anyone tell me how to fix this

 storm valve
with a TPE? but that's a single core, not multiple
 clever walrus
Okay, so I want to make a chat AI I just want to know where to start and for resources such as videos, repos etc
And if it matters I wanna do it VS code on an M1 MacBook
storm kelp
storm valve
with a TPE? but that's a single core, not multiple
threadpoolexecutor
storm kelp
storm valve
with a TPE? but that's a single core, not multiple
that's a graph of cpu utilization for all 32 cores on the vm
storm valve
storm kelp
threadpoolexecutor
it's impossible for a TPE (threadpoolexecutor) to use more cores.
at least on cpython.
clever walrus
clever walrus
Okay, so I want to make a chat AI I just want to know where to start and for res...
^ I appreciate any help
storm kelp
storm valve
it's impossible for a TPE (threadpoolexecutor) to use more cores.
They are using the same number of cores. But the TPE is getting better utilization
storm valve
okay so maybe, since TPE is working for you, submit work in chunks then
storm kelp
It seems to be running ok for now, strangely
It wouldn't surprise me if it were just hail crashing without error though. It does seem pretty temperamental as far as software goes. I'll probably rewrite what their code is doing and dump it at some point
I only need it for a handful of functions
desert oar
storm kelp
<@998437135814238238>
what kind of code is this? usually you wouldn't expect to see significant parallelization when using threads due to the GIL. but maybe you're doing something that allows for it.
storm kelp
desert oar
what kind of code is this? usually you wouldn't expect to see significant parall...
desert oar
i see, that's quite a lot of code. where is the thread pool executor being used?
the fact that spark is involved kind of changes things w/ respect to parallelism. what's the tldr?
storm kelp
desert oar
the fact that spark is involved kind of changes things w/ respect to parallelism...
basically I read in a few few dataframes, do a join between them to find all the genetic variant positions around a hit, then use that for a key to create a large matrice of all the genetic correlations in that region and write it to a file.
desert oar
storm kelp
basically I read in a few few dataframes, do a join between them to find all the...
spark data frames? or pandas data frames?
(specifically, i'm interested to know where the thread pool comes in)
storm kelp
desert oar
_spark_ data frames? or pandas data frames?
spark
once I've made my collection of rows, where each one is a genetic locus to extract, I use the thread pool to map the function on them
It's orders of magnitude quicker using threadpoolexecutor compared to a simple for loop
desert oar
storm kelp
once I've made my collection of rows, where each one is a genetic locus to extra...
by "collection of rows" are you talking about a spark rdd? or something that you've gathered back into the driver node/process?
it's possible that the thread pool is working because the actual work is being pushed off to worker processes, which are physically separate processes. so the thread pool might just be doing what mapping over an RDD would otherwise do
i can go look at your code though now that i have some context, thanks
left tartan
storm valve
it's impossible for a TPE (threadpoolexecutor) to use more cores.
Not to actually you, but: with the exception of each thread calls a multithreaded extension. This happens in a few ML use cases where you can farm work out to threads that operate outside the Gil lock
storm valve
left tartan
Not to actually you, but: with the exception of each thread calls a multithreade...
threads != cores.
threads that operate outside the GIL lock are still threads
left tartan
I’m not talking about Python threads.
storm valve
python threads are still OS threads
left tartan
Yea and outside the GIL, you can end up fully utilizing your cores by virtue of your extensions
storm valve
left tartan
Yea and outside the GIL, you can end up fully utilizing your cores by virtue of ...
threads don't take up cores though, multi processing does
past meteor
storm valve
threads don't take up cores though, multi processing does
They de facto do as typically you have 1 thread for each OS core
storm valve
that doesn't sound right, i can spawn 100 threads, i don't have 100 OS cores obvs, but i can have a single core spawn 100 threads
left tartan
storm valve
that doesn't sound right, i can spawn 100 threads, i don't have 100 OS cores obv...
The OS manages processes and threads, that’s the job of the scheduler. You can have hundreds of threads and/or processes, the number of threads and processes you may spawn independent of the number of cores.
past meteor
More specifically, each worker maps to an OS thread I should say
buoyant vine
Our classifier model has just been destroyed by the non-AI approach using a Full Text Search engine 😅
I love NLP
storm valve
buoyant vine
Our classifier model has just been destroyed by the non-AI approach using a Full...
wdym having AI print out hello world isn't faster than just printing?
storm valve
left tartan
The OS manages processes and threads, that’s the job of the scheduler. You can h...
makes sense
buoyant vine
storm valve
wdym having AI print out hello world isn't faster than just printing?
Just re-enforces my belief that companies are too quick to jump to AI and ML when the solution we had 10 years ago would work better
past meteor
buoyant vine
<:PepeHands:734461705240707128> Just re-enforces my belief that companies are to...
I keep saying that your primary job as data scientist is not to use AI ML
storm valve
buoyant vine
<:PepeHands:734461705240707128> Just re-enforces my belief that companies are to...
i've seen some people that would use pandas/numpy to print if they could
past meteor
I've said it a lot here, AI/ML is a total headache! 🤣
buoyant vine
past meteor
I keep saying that your primary job as data scientist is not to use AI ML
Very true 😅 Luckily I rarely do any of that stuff, which I guess helps because I was looking for a way to not use the AI tooling like PyTorch xD
past meteor
As data scientists / ML engs you probably know the headaches better than anyone else so and the benefits so you kind of do your cost-benefit analysis ahead of time
left tartan
storm valve
makes sense
My point was simply; in many ML cases, you can use threading to initiate long running numerical tasks that operate outside the GIL and better utilize available cores
past meteor
- many implementations do it by default (e.g., DuckDB, Polars, Pandas, Numpy, ...)
storm valve
left tartan
My point was simply; in many ML cases, you can use threading to initiate long ru...
iirc, i did mention to him to use sparks parallelization interfact rather than PPE
in fact, seems like they have a parallelize method https://spark.apache.org/docs/latest/api/python/reference/api/pyspark.SparkContext.parallelize.html
past meteor
buoyant vine
Very true 😅 Luckily I rarely do any of that stuff, which I guess helps because ...
if you're not into ML I'd nearly always recommend to use Keras
storm valve
which i'm fairly sure should be much faster than naive PPE threading
past meteor
Higher level API than Torch
desert oar
@storm kelp out of curiosity why are you .collect-ing all this instead of running it on spark?
but i think the best i can guess is that you're getting some parallelization from pandas or numpy releasing the GIL, as well as the parallelization opportunity when writing to CSV
past meteor
Afaik Spark is parallel by default, just like polars is 🤔
desert oar
spark is parallel by default because it's distributed across processes
whereas polars just uses a rust library that can use multiple threads
past meteor
Interesting, I never knew that Spark just ran multiple processes
I know very little of PySpark's internals, I expected it to offload work over to the JVM where it uses OS threads
storm kelp
desert oar
<@780320537255608330> out of curiosity why _are_ you `.collect`-ing all this ins...
How do you mean?
 rugged comet
What is the correct way to calculate r^2 for a LogisticRegression model?
I thought we used
r2 = sklearn.metrics.r2_score(y_true, y_pred)
But in one of the demos, my instructor uses
algorithm = sklearn.linear_model.LogisticRegression()
r_squared = algorithm.score(predictors_training_df, response_training_df)
These two methods give vastly different results. I would expect them to be the same.
LogisticRegression r^2 score 1: 0.011...
LogisticRegression r^2 score 2: 0.800...
Notably, I am calculating r^2 using the true values for making the true values for the y testing data and the predictions on the testing data.
My instructor uses the training data for algorithm.score.
Are we supposed to calculate r^2 using the training data or do we use the predictions and the testing data?
lapis sequoia
Like, I honestly never understood the difference between data science and data analytics
 small wedge
rugged comet
What is the correct way to calculate r^2 for a LogisticRegression model?
I thou...
small wedge
rugged comet
What is the correct way to calculate r^2 for a LogisticRegression model?
I thou...
In your second example, what does predictors_training_df and response_training_df correspond to? Is the first one your models predictions and the second your true values or the other way around?
Because the order you are supposed to pass the arguments changes between the two functions
rugged comet
small wedge
In your second example, what does `predictors_training_df` and `response_trainin...
predictors are the columns we use to predict the response. training is the subset of the data that we use for training the model. response is the value we are trying to predict.
Does that answer your question?
The first one is not the models predictions.
The second one is the subset of the true values we use for training the model.
lapis sequoia
lets bring out some datasets
small wedge
I see, I think that's the correct order then according to the docs
Strange that it gives different results 
And yeah my bad it does take input samples not y_hat samples for the first argument
rugged comet
https://scikit-learn.org/stable/modules/generated/sklearn.linear_model.LogisticRegression.html#sklearn.linear_model.LogisticRegression.score
Do these docs imply to you that you are supposed to use predictors_testing and response_testing for the parameters?
scikit-learn
Examples using sklearn.linear_model.LogisticRegression: Release Highlights for scikit-learn 1.3 Release Highlights for scikit-learn 1.1 Release Highlights for scikit-learn 1.0 Release Highlights fo...
past meteor
rugged comet
What is the correct way to calculate r^2 for a LogisticRegression model?
I thou...
Your instructor didn't fit the model
Unless your snippet is wrong
algorithm = sklearn.linear_model.LogisticRegression()
r_squared = algorithm.score(predictors_training_df, response_training_df)
The weights are random. Can I assume you forgot to fit or not?
rugged comet
My snippet is slightly wrong. He was doing LinearRegression when he calculated r2 like that. That makes me wonder if it still makes sense to calculate r2 when we are doing classification using LogisticRegression.
small wedge
!paste can you send the actual code you're testing with
arctic wedgeBOT
Pasting large amounts of code
If your code is too long to fit in a codeblock in Discord, you can paste your code here:
https://paste.pythondiscord.com/
After pasting your code, save it by clicking the Paste! button in the bottom left, or by pressing CTRL + S. After doing that, you will be navigated to the new paste's page. Copy the URL and post it here so others can see it.
rugged comet
Sure.
maybe
Here is the code the instructor used in which he calculated r2 for LinearRegression.
https://paste.pythondiscord.com/SATQ
There isn't a demo file for calculating r2 for LogisticRegression.
I am trying to write the script that calculates r2 for LogisticRegression.
I'm not sure how to paste the code for my file because is is located on a virtual machine so I can't get it onto my clipboard on my local machine.
rugged comet
past meteor
```python
algorithm = sklearn.linear_model.LogisticRegression()
r_squared = algo...
I think you can assume that the model was not fit.
I'm not super familar with sklearn's implementation though.
past meteor
So, I don't remember what if I did or didn't use R² on logistic regression in uni, so I was kind of refraining from commenting
It is something you 1) typically do on the data you used to fit the model 2) something I'd prefer doing in statsmodels than sklearn
I think this is a question for @desert oar if they're around
desert oar
hah i was just about to respond but i'm starting a d&d session
i'll try to remember to respond later
past meteor
desert oar
hah i was just about to respond but i'm starting a d&d session
Enjoy! 😄
rugged comet
From what I can tell in the source code, algorithm.score(X, y) evaluates to sklearn.metrics.accuracy_score(y, self.predict(X)). The docstring for score says that it returns the mean accuary of the given data and labels. This doesn't sound like r2 to me. r2 is simply not the mean accuracy as far as I know.
left tartan
Just use sklearn.metrics.r2_score, you can do this for any regression.
rugged comet
left tartan
Just use sklearn.metrics.r2_score, you can do this for any regression.
Even logistic regression?
left tartan
rugged comet
Even logistic regression?
Why would the regression matter?
rugged comet
I might be speaking out of nothing here but LogisticRegression is a classification algorithm. From what I can tell on the internet, r2 is not a good measure to assess goodness of fit for classification.
I get that it has Regression in the name but isn't it still a classification algorithm?
left tartan
You know, I was having a brain cramp there. Yah, You’re right, not for logistic since your pred aren’t values, quite true.
rugged comet
My question boils down to: Do sklearn.metrics.r2_score and sklearn.linear_model.LogisticRegression().score do different things?
If so, please describe the difference as you see it.
left tartan
rugged comet
My question boils down to: Do `sklearn.metrics.r2_score` and `sklearn.linear_mod...
That’s the mean accuracy, right? https://scikit-learn.org/stable/modules/generated/sklearn.linear_model.LogisticRegression.html#sklearn.linear_model.LogisticRegression.score
scikit-learn
Examples using sklearn.linear_model.LogisticRegression: Release Highlights for scikit-learn 1.3 Release Highlights for scikit-learn 1.1 Release Highlights for scikit-learn 1.0 Release Highlights fo...
Wouldn’t that just be % accurate classifications?
It’s certainly not an r2.
rugged comet
Oh I think I see where I am confused. .score does different things for LinearRegression and for LogisticRegression.
.score for LinearRegression returns r2. .score for LogisticREegression returns the mean accuracy.
https://scikit-learn.org/stable/modules/generated/sklearn.linear_model.LinearRegression.html#sklearn.linear_model.LinearRegression.score
https://scikit-learn.org/stable/modules/generated/sklearn.linear_model.LogisticRegression.html#sklearn.linear_model.LogisticRegression.score
scikit-learn
Examples using sklearn.linear_model.LinearRegression: Principal Component Regression vs Partial Least Squares Regression Plot individual and voting regression predictions Comparing Linear Bayesian ...
scikit-learn
Examples using sklearn.linear_model.LogisticRegression: Release Highlights for scikit-learn 1.3 Release Highlights for scikit-learn 1.1 Release Highlights for scikit-learn 1.0 Release Highlights fo...
left tartan
rugged comet
Oh I think I see where I am confused. `.score` does different things for `Linear...
Oh, yah, exactly
rugged comet
So we should use sklearn.metrics.r2_score to get r2 for LogisticRegression.
left tartan
An r2 for a classification doesn’t make sense tho
rugged comet
Do tell.
left tartan
R2 compares predict values to actual, right? It’s telling you how close y_pred is to y_actual
That’s a terrible explanation? Not ‘how close’ but I’m not going into a whole r2 discussion here
(Insert textbook r2 definition here)
rugged comet
left tartan
That’s a terrible explanation? Not ‘how close’ but I’m not going into a whole r2...
I would find value in it if you did. However, I understand you value your time.
left tartan
It’s not my time, it’s that it’s not something I’d give a good definition of
Take any forecast where y_pred is an estimated value. Linear, Arima, whatever, sma. You can calculate the r2 of that, or other scores like Mse or mape , to get a sense of how “well” the prediction matches the actual
But, what’s y_pred from logistic or other classifiers?
What does it indicate?
rugged comet
y_pred is the predicted class I think.
From what I'm reading on the internet, r2 uses distances between the y_true and y_pred. But a distance between classes doesn't really make sense.
left tartan
Actually? The best explanation here is in fact the textbook def of r2: https://en.m.wikipedia.org/wiki/Coefficient_of_determination
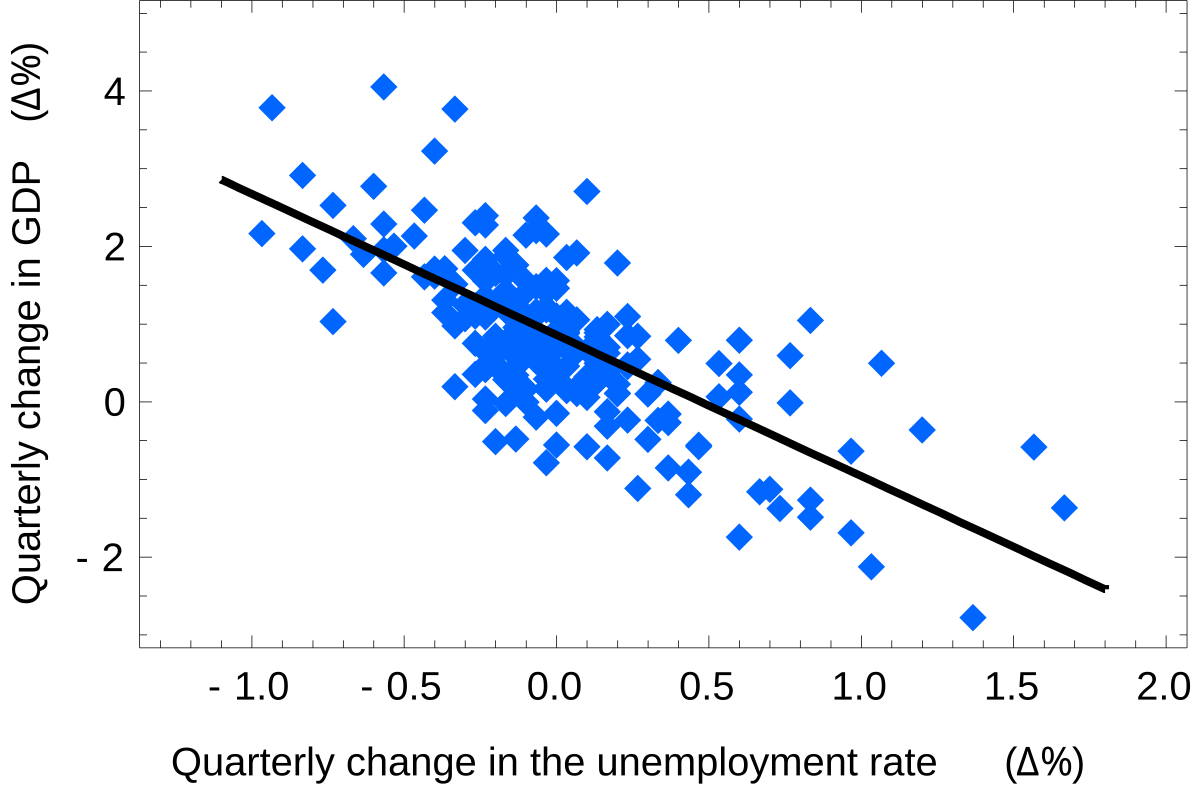
In statistics, the coefficient of determination, denoted R2 or r2 and pronounced "R squared", is the proportion of the variation in the dependent variable that is predictable from the independent variable(s).
It is a statistic used in the context of statistical models whose main purpose is either the prediction of future outcomes or the testing ...
Proportion of variation: but how would that make any sense with a binary classifier?
left tartan
rugged comet
From what I'm reading on the internet, r2 uses distances between the y_true and ...
Yah, exactly, just intuitively it doesn’t make sense, nor does mape or mse.
 solemn glen

I've been exploring flow control and relationships with words and tokenization it's really been exciting but I'm having trouble with how I can use this information to better understand
 royal crest
are tokens like ( and the really meaningful?
serene scaffold
royal crest
are tokens like `(` and `the` really meaningful?
Depends on what you're trying to do, but they'd probably be treated as stop tokens in some contracts
Contexts*
royal crest
right
 fading kestrel
Does anyone know the best way to calculate marginal counts on a joint count table?
rugged comet
left tartan
Yah, exactly, just intuitively it doesn’t make sense, nor does mape or mse.
Would you say that r2 in LogisticRegression could serve as explained variance? Why or why not?
desert oar
rugged comet
Would you say that r2 in LogisticRegression could serve as explained variance? W...
in general it doesn't really make sense to compute R^2 for logistic regression
rugged comet
desert oar
in general it doesn't really make sense to compute R^2 for logistic regression
I agree and I think I understand why.
Can you name an example where it would make sense to compute R^2 for logistic regression?
desert oar
rugged comet
I agree and I think I understand why.
Can you name an example where it would ma...
to be clear, by "r^2" you're talking about this?
sum((y_pred - y_true)^2) / sum((y_pred - mean(y_true))^2)
if y_pred are probabilities (not classes 0 and 1), then that's proportional to the brier score https://en.wikipedia.org/wiki/Brier_score which is a proper scoring rule and is therefore actually a good way to evaluate a model
The Brier Score is a strictly proper score function or strictly proper scoring rule that measures the accuracy of probabilistic predictions. For unidimensional predictions, it is strictly equivalent to the mean squared error as applied to predicted probabilities.
The Brier score is applicable to tasks in which predictions must assign probabilit...
if y_pred are just 0 and 1, then it's just a roundabout way to compute something that's proportional to accuracy
conceptually it's a fairly different thing
if you're just interested in a generic "goodness of fit" for logistic regression, the conventional equivalent to r-squared is the deviance, which measures deviation from a hypothetical model that 100% completely fits the data
however the latter assumes a somewhat more complete probabilistic framework than the brier score, which only requires that your model be able to emit some kind of predicted probability
in general you're going to raise eyebrows if you talk about "r-squared" and logistic regression. even though the math looks a lot like the brier score, the underlying concepts are very different.
rugged comet
desert oar
to be clear, by "r^2" you're talking about this?
```
sum((y_pred - y_true)^2) / ...
I thought the numerator was the sum of squared residuals.
sum((y_true - y_pred) ** 2)
And the denominator was the total sum of squares.
sum(y_true - average(y_true) ** 2)
that denominator looks like mine (you can swap the terms and get the same result), but yes you're right, i meant y_true in the denominator not y_pred
rugged comet
desert oar
_if_ `y_pred` are probabilities (not classes 0 and 1), then that's proportional ...
In my case, the predictions are the classes 0 and 1.
desert oar
in that case it's just convoluted accuracy ("0-1 loss")
rugged comet
desert oar
in that case it's just convoluted accuracy ("0-1 loss")
Then in this case, should r2 be close to the accuracy?
desert oar
rugged comet
Then in this case, should r2 be close to the accuracy?
well look at the numerator: is that not precisely the numerator of 1 minus accuracy?
the denominator is a fixed property of the dataset that has nothing to do with your model
so it's something like a rescaled complement of accuracy
rugged comet
desert oar
well look at the numerator: is that not precisely the numerator of 1 minus accur...
I don't know how the numerator is 1 minus accuracy.
desert oar
rugged comet
I don't know how the numerator is 1 minus accuracy.
what's the formula for accuracy?
rugged comet
correct_predictions / (correct_predictions + incorrect_predictions)?
desert oar
rugged comet
`correct_predictions / (correct_predictions + incorrect_predictions)`?
okay, and how can you express "correct" or "incorrect" using the actual & predicted 0 and 1 values?
rugged comet
desert oar
okay, and how can you express "correct" or "incorrect" using the actual & predic...
We could relate the actual and predicted values somehow. I think you're leading me to say actual - predicted but I can't think of how you got there.
desert oar
rugged comet
We could relate the actual and predicted values somehow. I think you're leading ...
well sure, how else would we do it? if they're the same you get 0, if they differ you either get 1 or -1, which squared is 1
thus 0-1 loss can be expressed as the sum of (actual - predicted)^2, or equivalently of (predicted - actual)^2
if we scale that down by N we get the fraction of predictions that were incorrect
and of course that's the complement of accuracy
you could of course write |actual - predicted| and get the same answer, which hopefully emphasizes that we are operating in very very special territory here, because normally a sum of absolute values is not at all the same as a sum of squares
rugged comet
desert oar
thus 0-1 loss can be expressed as the sum of `(actual - predicted)^2`, or equiv...
How does loss relate to accuracy?
desert oar
rugged comet
How does loss relate to accuracy?
you see that sum((actual - predicted)^2) is in fact the # of incorrect predictions, right?
rugged comet
I think so.
If actual and predicted are the same, that is, the prediction was correct, we get 0. 0 will not add to the sum. If actual and predicted are different, that is, the prediction was incorrect, we get -1 or 1. Squared is 1. 1 will add to the sum.
desert oar
rugged comet
I think so.
If actual and predicted are the same, that is, the prediction was co...
right, good
rugged comet
So if the numerator for R^2 is the sum of squared residuals, and sum((actual - predicted)^2) is the number of incorrect predictions, does that mean that the number of incorrect predictions is equivalent to the sum of squared residuals?
desert oar
sort of, other than the fact that i'm not really comfortable calling actual - predicted a "residual" in this case
rugged comet
desert oar
sort of, other than the fact that i'm not really comfortable calling `actual - p...
Which leads us back to why R^2 doesn't make sense for classification?
desert oar
rugged comet
Which leads us back to why R^2 doesn't make sense for classification?
as i said above, it makes sense if you squint and reinterpret it as something else
or, as proportional to something else
i think you might want to spend a little while with these various quantities on pen & paper and try to manipulate them a bit
explore how they're all built around the same thing: the number of incorrect predictions
and most of all, if only for the sake of basic numeracy, convince yourself that this 0-1 loss (the # of incorrect predictions) is equal to N * (1 - accuracy) (the % of correct predictions, or equivalently # of correct predictions / # total)
rugged comet
desert oar
i think you might want to spend a little while with these various quantities on ...
Unforetunately my current course is not going in depth for the algorithms, we are just learning how and when to use them mostly. If I went to a different school, I would probably learn more about this stuff.
That being said, my course not going in depth does not preclude me from doing it myself.
desert oar
rugged comet
Unforetunately my current course is not going in depth for the algorithms, we ar...
i'm not really talking about anything algorithmic. this is just straightforward algebra
rugged comet
desert oar
i'm not really talking about anything algorithmic. this is just straightforward ...
What I meant was, we learned for example how to use sklearn to get R^2 and how to interpret it, but not how the underlying calculations are done.
To a certain degree, we should know how things are calculated though.
desert oar
rugged comet
What I meant was, we learned for example how to use sklearn to get R^2 and how t...
i think that's a real shame, you're being robbed of your time
importing from sklearn is probably the easiest part here
i've seen you posting in here before, i know you're inquisitive and willing to learn. it bothers me that you're not being given the chance to learn this material in a way that will actually serve you well and stretch your skills
 analog sky
?
desert oar
you might want to check #❓|how-to-get-help , this channel is for a specific topic
analog sky
desert oar
you might want to check <#704250143020417084> , this channel is for a specific t...
oh thx
rugged comet
desert oar
importing from sklearn is probably the easiest part here
For everyone else I know in the program, the level at which we are being taught is sufficiently challenging.
All of this extra digging is not part of the course. I'm just curious about it. This topic started when the instructor asked us to calculate R^2 among other things for LogisticRegression. I got a different value than he did, which we solved (he was using the wrong function). Then, from reading online and from you guys here, I started being told that R^2 doesn't even make sense for classification such as LogisticRegression.
desert oar
rugged comet
For everyone else I know in the program, the level at which we are being taught ...
that's fair, but this sounds to me like your instructor doesn't really know what's going on and that makes me wonder what else you're doing
i have a strong bias against programs that don't expect you to know how to do math when you're literally doing math
rugged comet
desert oar
that's fair, but this sounds to me like your instructor doesn't really know what...
This is also the very first time this program is being run at this school. So it's not exactly prestigious or esteemed (yet?).
rugged comet
desert oar
and most of all, if only for the sake of basic numeracy, convince yourself that ...
Anyway,
0-1 loss (the # of incorrect predictions)
Is this right?
I'm also still trying to relate all of these things to each other, like you said.
lapis sequoia
Is it bad, that I base my self worth on my ml models in python and put 3000 hours into it and a year and care about nothing else? Like, I cannot restrain myself.
desert oar
rugged comet
Anyway,
> 0-1 loss (the # of incorrect predictions)
Is this right?
I'm also sti...
yes, the total 0-1 loss is the # of incorrect predictions. the 0-1 loss on one observation is just 1 if the prediction is incorrect and 0 if it's correct. the former follows as the sum of the latter
past meteor
I think logistic regression requires a different r² hence why I was very apprehensive to answer
past meteor
rugged comet
My question boils down to: Do `sklearn.metrics.r2_score` and `sklearn.linear_mod...
That being said, yes. Score just gives you the mean accuracy on the test set
past meteor
left tartan
R2 compares predict values to actual, right? It’s telling you how close y_pred i...
Kind of but this helps: for the simple regression case R² is just the correlation squared, hence why ... R². That at the very least gives you an indication of what R² is, it's how well your predictors explain the variance in the predicted variable. Remember correlations are -1..1, squaring makes it 0..1 and intuitively squishes small correlations even more.
if you expand this idea to multiple regression it is expressing the proportion of variance in the dependent variable that is predictable from the independent variables. This does involve the classic 1 - (RSS / TSS)
So it's logically something that has nothing to do with the test set. The coefficients are found on the training set after all for the simple case. 😄 The very same idea should carry over to the multiple regression case, but now you need the equation. You can plug in values from the test set but that would be against the spirit of R².
Last but not least, the reason why I was unsure of R² making sense is that logistic regression is linear in the logits and not in the actual output variable. That should make you think: "what is variance explained when I'm linear in the logits?". I think the first link confirmed it doesn't make sense for log reg, but there are adjusted variants.
Make sense @rugged comet ?
 vestal spruce
I'm wondering if someone have tried using speaker change detection (SCD) that's trained using a different language from their actual data? I want to implement a SCD that's trained with English dataset for my native audio data.
I thought that AMI dataset was multilingual but after I examine the data, I realize that's not the case and now a bit worried that the SCD system could not work for my scenario. 🥲
desert oar
past meteor
I think logistic regression requires a different r² hence why I was very apprehe...
Yes, traditionally statistics uses the deviance for goodness of fit
 unique ether
Is there anyone here who could offer me a bit of help with game theory?
serene scaffold
unique ether
Is there anyone here who could offer me a bit of help with game theory?
Don't ask to ask. Always ask an actual question that someone can start answering right away.
unique ether
What formalism would you use if you were coding a game like nine mens morris?
lapis sequoia
unique ether
Is there anyone here who could offer me a bit of help with game theory?
why and what?
serene scaffold
lapis sequoia
why and what?
they asked "What formalism would you use if you were coding a game like nine mens morris?", but idk what that game is.
rugged comet
desert oar
yes, the total 0-1 loss is the # of incorrect predictions. the 0-1 loss on one o...
Oh when you said 0-1 loss, I thought you meant the loss was a number between 0 and 1.
rugged comet
past meteor
That being said, yes. Score just gives you the mean accuracy *on the test set*
Yeah I just thought algorithm.score would give R^2 for both LinearRegression and LogisticRegression. But the method functions differently for those different algorithms.
rugged comet
past meteor
So it's logically something that has nothing to do with the test set. The coeffi...
You can plug in values from the test set but that would be against the spirit of R².
I was plugging in the test data because I thought that R^2 could also tell us how well the model fit data that it hadn't seen yet. Like how well it generalized. That's not the point of R^2 though.
https://thestatsgeek.com/2014/02/08/r-squared-in-logistic-regression/
However, once it comes to say logistic regression, as far I know Cox & Snell, and Nagelkerke’s R2 (and indeed McFadden’s) are no longer proportions of explained variance. Nonetheless, I think one could still describe them as proportions of explained variation in the response, since if the model were able to perfectly predict the outcome (i.e. explain variation in the outcome between individuals), then Nagelkerke’s R2 value would be 1.
I'm having trouble understanding the difference between proportions of explained variance and variation in the response.

In previous posts I’ve looked at R squared in linear regression, and argued that I think it is more appropriate to think of it is a measure of explained variation, rather than goodness of fit…
lapis sequoia
hey all,
i need some help while performing kmeans clustering of data with python
i'm not understanding how to pass the clustering algorithm the name for each column, as when i do it gets angry that its non-numerical data
rugged comet
lapis sequoia
i'm not understanding how to pass the clustering algorithm the name for each col...
What package/module/library are you using?
lapis sequoia
sklearn

scikit-learn
This is the class and function reference of scikit-learn. Please refer to the full user guide for further details, as the class and function raw specifications may not be enough to give full guidel...
rugged comet
I don't think KMeans can take in the label names.
lapis sequoia
how do people cluster their samples then
rugged comet
KMeans is an unsupervised learning algorithm. In unsupervised learning, you don't use the labels. You just make K clusters from the data.
https://scikit-learn.org/stable/modules/clustering.html#k-means
scikit-learn
Clustering of unlabeled data can be performed with the module sklearn.cluster. Each clustering algorithm comes in two variants: a class, that implements the fit method to learn the clusters on trai...
lapis sequoia
i don't want to use them to cluster. i want to label the resulting samples as they appear in each cluster
rugged comet
How would you know which label belongs to which cluster?
lapis sequoia
each cluster will have a new generic name like 1,2,3, or a,b,c, etc. but each cluster will be comprised of samples with names, like breast cancer 1, healthy 2, etc
the fact that each cluster has a name shouldn't really matter, i just want to see my samples separated into distinct groups (clusters)
maybe with set_fit_request?
 blazing oxide
I have finally created a working LSTM AI that predicts the cost of actions with a 99.9996% accuracy with a loss of 0.2e-5 per day 🥳
lapis sequoia
scikit-learn
Examples using sklearn.cluster.KMeans: Release Highlights for scikit-learn 1.1 Release Highlights for scikit-learn 0.23 A demo of K-Means clustering on the handwritten digits data Bisecting K-Means...
blazing oxide
blazing oxide
I have finally created a working LSTM AI that predicts the cost of actions with ...
I'll become rich
lapis sequoia
looks like metadata can be a string
blazing oxide
I just wanted to share my happiness
lapis sequoia
cost of actions?
blazing oxide
To be exactly the close cost
For example this is the graphic for the Amazon predictions:

it's in Italian, but to tell you, the blue line represent the real values while the orange the predicted ones
y=cost($) x=days
rugged comet
lapis sequoia
the fact that each cluster has a name shouldn't really matter, i just want to se...
This is what KMeans does I think. But I don't think you can know which clusters correspond to which labels. You can however find out which cluster a sample belongs to. Try doing a google search for "find which cluster a sample is in kmeans".
lapis sequoia
yeah i've been googling and trying but can't seem to figure it out. just found this:
https://stackoverflow.com/questions/36195457/how-to-get-the-samples-in-each-cluster
Stack Overflow
I am using the sklearn.cluster KMeans package. Once I finish the clustering if I need to know which values were grouped together how can I do it?
Say I had 100 data points and KMeans gave me 5 clus...
lapis sequoia
blazing oxide
For example this is the graphic for the Amazon predictions:
are you sure you didn't just figure out how to reproduce a graph? once you run your algo how much time do you have to act? can you run it in the morning and know what closing cost will be? or do you need information from 5 minutes ago?
blazing oxide
lapis sequoia
are you sure you didn't just figure out how to reproduce a graph? once you run y...
I am currently using yfinance e datetime so I can get the latest informations
lapis sequoia
but knowing the closing cost of a security 5 minutes before market close doesn't do you any good
hence my questions about how far out does this model project
blazing oxide
ok not for today, but if I run it like in Wensday It is good, and also it can make long term prediction
lapis sequoia
how far out can you predict with the above accuracy
blazing oxide
lapis sequoia
hence my questions about how far out does this model project
It is very accurate to predictions that are from tomorrow to 2 months
of course without counting things lke wars and things like that
lapis sequoia
you have to validate your model
you can't say its accurate unless you mark actual vs. expected
recreating a historical graph is not the same
blazing oxide
lapis sequoia
you can't say its accurate unless you mark actual vs. expected
I'll see
lapis sequoia
yeah do some validation
lapis sequoia
it'll be interesting. if you see its working then you can try putting money into the markets
cool do it
actually if its very accurate you'd probably want to trade options
lapis sequoia
rugged comet
This is what KMeans does I think. But I don't think you can know which clusters ...
do you think this first solution is accurate:
https://stackoverflow.com/questions/36195457/how-to-get-the-samples-in-each-cluster
Stack Overflow
I am using the sklearn.cluster KMeans package. Once I finish the clustering if I need to know which values were grouped together how can I do it?
Say I had 100 data points and KMeans gave me 5 clus...
rugged comet
I would certainly try it since it looks low-effort. The second solution looks good too.
lapis sequoia
my concern is that if it doesn't actually map to the same samples after clustering i'd never know 😅
 vivid merlin
lapis sequoia
my concern is that if it doesn't actually map to the same samples after clusteri...
vivid merlin
lapis sequoia
my concern is that if it doesn't actually map to the same samples after clusteri...
Can u help me
lapis sequoia
vivid merlin
Can u help me
probably not whats up
 lapis sequoia
i know almost nothing about machine learning
lapis sequoia
looks like you have a script where you tried to use a module requests but python doesn't know where it is or cannot see it
rugged comet
lapis sequoia
my concern is that if it doesn't actually map to the same samples after clusteri...
If you were able to cluster accurately, then could you assume that the majority of samples in a cluster would have the same label?
vivid merlin
Idk this is supposed to be like copy messages when specif guy on discord send message
itis not mine itis just 2 files
lapis sequoia
rugged comet
If you were able to cluster accurately, then could you assume that the majority ...
good question
vivid merlin
Do u know how do I fix it
lapis sequoia
you'll be hard pressed to find help without sharing code
lapis sequoia
rugged comet
If you were able to cluster accurately, then could you assume that the majority ...
this is very heterogenous data. and following what the original authors did is a bit of a mess. for example, in one explanation, for missing values they dropped those samples. in another, they imputed missing vals
@rugged comet in your experience, are entitites to be clustered typically rows or columns
rugged comet
lapis sequoia
<@188467763558350849> in your experience, are entitites to be clustered typicall...
You are clustering the rows I believe.
lapis sequoia
ok, so i'll need to transform my pandas dataframe. any easy way?
rugged comet
So your column headings are in the index (like on the left side of the df)?
lapis sequoia
correct, because right now i have gene names in rows and samples in columns, and i want to cluster samples, not genes.
rugged comet
I think you can do df.T to trasnpose the rows into columns. Is that what you want?
rugged comet
Why do you say that?
lapis sequoia
i'm just getting a bit confused about how to implement this. i'll need to make the cluster map before i drop the string labels but after cleaning the data by dropping rows with missing values
rugged comet
Taking it one step at a time can help.
lapis sequoia
so in the code in the github above, each row is a 'data index'?
rugged comet
Which code are you talking about? I don't see a github link.
rugged comet
Under normal circumstances, your samples should be separated by rows. Your features of those samples would be the columns. Does that answer your question?
rugged comet
Can you show the code that caused that error?
lapis sequoia
import numpy as np
import pandas as pd
import matplotlib.pyplot as plt
from sklearn.cluster import KMeans
import seaborn as sns

file = 'myfile.csv'

data_frame = pd.read_csv(file)

print(data_frame.shape)

data_clean = data_frame.dropna()

transposed_cleaned_data = data_clean.T

print(transposed_cleaned_data.shape())
Which line do you think caused the error?
lapis sequoia
print(transposed_cleaned_data.shape())
What do you think is wrong with that line?
lapis sequoia
is it somehow no longer a dataframe?
rugged comet
Do you know how to test that hypothesis?
lapis sequoia
type()?
rugged comet
Good idea.
rugged comet
Alright.
Do you remember what calling a function/object looks like?
rugged comet
lapis sequoia
no `.shape()` is right. its a method
Are you sure?
rugged comet
Right. shape is an attribute, not a method of dataframes.
lapis sequoia
ok thanks
rugged comet
You're welcome.
lapis sequoia
so what then is iloc
rugged comet
iloc is also an attribute if that's what you're asking.
rugged comet
How so?
lapis sequoia
i had to add information to a .csv, so i created two rows below the original 1st row (preserving the columns) but adding 2 new bits of information about each sample
so now i have essentially 3 IDs per sample (first 3 rows of each column), and the information i want to use to cluster underneath that. then I transpose. then printing i'm not sure its in the format i want. i'm using iloc too look at the first few rows and columns and i'm not seeing those two other bits of information or my new attributes
rugged comet
Hmm. How did you add the information to the csv? What kind of information did you add (new samples or new columns)?
lapis sequoia
i added two new rows underneath the original first row. and added new attributes to each sample that way (keep in mind that each column in the input .csv corresponds to a sample)
rugged comet
How did you add the information? Like did you manually open the csv and type it in? Or did you do it with Python or some other way?
lapis sequoia
yes i did it manually with Excel
rugged comet
Instead of looking at the first few rows using iloc after transposing, would it make sense to use .head() instead?
lapis sequoia
let me try
oh. perhaps i am dropping those columns because they have the string 'null' in some of the cells..
i'll need to check the .dropna() method
rugged comet
Do you dropna before or after transposing?
lapis sequoia
before
rugged comet
Since your data is set up the way it is, I think you want to dropna after you transpose. dropna is meant to remove rows that contain null data. If you dropna before transposing, you would be dropping entire columns I think.
lapis sequoia
i need to do it before transpose, because i want to drop genes where not every sample has a readout. for example, after dropna my number of genes goes down considerably, but i still retain all my samples.
rugged comet
Oh you actually wanted to drop features (genes)?
lapis sequoia
bc the input data is like:
sam1 sam2 sam3 .... gene 0.23 1.27 9.027 gene2 0.56 123 342 ....
yes
because clustering requires values to work. so i have to drop genes where not every sample got a measurement
sometimes this is imputed instead
but this is the more straight forward approach
so i drop, keep all samples, reduced list of genes, then transpose, then work from there
is the approach
if i transpose then drop then i'll be losing entire samples
rugged comet
After loading the data, the first thing I would want to do is transpose it so the structure of the data makes more sense. After that, you can acutally use dropna to drop the genes you don't want (now the columns).
https://pandas.pydata.org/docs/reference/api/pandas.DataFrame.dropna.html
dropna takes an axis parameter that lets you specify whether rows or columns that contain missing data are dropped.
lapis sequoia
ohh ok
ok perfect. i have transposed the input data, then cleaned na's from columns, now i retained all samples and threw away essentially 50% of the genes in which not every sample had a measurement
now let me try head again
ugh this is so weird. i'm expecting all of those new attributes to now be in the first few columns, and just not seeing them
rugged comet
Can you verify if those new attributes are in the columns at all?
lapis sequoia
think i got it. i think they were being dropped due to my null string. now i see them
rugged comet
Okay.
lapis sequoia
i made my nulls zeroes and they're here
rugged comet
Do you want them to be there?
lapis sequoia
well i mean, the attributes i was missing which i wanted to have present, are. yes
the zeroes are just placeholders, won't be used
so now i have all my data in neat rows, and i can try to do the cluster map as in the stackoverflow page
rugged comet
Nice.
lapis sequoia
the first 3 columns however are all separate names, i wonder if i should concatonate them and make them all part of the first column?
rugged comet
What kind of data do the first three columns hold?
lapis sequoia
sample name, status, cluster in original paper
i'd like to cluster this data by the sample status, the second name
but see if i reproduce their original clusters as well
rugged comet
I don't see a reason to combine those columns into one column.
lapis sequoia
ok
i will definitely want differnt cluster maps though for each different name
let me check the stack overflow thing again
ok so how can i make this cluster map given that i'm going to drop names going into fitting? the data actually start in row 4, column 4 thanks to all the extra information
rugged comet
What do the first 4 rows look like?
lapis sequoia
accession number gene symbol gene name sample 1 name
can i build my cluster map, then take a subset of the data into fitting without worrying about making off-by-one errors
or sliding columns/rows by accident
i'd like to build the cluster map and then just iloc down to the data i need
rugged comet
Are accession_number, gene_symbol, gene_name, and sample_1_name all attributes of the samples? Or do they represent something else?
lapis sequoia
only the first 3 are attributes, and they are strings, not numerical data
would it help if i pasted some of the data
can i pm you
rugged comet
Sure.
lapis sequoia
still trying to learn this kmeans clustering if anyone is around
lapis sequoia
my fundamental issue is dealing with sample names given that the algorithm can only take numerical data as input
buoyant vine
If I remember right with Scikit learn, you can create a pipeline and then plot via seaborn so you map the index of the labels to the actual label names like a mapping
Been a while since i've touched it though
 earnest hearth
anyone able to explain how a C&W attack could be implemented in python?
lapis sequoia
alright i figured it out
the trick is you want a single column one with names for each entity/sample, then when you read in your data, you want to explicitly declare to the pandas.read() function the name of that column with index_col=
thanks to @rugged comet for helping me last night
interestingly i am nearly reproducing the clusters generated in a Nature paper
 vital fiber
Hello
lapis sequoia
buoyant vine
If I remember right with Scikit learn, you can create a pipeline and then plot v...
yes i had to do a similar mapping scheme
vital fiber
So, I am trying to use prophet to predict future trends (https://facebook.github.io/prophet/docs)
Can someone explain to me what am I doing wrong?

datapoints are for price/mb for flash storage
agile cobalt
looks like overfitting if I had to guess
you might want to consider cutting <2007 from the training data though, it is ridiculously extreme and unlikely to be relevant for >2020
vital fiber
I just wanted this library to learn that the prices get lower logarithmically, because I want to have predictions for next 10+ years
e.g. this is how graph for hdd looks like
 lapis sequoia
hdd?
agile cobalt
vital fiber
I just wanted this library to learn that the prices get lower logarithmically, b...
you'll probably have to get a Masters degree in statistics or related areas then
I would be cautious/wary about predicting even 6 months in the future for most things
left tartan
vital fiber
So, I am trying to use prophet to predict future trends (https://facebook.github...
Also, there's a lot of "prophet is bad" sentiment out there. Consider comparing results against arima.
vital fiber
agile cobalt
you'll probably have to get a Masters degree in statistics or related areas then...
I do not need it to be 100% accurate, I just want to know the trend, of what is most probable
vital fiber
Ok, what I have found is that I need to tune changepoint_prior_scale
it looks a bit better

althought could be better
desert oar
left tartan
Also, there's a lot of "prophet is bad" sentiment out there. Consider comparing ...
I think the problem with prophet is not that it's bad, it's that it's bad as a default model/framework
it might actually be pretty good for things like site traffic
desert oar
vital fiber
e.g. this is how graph for hdd looks like
have you considered just taking the logarithm of prices?
that said, i think it definitely makes sense to consider change points/structural breaks here, given that sometimes technology advancement arrives in bursts
vital fiber
right now, i am trying to implement optuna for changepoint_prior_scale optimization
but change points are a good idea
past meteor
vital fiber
So, I am trying to use prophet to predict future trends (https://facebook.github...
Just taking the last N lags and throwing them into a gradient boosted tree is something that typically does well
My grief with SARIMAX is that I typically do not want to babysit picking all hyperparameters (a full 6 for SARIMA) and the Python implementations want me to pull my hair out. I also typically work with multiple time series (think: demand forecasting or patient specific models)
 vast lintel
Anyone here familiar with R and echarts by any chance?
serene scaffold
vast lintel
Anyone here familiar with R and echarts by any chance?
Just ask your actual question. Don't ask people to commit before exposing your actual question
 peak thorn
Can we earn using kaggle i mean tell me about it , is it reliable source to earn with ML skills?
peak thorn
Is it important to make team for kaggle competitions ?
 shut girder
Hello, is linear algebra necessary for a data analyst or should I continue to learn statistics and the necessary technical tools?
desert oar
shut girder
Hello, is linear algebra necessary for a data analyst or should I continue to le...
The latter, but eventually you will want and need to learn linear algebra to advance in statistics and ML theory
 wooden sail
shut girder
Hello, is linear algebra necessary for a data analyst or should I continue to le...
wooden sail
shut girder
Hello, is linear algebra necessary for a data analyst or should I continue to le...
linear algebra is as fundamental as statistics for data analysis
and in fact, multivariate statistics requires linalg too
already generalizing the idea of "variance" to multiple variables leads you into covariance matrices
desert oar
I think for a lot of practical purposes you can ignore or gloss over the linear algebra
However at minimum you can get pretty far by just knowing how matrix-vector multiplication and dot products work, so you can read resources that use that notation
 broken elk
anyone here know a little thing or two about prophet?
serene scaffold
broken elk
anyone here know a little thing or two about prophet?
always ask your actual question--don't ask to ask.
broken elk
serene scaffold
always ask your actual question--don't ask to ask.
Sorry 🙏 , I'm new to this server, I didn't know about the culture yet. I've posted on https://discord.com/channels/267624335836053506/1175811594740039711 so I won't clutter the chat
 ripe flare
Hello, can anyone explain the boxsizeoption in scipy.spatial.KDTree?
I have a 2D lattice of period Lx and Ly, and I would like to implement periodic boundary condition while searching for neighbors. But when I pass boxsize=[Lx,Ly], it does not work.
lapis sequoia
anyone want to start dataset speedrunning? Could b cool
 outer tapir
I am working on Yoga pose detection model where i have taken 6 classes and their videos, cut them into 50, 2 secs clips, extracted the pose features using mediapipe api, applied a deep lstm model , but the accuracy is approx 0.2, before that i had tried it on 30, 5 secs slips the accuracy was about same, how to improve on my model or is there any other architecture that i should follow instead?
 tacit basin
Not openai related. I have a shipping data including categorical (stage of shipment: like received, shipped, etc, store, country), datetime for each stage. I want to detect outliers. It's unsupervised problem. Don't have training data with ground truth. Tried isolation Forrest, but it detects as many outliers as you tell it to (contamination argument), and when on auto then almost all data classes as outliers. I wonder if anyone have thoughts on how to approach such situation. Thanks!
lapis sequoia
lapis sequoia
anyone want to start dataset speedrunning? Could b cool
https://youtu.be/9JiqjB7QoE0?si=UGE2sJaMWxUpwPdp I do not know. Speedrunning datasets could be fun. That was a quick trial

Choked pretty hard during the data description split. Overall, okayish run. Could have been better.
lapis sequoia
umm hi , i am new this community and this is my first time in recent to be saying something hrer
here*
i actually need help with a uni project
i am facing some issues debugging it
anyone wanna help?
 cold osprey
Shud have a bot command for that hahah
 frosty ore
Any tips on getting Tensorflow to work with CUDA install a virtualenv? It works perfectly using the aur tensforflow cuda package. Please @ me if you have experiance with this.
python3 -c "import tensorflow as tf; print(tf.config.list_physical_devices('GPU'))" ```
works perfectly inside of my of my base system using python-tensorflow-opt-cuda arch user repo package, but inside of a virtualenv, it saying ``` Could not find cuda drivers on your machine, GPU will not be used.```I do not know. I thought speedrunnning datasets was a cool idea. Yay or neigh?
left tartan
lapis sequoia
I do not know. I thought speedrunnning datasets was a cool idea. Yay or neigh?
I didn’t look at video. What’s the ‘speed run’ challenge? Just retrieving and basic manipulation?
lapis sequoia
I do not know. Kinda want to see if it would be fun
desert oar
lapis sequoia
https://youtu.be/9JiqjB7QoE0?si=UGE2sJaMWxUpwPdp I do not know. Speedrunning dat...
fun concept. what's "NMG"?
 lavish ember
I am making a connect4 game AI. I am stuck on some problems in it.
i am using scores
# If gameover
draw: 0
win: 1000
loss: -1000

# Else
for n in a line:
n=0: 0
n=1: 5
n=2: 25
n=3: 100
I am getting some weired behaviour where sometimes AI decision shifts towards score produced in gameover state resulting in bad moves. The opposite is that When decision shifts towards non-gameover state resulting in unable to choose the next move which will help to ai to win (in other words provided that there are 3 discs on line the AI will not complete it and will drop disc to some other column)
lapis sequoia
desert oar
fun concept. what's "NMG"?
No major glitches. It was a joke
vestal spruce
quick question, so I'm learning about Transformer architecture's attention as the foundational model and the explanation provide Q, K, and V as query, key and value. is it mean that query is the input data, key is the target output, and value is for the models weighting? is it a correct interpretation or am I off my a mile in understanding Transformer Architecture?
 ruby magnet
Hi everyone, someone here Know the avanced data tool called Dataiku?
 pure palm
https://www.kaggle.com/competitions/neurips-2023-machine-unlearning/overview
I am looking for a team mate If anyone interested pls dm me
Erase the influence of requested samples without hurting accuracy
 umbral charm
Does anyone know any latex OCR software out there
 verbal venture
hey guys in the context of NLP, how would an AI system be able to have conversations regarding my cat vs a conversation about a cat in general
what I'm asking is how is it able to have my cat in context (having knowledge and conversing about my cat) vs converstion about a cat in general
please explain as technically as possible
 cunning agate
hey guys, does anyone have an idea how to enhance student well-being based on AI and data
young egret
Hello is there a way to find the last occurence of the value "N" for each ID? I need to return the number of the last occurence.
data = {'ID': [1, 1, 1, 2, 2, 3, 3, 3],
'Break_confirm': ['N', 'Y', 'N', 'Y', 'Y', 'N', 'Y', 'Y']}
So I want another column that returns like 2, nan, 0 or 3,nan, 1
Here is my code so far 🙂
data = {'ID': [1, 1, 1, 2, 2, 3, 3, 3],
        'Break_confirm': ['N', 'Y', 'N', 'Y', 'Y', 'N', 'Y', 'Y']}

result_df_final = pd.DataFrame(data)

# Convert 'Break_confirm' column to numeric, treating 'N' as 0 and 'Y' as 1
result_df_final['Break_confirm'] = result_df_final['Break_confirm'].map({'N': 0, 'Y': 1})

# Reverse the DataFrame to find the last occurrence
result_df_final_reverse = result_df_final[::-1].reset_index(drop=True)

# Initialize the 'Order' column with NaN
result_df_final_reverse['Order'] = float('nan')

# Assign order values to the last occurrence of 'N' for each ID
result_df_final_reverse['Order'] = result_df_final_reverse.groupby('ID')['Break_confirm'].cumsum()

# Reverse the DataFrame back to the original order
result_df_final = result_df_final_reverse[::-1].reset_index(drop=True)

# Print the result
print(result_df_final)```!e maybe something like this?```py
import pandas as pd
data = {'ID': [1, 1, 1, 2, 2, 3, 3, 3],
'Break': ['N', 'Y', 'N', 'Y', 'Y', 'N', 'Y', 'Y']}
df = pd.DataFrame(data)
is_n = df['Break'] == 'N'
could put this all in one line, but feels a bit too messy
index_where_n = df[is_n].index.to_series()
_id_where_n = df.loc[is_n, 'ID']
min_n_idx_per_id = index_where_n.groupby(_id_where_n).min()
result = min_n_idx_per_id.reindex(df['ID'].unique(), fill_value=-1)
print(result)
@agile cobalt :white_check_mark: Your 3.12 eval job has completed with return code 0.
001 | ID
002 | 1    0
003 | 2   -1
004 | 3    5
005 | dtype: int64
oh wait, you wanted relative to the group?
hmm, just something like df.groupby('ID')['Break'].cumcount() over using the index should work I think
 untold bloom
In [86]: df.assign(new=df["ID"].map(df.pivot_table(index="ID", columns=df.groupby("ID").cumcount(), values="Break_confirm", aggfunc="first")   # long to wide
    ...:                              .eq("N").iloc[:, ::-1]                                                                                   # check Ns mirrored because last wanted
    ...:                              .pipe(lambda fr: fr.idxmax(axis=1).where(fr.any(axis=1)).astype("Int64"))))                              # get the index of last N, if any
Out[86]:
   ID Break_confirm   new
0   1             N     2
1   1             Y     2
2   1             N     2
3   2             Y  <NA>
4   2             Y  <NA>
5   3             N     0
6   3             Y     0
7   3             Y     0
Yes I will try this thank you 🙂
 strong tangle
hello guys, im lookin for a teammate in learning ai. if u want to learnin together dm me 
shut girder
Hello, are there any prerequisites to learning statistics? I'm currently learning Python and statistics at the same time with only a decent understanding of algebra fundamentals, but I don't know if this is a good way to approach becoming a data analyst
past meteor
shut girder
Hello, are there any prerequisites to learning statistics? I'm currently learnin...
Yes and no. Statistics is often taught at a decently high level to social science without people having done math beforehand.
That being said, knowing specifically linear algebra makes understanding statistics easier.
Finally, I'm not even sure an advanced level of stats is necessary for data analysts. You could get away with basic summary statistics (mean, mode, median, standard deviation) and typical bar, scatter and line plots. Other data analysts do need an advanced level of stats, it just depends on the specific role 🙂
shut girder
Ooh, I see, that's good to know. Thank you
rugged comet
Would you recommend writing an established machine learning algorithm such as Decision Trees from scratch as an exercise to understand how the algorithm works?
iron basalt
rugged comet
Would you recommend writing an established machine learning algorithm such as De...
Yes.
Concept to code and the other way around is a very useful skill.
Usually done through practicing data structures and algorithms ( #algos-and-data-structs ), but more specific to machine learning is good too (it gives a better sense of math <-> code).
rugged comet
Thanks for the input.
vast lintel
I know this is not a Python question (it's technically inside R), but is it possible to colour symbols via group1, symbolsize by group2 separately in echarts? All the examples I have ever seen for echarts have always only shown visualmap used for 1 variable at a time. My only working solution currently is to use group_by prior to inputting the data into e_charts like so
library(echarts4r)
my_scale <- function(x) scales::rescale(x, to = c(min(df$Time),max(df$Time)))
N<-300
df <- data.frame(x = runif(N,1,20),
                 y = runif(N,10,25),
                 z = rnorm(N,100,50),
                 Time = runif(N,5,500),
                 label = sample(c("interaction1", "interaction2", "interaction3", "interaction4", "interaction5"), N, replace = TRUE),
                 zone = sample(c("zone0", "zone1", "zone3"), N, replace = TRUE))

df_toadd<-data.frame(x = runif(N,80,100),
                     y = runif(N,10,25),
                     z = rnorm(N,100,50),
                     Time = runif(N,5,500),
                     label = sample(c("interaction1", "interaction2", "interaction3", "interaction4", "interaction5"), N, replace = TRUE),
                     zone = sample(c("zone0", "zone1", "zone3"), N, replace = TRUE))
df<-rbind(df,df_toadd)


df|>group_by(label)|>e_charts(x)|> #Using a group_by to force the second "visualmapping" categorically
  e_scatter_3d(y,z,Time)|>
  e_visual_map(Time,inRange = list(symbol = "diamond",symbolSize = c(25,5)),scale = my_scale)|>
  e_tooltip()|>
  e_theme("westeros")|>
  e_legend(show = TRUE)
Using a group_by(label_ automatically colours the points based off of their labels. But I want to know if there is a way to do it without using groupby, but just using e_visual_map (type = "piecewise") or something.
Additionally, I want help figuring out how to do a timeline with this example, across zones only. Right now if I wanted to do timeline AND maintain the different colouring and sizes of label, the closest I can get to it is by doing the following
df|>group_by(label,zone)|>e_charts(x,timeline = TRUE)|>
  e_scatter_3d(y,z,Time)|>
  e_visual_map(Time,inRange = list(symbol = "diamond",symbolSize = c(25,5)),scale = my_scale)|>
  e_tooltip()|>
  e_theme("westeros")|>
  e_legend(show = TRUE)
But understandably, this segments the dataset based off of unique combinations of label and zone, so the frames inside this timeline become interaction 1- zone0, interaction 2 - zone1 etc...when I just want to see all interactions within zone0,zone1, zone2. Scouring echarts documentation does not give me any inclination that there is a way to specify what variable the timeline should be going through like plotly does. https://echarts4r.john-coene.com/articles/timeline.html?q=e_timeline_serie#time-step-options (Every timeline example I have seen has only been using groupby itself to specify the frames through which the timeline goes)

echarts4r
rugged comet
Determining if a column of data is categorical is easy if the data in the column are strings. But if categories were already encoded as numbers such as 1 for class 1, 2 for class 2, etc, is it possible to determine if a column is categorical without outside metadata?
Seems like it isn't possible.
vast lintel
vast lintel
I know this is not a Python question (it's technically inside R), but is it poss...
I currently have a half-solution that isn't ideal, which is to make the "label" column continuous, and then I just do a 2nd visual map for that continuous variable like so
I am still not sure how to do this with the original categorical label, instead of the fake, "numeric" version of the label column I made instead
N<-300
df <- data.frame(x = runif(N,1,20),
                 y = runif(N,10,25),
                 z = rnorm(N,100,50),
                 Time = runif(N,5,500),
                 label = sample(c("interaction1", "interaction2", "interaction3", "interaction4", "interaction5"), N, replace = TRUE),
                 zone = sample(c("zone0", "zone1", "zone3"), N, replace = TRUE))

df_toadd<-data.frame(x = runif(N,80,100),
                     y = runif(N,10,25),
                     z = rnorm(N,100,50),
                     Time = runif(N,5,500),
                     label = sample(c("interaction1", "interaction2", "interaction3", "interaction4", "interaction5"), N, replace = TRUE),
                     zone = sample(c("zone0", "zone1", "zone3"), N, replace = TRUE))
df<-rbind(df,df_toadd)
df$mylabel<-as.numeric(substr(df$label,12,12))
my_scale <- function(x) scales::rescale(x, to = c(min(df$Time),max(df$Time)))

##Timeline


df|>group_by(zone)|>e_charts(x,timeline = TRUE)|>
  e_scatter_3d(y,z,Time,mylabel,label)|>
  e_visual_map(Time,inRange = list(symbol = "diamond",symbolSize = c(35,5)),scale = my_scale,dimension = 3)|>
  e_visual_map(mylabel,inRange = list(colorLightness = c(0.5,0.8), colorHue = c(180,260),colorSaturation = c(120,200)),dimension = 4,bottom = 300)|>
  e_tooltip()|>
  e_theme("westeros")|>
  e_legend(show = TRUE)
I am still in need of a solution that allows me to do that 'categorical' visualmap for label, instead of making it up as a numeric variable
past meteor
rugged comet
Would you recommend writing an established machine learning algorithm such as De...
In university we did it with pen and paper, most algos we did by hand. Others were implemented. All of them are engraved in my mind but I'm going to play devil's advocate and ask if that's really necessary 😄
Like does being able to write the algorithms make you a better data scientist? Unsure.
You should understand some of their properties, you get that nearly automatically from writing them but I'm sure you can get it from other ways as well 🙂
desert oar
vestal spruce
quick question, so I'm learning about Transformer architecture's attention as th...
The key and value are two separate representation of positions in the encoder-side sequence, which . The query is the representation of tokens on the decoder-side sequence. So query . key tells you the relevance of each position in the encoded sequence to each position in the decoded sequence.
The mental model is of stepping forward one token at a time through the decoded sequence, and for each token in the encoded sequence, computing the relevance of that token to the current decoded token.
Then you use that relevance to compute the weighted average over value tokens.
In some sense, the whole process is "just" a weighted average of the encoded sequence, where the weights are the relevance of each encoded token to each decoded token.
desert oar
rugged comet
Would you recommend writing an established machine learning algorithm such as De...
i think so, yes. if nothing else, it forces you to understand the equations enough to write them out correctly. i wouldn't spend too much time on it though. e.g. i see a lot of people get sidetracked trying to write their own NN framework or something like that. the value is in forcing yourself to work through the algorithm/model step-by-step, not in replicating what scikit-learn already does.
desert oar
rugged comet
Determining if a column of data is categorical is easy if the data in the column...
you can guess based on the fact that they are integers, but that's only a guess.
desert oar
vast lintel
I know this is not a Python question (it's technically inside R), but is it poss...
i've never seen echarts discussed here, so i think your chance of getting an answer is low, unfortunately. i suspect you're better off asking this in an echarts forum if one exists.
 dull flare
uh there are 3 editions for this book :
hands on ML with sklearn & tf, i plan on buying this book as this seem to be a must if you are a ML beginner.
But the problem is the edition 2 contains around 700+ pages while edition 3 has like around 500 pages
and i think the main difference is in the deep learning part of the book. Im confused which one to buy exactly
past meteor
dull flare
uh there are 3 editions for this book :
hands on ML with sklearn & tf, i plan on...
Just looked at the table of contents of the 3rd edition and it looks good to me 👍
I'd get the most recent one
dull flare
yes ig ill get the latest one
dull flare
past meteor
I'd get the most recent one

past meteor
dull flare
<:blobthanks:1066003957543075870>
Looks like a lot of topics for 500 pages. Big tip I can give you is that it's normal if you don't get all of it. After you finish it, do a project and then pick up a second book and try with that one, you'll keep getting better 😄
dull flare
yea thats sounds good ill do that
 storm smelt
Excuse me, I'll ask if anyone here can help me, I'm a beginner who wants to learn about the KNN modeling method
serene scaffold
storm smelt
Excuse me, I'll ask if anyone here can help me, I'm a beginner who wants to lear...
be sure to always ask your actual question. don't ask to ask.
storm smelt
im sorry
serene scaffold
storm smelt
im sorry
it's okay. just go ahead and ask your actual quesiton. (I won't necessarily be the one to answer it, but the channel has to know what the question is before anyone can try to.)
storm smelt
thank you bro
cold osprey
and no question was asked
serene scaffold
@storm smelt if you want help, you still need to ask your question
serene scaffold
Hello, please don't ask to ask, as this makes it take longer for people to help you. Please ask your actual question.
 odd meteor
dull flare
uh there are 3 editions for this book :
hands on ML with sklearn & tf, i plan on...
odd meteor
dull flare
uh there are 3 editions for this book :
hands on ML with sklearn & tf, i plan on...
The latest edition which I presume would have more updated topics / content / code
 long canopy
is DOT the most commonly used language for determining and defining graph visualization?
agile cobalt
long canopy
is `DOT` the most commonly used language for determining and defining graph visu...
never heard about it in my life
link?
long canopy
Graphviz
Abstract grammar for defining Graphviz nodes, edges, graphs, subgraphs, and clusters.
agile cobalt
the way they describe it, sounds like it's specific to their library
long canopy
most likely, I just need a well-defined anything that will allow me to programmatically diagram a graph and have it look like I want
agile cobalt
sounds like it fits the bill then, https://en.wikipedia.org/wiki/DOT_(graph_description_language)
DOT is a graph description language, developed as a part of the Graphviz project. DOT graphs are typically stored as files with the .gv or .dot filename extension — .gv is preferred, to avoid confusion with the .dot extension used by versions of Microsoft Word before 2007. dot is also the name of the main program to process DOT files in the Grap...
you may as well consider just using something like NetworkX instead though
long canopy
agile cobalt
you may as well consider just using something like NetworkX instead though
yeah, I'm trying out networkx, not sure it has as many visualization customization options though, but I wouldn't know, I'm proceeding with my first survey of the subject
echo mesa
do you guys know any cool resources, books, or anything that would require you to model very simple machine learning, statistic concepts in code? Because I'm learning math right now and I wanna represent the mathematics ive learned into code that would somewhat relate to machine learning, is there any websites, or resources like this?
left tartan
agile cobalt
never heard about it in my life
link?
Dot = graphviz
Not sure if it’s the most used language, since I’m not sure any one language is for graphs… but Graphviz is the GOAT in this space.
One of my side projects is to wedge graphviz into networkx. Via WASM. Well, a side project I haven’t started.
 left tartan
 nova widget
they should start where the previous ends
nova widget
they should start where the previous ends
You’d have to share your code / data model
nova widget
so it's around row 26-35
echo mesa
left tartan
You’d have to share your code / data model
would you mind answering to my question please?
left tartan
echo mesa
do you guys know any cool resources, books, or anything that would require you t...
The two things that come to mind are Kaggle.com/learn and CS50 for AI (which had practice problems). Is this what you’re looking for?
 true geode
Neural network theory question (I'm revising for an exam):
If I have a NN which looks like this, and I'm using in the first hidden layer (h1) an activation function like Relu? If each neuron recieves all the inputs (x1,x2,x3), and the weights(w1,w2,w3), wouldn't they all output the same value? What changes in each neuron? Would each neuron in h1 contain the same activation function? Are the biases different in each neuron?
 wooden sail
each "line" in your drawing is a weight
in general they are all different, and each neuron in the hidden layer h1 does not receive all the weights, as you drew yourself

as an example
in your drawing there are 12 weights from the input to h1
each neuron in h1 takes the 3 inputs and 3 different weights, 1 per input
true geode
All the weights are different? As in, there are 4 lines from input 1, so for each neuron from x1, it has a different weights for each neuron?
wooden sail
yep
otherwise it would be as you said, and there would be no point to having several neurons. they'd all do the same thing
true geode
I guess the bias is different for each nueron too
wooden sail
yep
in your drawing, you'd represent the weights as a 3 x 4 matrix, which has 12 entries
true geode
so the number of params = number of inputs * number of nurons + number of biases
wooden sail
the number of biases matches the number of neurons
so we'd have h = Wx + b here, were x is a vector of size 3, W is of size 4 x 3, b is of size 4, and h is of size 4 as well
h being the layer h1
wooden sail
i guess you'd apply the non-linearity too, so. more formally, h = relu(Wx + b)
where relu is applied elementwise
true geode
now to get my head around back propagation (I roughly get is the determination of the derivatives of the parameters to optimize the loss function) and the chain rule.
One of the example questions is this: Explain how a single perceptron can be used to fit xor data? There is not answer to this question provided... by my guess is... you can't? A single perceptron cannot fit XOR data, because XOR data isn't linearly separable. You would need a MLP to do that. Unless I fundementally misunderstood what a single perceptron is? (Was this likely a trick question?)
past meteor
true geode
One of the example questions is this: Explain how a single perceptron can be use...
It's probably a trick question because it can't, even if you use a non-linear activation
wooden sail
how strict are we 😛
arctic wedgeBOT
@wooden sail :warning: Your 3.12 eval job has completed with return code 0.
[No output]
oops
!e
import numpy as np
from numpy import newaxis as nax
import matplotlib.pyplot as plt
a = np.linspace(0, 1, 50)[:, nax]
b = np.linspace(0, 1, 50)[nax, :]

def subdiff_xor(a, b):
  return np.abs(np.arctan(100*(a - b)))*2/np.pi

plt.imshow(subdiff_xor(a,b))
plt.colorbar()
plt.savefig("biggest_oof.png")
``` i wonder if this will work@wooden sail :white_check_mark: Your 3.12 eval job has completed with return code 0.
 wooden sail
where one could arguably learn the 100 to control the transition from 0 to 1 and the function is subdifferentiable. idk
past meteor
Is it okay that I admit I don't know what I'm looking at
wooden sail
xorn't
but continuous
the axes in the image are the values of the input variables a and b in the interval [0,1]
if we treat abs(arctan()) as activation and then apply a linear/affine transformation to a vector containing [a, b], we can get an output that is 0 when a = b and close to 1 when a != b
the weights and biases determine how sharp the transition from 0 to 1 is (i just let the bias be 0)
wooden sail
can possibly avoid the abs by playing with the quadrants, but subdifferentials are your friend anyway
a 2d parabola would've also done the trick, and you can learn its parameters
past meteor
For this to work you do kind of need a bespoke activation, no? Or you fit a specific function rather
While the whole appeal is having a universal approximator
wooden sail
this is all the difference between parametric/model-based learning and black-box ML. the former has fewer parameters and requires less data to train. arguably the "right way" of doing deep learning
let noisy data regularize the non-convex optimization problem through which you fit the parameters of an accurate, but nasty model
past meteor
(nerdy) ML practitioners love the term "inductive bias"
serene scaffold
I guess I'm not a true ML practitioner anymore 
past meteor
Guess you aren't a nerd
serene scaffold
am I still gay?
wooden sail
past meteor
(nerdy) ML practitioners love the term "inductive bias"
fair enough, though that's the whole point. the no free lunch theorem is not kind
past meteor
serene scaffold
am I still gay?
yes
wooden sail
serene scaffold
am I still gay?
you'll have to submit an appeal
i get the impression that emoji is just slightly off center and rotates funny
past meteor
wooden sail
this is all the difference between parametric/model-based learning and black-box...
the thing with this is
15k time series and 40 variables per
At best to be successful you pick an architecture with the right inductive biases because each individual one requires a different type of parametric model
wooden sail
past meteor
At best to be successful you pick an architecture with the right inductive biase...
yep
it certainly doesn't always make sense
but when you can do it, you can't outperform it
past meteor
statisticians will love you for saying this
wooden sail
i say it with the weight of cramer rao bounds behind me
keeping the information content fixed, the number of parameters directly impacts the lower bound on estimation variance
past meteor
Btw isn't the XOR problem solveable trivially with a perceptron if you add an interaction term
wooden sail
wdym by interaction term?
btw, check this out. from one of the gods of signal processing: https://ieeexplore.ieee.org/abstract/document/10056957
past meteor
x1 * x2
wooden sail
past meteor
`x1 * x2`
yes. that fits under the parabola model i mentioned as an alternative
past meteor
When in doubt, I always sprinkle a little bit of https://scikit-learn.org/stable/modules/generated/sklearn.preprocessing.PolynomialFeatures.html in there. Even today at work even 🤷
 ashen axle
anyone know how to place a legend outside the bounding box through the Seaborn Objects interface?
true geode
This, explains what I was wondering before. If I understand correctly, each neuron explains different characteristics of the model... I.e, certain weights may tell an input to "switch off" at certain units.., in this example, awareness may have a weak correlation to savings... so the weight will be low from savings to awareness (or zero). But if that's true, the "meanings" of each neuron are not explicitly defined, and the weight gets updated through back propagation. How are these characteristics determined, or are they just "modelled" into existence?
 past meteor
ashen axle
anyone know how to place a legend outside the bounding box through the Seaborn O...
past meteor
ashen axle
anyone know how to place a legend outside the bounding box through the Seaborn O...
Typically for this you can google if it's possible with matplotlib since seaborn is built on top of it 😄
ashen axle
past meteor
Typically for this you can google if it's possible with matplotlib since seaborn...
Yeah I usually use fig.legend(bbox_to_anchor=(1.05,1), loc=2), my question was more hinting at whether Id missed a seaborn.objects method for controling legend placement, the docs are a bit patchy
wooden sail
true geode
This, explains what I was wondering before. If I understand correctly, each neur...
yeah in a generic black box neural network, you cannot control what the intermediate hidden neurons mean
if you tailor the activation functions so that the values have a specific meaning, you can do this, like in the XOR solution i gave above
past meteor
ashen axle
Yeah I usually use `fig.legend(bbox_to_anchor=(1.05,1), loc=2)`, my question was...
That I don't know immediately, sorry!
past meteor
wooden sail
btw, check this out. from one of the gods of signal processing: https://ieeexplo...
I feel like this has so many different names. There's also physics informed DL.
wooden sail
that's different still
that's about putting differential equations in the cost function, not directly about architecture
these are more about either changing the architecture based on an alg, or fitting a black box network into another alg
you can mix and match
past meteor
I see. For cgm modelling people have tried swapping out parts of mechanistic models with DNNs
true geode
wooden sail
if you tailor the activation functions so that the values have a specific meanin...
I would need to try this for myself actually, I think.
after exam, no time for coding now. 😖
wooden sail
you can do it conceptually on a piece of paper, no need to code it immediately
i took out a piece of paper to write that bit, can't code it or come up with it off the top of my head either 😛
iron basalt
https://www.desmos.com/calculator/tljcf5bjwd (non-monotonic activation function)
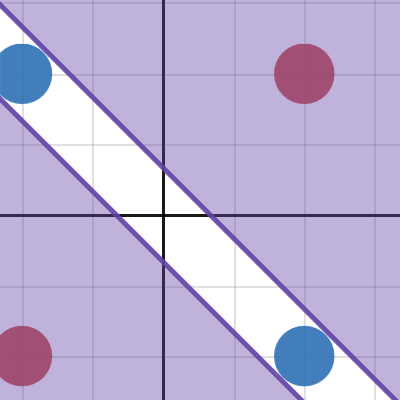
Desmos
past meteor
@wooden sail, been looking at the paper. It's very interesting specifically because stastical vs mechanistic is a 0/1 kind of thing in my domain
But the model based things in many applications I've seen were a bit of cop-outs, like oversimplifications of the world
Data driven was interesting exactly because it had way more degrees of freedom
wooden sail
it depends what we call "model" here. in that paper, they specifically talk about optimizers as models