#data-science-and-ml
1 messages · Page 86 of 1
 jaunty helm
 arctic wedgeBOT
:incoming_envelope: :ok_hand: applied timeout to @stone surge until <t:1698238067:f> (10 minutes) (reason: duplicates spam - sent 4 duplicate messages).
The <@&831776746206265384> have been alerted for review.
jaunty helm
 unique ether
I've just noticed there are people who owned a car at age 0
unique ether
I've just noticed there are people who owned a car at age 0
That might mean the car age is, say, 0 ~ 11 months old (if it was in years)
So if missing OWN_CAR_AGE means not having a car, you might want to set it to -1 instead of 0
unique ether
Man your on fire I just checked and it means 'Age of client's car'
according to the description database
jaunty helm
dunno, is there a table you can refer to?
unique ether
Yea they have a whole csv file full of column descriptions
jaunty helm
You should definitely check that often
unique ether
It might take a while but do you think I should just go through and check them all individually?
jaunty helm
All the features? That's a lot of work
unique ether
jaunty helm
All the features? That's a lot of work
I just want to be able to justify why i dropped some of the columns. Ideally I'm hoping to end up with 5-10 features at the absolute max
jaunty helm
I'm very not sure if this is a good idea, but maybe you can just blindly impute with the average value for ...AVG features, the mode for ...MODE features, etc. if not too many were missing
unique ether
using simple imputation?
You wanna know what the part about this assignment that is really killing me? There are literaly 0 marks assigned for all the cleaning..
btw sorry to bombard you with questions like this but theres a column for education level. Would you assign ordinal values to that or do one hot encoding? I've assigned ordinal values
To me, education level isn't nominal its ordinal
jaunty helm
unique ether
To me, education level isn't nominal its ordinal
I mean it makes sense
unique ether
Would doing so be making an assumption that higher education is better for the TARGET variable?
jaunty helm
unique ether
Would doing so be making an assumption that higher education is better for the T...
It means we're assuming higher education is either better/worse for the target, but not like "elementary is good, middle is bad, high is good again" for linear models
For tree models, I'm pretty sure they don't care and you can ordinal encode everything
unique ether
jaunty helm
For tree models, I'm pretty sure they don't care and you can ordinal encode ever...
really??
So earlier you mentioned it would take ages to go through and examine each feature. If presented with a dataset like the one I've got in that graph, how would you start cleaning?
jaunty helm
unique ether
So earlier you mentioned it would take ages to go through and examine each featu...
Probably have 10 headaches before procrastinating to infinity
unique ether
filtered_desc_apps = desc_apps[desc_apps['Table'] == 'application_{train|test}.csv']
Is this a deep copy?
 spare briar
you wont mutate desc_apps if you modify filtered_desc_apps
unique ether
Great thanks
unique ether
spare briar
look into ‘views’ in pandas
Yea I got the
'SettingWithCopyWarning:
A value is trying to be set on a copy of a slice from a DataFrame'
That's what prompted me that I might be having that issue
 dusk tide
I have a doubt , the image shows the correlation(pearson) between the target feature and all other predictors. There are some predictors with which the target is very very weakly correlated like (correlation between 0.05 and -0.05) . Should we include these features in the model? In my opinion these features should not be included in the model since very very weak correlation mean any change in the predictor will not reflect the change in the target and hence these 2 are independent of each other . Am I correct and what should be done?

 desert oar
do you know why these are missing? that's the #1 most important question you'll want an answer to
desert oar
dusk tide
I have a doubt , the image shows the correlation(pearson) between the target fea...
it's incorrect to conclude that weakly-correlated features should be excluded from your model.
general questions for you:
why do you even want to exclude features in the first place? there is virtually no statistically or scientifically motivated reason to pre-filter features like this.
what if the presence of one feature changes the effect of another feature? this is known as an interaction and it's not only common in every known area of empirical study, it's fundamental to how every model works apart from than plain linear regression (and even in linear regression without interactions, predictors can influence each other in counterintuitive ways). see e.g. lectures 5-7 of https://www.youtube.com/watch?v=e0tO64mtYMU&list=PLDcUM9US4XdNM4Edgs7weiyIguLSToZRI&index=5
furthermore:
since very very weak correlation mean any change in the predictor will not reflect the change in the target and hence these 2 are independent of each other
it's not valid to conclude that Y and X are independent because they are uncorrelated. consider the extreme case of Y = X^2. in this case, corr(Y, X) = 0 and in any random sample of large enough size, you'll see that the sample correlation does in fact turn out to be ~0. yet the two random variables are in some sense maximally dependent, with Y being a completely deterministic (albeit lossy) transformation of X.
 past meteor
- correlations are linear
 burnt temple
idk why but python now use 60% cpu for some reason while running ai upscale and gpu only 40%

the issue appeared some months ago
 oblique jewel
hey yall, I am currently attempting to teach myself python with the long term goal of being able to do basic AI. Currently im going through a michigan university course online but its limited to basic python, does anyone have any suggestions on where to go next?
burnt temple
wtf
 oblique jewel
I don't have the ability to help with your issue but can I inquire as to what you are working on?
 nimble acorn
 scenic shore
@nimble acorn did you get it
nimble acorn
hey, no I didnt. I was going to post it to a chat help. thanks
scenic shore
oh ya u can do that too
im not sure what the goal is but id def start https://www.tensorflow.org/tutorials

TensorFlow
Complete, end-to-end examples to learn how to use TensorFlow for ML beginners and experts. Try tutorials in Google Colab - no setup required.
nimble acorn
scenic shore
this should get u going, and most chatbots like gpt or something can def assist with most questions
once u get towards the end may need to alter some coding peices to increase the accuracy rating
nimble acorn
ok will do. goal is to figure out from csv file which channel is used most for an iot device in a remote location
this device should be using its own custom communication channels but sometimes bandwidth is low so it will use cell data.
nimble acorn
i dont even know where to start so could be ML or ...
scenic shore
ya ML is more basicl modeling outputs
nimble acorn
i will go with ML then and see where I land. here we go!
but eventually once trained and all, the model should run in background and inform folks. but baby steps first.
scenic shore
import pandas as pd
import matplotlib.pyplot as plt

df = pd.read_csv('your_iot_data.csv')

channel_counts = df['channel'].value_counts()

channel_counts.plot(kind='bar')
plt.xlabel('channel')
plt.ylabel('count')
plt.title('Usage for IoT Devices')
plt.show()

most_used_channel = channel_counts.idxmax()
count_of_most_used_channel = channel_counts.max()

print(f"most used channel is {most_used_channel} with a count{count_of_most_used_channel}.")
wow thanks!
scenic shore
np might have to do some alterations
nimble acorn
so channel would have types: mobile, x,y,z
ok I see what you did there. very clean that max is key
 tardy lark
hey can anyone help me with figuring out why it keeps telling me a column doesn't exist but when i print the dataframe it is there
        df = pd.DataFrame(data)
        print(df)
        df.drop(columns=['Date'])
        print(df)```
 earnest wren
tardy lark
hey can anyone help me with figuring out why it keeps telling me a column doesn'...
earnest wren
tardy lark
hey can anyone help me with figuring out why it keeps telling me a column doesn'...
Try printing all colums using print(df.columns.values) and see what that says.
tardy lark
well i guess it's not a column
weird when i open a csv file it shows it as if it were a column
earnest wren
tardy lark
weird when i open a csv file it shows it as if it were a column
It looks like it's made that into an index for you using the Date datatype.
You can choose to import the csv differently so that it will create a standard numerated index for you instead.
tardy lark
well the way i'm doing it here is switching it from saving as a csv to saving it all as sheets in an excel workbook so it's the raw data from the scrape
earnest wren
Which everway you do it, if date is a field, I'd recommend making it into a column, rather than as an index.
 serene scaffold
tardy lark
hey can anyone help me with figuring out why it keeps telling me a column doesn'...
serene scaffold
tardy lark
hey can anyone help me with figuring out why it keeps telling me a column doesn'...
the problem is htat date is the name of the row index.
since they're the row index, if you want to forget about dates entirely, you'd need to do df.reset_index(drop=True)
keep in mind that that returns a new dataframe, so just doing df.reset_index(drop=True) won't change df. it returns a new value.
 shut girder
Hello, I'm trying to clean this column called 'Ticket'. As you can see, there are some "random" letters at the back of some ticket numbers. I want to update the cells in the Ticket column that have these random letters with just the ticket number. For example: row 413 in the picture below is an uncleaned cell. I came up with a solution, but no output is being sent. This is my code:
titanicData = titanicData[['Pclass', 'Name', 'Sex', 'Age', 'Ticket', 'Fare']]
bannedLetters = ['A', 'B', 'C', 'D', 'E', 'F', 'G', 'H', 'I', 'J', 'K', 'L', 'M', 'N', 'O', 'P', 'Q', 'R', 'S', 'T', 'U', 'V', 'W', 'X', 'Y', 'Z', '/', '.']
newTicketSeries = None

for item in range(len(titanicData['Ticket'])):
    for letter in titanicData.loc[item, 'Ticket']:
        if letter in bannedLetters:
            titanicData.loc[item, 'Ticket'] = str([value for value in titanicData.loc[item, 'Ticket'] if value not in bannedLetters])

print(titanicData['Ticket'])

The reason why I'm trying to convert a list comprehension of the ticket numbers only into a string is because all the values in this column are strings. This might not be a good approach to cleaning this column, so if anyone has a better solution, please guide me. Much appreciated.
 urban knoll
has anyone used silerio-VAD here? For I'm trying to figure out how to use it, but it just seems worse than webrtc when it's not suposed to. If I have an audio frame of around 600 or so samples (at 16000 HZ) that has voice in it, I get a speech probability like 0.01. I'm speeking directly into the microphone. I don't get why the probability is so low.
 frosty elm
I'm getting this error when trying to download 'punkt' from nltk. The following code doesnt download the resources:
import nltk
nltk.download('punkt')
I've tried changing the path to current directory and manually downloaded english.pickle file for it to use. But still the same error arises:
current_directory = os.path.dirname(os.path.realpath(file))
nltk.data.path.append(current_directory)
nltk.download('punkt')
LookupError:
**********************************************************************
Resource punkt not found.
Please use the NLTK Downloader to obtain the resource:
>>> import nltk
>>> nltk.download('punkt')
For more information see: https://www.nltk.org/data.html
Attempted to load tokenizers/punkt/english.pickle
Searched in:
- 'C:\\Users\\Deep-Thought/nltk_data'
- 'C:\\Users\\Deep-Thought\\AppData\\Local\\Programs\\Python\\Python312\\nltk_data'
- 'C:\\Users\\Deep-Thought\\AppData\\Local\\Programs\\Python\\Python312\\share\\nltk_data'
- 'C:\\Users\\Deep-Thought\\AppData\\Local\\Programs\\Python\\Python312\\lib\\nltk_data'
- 'C:\\Users\\Deep-Thought\\AppData\\Roaming\\nltk_data'
- 'C:\\nltk_data'
- 'D:\\nltk_data'
- 'E:\\nltk_data'
- ''
**********************************************************************``` void dome
how to categorise tweets into pro-israel or pro-palestine for a project
 spark nimbus
Using a pandas data frame like this: ```
col | col_1 | col_2 | col_3
1 | a | b | c
3 | d | e | f
2 | g | h | I
 timber spoke
is there a way i can check if I've reached the lowest possible loss in my MLP model?
serene scaffold
spark nimbus
Using a pandas data frame like this: ```
col | col_1 | col_2 | col_3
1 | a | b |...
is there some significance of a, f, and h? like, are they the maximum values in their respective columns?
spark nimbus
No, it's the value we decide to use based on a somewhat arbitrary col
Basically col_1 covers the data for period 1, col_2 is the data for period 2, and col is decided on by a large number of steps
And I believe we have up to 20 of these columns
serene scaffold
I can't think of a "good" way to do it, so you might just have to write a loop that uses iat.
also you'll need to subtract 1 from each value in col. because indexing starts at 0, not 1.
In [30]: df
Out[30]:
  col1 col2 col3
0    a    b    c
1    d    e    f
2    g    h    i

In [33]: for label, column in df.items():
    ...:     print(label, column.iat[1])
col1 d
col2 e
col3 f
So I need to loop over all records? That's a bit of an issue ^^'
jaunty helm
I think they mean use col_i where i is the number stored in col in that row
serene scaffold
jaunty helm
I think they mean use `col_i` where `i` is the number stored in `col` in that ro...
I know that, but I can't think of a good way to use that to index it without a loop.
spark nimbus
Oh yeah that too ^ now that I read your output
So would my best bet be to write a custom native extension so I can at least somewhat benefit from SIMD operations while looping (if there's even instructions for this)?
Because for millions of records, a regular python loop isn't going to cut it in an acceptable amount of time
serene scaffold
@spark nimbus if you convert it to a numpy array, it looks like you can do it like this
In [41]: arr
Out[41]:
array([['a', 'b', 'c'],
       ['d', 'e', 'f'],
       ['g', 'h', 'i']], dtype=object)

In [42]: arr[(1, 0), (2, 1)]
Out[42]: array(['f', 'b'], dtype=object)
where arr = df.to_numpy()
except I don't have col as a column
 crisp citrus
anyone able to explain how measure.regionprops works?
serene scaffold
@spark nimbus did that work for you?
 winter canyon
I want to create and train an AI for a video game.
The Game is a Versus version of Pac Man. It has 2 sites. On your site you are a ghost and on the other you are pacman. The playing field is likely generated randomly and the status of the game is always given.
Is this doable in about 40-80 (work) hours? If not, how much time would you expect this to take?
I am good in python but I never worked with this type of data or AI
spark nimbus
serene scaffold
<@161866631004422144> did that work for you?
I ended up using numpy.select instead :)
serene scaffold
glad it worked
spark nimbus
winter canyon
I want to create and train an AI for a video game.
The Game is a Versus version ...
Training in that amount of time, assuming you can't use speedup due to it being a site, is unlikely to finish with desired results
winter canyon
its a python program that runs locally
spark nimbus
So it's possible for you to run the game at 100x speed?
spark nimbus
Assuming you have a good way to quantify being good vs being bad, and have a local implementation you can use to speed up the process by not playing in real-time, you can make an agent play against itself for a while and get good results. Then you just have to figure out which type of AI to go with. For example, NEAT tends to learn much faster than other algorithms, but also has a much lower skill ceiling.
winter canyon
But youd say id get a working result in only those few hours?
I am just scared that Id need to learn for like 50 hours and then only have issues for another 40 and then I have no result
but if ill get something that does something in the time its all i need
spark nimbus
I'd say assume you'll need 60 hours of training if you're checking how well a model performs every so often
winter canyon
We have 4 hours a week class and I can also program and train from home throughout the week. So there is definitly much time to train
spark nimbus
https://github.com/Farama-Foundation/Gymnasium is probably worth looking into

GitHub
An API standard for single-agent reinforcement learning environments, with popular reference environments and related utilities (formerly Gym) - GitHub - Farama-Foundation/Gymnasium: An API standar...
winter canyon
thanks
Ig ill just go for it. I dont have that much to lose if I fail, but Id guess its a great journey either way
 final canopy
Hi everyone
I'm new here
I'm an aspiring data scientist and I'm looking forward to learn and grow
 harsh kelp
i want to get into AI, where should I begin?
 left tartan
winter canyon
I want to create and train an AI for a video game.
The Game is a Versus version ...
left tartan
winter canyon
I want to create and train an AI for a video game.
The Game is a Versus version ...
Have you watched any of the two minute paper videos on training game AIs? He links some great papers and resources. I’d suggest watching and reading a few those (like the hide and seek one) to get a sense of how this is done… and how long they needed to train
winter canyon
Will do, ty
 bold jolt
Hello everyone, what's the best channel to talk about improving my (pretty simple) model? Here?
serene scaffold
bold jolt
Hello everyone, what's the best channel to talk about improving my (pretty simpl...
yes
unique ether
Are these valid reasons/justifications for dropping columns or am I just talking rubbish?
serene scaffold
uh, that's a lot of text. can you put it in a pastebin?
unique ether
!pastebin
arctic wedgeBOT
Pasting large amounts of code
If your code is too long to fit in a codeblock in Discord, you can paste your code here:
https://paste.pythondiscord.com/
After pasting your code, save it by clicking the Paste! button in the bottom left, or by pressing CTRL + S. After doing that, you will be navigated to the new paste's page. Copy the URL and post it here so others can see it.
serene scaffold
in the future, please don't ask people to read screenshots of text.
unique ether
I tried to put it in a pastebin but it looks terrible
its a markdown cell from a jupyter notebook
serene scaffold
okay, well, that screenshot is too hard to read on my device.
unique ether
Here is the pastebin, I apologize in advance lol
Basically I'm trying to justify my choices in cleaning this massive dataset
bold jolt
So I have a polynomial equation I need to predict using a neural network. The equation is: (x+1)^2 * (x-1)
I first converted my y values to ln(y) by converting the above equation into 2 * np.log(x+1) + np.log(x-1) (so that they don't explode at high enough values)
As for my x values, I used a polynomialfeatures function from sklearn to split 1 X value into 4 X values x = [x^3, x^2, x^1, 1].
So far, I've changed my data such that each row has become [x^3, x^2, x^1, 1] : ln(y)
Now comes the part where I'm just doing trial and error on every possible thing but I'm so lost in what direction I should be thinking towards that its just painful.
For now I used a NN with 3 layers and tanh functions. I removed the last tanh function in order to get regression-like results. For my training loop, I used an Adam optimizer with an extremely low learning rate and used the Mean Squared Error loss function.
Here's my question, what could I have done better? The task assigned to me bounded me to solve it using neural networks so i'd like an answer within that domain :(
Here are some pics of my results


If anyone of you needs the notebook for this code let me know
 weak escarp
hey guys, im a bit new to this stuff and im a bit confused on what is going on here.. like why does the precision recall curve look like this T^T
 bold jolt
is your dataset imbalanced by any chance?
weak escarp
nop
bold jolt
I researched this a bit, it's quite a few problems to diagnose to figure out which one it can be. For starters, what's the data about and what/how are you trying to predict?
weak escarp
its an image dataset, i just ran gaussian naive bayes on it , thats all
im kinda new to this and still exploring stuff so im not sure of what im doing or seeing.. but ik the curve isn't supposed to look like this
bold jolt
yeah it can be caused by just slightly different pixel values in the input data which massively changes the classification, causing the plateaus
you can improve it by using an algorithm that is suited for image classification, I would recommend looking a little bit on how a CNN works. But if you're just starting to learn AI & ML models, then I would recommend testing models on normal datasets before moving onto image data.
weak escarp
bold jolt
yeah it can be caused by just slightly different pixel values in the input data ...
oh you mean there isn't much of a change in pixel values and therefore its stagnant? so basically a bad model for classifying images?
bold jolt
kinda yea
 plain leaf
Hey everyone, I'm a Data Science student with hands-on Deep Learning and Machine Learning experience, thanks to my internship in Deep Learning-based Soft Sensors. I'm eager to collaborate on projects, so feel free to DM me!
 echo mesa
Hello guys, I'm going thru a course rn and the topic is linear regression with a house price prediction example, and I would have a couple of question related to it. When we write fw,b(x)=wx+b now obviously this is a function, I assume that w stands for weights and b stands for bias. I looked them up but I'm a bit confused about their purpose and their significance in terms of the function. Also in mathematics I've never seen defining a function with two values in the subscript but I assume that they are the same. Thanks!
 mild dirge
echo mesa
Hello guys, I'm going thru a course rn and the topic is linear regression with a...
mild dirge
echo mesa
Hello guys, I'm going thru a course rn and the topic is linear regression with a...
You are correct in the meaning of the subscripts, w stands for weights, and b stands for bias
If you have a simple formula of a line, then you have f(x) = a*x + b
a can be used to determine what effect x has on the output, whereas b is used to determine the "offset"
If a is left out you can only construct a horizontal line at any height b. And if b is left out of the formula, you can only cosntruct lines that go through the origin (0, 0)
And for linear regression the goal is to construct a line that is as close as possible to a set of given points. So both a and b (or w and b) are needed to be able to make any straight (non vertical) line possible.
@echo mesa
Does that make sense?
nimble acorn
@scenic shore thanks for your help. I think now I can go to next steps. I would like to be able to see/predict why an iot device uses mobile channel based on other data points
hello, would like to learn more about predictive analysis? where should I start please?
 main glade
Hi i really want to work on ai in python i know python, i just need to learn more about ai.I'm having trouble finding online resources does anyone have any please? My ultimate goal is to create ai for games
echo mesa
mild dirge
<@547810225777016834>
Does that make sense?
Yeah it does, you are explaining it very clearly, I think that I'm a bit unexperienced in this field, I might ask stupid questions which I apologise for, but how does the training process actually work? Like mathematically, how do analyse the data and start learning it, my confusion was always about being unspecific, like you just literally described the problem and now it makes sense because you were specific. But for example in the course we are going thru the general house price prediction problem, however what I have confusion with is that I don't specifically understand what's going on. When for example we talk about the training process, we discussed that the data gets feed into the learning algorithm which will produce a function that we refer to as the model, and then after a while once our model gets "smart" enough we can ignore the outputs and we are using our model. My question are that how can we define the learning algorithm? What is it? How does it work programatically and mathematically, is it something that I should worry about? Because I keep seeing these fancy projects that people made with pytorch but personally all I care about is being able to understand every single part of to the lowest level possible, perhaps I just need an advice or maybe I'm overcomplicating it, but my goal is being able to understand it to the deepest level both programmatically and mathematically.
(sorry for the spelling mistakes, I'm on my phone)
mild dirge
Say we have a line, and we define it with the formula f(x) = a*x + b. And we start with a=1 and b=2. And we also have some points, and we would like the difference between the points and the line to be as small as possible, i.e. the line passes through the points. This is what the situation looks like

How would you move the line (which value, a/b would you change) to make the line closer to the points @echo mesa
echo mesa
mild dirge
Say we have a line, and we define it with the formula `f(x) = a*x + b`. And we s...
I'm sorry but I don't understand where are you going with this or what's the purpose of this
mild dirge
I thought you wanted to understand linear regression
past meteor
echo mesa
Yeah it does, you are explaining it very clearly, I think that I'm a bit unexper...
The most high level explanation of the training phase is that you give the model an "objective" and it needs to select some parameters to do really well on that objective. For some models this is a single formula that you can just calculate and for others it's an iterative procedure (think for loop) that consists of trying something, receiving feedback, improving the model on the basis of it and going again
This is a super handwavy explanation, but me or Camel can get more technical if you want or need it
mild dirge
Yeah I was planning on giving some intuition on a loss function and iteratively (or with derivative) finding what direction to move the line to improve the results
But I have work in the morning, so I'm heading to bed soon, if you want learn about it maybe someone else can help or we can discuss it later
echo mesa
mild dirge
Yeah I was planning on giving some intuition on a loss function and iteratively ...
No you are completely fine, I was very unspecific about what I have confusion on, I was just stating my mindset so you guys maybe can correct it or perhaps give me some advice on whether how should I approach understanding three fundamental concepts in depth.
echo mesa
past meteor
The most high level explanation of the training phase is that you give the model...
Okay, but for example how did you go about it. How did you learn all of these, did you learn the maths first and then understanding these concepts using your mathematical understanding?
Or do you just start with a basic overview and then trying to understand the concepts in depth?
mild dirge
The way I learned it is probably not that great. But I think it is difficult to have a smooth learning curve with complex content like machine learning. I mostly looked at formulas trying to understand them, but also looking at the intuition behind the formulas with some books on machine learning, and also from my uni.
I think it's best to get an intuition for what you are even trying to do with a machine learning model.
Knowing what an objective/loss function is, why you want to reduce this, and how you can reduce it
past meteor
echo mesa
Okay, but for example how did you go about it. How did you learn all of these, d...
I learnt all of this in university
Freshman math covered linear algebra and calculus. Second year we had statistics, also some "basic" ML/AI. Third year we got econometrics (linear modelling), ...
You can definitely self learn all of this though! 😄 University was only like a small % of the things I've learnt in this space
nimble acorn
echo mesa
No you are completely fine, I was very unspecific about what I have confusion on...
I am in the same boat as you are. This subject is so wide one can get lost in the weed. For me what is helping me was to understand the concepts from a none technical pov as much as I could using analogies that will help me understand the concepts
past meteor
But a good thing uni does is put a clear path and also, it shows it can take a few years of working on something to get good. That's super frustrating because often times you want to be good and you want it yesterday
Realising it'll take time and making peace with that is always a good thing to do
echo mesa
Wow guys, thank you all for expressing your opinions, I'm personally 16 years old and in secondary school so I'm self-learning maths at the moment, but as it turns out university can be really helpful as well, although as you guys mentioned especially with programming and maths you can pretty much self-learn everything.
echo mesa
nimble acorn
I am in the same boat as you are. This subject is so wide one can get lost in th...
Exactly, sometimes it can be overwhelming to know what to do, or what to understand, going to youtube is not the best as there are bunch of misconception and you are probably going to confuse yourself in terms of advice, so that's why I thought I'd ask in this server.
echo mesa
past meteor
Freshman math covered linear algebra and calculus. Second year we had statistics...
Yeah perhaps my lack of mathematical understanding playis a vital role in my confusion towards these concepts, because if I'd know maths more then chances are these things would make much more sense.
nimble acorn
there are a lot of layers like an onion so best to tackle one piece at a time. if you try to swallow all of the layers at once one will choke. for example trying to learn ML, math, python, jupyter, etc in one swoop is bound to cause frustration and giving up
echo mesa
nimble acorn
there are a lot of layers like an onion so best to tackle one piece at a time. i...
yeah
nimble acorn
so lets break down what are the things you know and do not know in this ai world.
python ☑️
echo mesa
yeah python for sure
I do not have a very high mathematics understanding like calculus,
nimble acorn
math 
echo mesa
I do learn math though in my free time and hopefully if I keep going I'll acquire more understanding of that too
past meteor
echo mesa
Wow guys, thank you all for expressing your opinions, I'm personally 16 years ol...
16 is a good age to start! I wish I had known what I wanted to do at that age. I'd say take it slowly and enjoy the journey
It's vague advice, but try not to be in a hurry
Do courses, build projects and it'll come step by step
nimble acorn
woe 16!?! kiddo you are on a great track, good for you!
past meteor
Question everything, go deeper step by step, ask us questions, ask your teachers questions, your profs in uni, ...
echo mesa
past meteor
16 is a good age to start! I wish I had known what I wanted to do at that age. I...
Thanks man, I appreciate it. 🙂
echo mesa
nimble acorn
woe 16!?! kiddo you are on a great track, good for you!
Thank you 🙂
past meteor
Many of us like answering questions, it keeps us fresh and thinking as well! 😄 It's not just altruism
echo mesa
past meteor
It's vague advice, but try not to be in a hurry
yeah my biggest advantage is time, I have free time and courage to learn all of these stuffs 🙂
nimble acorn
is there anything specific you have domain knowledge in? sports, music, farming, birds, insects? marrying that domain knowledge with ML is a leg up
echo mesa
past meteor
Many of us like answering questions, it keeps us fresh and thinking as well! 😄 ...
Yeah, sometimes I do ask some stupid question I'll admit, but It's much better not to question anything at all 🙂
echo mesa
nimble acorn
is there anything specific you have domain knowledge in? sports, music, farming,...
Yeah that's actually a good idea
nimble acorn
also one thing I learned is AI is the broad parent subject (ie cats)
machine learning and deep learning are subsets (lion, tiger,puma,leopards)
Deep Learning (next evolution of ML)
past meteor
echo mesa
yeah my biggest advantage is time, I have free time and courage to learn all of ...
Have you used kaggle.com yet?
There's courses and also challenges called "Tabular playground". That's how I'd recommend most people to get started.
They have relatively easy, but not too easy challenges. You make them first, see how well your model scores and then look at other people's solutions
echo mesa
past meteor
Have you used kaggle.com yet?
I've heard of it, but no not yet. I'm actually going thru a free course rn fron Andrew ng as an introduction to ai and machine learning, while I also read a book about data science in python which I find very interesting and also doing pre-calculus at the moment.
past meteor
Oh, that's already a great path
echo mesa
past meteor
They have relatively easy, but not *too* easy challenges. You make them first, s...
Gothca, thanks very much. I'll make a note of that 🙂
 echo mesa
past meteor
Oh, that's already a great path
echo mesa
past meteor
Oh, that's already a great path
It was recommended by someone from this server, it might actually be either of you guys. I dont remember tbh 🙂
I do wonder that once I finish with the course what should I do? I read a blog post that going into data science and data analysis might be very useful as it's might even more important then the actual model part
past meteor
I'd say that being really good at modelling matters at scale. If you can improve a process by 5 % that is creating (or costing) millions it matters more than when it's not doing that
When not at scale, the main advantage is automating things. Sometimes you can automate things without a model
echo mesa
past meteor
I'd say that being really good at modelling matters at scale. If you can improve...
by modelling do you mean the process of creating the model?
past meteor
echo mesa
by modelling do you mean the process of creating the model?
Indeed, maybe you visualize the data and find if-then rules that capture exactly what you need.
For other domains like NLP and Computer vision there's also more and more models that don't require any more training on your end either, you use them as-is
echo mesa
past meteor
Indeed, maybe you visualize the data and find if-then rules that capture exactly...
Would you spend more time on data science or on the process of modelling?
echo mesa
past meteor
For other domains like NLP and Computer vision there's also more and more models...
Gotcha, that's very useful
past meteor
echo mesa
Would you spend more time on data science or on the process of modelling?
I'd say there's many different paths in data science, try them all out and see which one you like the most
Some people prefer the super mathematical aspect, creating new models (that others will use), some prefer the business side, some prefer super technical modelling (for a specific problem), ...
As you progress in the field it'll become clear which you like the most
echo mesa
Gotcha, thanks very much
nimble acorn
this is my vscode jupyter plugin learning environ. baby steps

following this tut.
https://www.youtube.com/watch?v=GwIo3gDZCVQ
🔥 Machine Learning Engineer Masters Program (Use Code "𝐘𝐎𝐔𝐓𝐔𝐁𝐄𝟐𝟎"): https://www.edureka.co/masters-program/machine-learning-engineer-training
This Edureka Machine Learning Full Course video will help you understand and learn Machine Learning Algorithms in detail. This Machine Learning Tutorial is ideal for both beginners as well as professionals...
echo mesa
nimble acorn
this is my vscode jupyter plugin learning environ. baby steps
Nice, btw are you in uni?
echo mesa
nimble acorn
yes. DIY uni 🙂
DIY?
nimble acorn
do it yourself. I do not like educational system.
meaning uni, college etc/ not my style
echo mesa
I know but what does DIY stand for?
echo mesa
Ohh I thought you were talking about some uni 😄
Why are you against unis btw? I think they are a really good opportunity to learn and to meet with new people.
mild dirge
Really depends on the uni and professors
But having a diploma helps a lot with finding a job
echo mesa
Yeah as you said it depends on your goal and mindset, although it's really hard to get into good unis, for example in the UK there are many good unis but as a foreigner it's really hard to get into even the country and the uni as well.
mild dirge
I would see a uni more as a guideline of what things you have to learn for each course, and a good way to meet some people and get a diploma. But most of the content isn't too special. Our profs just give a bunch of powerpoints.
The most useful part of it for me was the research projects, because you get to work by yourself, but that really depends on what type of person you are probably.
echo mesa
Yeah, also even though I have no idea about what it's like to be in a uni, but I assume if you socialise with people who are having similar mindset as yours, it's a good opportunity to make really good and close friends, and even start a new company or smth. 🙂
mild dirge
Yeah, if you're social 😛
echo mesa
mild dirge
Yeah, if you're social 😛
🙂
mild dirge
But technical studies tend to attract the less social crowd, so that is something to keep in mind
echo mesa
mild dirge
But technical studies tend to attract the less social crowd, so that is somethin...
yeah I was gonna say that most of the programmers if as you said technical fields are attracting less social people
 queen elk
Hello
 cunning agate
Hey guys what are the advanced methods to replace missing values in categorical features
serene scaffold
cunning agate
Hey guys what are the advanced methods to replace missing values in categorical ...
Mode imputation, I guess?
 hallow light
Hi guys I'm new to machine learning. How long did it take you to build your first machine learning model?
serene scaffold
hallow light
Hi guys I'm new to machine learning. How long did it take you to build your firs...
"how long it takes to build your first model" is a bad metric. Because depending on what tools you use and the complexity of the model, it could take minutes. Or years.
hallow light
serene scaffold
"how long it takes to build your first model" is a bad metric. Because depending...
Thanks, I'm trying to build a model that will catch abnormalities on meter values like overrange numbers. What would be the best algorithm for this?
serene scaffold
hallow light
Thanks, I'm trying to build a model that will catch abnormalities on meter value...
What kind of meter values?
hallow light
Gas meters
serene scaffold
What do the meters measure
hallow light
They measure the flow rate. Every day we get daily volumes. But some meters go bad and start reading erratic numbers and we get erratic daily volumes. that is the stuff im trying to catch. if that makes sense
Basically we get reading every 15 minutes
 abstract wasp
Hello there, for those who have a job as an ML/AI engineer, how does your day at work look like? Which tools do you guys use (Tensorflow, PyTorch, etc.), is a lot of math involved or is it more of Python and programming… basically, what type of skills do you rely on on a daily basis?
 quick mason
Kinda just tangentially related, but Anyone know why this doesn't work https://github.com/CBeast25/Applio-RVC-Fork/blob/main/lib/infer/modules/train/train.py I get the error from lib.infer.infer_libs.train import utils ModuleNotFoundError: No module named 'lib.infer' but not with the train_old

GitHub
Contribute to CBeast25/Applio-RVC-Fork development by creating an account on GitHub.
 keen narwhal
Hello. Could anybody share a few resources for ML? I'm currently following the playlist by Sentdex but I can't say I'm understanding all of it
 obsidian sand
Hello, does anyone have ideas/suggestions on how to make use of free local LLM (preferably without API key) to interact/query with dataframes?
 lapis sequoia
I am feeling very demotivated
 odd meteor
lapis sequoia
I am feeling very demotivated
odd meteor
lapis sequoia
I am feeling very demotivated
If you don't mind, why do you feel "very" demotivated?
lapis sequoia
Because majority of the work surrounds languages and vision task
And i am mostly interested in cognitive tasks
odd meteor
lapis sequoia
Does ml looks cool from the outside
Help me understand better. What do you mean by "from outside"
lapis sequoia
odd meteor
Help me understand better. What do you mean by "from outside"
It looks cool that we are making machines think
 vernal ocean
Could I have someone looks at my aggregating function? I am trying to aggergate my data into 1 minute intervals from a main dataframe but my code isn't working like that. Help please?
odd meteor
lapis sequoia
Because majority of the work surrounds languages and vision task
Vision and Language seem to be the niches with more attention at the moment. However, people are also doing some cool stuff in other niche like Information Retrieval, Computational Neuroscience, Vision-Language (sign language related), Classical ML algorithms, Ethics, Conformal Prediction, Reinforcement Learning, AI on Edge ( using Raspberry PI, Arduino etc)
I think it boils down to what really interests you. Just pick one niche (or maybe a couple more) and find your clan.
Usually, the best place to know who's working on what is by attending AI conferences.
odd meteor
lapis sequoia
And i am mostly interested in cognitive tasks
Don't you think you can still do cognitive tasks with Vision and Language?
lapis sequoia
I think I am putting too much pressure on myself
lapis sequoia
odd meteor
Don't you think you can still do cognitive tasks with Vision and Language?
Wdym
odd meteor
lapis sequoia
I think I am putting too much pressure on myself
There's always something new in this field. It can be overwhelming if you try to pursue all of them.
So it's ideal to figure out that niche you're most attracted to and focus a bit more on that particular niche than the rest.
In summary, don't rush yourself. Allow yourself to grow at your own pace. You can also try to join some active AI communities.
lapis sequoia
Yeah there are so many information and so many papers
lapis sequoia
I feel like quitting
serene scaffold
lapis sequoia
I feel like quitting
I would first ask yourself what your goal is for learning about AI. That will determine how you plan your learning.
If you're feeling overwhelmed, you should probably follow a book or course for beginners, so that you can just focus on learning what the teacher has decided is important for your stage.
serene scaffold
lapis sequoia
Yeah there are so many information and so many papers
you shouldn't be trying to read academic papers as a a beginner. academic papers are about very specific contributions to AI knowledge, and they assume that you know a lot. They're intended to be read by experienced professionals.
lapis sequoia
serene scaffold
I would first ask yourself what your goal is for learning about AI. That will de...
I want to solve some unsolved problems
serene scaffold
lapis sequoia
I want to solve some unsolved problems
well, that will take at least several years, depending on what you consider an unsolved problem to be. so there's no reason to feel like you have to understand it all right now.
lapis sequoia
serene scaffold
well, that will take at least several years, depending on what you consider an u...
Unsolved problems like explainability,or self organizing nn, program synthesis, neuro symbolic ai
serene scaffold
lapis sequoia
Unsolved problems like explainability,or self organizing nn, program synthesis, ...
well, you'll need a phd for that.
left tartan
** to get paid to do that
odd meteor
lapis sequoia
Unsolved problems like explainability,or self organizing nn, program synthesis, ...
I'm rooting for you 💪💪
odd meteor
lapis sequoia
Unsolved problems like explainability,or self organizing nn, program synthesis, ...
You might wanna consider what Pope Stelercus suggested.
Most research labs and companies are recruiting at the moment (if graduate / residency program is your thing).
 long canopy
linking natural language or prompts to specific scripts and commands, does this have a name? anyone have references about the subject?
left tartan
long canopy
linking natural language or prompts to specific scripts and commands, does this ...
What do you mean? Like linking the results of a LLM to execute, say, some Python code?
long canopy
left tartan
What do you mean? Like linking the results of a LLM to execute, say, some Python...
yeah! "get me last year's logs tagged with anything that could be relevant to the SQL language", and this runs a particular script that checks last year's logs for SQL terms
I already have the script, so it sets the time range, and it creates a list with sql terms it inputs to the script
 agile cobalt
retrieval / Embeddings with retrieval is a thing, but what you're describing sounds more similar to something like Tools
https://www.pinecone.io/learn/series/langchain/langchain-tools/
https://python.langchain.com/docs/modules/agents/tools/
long canopy
agile cobalt
`retrieval` / `Embeddings with retrieval` is a thing, but what you're describing...
very cool stuff! thanks for the references, I'll start digging into this
desert oar
lapis sequoia
I want to solve some unsolved problems
this is great, but i agree that you'll probably want to go the doctorate/research track
it's a long process. as you've seen, there is a huge amount of things to learn. that's why doctorate degrees require strong undergraduate study and take several years to complete, you are in a long and intensive training process to become an effective researcher.
scenic shore
@nimble acorn did you end up getting it?
cunning agate
serene scaffold
Mode imputation, I guess?
mode imputation isn't an advanced method
agile cobalt
if by "advanced" you mean "unnecessarily over-complicated", I'd recommend against using advanced methods in places where normal/basic methods work just as well if not better
desert oar
i'll be generous and interpret "advanced" as "allows me to use my domain knowledge and/or associations in the dataset to produce better models"
do people do things like replace one-hot encoding with numbers in (0,1) reflecting the distribution of categories in the test data?
i've never actually done that before, but it seems like it could work
cunning agate
clear thanks guys
 west cloak
I have a question. I want to use Pearson correlation on a dataset to measure how discrimantive the features are. Does high, close to P = 1 indicate that they are discriminative or not
 hollow sentinel
i have a strange question
well it may not be that strange
if i wanted to show what features were the most important for my logistic regression classification model, how would i do that?
nvm i may have found something
 night peak
Hey, I was wondering if it is possible to generate a realtime heatmap using matplotlib that would refresh like every .5s?
 primal egret
agile cobalt
if by "advanced" you mean "unnecessarily over-complicated", I'd recommend agains...
primal egret
agile cobalt
if by "advanced" you mean "unnecessarily over-complicated", I'd recommend agains...
finding the simple solutions is more efficient and in some cases requires better problem solving, however humans setting aside their ego is a feat in itself
desert oar
west cloak
I have a question. I want to use Pearson correlation on a dataset to measure how...
can you clarify? correlation between features and labels? yes, a high correlation can mean that the feature is discriminative, but low correlation does not mean that the feature is not discriminative. it's very important to keep that in mind.
west cloak
desert oar
can you clarify? correlation between features and labels? yes, a high correlatio...
Thank you! Found it out on my own!
desert oar
hollow sentinel
if i wanted to show what features were the most important for my logistic regres...
just use the coefficients, they are interpretable as feature importance
although you can also use "partial dependence" plots for a more comprehensive view
scikit-learn
Partial dependence plots (PDP) and individual conditional expectation (ICE) plots can be used to visualize and analyze interaction between the target response 1 and a set of input features of inter...
 lavish lily
Running into some tensor creation issues when fine tuning a BERT Causal Language Model. Could someone help me out?
shut girder
I'm trying to deal with missing values in a column called Age, which is a column containing floats. There are currently 332 out of 417 values of this column that are missing values. This column is relevant to my analysis question so how should I deal with this?
agile cobalt
80% of the values are missing? no way in hell you can use that column as is or drop & call it a day
find out why they're missing and figure out a way to get what the right values
shut girder
Wait I apologize, I messed something up in my code. There's actually 86 missing values out of 417.
desert oar
shut girder
I'm trying to deal with missing values in a column called Age, which is a column...
titanic?
shut girder
Yeah
desert oar
shut girder
I'm trying to deal with missing values in a column called Age, which is a column...
the easiest thing to do is use mean or median imputation that's usually the best place to start, being the simplest option
there is a huge world of missing data imputation techniques
if you look up the history of the titanic, you'll note that age should be very important for determining survival. so it's worth spending a bit of time thinking about this one
more advanced techniques for missing data imputation involve looking at other features that might be related to age, to get a better estimate of age than mean/median by itself
that titanic dataset is a great sandbox to explore feature engineering
shut girder
I see, thanks
For now, I will go with mean or median imputation since I am still a beginner to data analysis
serene scaffold
one of my first data science assignments was, for each observation, impute its missing values with the values for the missing features of whichever other observation had the closest manhattan distance
lavish lily
is it possible if i could dm it to you?
 vestal spruce
I'm using torchaudio.transform.MFCC and got this warning
UserWarning: At least one mel filterbank has all zero values. The value for `n_mels` (128) may be set too high. Or, the value for `n_freqs` (201) may be set too low.
  warnings.warn(
Is it safe? can I ignore it?
 quaint skiff
Hi, i was working on a problem statement
Below is the reference data for 2-D z array across x and y dimensions. x & y arrays are also specified below:
xfull = ([0.00165436, 0.258037, 0.514419, 1.02718, 2.05269])
yfull = ([0.00165436, 0.129715, 0.257776, 0.513897, 1.02614])
zfull = ([290.986, 235.159, 161.953, 57.2267, -129.112, 476.509, 421.684, 347.95 5, 242.752, 56.4111, 635.619, 580.07, 506.923, 401.137, 215.311, 912.235, 856.411, 783.6 81, 677.478, 494.136, 1397.13, 1341.3, 1270.21, 1161.37, 977.032])
Objective is to explore curve fitting mechanism to predict values of Z if the mid and corner points of the matrix are available , above is some sample data, can someone suggest how to proceed to get the correct predictions for Z
hollow sentinel
desert oar
just use the coefficients, they are interpretable as feature importance
word thank you
 spark compass
Did anybody get to use alpha tensor by any chance?
 proud briar
 rapid cedar
tensor or pytorch?
rapid cedar
tensor or pytorch?
both are good
pytorch is more pythonic in the sense as compared to tensorflow
but its a matter of personal preference
i use pytorch mostly but i have also used tesorflow both are amazing
 pine void
Can somebody help me with a jupyter issue? I have normal charts on my file, and when uploaded to github, I can still see them. But, where there are supposed to be maps, it is just blank. It works fine on the actual jupyter. Does anyone know how to fix?


nothing shows up
 serene scaffold
pine void
Can somebody help me with a jupyter issue? I have normal charts on my file, and ...
serene scaffold
pine void
Can somebody help me with a jupyter issue? I have normal charts on my file, and ...
well it looks like you wrote lable instead of label, with le at the end instead of el
pine void
I know
serene scaffold
(which is a mistake that I make a lot, actually)
pine void
It was just a mistype
That’s not the point lol
I needed to throw in a bug because otherwise the professor would think I cheated
 tidal bough
it kind of seems like it may be the problem, actually, since if you ran the entire notebook the cells past that one won't get evaluated.
pine void
Nah cuz graphs after that are still printing
serene scaffold
it's unusual to show an error message that you don't need help with.
Anyway, we would probably need to reproduce the problem to be able to help. So you'd need to give the full code and a sample of the data in a way that is fully copy-pastable (no screenshots)
serene scaffold
!paste
arctic wedgeBOT
Pasting large amounts of code
If your code is too long to fit in a codeblock in Discord, you can paste your code here:
https://paste.pythondiscord.com/
After pasting your code, save it by clicking the Paste! button in the bottom left, or by pressing CTRL + S. After doing that, you will be navigated to the new paste's page. Copy the URL and post it here so others can see it.
pine void
I will try fixing the type and if that doesn’t work I’ll send it here
hollow sentinel
anyone have any ideas of taking a screenshot of a dataset without making it like really zoomed out and all the columns being very hard to see?
there's a lot of columns in the dataset
tidal bough
Sounds like a strange thing to do, but my mind goes to "render the dataset to HTML, open it in a headless browser via e.g. selenium with a big-enough screen size, and have it take a screenshot"
arctic wedgeBOT
Pasting large amounts of code
If your code is too long to fit in a codeblock in Discord, you can paste your code here:
https://paste.pythondiscord.com/
After pasting your code, save it by clicking the Paste! button in the bottom left, or by pressing CTRL + S. After doing that, you will be navigated to the new paste's page. Copy the URL and post it here so others can see it.
pine void
i know it is a github issue because i can see graphs in vscode
serene scaffold
pine void
i know it is a github issue because i can see graphs in vscode
a github issue?
pine void
Yeah
serene scaffold
github will only display the output of a cell if it was run when you commited the ipynb file
pine void
What does comited mean
serene scaffold
have you used git before?
let me reframe the question: how did the notebook end up on github?
pine void
Oh yeah you press that green button that says commit
serene scaffold
how did the notebook end up on github?
pine void
I downloaded it and then dropped in the file
serene scaffold
alright
so when you run a notebook, everything that you see (the code and the output) can be saved, and then it's part of the notebook file. the notebook file extension is ipynb
but you have to run a cell for its output to be displayed in the notebook. and then you have to save the notebook for the displayed output to be part of the ipynb file
(some notebook editors might autosave)
you can also clear the output
so if the notebook as it appears on github, which is just a static view of the notebook, doesn't have a certain cell's output, either that cell was never run, or its output was cleared
make sense, @pine void?
left tartan
hollow sentinel
anyone have any ideas of taking a screenshot of a dataset without making it like...
Or export to excel / google sheets and format it there?
pine void
serene scaffold
make sense, <@458352714531995659>?
yes
i tried rynning all and then saving and after i put it into github it said invalid notebook
serene scaffold
pine void
i tried rynning all and then saving and after i put it into github it said inval...
please show the whole error message
 serene scaffold
(this goes for any time you need help with anything connected to an error message)
ipynb files are structured as JSONs. Can you open the notebook file in a basic text editor, to confirm that it looks like a JSON?
pine void
what do you mean by that
serene scaffold
(don't open it with a notebook-specific editor, as that will open it as a notebook)
serene scaffold
sure
JSONs are structured data files that look like this
{"widget": {
    "debug": "on",
    "window": {
        "title": "Sample Konfabulator Widget",
        "name": "main_window",
        "width": 500,
        "height": 500
    },
    "image": {
        "src": "Images/Sun.png",
        "name": "sun1",
        "hOffset": 250,
        "vOffset": 250,
        "alignment": "center"
    },
    "text": {
        "data": "Click Here",
        "size": 36,
        "style": "bold",
        "name": "text1",
        "hOffset": 250,
        "vOffset": 100,
        "alignment": "center",
        "onMouseUp": "sun1.opacity = (sun1.opacity / 100) * 90;"
    }
}}
 serene scaffold
try clicking "open in text editor"
remember not to post screenshots of text--copy and paste the actual text
 serene scaffold
looks like you saved the notebook to some unexpected format
serene scaffold
what action did you perform to save the notebook?
pine void
file -> download
serene scaffold
what is the name of the file that you downloaded? include the extension
pine void
my_file_name(7).ibpyn
serene scaffold
ibpyn?
serene scaffold
are you absolutely sure that the extension is .ibpyn?
pine void
yes
serene scaffold
and you're certain that it's not ipynb?
 serene scaffold
can you put the URL for the notebook in this chat?
pine void
uh i kinda didnt wanna leak my name
serene scaffold
I don't know how you could have downloaded an ipynb file that isn't a valid notebook, so without the github URL, I do not know how to continue
pine void
let my try to download again
lavish lily
Running into some tensor creation issues when fine tuning a BERT Causal Language Model. Could someone help me out?
serene scaffold
lavish lily
Running into some tensor creation issues when fine tuning a BERT Causal Language...
be sure to always start with a complete question that someone can start answering from the information you have provided.
pine void
which should i do?
 serene scaffold
pine void
which should i do?
serene scaffold
pine void
which should i do?
try "save and export notebook as", and tell me what the options are.
pine void
 pine void
uh i just put it in and now its gone
pine void
you see it?
serene scaffold
@pine void the file you sent me is correctly structured as a JSON.
serene scaffold
does it have all the data visualizations that you want it to have?
pine void
leet ,me se
lavish lily
local_csv = load_dataset('csv', split='train', data_files='allCalcData.csv')
local_csv = local_csv.train_test_split(test_size=0.1)
filtered_dataset = local_csv.shuffle(seed=42)

tokenizer = AutoTokenizer.from_pretrained("tiiuae/falcon-7b-instruct")
tokenizer.padding = True
tokenizer.truncation = True
model = AutoModelForCausalLM.from_pretrained("tiiuae/falcon-7b-instruct")

model.to_bettertransformer()
def preprocess_function(examples):
    return tokenizer([" ".join(x) for x in examples["quesiton"]], truncation=True, return_tensors="pt")
block_size = 128


def group_texts(examples):
    concatenated_examples = {k: sum(examples[k], []) for k in examples.keys()}
    total_length = len(concatenated_examples[list(examples.keys())[0]])
    if total_length >= block_size:
        total_length = (total_length // block_size) * block_size
    result = {
        k: [t[i : i + block_size] for i in range(0, total_length, block_size)]
        for k, t in concatenated_examples.items()
    }
    result["labels"] = result["input_ids"].copy()
    return result

tokenized_datasets = filtered_dataset.map(preprocess_function, batched=True, num_proc=4, remove_columns=filtered_dataset["train"].column_names,
)

lm_dataset = tokenized_datasets.map(group_texts, batched=True, num_proc=4)

tokenizer.pad_token = tokenizer.eos_token
tokenizer.add_special_tokens({'pad_token': '[PAD]'})
data_collator = DataCollatorForLanguageModeling(tokenizer=tokenizer, mlm=False, return_tensors="pt")

training_args = TrainingArguments(
    output_dir="/Model",
    evaluation_strategy="epoch",
    learning_rate=2e-5,
    weight_decay=0.01,
    num_train_epochs=4,
)

trainer = Trainer(
    model=model,
    args=training_args,
    data_collator=data_collator,
    train_dataset=lm_dataset["train"],
    eval_dataset=lm_dataset["test"],
)

trainer.train()

trainer.save_model()
I'm running into an error when finetuning a tiiuae/falcon-7b-instruct BERT model.
Error:
ValueError: Unable to create tensor, you should probably activate truncation and/or padding with 'padding=True' 'truncation=True' to have batched tensors with the same length. Perhaps your features (input_ids in this case) have excessive nesting (inputs type list where type int is expected).
pine void
serene scaffold
does it have all the data visualizations that you want it to have?
nope, maps arent coming through
hollow sentinel
left tartan
Or export to excel / google sheets and format it there?
yeah that’s a thought
serene scaffold
pine void
nope, maps arent coming through
do they appear in the editor you were using to write and run the notebook?
serene scaffold
lavish lily
```py
local_csv = load_dataset('csv', split='train', data_files='allCalcData.cs...
!traceback
arctic wedgeBOT
Traceback
Please provide the full traceback for your exception in order to help us identify your issue.
While the last line of the error message tells us what kind of error you got,
the full traceback will tell us which line, and other critical information to solve your problem.
Please avoid screenshots so we can copy and paste parts of the message.
A full traceback could look like:
Traceback (most recent call last):
  File "my_file.py", line 5, in <module>
    add_three("6")
  File "my_file.py", line 2, in add_three
    a = num + 3
        ~~~~^~~
TypeError: can only concatenate str (not "int") to str
If the traceback is long, use our pastebin.
pine void
serene scaffold
do they appear in the editor you were using to write and run the notebook?
yup
serene scaffold
pine void
yup
what library did you use to create the data visualizations that do not appear?
pine void
even without hitting run
\

import pandas as pd
import plotly.graph_objects as go
import plotly.express as px
serene scaffold
pine void
\
did you re-save the notebook before downloading it and dragging it to the github upload?
pine void
no.
serene scaffold
then that's probably why.
pine void
which save do i use?
serene scaffold
control + s
pine void
in vscode or jup
serene scaffold
whatever you're using to edit the notebook
pine void
jupiter
serene scaffold
are you viewing the same notebook in both jupyter and vscode at the same time?
pine void

no just jupiter but i open in vscode to check and the maps are there
there are other ways to save it
serene scaffold
you're editing the file in jupyter, and then you open it in VS code?
pine void
yeah but i dont do anything in vscode
serene scaffold
it might still be messing with the file
pine void
so download again and save and dont open with vscode?
serene scaffold
close the file in VS code, and then confirm that everything is correct in jupyter only
save the file in jupyter with control + s. it should say "last saved" at the top, or something along those lines
pine void
ok i just removed the folder from vs and closed it
now i will dwonload again, control s, and put into github
good?
serene scaffold
if everything looks the way you want it to in jupyter when you save it, and then you upload the file that you just saved to github, then you should be good
serene scaffold
sure, that sounds fine
pine void
or save-download-save-github
serene scaffold
save-download-github
 lavish lily
serene scaffold
!traceback
lavish lily
serene scaffold
!traceback
Traceback (most recent call last):
  File "test2.py", line 36, in <module>
    tokenized_datasets = filtered_dataset.map(preprocess_function, batched=True, num_proc=4, remove_columns=filtered_dataset["train"].column_names,
  File "/Library/Python/3.9/lib/python/site-packages/datasets/dataset_dict.py", line 853, in map
    {
  File "/Library/Python/3.9/lib/python/site-packages/datasets/dataset_dict.py", line 854, in <dictcomp>
    k: dataset.map(
  File "/Library/Python/3.9/lib/python/site-packages/datasets/arrow_dataset.py", line 592, in wrapper
    out: Union["Dataset", "DatasetDict"] = func(self, *args, **kwargs)
  File "Library/Python/3.9/lib/python/site-packages/datasets/arrow_dataset.py", line 557, in wrapper
    out: Union["Dataset", "DatasetDict"] = func(self, *args, **kwargs)
  File "Library/Python/3.9/lib/python/site-packages/datasets/arrow_dataset.py", line 3189, in map
    for rank, done, content in iflatmap_unordered(
  File "/Python/3.9/lib/python/site-packages/datasets/utils/py_utils.py", line 1394, in iflatmap_unordered
    [async_result.get(timeout=0.05) for async_result in async_results]
  File "Library/Python/3.9/lib/python/site-packages/datasets/utils/py_utils.py", line 1394, in <listcomp>
    [async_result.get(timeout=0.05) for async_result in async_results]
  File "/Library/Python/3.9/lib/python/site-packages/multiprocess/pool.py", line 771, in get
    raise self._value
ValueError: Unable to create tensor, you should probably activate truncation and/or padding with 'padding=True' 'truncation=True' to have batched tensors with the same length. Perhaps your features (`input_ids` in this case) have excessive nesting (inputs type `list` where type `int` is expected).
 serene scaffold
lavish lily
```py
Traceback (most recent call last):
File "test2.py", line 36, in <module>...
serene scaffold
lavish lily
```py
Traceback (most recent call last):
File "test2.py", line 36, in <module>...
try adding padding=True to filtered_dataset.map
lavish lily
alright, let me give that a try
 lean sparrow
Oi, any opinions on datacamp?
serene scaffold
lean sparrow
Oi, any opinions on datacamp?
for what?
lean sparrow
Tryina gtfo out security, generally as a resource to get into data/ML/wtf ever is not security
past meteor
I got datacamp free when I was in uni. I spent tons of hours on it. It's good as a supplement for a university course but it's not that great on its own. It's very "shallow"
serene scaffold
pine void
ok im back into the notebok
if everything looks right (all the data visualizations you want are there), try downloading the notebook again and uploading it to github.
pine void
when do i save
serene scaffold
pine void
when do i save
in this particular case, downloading is saving.
hollow sentinel
dumb question, but if i dropped a key from my dataframe how do i get it back? i run the old cells and the dataframe isn't reset
pine void
kk so download and github
lean sparrow
past meteor
I got datacamp free when I was in uni. I spent tons of hours on it. It's good as...
How should I dive deeper afterwards? Not going back to school this late in my career
serene scaffold
hollow sentinel
dumb question, but if i dropped a key from my dataframe how do i get it back? i ...
unless you have that data somewhere else in the program, you don't.
hollow sentinel
serene scaffold
unless you have that data somewhere else in the program, you don't.
omg
pine void
same shit maps arent there
past meteor
lean sparrow
How should I dive deeper afterwards? Not going back to school this late in my ca...
It's hard to make concrete recommendations because there's different levels of depth you can go into in data.
lean sparrow
past meteor
It's hard to make concrete recommendations because there's different levels of d...
For sure, I’ll take less than concrete.
serene scaffold
hollow sentinel
you're telling me i have to do this all again?
well, yes. this is like asking "if I delete a key-value pair from a dictionary, and the value didn't have any other references to it, how do I get it back?".
pine void
what now?
lavish lily
serene scaffold
try adding `padding=True` to `filtered_dataset.map`
i'm getting TypeError: map() got an unexpected keyword argument 'padding'
hollow sentinel
i'm gonna cry
serene scaffold
pine void
same shit maps arent there
my guess is that github just doesn't render them
pine void
so am i fucked?
hollow sentinel
i am so fucked
serene scaffold
pine void
so am i fucked?
can you download the ipynb file from github?
pine void
sure
past meteor
lean sparrow
For sure, I’ll take less than concrete.
In general I'd say books are your friend.
If I'm ever recommending someone coming from a different career that's pivoting into data I'd always say start with a book on statistics and data analysis that is relatively practice focused to see what you like and don't like. Afterwards depending on your interests I'd say circle back to math and then go for a book covering ML or go deeper down the analysis/practical stats route.
serene scaffold
pine void
sure
once you've downloaded the ipynb file from github, try opening it in jupyter, to see if the data visualizations are there when you look at it in jupyter
pine void
kk
hollow sentinel
i broke all my code
lean sparrow
past meteor
In general I'd say books are your friend.
If I'm ever recommending someone com...
Sweet, thanks
past meteor
lean sparrow
For sure, I’ll take less than concrete.
If you had any amount of statistics in the past but need a comprehensive refresher this is a good place to start: https://www.oreilly.com/library/view/practical-statistics-for/9781492072935/
pine void
serene scaffold
once you've downloaded the ipynb file from github, try opening it in jupyter, to...
yes whhat i want is still there when re opened in jupyter
lean sparrow
past meteor
If you had any amount of statistics in the past but need a comprehensive refresh...
Helpful, ty
serene scaffold
pine void
yes whhat i want is still there when re opened in jupyter
then github just isn't rendering them. I guess let your instructor know.
past meteor
If you had little to no stats in uni you'll probably not be served with that one and you'll never to start with a different textbook though 🙂
lavish lily
serene scaffold
try adding `padding=True` to `filtered_dataset.map`
i think my data is already padded
 azure wadi
Hi everyone, just a question: did you manage to monetize your python knowledge in data science/data engineer?
Just to open a discussion about It, i'm really curious
past meteor
azure wadi
Hi everyone, just a question: did you manage to monetize your python knowledge i...
Yes, by getting a job
azure wadi
past meteor
Yes, by getting a job
Yeah, excluded that way
left tartan
? You’re asking how to make money in data science, besides getting a job?
Have I been doing it wrong all this time?
azure wadi
Yes, for example I know that people sell apis based on ml algorithms
 slim ravine
azure wadi
Hi everyone, just a question: did you manage to monetize your python knowledge i...
slim ravine
azure wadi
Hi everyone, just a question: did you manage to monetize your python knowledge i...
I mean, you could just do some competitions on Kaggle?
And possibly win money…
left tartan
azure wadi
Yes, for example I know that people sell apis based on ml algorithms
I question how much money this actually brings in.
And who would actually buy such ‘algorithms’
azure wadi
Dunnò I read that could be a way, not how much money you can make
 stoic gull
Is there anyone good at PyTorch library?
serene scaffold
stoic gull
Is there anyone good at PyTorch library?
why do you want to know if someone is good at pytorch? if you have a question about pytorch, just ask that, and people who know how to answer will see that it's about pytorch.
 viscid wedge
is there a way I can inspect into how pytorch is doing the broadcasting for learning? it would be great if I could have a way to have pytorch tell me like, 'i broadcasted this dimension to this' third party would be fine too
tidal bough
viscid wedge
is there a way I can inspect into how pytorch is doing the broadcasting for lear...
I'd expect pytorch's broadcasting rules to be the same as numpy's: https://numpy.org/doc/stable/user/basics.broadcasting.html#basics-broadcasting.
If you need examples, you could use numpy's broadcast_shapes.
viscid wedge
oh sick thank you
cunning agate
hello,i've a question in my dataset i have cat features like RestaurantLessThan20 and Restaurant20To50 their values are like 4~8 1~3
i want to convert them into something numerical wht can i do
 random fox
Is there a better alternative to using matplotlib.animation because it is really slow for active animations.
Please ping me for any responses.
tidal bough
random fox
Please ping me for any responses.
If you want realtime plotting, dearpygui or pyqtgraph can do it
 dusty valve
!pypi dearpygui
arctic wedgeBOT

DearPyGui: A simple Python GUI Toolkit
rapid cedar
proud briar
i use pytorch mostly but i have also used tesorflow both are amazing
ok thanks
why jupiter?
whats the diff between jupiter and pycharm?
proud briar
rapid cedar
whats the diff between jupiter and pycharm?
Jupyter is an interactive environment for data analysis and visualization. PyCharm is a full-fledged Python IDE for software development.
they both have different use cases
you can even use VS Code
odd meteor
rapid cedar
tensor or pytorch?
I started with Tensorflow but I've switched to PyTorch now. They're both good . So, start with anyone that appears more 'customer-friendly' to you.
There's this joy that comes with using PyTorch though 😀 I can't explain it. It makes you understand the rationale behind some things even better. But hey, that's just my personal take.
I believe the end goal here should be, becoming framework agnostic. Knowing at least 2 DL frameworks has its own advantage. However, if you're just getting started, just pick one already and keep making progress. You'll be fine at the end of the day.
tidal bough
Recently-ish TF dropped support for Windows, so that might be a deciding factor for some people.
echo mesa
Hello guys, I would have a question related to a house prediction model example, I'm looking at liner regression and the training process of it. I'm following up with a course from Andrew ng, in the course when he explains linear regression we are provided with this diagram. What I have confusion about is the learning algorithm, he says that we feed the training-set into the learning algorithm which will produce a function. "To train the model, you feed the training set, both the input features and the output targets to your learning algorithm. Then your supervised learning algorithm will produce some function. " What I have confusion with is understanding what the learning algorithm is, what would be an example? How does it output a function? How does it work?
 odd meteor
pine void
yes whhat i want is still there when re opened in jupyter
odd meteor
pine void
yes whhat i want is still there when re opened in jupyter
I think it's just plotly being plotly. Plotly plots tend to refuse rendering when it's exported outside of the original place where the code that produced the plot was created. try using both offline and online mode of plotly and see if anyone of them could fix this issue.
You might have noticed this as well when you use plotly in your JNB and you''ve closed the notebook after use. If you open that same JNB a couple of days later, most of the plots made with plotly would have vanished.
past meteor
I started with TF as well. I'd say Keras is good for folks that don't really want to get into the weeds because it offers higher abstractions than Torch. If you're in it for the long game then PyTorch is the better option imho 👍
odd meteor
tidal bough
Recently-ish TF dropped support for Windows, so that might be a deciding factor ...
Yeah this as well could be another reason. I read the news on twitter some months back.
past meteor
echo mesa
Hello guys, I would have a question related to a house prediction model example,...
High level explanation is that linear regression is an algorithm that attaches a "weight" to each variable. It decides how much each variable contributes in a positive and a negative sense, which means that weights can be negative and positive.
The objective of linear regression is selecting a model that in jargon terms, "maximizes the likelihood". In human terms, it's selecting weights, for each variable, that makes "y-hat" as close to y as possible for your training set. Essentially, maximizing the likelihood (the chance) you have your output given your data with a set of weights.
Maths/stats people have found closed form equations to produce weights that maximize the likelihood for linear regression (see: ordinary least squares) centuries ago. Another way you can do this is by an iterative procedure where you 1) make a prediction 2) observe the error 3) calculate what you need to do to improve (the gradient) 4) use this gradient information to improve the weights 5) go back to 1, quit after a fixed amount of iterations
This is a very handwavy explanation but if you want you can pick specific parts where you want me, or anyone else, to go in more formal detail @echo mesa
echo mesa
past meteor
High level explanation is that linear regression is an algorithm that attaches a...
I see, it's much clearer. I suppose the reason why it's not being explained in the course is because it's for beginners, so what I would plan to do is finish with this course and then build a house prediction model from scratch and I would go thru every single process from the training to preparing and analysing the data to the process of modelling and write down to a latex paper that how everything works both theoretically and mathematically, I think that going thru the details in an early stage wouldn't be beneficial until I have an overview of machine learning which I have after I finish with the course. But I'm very interested and passionate about math and always wanted to find out how "actually" it's being used in this context- So I think I'll go thru this course and try to build something and actually being able to understand and describe every process mathematically.
tidal bough
echo mesa
Hello guys, I would have a question related to a house prediction model example,...
what the learning algorithm is, what would be an example? How does it output a function? How does it work?
A simple example would be linear regression on a single variable. The training set is a bunch of points (x_i,y_i), and the goal is to find a coefficientbsuch that the liney = b xfits the data as well as possible. (Typically linear regression would have a bias term+ a, but for simplicity I'm assuming we know the line must pass through (0,0) for some reason). To quantify "as well as possible", one needs to choose a loss function - for example, mean squared error.
Linear regression with MSE loss is in fact exactly solvable. Indeed, our loss is written:
L = 1/N sum_i (y_i - b x_i)^2
and to find the minimum of the loss, we can take the derivative of it with regards to b and set it to zero:
∂L/∂b = -2/N sum_i x_i(y_i - b x_i) = 2/N [b (sum_i x_i^2) - (sum_i x_i y_i)] = 0
From which we get:
b = (sum_i x_i y_i)/(sum_i x_i^2)
It's also possible to exactly solve linear regression with MSE loss for any number of variables (the solution is written θ = (X^T X)^(-1) X^T Y, where X is the matrix of inputs and Y is the matrix of outputs). But this exact solution is actually somewhat hard to calculate for large number of variables and samples - it turns out it's faster in such cases to use a non-exact, iterative method like gradient descent. So that's one explanation of why such methods are useful. (The other is, of course, that not all problems reduce to linear regression and for most problems you can't exactly calculate the optimal solution, but can gradient-descent your way to an acceptable one).
the reason why it's not being explained in the course is because it's for beginners
Huh, you're saying the Ng course on coursera doesn't cover this? That's surprising to me, it used to.
echo mesa
tidal bough
> the reason why it's not being explained in the course is because it's for begi...
It might cover it later though, idk. I'm just watching the linear regression part 2, so It might go into details later on the course
past meteor
echo mesa
I see, it's much clearer. I suppose the reason why it's not being explained in t...
Let me give you a few pieces of "meta" advice:
-
Get comfortable with not understanding concepts immediately. More than half the time I don't get stuff, I ponder about them and it comes later, I never get it the first run. This applies to concepts in code and also math, ML, stats. The people I see struggling long term are people that aren't comfortable with understanding something halfway (or even less) and get frustrated.
-
Make sure you're always learning one thing at a time and not 2+. With this I mean that ML is a combination of multiple fields: maths, stats, programming, ... If you're a beginner at all at the same time it'll be harder than it should be. Isolate each of them and "attack" them one by one. Starting with maths and going up until multivariable calculus, (basic) integrals and then a basis in linear algebra will make statistics easy. Knowing statistics will make ML easy. Then all you need to do is add programming. Doing them all at once is way harder. Typically university courses actually space out topics like this and that's one of the reasons uni students have more "success".
-
Keep asking us questions. As you can see we're more than welcome to help! It's the best way to check your understanding.
Point 2 is controversial but it's how I personally learn best. I start from the basics and build upwards, some people learn better by example. I think you should try this though 😄
echo mesa
tidal bough
> what the learning algorithm is, what would be an example? How does it output a...
Wow, thanks for this awesome explanation, I will save this as it is, the problem is with my math knowledge I'm not really experienced with derivatives, however I very appreciate your help it's unreal how helpful you guys are. 🙂
tidal bough
(I wonder if they removed all the math from the course when they reworked it to be in Python. Back when I took that course years ago, I recall it among other things deriving the θ = (X^T X)^(-1) X^T Y equation via multivariate calculus in one of the lectures. It's very sad if it no longer does.)
echo mesa
past meteor
Let me give you a few pieces of "meta" advice:
1) Get comfortable with not unde...
Gotcha, this is literally what I had problem with, "Get comfortable with not understanding concepts immediately." that's my main problem I always felt guilty when I'm ignoring the details now I know that it's completely fine and the way to go to understand them more deeply later. "Isolate each of them and "attack" them one by one." that's something that I did not know either.
" Keep asking us questions. As you can see we're more than welcome to help! It's the best way to check your understanding" Indeed, it's unreal how helpful, kind and patient you guys are, and it's a truly amazing community to be the part of, thanks for helping me and giving me these advices that I never would have find otherwise 🙂
echo mesa
past meteor
Point 2 is controversial but it's how I personally learn best. I start from the ...
Gotcha
past meteor
Sometimes I read books twice or three times.
The first go I'm totally OK not understanding any of the details
echo mesa
tidal bough
(I wonder if they removed all the math from the course when they reworked it to ...
There might be more math later, I'm very at the beginning of the course so later there might be more math.
past meteor
Then the second time I go faster but with all of the context I have from a full read it goes better. If it's a hard book I do a third pass.
There's people better at math than me that need to put in less work that's 100 % true but I think if you're not the strongest then this strategy can work. It does for me at least 😄
echo mesa
past meteor
Then the second time I go faster but with all of the context I have from a full ...
Got it, I'm reading pre-calculus from james stewart, it's very enjoyable and exciting to go thru, I'm planning on reading its next edition which is calculus, I'm also reading the book called "data science from scratch, first principles with python" which is very interesting and it will include linear algebra later as well. I guess I should concentrate on math more because if I would build up a good foundation for math then everything would become 100x easier.
past meteor
Yup, that's the best way to do it. If possible a standard textbook without code. If you want to challenge yourself you can implement the things with Python or so.
 unreal flicker
Has anyone worked with multilevel text classification
rapid cedar
odd meteor
I started with Tensorflow but I've switched to PyTorch now. They're both good . ...
can i use pycharm for it? and are you using jupiter or pycharm?
odd meteor
rapid cedar
can i use pycharm for it? and are you using jupiter or pycharm?
Yes. I use JupyterLab and VSCode
rapid cedar
odd meteor
Yes. I use JupyterLab and VSCode
which is better for machine learning?
is pycharm good for it?
rapid cedar
proud briar
they both have different use cases
for machine learning?
odd meteor
rapid cedar
is pycharm good for it?
Yes they are both good. It appears you have more affinity for PyCharm 😀
See these things as tools. Just like how a village farmer sees his hoe as a tool, that's how a large scale agro-allied company would see their tractor as well.
In both cases, the hoe and the tractor are ancillary in the sense that they are not the main focus of the farming activity, but they provide necessary support that significantly contributes to the success and efficiency of the primary agricultural work.
Going by popular convention, Jupyter Notebook / Jupyter Lab is more popular and way easier to use in procedural programming especially where much experimentation is required.
rapid cedar
odd meteor
Yes they are both good. It appears you have more affinity for PyCharm 😀
See t...
i want to use it but i see that jupyter will devide my code and make it unreadable
any opinions on that?
odd meteor
rapid cedar
i want to use it but i see that jupyter will devide my code and make it unreadab...
Well, that's one the selling points of JNB. When it comes to ML, you just have to experiment, experiment, and experiment! It's much better to do such kind of coding in Jupyter. Nonetheless, you can still convert your notebook to python script. So it's not a big deal if you ask me.
past meteor
I'd say that whichever IDE you pick first is the best one. There's no real point in debating what one you'll use 🙂
rapid cedar
odd meteor
Well, that's one the selling points of JNB. When it comes to ML, you just have t...
you can export it as py?
past meteor
I use vscode because I used it first. If I had used Pycharm first I'd have used Pycharm
odd meteor
rapid cedar
you can export it as py?
Yes
rapid cedar
past meteor
I use vscode because I used it first. If I had used Pycharm first I'd have used ...
oooh
past meteor
rapid cedar
any advice on where i should start?
Maybe with kaggle's courses
In the pinned messages there's also some other ideas
rapid cedar
ok thanks
odd meteor
rapid cedar
any advice on where i should start?
Practical data skills you can apply immediately: that's what you'll learn in these no-cost courses. They're the fastest (and most fun) way to become a data scientist or improve your current skills.
rapid cedar
odd meteor
https://kaggle.com/learn
free?
odd meteor
rapid cedar
free?
 rapid cedar
odd meteor
https://tenor.com/view/hell-yea-hell-yeah-shannon-taruc-gif-22861249
rapid cedar
odd meteor
https://tenor.com/view/hell-yea-hell-yeah-shannon-taruc-gif-22861249
damn im in
thanks for the advice man
i appreciate it
stoic gull
SEED = 7
torch.manual_seed(SEED)

x = torch.linspace(-1, 1, 2, requires_grad=True)
t = torch.linspace(0, 1, 2, requires_grad=True)

model = torch.nn.Linear(2, 1)

var_input = torch.stack([x, t], dim=1)

u = model(var_input)

du_dt = torch.autograd.grad(u.sum(), t, create_graph=True)[0]
du_dx = torch.autograd.grad(u.sum(), x, create_graph=True)[0]
d2u_dx2 = torch.autograd.grad(du_dx.sum(), x)[0]
For the code above I get an error message as follows:
---------------------------------------------------------------------------
RuntimeError                              Traceback (most recent call last)
<ipython-input-3-7a2b6c5dd04e> in <cell line: 17>()
     15 du_dt = torch.autograd.grad(u.sum(), t, create_graph=True)[0]
     16 du_dx = torch.autograd.grad(u.sum(), x, create_graph=True)[0]
---> 17 d2u_dx2 = torch.autograd.grad(du_dx.sum(), x)[0]
     18
     19 # result = du_dt + u * du_dx - 0.5 * d2u_dx2

/usr/local/lib/python3.10/dist-packages/torch/autograd/__init__.py in grad(outputs, inputs, grad_outputs, retain_graph, create_graph, only_inputs, allow_unused, is_grads_batched, materialize_grads)
    392         )
    393     else:
--> 394         result = Variable._execution_engine.run_backward(  # Calls into the C++ engine to run the backward pass
    395             t_outputs,
    396             grad_outputs_,

RuntimeError: One of the differentiated Tensors appears to not have been used in the graph. Set allow_unused=True if this is the desired behavior.
What do you think of this error? Is it a bug or something? I use PyTorch version 2.1.0+cu118.
 halcyon hedge
getting this error while importing tensorflow?
"Unable to convert function return value to a Python type! The signature was
() -> handle"
I have already tried reinstalling but still get the same error
Is it a version issue? My Numpy version is 1.24.3 and my Tensorflow version is 2.13.1
 cobalt geyser
Hi. Hope this ok to as here. I'm considering a career change into ML/AI but I don't have a strong computer science or mathematics background. Should I invest in studying those areas or can you work in this field without knowing a lot of computer science and math?
harsh kelp
I want to learn to make an AI, and the video I'm watching rn installs anaconda, pycharm and other trings through the terminal, is it necessary or can I install them in Vscode using install and the name of the librarys I need?
 wooden sail
anaconda is a bundle of modules, interpreter, IDE, and other goodies, while pycharm is an IDE, they have nothing to do with whether you use VScode or not. also installing stuff in vscode is the same as installing stuff through the terminal, since you need to use the terminal from inside vscode to install modules
one way to look at it is that you can choose whether you use anaconda, pycharm + your own python install, or vscode + your own python install. after that, you'll anyway need to use the terminal to install modules regardless of which of those 3 options you chose
you could also mix and match, e.g. using anaconda's python interpreter in vscode. you'll still have to install modules through the terminal afterwards
 quick fable
Hi , does anybody used paddleOCR or easyOCR ?
I am unable to detect point/decimal/float numbers in it .
What to do ?
left tartan
echo mesa
Got it, I'm reading pre-calculus from james stewart, it's very enjoyable and exc...
re: calculus: two resources that are outstanding. 1 is this 17 video lecture series: https://ocw.mit.edu/courses/res-18-005-highlights-of-calculus-spring-2010/video_galleries/highlights_of_calculus/... Strang, the lecturer, is quirky but one of the greatest. It's fabulous: if you study/understand everything he says, Calc will be a breeze - just make sure your algebra skills are solid... which is usually the problem with calc.
left tartan
echo mesa
Got it, I'm reading pre-calculus from james stewart, it's very enjoyable and exc...
Def watch the 3b1b series first... it's a friendly visual intro. https://www.youtube.com/watch?v=WUvTyaaNkzM&list=PLZHQObOWTQDMsr9K-rj53DwVRMYO3t5Yr
Also: Stewarts book is good, but see if you can find the teachers solutions handbook - it's hard to go through the text / self-study without it.
Alternatively, there's the OpenStax calc textbook: https://openstax.org/details/books/calculus-volume-1. I like how many solutions are provided inline... so you can work a problem, then browse the answer inline.
 rugged cargo
Hi, I am currently learning python planning to specialize in ai. I am still a highschool student and i do not have good math basics.
What should i do?
left tartan
rugged cargo
What should i do?
- Start learning Python... it takes a lot of time to get good and you can start with easy stuff. Ask in #python-discussion for resource recommendations. 2. Work on your math basics - strong algebra skills are really important for all higher level math. I believe Khan academy is highly recommended, but there may be other places to practice.
rugged cargo
I've started learning basic python with Harvard's cs50p. I am quite satisfied by the quality of the course.
left tartan
Find some way of learning math that you enjoy. Classes usually are terribly boring and de-motivating... but there's lots of online resources that present math in more exciting ways. I love https://www.youtube.com/@3blue1brown and https://www.youtube.com/@numberphile, along with https://www.youtube.com/@veritasium and https://www.youtube.com/@TwoMinutePapers
left tartan
rugged cargo
I've started learning basic python with Harvard's cs50p. I am quite satisfied by...
Oh, that's great, you're already winning if you're learning that in HS.
rugged cargo
I have also watched some of the linear algebra videos by 3blue1brown but where can i find some problems to practice?
left tartan
Oh, and I forgot this one: https://www.youtube.com/@MindYourDecisions. This channel presents math puzzles... most of which you'll probably not be able to solve, but learning them is fun.
left tartan
rugged cargo
I have also watched some of the linear algebra videos by 3blue1brown but where c...
Depends on what you need to practice. Khan academy is probably your best one-stop-shop for practice.
rugged cargo
Thank you!
left tartan
rugged cargo
Thank you!
Her'es a relevant reddit page with lots of links: https://www.reddit.com/r/learnmath/comments/zlbll0/where_can_i_practice_math_for_free/
echo mesa
left tartan
re: calculus: two resources that are outstanding. 1 is this 17 video lecture ser...
Thanks very much, these are extremely useful
echo mesa
left tartan
Def watch the 3b1b series first... it's a friendly visual intro. <https://www.yo...
Thanks
echo mesa
left tartan
Also: Stewarts book is good, but see if you can find the teachers solutions hand...
You mean the solutions for the questions in the book? Or?
left tartan
echo mesa
You mean the solutions for the questions in the book? Or?
Yah, there's a full doc with full solutions for every problem in Stewart. Full solutions, including step by step... not just answers to odd numbered questions.
echo mesa
left tartan
Yah, there's a full doc with *full* solutions for every problem in Stewart. Full...
Ohh I see what you mean, I'll try to get that, I assume there should be a pdf or smth
echo mesa
left tartan
re: calculus: two resources that are outstanding. 1 is this 17 video lecture ser...
Also in terms of this should I go thru the order in which the videos are listed?
left tartan
echo mesa
Also in terms of this should I go thru the order in which the videos are listed?
Yah, I guess so. I only watched watch these years after learning calculus, so I had a very different perspective. I thought his explanations were really elegant and approachable.
For me, I just liked some of his proofs and explanations: they were much simpler than how I recalled being taught.
echo mesa
left tartan
For me, I just liked some of his proofs and explanations: they were much simpler...
Gotcha
echo mesa
left tartan
Yah, I guess so. I only watched watch these *years* after learning calculus, so ...
Do you already have to know calculus to understand this? Or would pre-calc at least be essential?
left tartan
No, the video series is intended for HS students interested in learning calculus.
I'm not sure about pre-calc. I think the material is approachable with algebra 2 fundamentals.
echo mesa
Gotcha, that's awesome I might actually take a look at that I have the skills
left tartan
echo mesa
Gotcha, that's awesome I might actually take a look at that I have the skills
My bigger lesson/point here is: besides the fact that Math is important to Data Science / AI / etc.... math is also fun & exciting when you start learning at your own pace and following your interests. Math class/school takes a lot of that fun away.
echo mesa
left tartan
My bigger lesson/point here is: besides the fact that Math is important to Data ...
Exactly, 100% agree- when I do math on my own I'm very excited motivated and I love doing it.
echo mesa
left tartan
Alternatively, there's the OpenStax calc textbook: <https://openstax.org/details...
Which one would you prefer?
left tartan
echo mesa
Which one would you prefer?
I only looked at this stuff from a mentoring perspective, not a student, but I really liked OpenStax, but Stewart is what the university was using.
Stewart is a traditional text, like what I learned on. OpenStax is more interactive and more web browser friendly. I don’t think there’s a real content diff between the two.
 spark inlet
hellppppppppppppppppppppppppppppppppppp
i need to make a tensorflow model like dis one
https://github.com/quaint-racoon/some-school-project/tree/main/v2 (beta)
for pose detection

 subtle eagle
Hey all, quick question on datasets:
I have this dataset for segmentation of the spine (mha files), the dataset contains the mha files as is and the respective masks. Do I have to feed both the original images and the masks to my model to train it?

as a point of reference here's an example of the same mri from images and masks respectively


 gusty cipher
Hello what are good code editors and tools for ai and ml
echo mesa
left tartan
Stewart is a traditional text, like what I learned on. OpenStax is more interact...
Gotcha, I also saw the the openStax version has 3 volumes, should I read all of them, or it really depends on how deep do I wanna go?
echo mesa
spark inlet
for pose detection
What do you need help with? I mean obviously I'm probably not gonna be the one who's gonna help you, but all you said that you are making this. What do you need help with?
serene scaffold
gusty cipher
Hello what are good code editors and tools for ai and ml
if you don't have a GPU and you need one, google colab is a pretty good option
but google colab is for coding in notebooks, and when you use a notebook, it's important to understand how they work as compared to regular programs
@gusty cipher please don't ghost ping people.
gusty cipher
İ do apologize i thought you answered my question in general discussion so that,
But can i ask for an idea i can make for example (calculator or hangman game....etc ) but in ai prospective
serene scaffold
gusty cipher
But can i ask for an idea i can make for example (calculator or hangman game.......
you can make an AI that plays connect four using the minimax algorithm
spark inlet
echo mesa
What do you need help with? I mean obviously I'm probably not gonna be the one w...
i need to make my own tensorflow model for pose detection and idk how to do such thing
gusty cipher
serene scaffold
you can make an AI that plays connect four using the minimax algorithm
Hmm can you give more details or some keyword I could search in Google ?
serene scaffold
gusty cipher
Hmm can you give more details or some keyword I could search in Google ?
"python connect four game ai minimax"
spark inlet
serene scaffold
"python connect four game ai minimax"
fire fire
gusty cipher
serene scaffold
"python connect four game ai minimax"
Many thanks for giving me your time 😃 I will put that idea into work 👌
spark inlet
@echo mesa u alive man?
left tartan
echo mesa
Gotcha, I also saw the the openStax version has 3 volumes, should I read all of ...
College calc is three courses: calc 1, 2 (integration), and 3 (multivariate), + 4: (diff equations). The OpenStax books are organized to match that sequence. I believe all CS programs include 1 and 2 at minimum
 stray pulsar
Hello there.
I'm creating a discord bot which uses openai gpt-4 and I want it to remember stuff from previous conversations.
However, as yu might know, the more data you send to the openai api, the more expensive it gets. Especially with GPT-4.
So the issue I'm currently facing is: I want my Ai to remember conversations from previous times (like all of them) and only send the most relevant data to openai, e.g. a user being mean and haven't apologized so far so therefore my ai should behave different to that specific user.
I have acess to a mysql DB which I could use as a chatlog. But I would require a tool which only returns the required information, if any, from that DB.
I highly appreciate any help!
echo mesa
spark inlet
<@547810225777016834> u alive man?
I am, but what do you want me to do ? Create the whole thing for you?, you are being very unspecific you can't expect others to make a whole project for free and giving their time for it. Try doing it and ask specific questions as you go thru. It's very bad to say "i need to make my own tensorflow model for pose detection and idk how to do such thing" You can't expect others to make the whole project for you for completely free.
spark inlet
echo mesa
I am, but what do you want me to do ? Create the whole thing for you?, you are b...
idk how to even start I'm not asking you to create for me but to guide me on how to start such a project
😅
echo mesa
spark inlet
idk how to even start I'm not asking you to create for me but to guide me on how...
Well I assume it's not impossible, so try searching on youtube and you must find something. https://www.google.com/search?q=how+to+start+a+pose+detection+model+project+machine+learning&oq=how+to+start+a+pose+detection+model+project+machine+learning&gs_lcrp=EgZjaHJvbWUyBggAEEUYOdIBCTE4MDQ4ajBqMagCALACAA&sourceid=chrome&ie=UTF-8
 spark inlet
echo mesa
Well I assume it's not impossible, so try searching on youtube and you must find...
spark inlet
echo mesa
Well I assume it's not impossible, so try searching on youtube and you must find...
🙂
thx I just quite know how to use Google...
I didn't find anything worthwhile
that might help...
echo mesa
So using youtube, google havent helped you deciding what to learn or what to start with whatsoever?
I don't understand you man, this project has been created by thousands of people. I think that if you try to find some resource on how to create one you MUST find the way to go
if not then I think specifying more on what you need help with other than saying that I don't know how to create one would be much better. I would guess there must be hundreds of books that covers the mathematics and knowledge on such projects
left tartan
You can maintain and continue a conversation in openai: https://platform.openai.com/docs/api-reference/chat/create?lang=python, or you could provide the chat history on each request (but are limited to input size per request(

Explore developer resources, tutorials, API docs, and dynamic examples to get the most out of OpenAI's platform.
Passing the information to openai with a request isn’t too hard, you just have to figure out what data to send and how to keep it below the maximum request size.
unique ether
Giving myself a headache right now trying to implement A star search algorithm..
serene scaffold
unique ether
Giving myself a headache right now trying to implement A star search algorithm..
Know thou, all these things shall give thee experience, and shall be for thy good.
 cerulean kayak
is gridsearch often this,,,uh...suboptimal or am I screwing it up?
At me if you have anything.
 spare briar
uhh its exhaustive search so...
 orchid pasture
`import pandas as pd
import networkx as nx
import shutil
import math
from bokeh.io import output_notebook, show, save
from bokeh.models import Range1d, Circle, ColumnDataSource, MultiLine
from bokeh.plotting import figure
from bokeh.plotting import from_networkx
output_notebook()
shutil.unpack_archive('lesmis.zip')
G = nx.Graph()
with open('lesmis.mtx') as in_file:
lines = in_file.readlines()[2:]
for line in lines:
n1, n2, w = line.split()
if n1 not in G.nodes():
G.add_node(n1)
if n2 not in G.nodes():
G.add_node(n2)
G.add_edge(n1, n2, weight=int(w))
#Choose a title!
title = 'Les Miserables character network'
#Establish which categories will appear when hovering over each node
HOVER_TOOLTIPS = [("Character", "@index")]
#Create a plot — set dimensions, toolbar, and title
plot = figure(tooltips = HOVER_TOOLTIPS, tools="pan,wheel_zoom,save,reset", active_scroll='wheel_zoom', x_range=Range1d(-1.1, 1.1), y_range=Range1d(-1.1, 1.1), title=title)
#Create a network graph object with circular layout
network_graph = from_networkx(G, nx.circular_layout, scale=1, center=(0, 0))
#Get node positions
node_positions = network_graph.layout_provider.graph_layout
#Set node size and color
node_sizes = [math.sqrt(G.degree(node))*5 for node in G.nodes()]
network_graph.node_renderer.glyph = Circle(size='node_sizes', fill_color='skyblue')
#Set edge opacity and width
edge_widths = [math.sqrt(weight)*0.5 for _, _, weight in G.edges(data='weight')]
network_graph.edge_renderer.glyph = MultiLine(line_alpha=0.5, line_width='edge_widths')
#Add network graph to the plot
plot.renderers.append(network_graph)
#Show the plot
show(plot)`
desert oar
cerulean kayak
is gridsearch often this,,,uh...suboptimal or am I screwing it up?
At me if you ...
it's just combinatorics. this is why parallelization and heuristics like halving search or algorithms for black box optimization become important.
serene scaffold
orchid pasture
`import pandas as pd
import networkx as nx
import shutil
import math
from bokeh...
is there a question that goes with this?
also
!code
arctic wedgeBOT
 upper drift
Is there a library that’s sort of like what xarray is for pandas, but instead building on networkx? Basically storing timeseries and other metadata on a network like structure instead of gridded
desert oar
upper drift
Is there a library that’s sort of like what xarray is for pandas, but instead bu...
not that i know of, but it's an interesting idea. what would the graph representation of a time series look like? what would that accomplish that igraph or networkx don't already accomplish?
upper drift
I’m sort of new to networkx. What I’m looking for is the ability to make selections on network data that’s not solely based on indexing nodes. For example, selecting all nodes based on condition, or time slicing the whole network, or aggregating the network data along the time axis
I wasn’t so much thinking of representing the timeseries as a graph, but that it would exist on graph nodes or edges
 signal whale
maybe a stupid question but how should i see power bi compared to matplotlib or seaborn for example?
desert oar
upper drift
I wasn’t so much thinking of representing the timeseries as a graph, but that it...
i see, that's interesting. maybe you can keep the metadata in a dataframe along with node id's, and use the latter to filter and select the former? i am not a big user of networkx either, although i did use igraph a bit at one point
desert oar
signal whale
maybe a stupid question but how should i see power bi compared to matplotlib or ...
powerbi is a whole system and platform that does a lot more than just making individual plots. matplotlib and seaborn are just python libraries for making individual plots.
signal whale
desert oar
powerbi is a whole system and platform that does a lot more than just making ind...
oh ok i see just knew mat and sea but have to work with pwer bi for uni thx 🙂
 old oar
Hello,
I've encountered an issue with a line of code in my Python program related to calculating the Singular Value Decomposition (SVD). The problematic code is as follows:
from scipy.linalg import svd
# SVD calculation
vec_I = np.ravel(np.eye(2))
vec_I_T = vec_I[:, np.newaxis]
_, _, W = svd(vec_I_T)
In this code, I'm working with a column vector of size 4x1. I was expecting the third output, W, to be a 4x4 matrix. However, in Python, I'm getting a scalar value as the third output. I was able to achieve the expected result in MATLAB.
I would greatly appreciate it if someone could kindly guide me on where I might be making a mistake in my Python code. Thank you for your assistance.
desert oar
old oar
Hello,
I've encountered an issue with a line of code in my Python program relat...
you're looking for the "backtick" character `, usually it's on the same key as ~. and you'll want to remove the space before the py
desert oar
old oar
Hello,
I've encountered an issue with a line of code in my Python program relat...
did you write this svd function, or did you import it from somewhere?
old oar
desert oar
did you write this `svd` function, or did you import it from somewhere?
import from
'scipy.linalg'
desert oar
!e ```python
import numpy as np
vec_I = np.ravel(np.eye(2))
vec_I_T = vec_I[:, np.newaxis]
_, _, W = np.linalg.svd(vec_I_T)
print(type(W))
print(W.shape)
print(W)
@desert oar :white_check_mark: Your 3.12 eval job has completed with return code 0.
001 | <class 'numpy.ndarray'>
002 | (1, 1)
003 | [[1.]]
maybe scipy does something weird here
nope, same result
In [4]: vec_I = np.ravel(np.eye(2))
   ...: vec_I_T = vec_I[:, np.newaxis]
   ...: scipy.linalg.svd(vec_I_T)
Out[4]:
(array([[ 0.70710678,  0.        ,  0.        , -0.70710678],
        [ 0.        ,  1.        ,  0.        ,  0.        ],
        [ 0.        ,  0.        ,  1.        ,  0.        ],
        [ 0.70710678,  0.        ,  0.        ,  0.70710678]]),
 array([1.41421356]),
 array([[1.]]))
Thank you,
While the first output appears to be as anticipated, my expectation was that the 4x4 matrix should be in the third output. It seems that the SVD output in Python may not conform to the standard format, or I might have made an error in my implementation. This is in contrast to the results you obtain when running the same code in MATLAB, which provides different results.
I appreciate your response.
desert oar
old oar
Thank you,
While the first output appears to be as anticipated, my expectation ...
yes, it's always worth checking the documentation when using unfamiliar functions, especially when coming from an entirely different language. numpy and scipy are very much inspired by matlab, but they're also not at all the same thing and might differ in a variety of ways.
 rotund lark
not sure if this is the right channel to ask in but..
Say I have a list of 200 buisness addresses. And i want to figure out their store hours.
How can I do this with python?
desert oar
rotund lark
not sure if this is the right channel to ask in but..
Say I have a list of 200 ...
your best bet is probably to use a geocoding or search api like google, foursquare, yelp, openstreetmap nominatim, etc. nominatim is maybe the best choice to start with because it's free and open, but it has fewer contributors than something like google so the data might be worse quality. you'll probably want to try multiple sources
each api will have different restrictions and different data formats. it can be a lot of work depending on how precise you want it to be
(i'd say this is probably a good opportunity to use chatgpt or equivalent to speed things up. it probably won't be correct, but it should help you get all the basics sketched out quickly. it's great for tedious work like this. reading lots of api reference docs and figuring out how to call them all is drudgery and i'm grateful when a machine can do that for me.)
rotund lark
desert oar
your best bet is probably to use a geocoding or search api like google, foursqua...
Geocoding as in the longitude and latitude values?
I'll give those search api a try, thankyou!!
Yeah planning on using chatgpt to help 😆
 keen stirrup
import pandas as pd
import requests
from bs4 import BeautifulSoup
import time
headers = {
'User-Agent': 'my user agent ', # Replace with a common browser's user-agent
'Accept-Language': 'en-US,en;q=0.5',
}
Add a delay before making the request
time.sleep(2) # Adjust the delay time as needed
webpage = requests.get('https://www.upwork.com/services/product/design-expert-crafted-logo-design-with-unlimited-revisions-1701495083035004928', headers=headers)
webpage
still I am facing the issue <Response [403]> this is only with upwork website ? please help me solving this problem I have a deadline of an assignemnt for internship tommorrow
old oar
I have encountered an issue with the cvxpy package while working on my variable to construct the objective function. Here's my Python code:
# Define the variable
lambda_opt = cp.Variable(100)

# Length of lambda
lambda_length = 100

# Initialize the result_matrix as a 2D NumPy array with the same shape as G's first two dimensions
result_matrix = np.zeros(G.shape[0:2])

# Loop through the lambda values
for ind in range(lambda_length):
    result_matrix += lambda_opt[ind] * G[:, :, ind]

# The result_matrix now contains the sum of lambda(ind) * G(:, :, ind) for each ind

# Define the objective function
obj_param = cp.tr_inv(result_matrix)
I believe there's an error inside the for loop, preventing the calculation of the 'result_matrix' as intended. Can someone help me identify and correct this issue? Thank you.
wooden sail
old oar
Thank you,
While the first output appears to be as anticipated, my expectation ...
your vector is 4x1
the svd is fine
the svd returns matrices U, sigma, and V^H such that, if the original matrix is size m x n, then U is size m x m, and V^H is nxn. sigma is size m x n
you may get a different result in matlab because matlab's unfolding order is column major, while numpy's is based on how C allocates memory, which is row major
that aside though, for any vector size 4 x 1, the svd should indeed be a 4x4 matrix, a 4x1 vector, and a scalar, in that order, regardless of which lang you use
here's a matlab (octave) demo
 desert oar
keen stirrup
import pandas as pd
import requests
from bs4 import BeautifulSoup
import time
h...
desert oar
keen stirrup
import pandas as pd
import requests
from bs4 import BeautifulSoup
import time
h...
403 means you're trying to do something they don't want you to do
desert oar
wooden sail
that aside though, for any vector size 4 x 1, the svd should indeed be a 4x4 mat...
good point. U should be 4x4 here
rotund lark
desert oar
your best bet is probably to use a geocoding or search api like google, foursqua...
Tested it on a sample size of 500 with the google API :/ All of them returned "Opening hours not available".
I wonder if there is something wrong with the code...
from tqdm import tqdm
import requests

# Replace with your Google Places API key
api_key = 'keykeykey'

# Load addresses from the Excel file
file_path = r'C:\Users\zamja\Downloads\Current Store Type Data.xlsx'
column_name = 'formatted_address'  # Use the actual column name in your Excel file

# Read addresses from the specified column
df = pd.read_excel(file_path)
addresses_to_test = df[column_name].tolist()[:500]  # Process the first 500 addresses

# Initialize an empty list to store results
results = []

# Initialize a tqdm progress bar
for search_query in tqdm(addresses_to_test, desc="Progress"):
    url = f'https://maps.googleapis.com/maps/api/place/findplacefromtext/json?input={search_query}&inputtype=textquery&fields=name,formatted_address,opening_hours&key={api_key}'
    response = requests.get(url)
    data = response.json()

    # Extract store details including hours of operation
    if 'candidates' in data and len(data['candidates']) > 0:
        store = data['candidates'][0]
        name = store['name']
        address = store['formatted_address']
        if 'opening_hours' in store and 'weekday_text' in store['opening_hours']:
            hours = store['opening_hours']['weekday_text']
        else:
            hours = ['Opening hours not available']
        results.append({
            'Store Name': name,
            'Address': address,
            'Hours of Operation': hours
        })
    else:
        results.append({
            'Store Name': 'Store not found',
            'Address': search_query,
            'Hours of Operation': ['Opening hours not available']
        })

# Create a DataFrame from the results and display it
results_df = pd.DataFrame(results)
print(results_df)

# Specify the output directory and filename
output_csv_file_path = r'C:\Users\zamja\Desktop\Address Stuff For Andrey\Customer Address Hours Full 4k.csv'

results_df.to_csv(output_csv_file_path, index=False)

print("Querying and saving complete.")
okay, for "parallelization" isn't that just when I use all my cores on the task of finding the solution? Because I made the n_jobs parameter =-1 which means it'll use as many cores as possible. So I think at that point it's a matter of the proformance of my computer, which I don't think there's any accounting for that since I'm broke.
Also, when I look up heuristic¹ it says that you want to get an anwser in less time, while sacrificing accuracy and completeness. The whole reason I'm doing the hyper-parameter tuning is because I want a solution that is as accurate as possible. My random forest is already at a 93% accurate and I'd like to increase that as much as possible. Is it wise to still use a heuristic, should I find the hyperparameters one-at-a-time, or something else entirely?
¹because to be commpletly honest with you, I've never heard of either of these terms, so I know it's more than possible for me to be wrong with what I think is going on. So please correct me, if you know something is wrong in this message.
also here's the code from the origonal message:
model=RandomForestClassifier()
grid=GridSearchCV(estimator=model, param_grid=hyperparameterGrid,cv=3,verbose=3,n_jobs=-1)
grid.fit(x_train, y_train)
runtime:80m:52sec
cunning agate
i've a question when can i use mean encoding for cat features
serene scaffold
cunning agate
i've a question when can i use mean encoding for cat features
cat features?
cunning agate
serene scaffold
cat features?
categorical
serene scaffold
cunning agate
categorical
unless those categories are numeric in some non-arbitrary way, it's unlikely that you can take the mean of them.
why has the concept of taking the mean of categorical features entered your mind? did someone ask you to do this?
cerulean kayak
could I do a gridsearch on each individual hyperparameter, or would that not work, because the optimal value for the hyperparameter might be diffrent depending on the other hyperparameters?
cunning agate
serene scaffold
why has the concept of taking the mean of categorical features entered your mind...
no not like that i was searching for some other methods for encoding and i found meanencoding when u work with high cardinality features when i said mean it's not mean of cat features but Encoding categorical variables with a mean target value
u could check: https://kaggle.com/code/vprokopev/mean-likelihood-encodings-a-comprehensive-study/notebook

Explore and run machine learning code with Kaggle Notebooks | Using data from Datasets used in my study of target encodings
 spice mountain
Would anyone mind looking at my rather simple VQGAN test code and tell me what goes wrong? I am not getting the correct output.
serene scaffold
spice mountain
Would anyone mind looking at my rather simple VQGAN test code and tell me what g...
when you ask a question, always give enough information for people to start answering it. don't ask for a commitment first.
desert oar
cerulean kayak
okay, for "parallelization" isn't that just when I use all my cores on the task ...
parallelization doesn't mean all cores. in this case, it means using multiple processes (or threads) to do different things simultaneously.
"as accurate as possible" is not really possible unless you have enormous mounts of time to sit there trying every combination. and if you do find the best accuracy on your training set, there's no guarantee it's the best on the complete data.
heuristics and approximations exist for many reasons and take many forms, they don't necessarily imply a worse solution in the end. basically all of statistics and machine learning is built on approxmations, very few things we do have closed-form exact expressions for their maxima or minima. consider that grid search is itself a heuristic.
that said, i don't recommend making up your own heuristics. use existing techniques. i suggested a few above that might allow you to get more value out of your time spent waiting for models to finish fitting.
finally, in machine learning it's never really possible to know if you're at or near max performance, and there are many things that can affect model performance beyond hyperparameters.
btw it's good to as questions if you don't know something. hopefully this helps clarify a little of what i mean.
cerulean kayak
desert oar
parallelization doesn't mean _all_ cores. in this case, it means using multiple ...
sorry, I'm not seeing the specific huestic methods you mentioned. would you mind pinging me with a link to the post?
 muted hollow
Hey guys, is there a rule to how to choose the numbers of hidden layers and numbers of node in each layers
For example in a natural language processing chatbot problem
 river mural
Hey, i have simple question regarding vectorized matrix multiplications using numpy(or any other matrix compute libraries like jax)
first of all say i want to multiply 2 matrices (x and q, $x \times q$) it can simply be done with e.g.:
(Pdb) p x.shape
(2,)
(Pdb) p q.shape
(2, 1)
(Pdb) p q.T@x
array([-3.58142014])
but what if i have many xes which i want to multiply each one with q, it could be done with e.g.:
(Pdb) p x.shape
(2, 400, 400)

product_result = np.empty(x.shape[1:])
for i, j in np.ndindex(x.shape[1:]):
    product_result[i, j] = q.T.dot(x[:, i, j])
but this approach is not SIMD efficient neither does it look "clean", does numpy offer a way to do this efficiently with a vectorized implementation?
Thank you!
 untold bloom
x.transpose(1, 2, 0) @ q.squeeze()
(x.transpose(1, 2, 0) @ q).squeeze()
np.einsum("iz,ijk->jk", q, x)
np.einsum("ijk,iz->jk", x, q)
np.tensordot(x, q.squeeze(), axes=(0, 0))
np.tensordot(x, q, axes=(0, 0)).squeeze()
wooden sail
einsum would be my preferred way as well
you can always reshape multilinear operations into matrices as well, but that involves several kronecker products, and so, even though it uses simd for everything, it requires huge amounts of memory and some computations are redundant
if you do these on gpu, newer gpus have architectures that allow these kinds of operations natively, without internally looping over matrix operations. you don't interact with the instruction set directly though
river mural
in general what is the "proper" shape that my vectorized data should have:
(shape_of_inate_dimensions, shape_of_vectorization) (like my above example x.shape == (2, 400, 400))
or
(shape_of_vectorization, shape_of_inate_dimensions) (the above example would be x.shape == (400, 400, 2))
I am asking because if it was the second way then x@q.squeeze() would simply work
Thanks! (hopefully my question makes sense)
vestal spruce
can anyone help me with my problem in #1035199133436354600 ?
wooden sail
river mural
in general what is the "proper" shape that my vectorized data should have:
`(sha...
this has to do with you choosing to use @, which calls numpy's matmul https://numpy.org/doc/stable/reference/generated/numpy.matmul.html
when using matmul, numpy treats the last 2 axes as defining a matrix, and the remaining axes as indexing several matrices with shape dictated by the last 2 axes
the behavior is different if you use .dot() instead of matmul, and different yet if you use einsum. i recommend using einsum so that you don't have to try and figure out what numpy is trying to do by default. being as explicit as possible is always good
 hushed crater
Hey guys, I'm trying to generate a trend line over my stripplot using regplot, but I'm having issues getting it to align properly.
# Filtering out Application_order outliers as there is only 2 rows, making the graph more readable
no_extremes = df[df['Application_order'].between(1, 6)]
# Finding the count of rows where the Application_order value occurs the fewest times in order to ensure a completely even distribution
# As using anything above this number would result in the exclusion of rows from the smallest dataset
fewest_n = no_extremes['Application_order'].value_counts().min()
# Taking the top fewest_n number of students from each Application_order
top = no_extremes.groupby('Application_order').apply(lambda x: x.nlargest(fewest_n, 'Admission_grade'))

spec = dict(x="Application_order", y="Admission_grade", data=top)
sns.stripplot(**spec, hue='Application_order', palette='flare', jitter=0.2, size=1.5, legend=None)
sns.regplot(**spec, scatter=False)
plt.show()```
Ideally I want it one x to the left, any help? Thanks
hollow sentinel

Stack Overflow
I'm using the code from this link.
https://devskrol.com/2021/12/27/choropleth-maps-using-python/
Here's my actual code.
import plotly.express as px
from urllib.request import urlopen
import json
...
import plotly.express as px
from urllib.request import urlopen
import json
with urlopen('https://raw.githubusercontent.com/plotly/datasets/master/geojson-counties-fips.json') as response:
    counties = json.load(response)

#import libraries
import pandas as pd
zip_codes = df["Rndrng_Prvdr_Zip5"]

fig = px.choropleth(zip_codes,
                    geojson=counties,
                    locations='Rndrng_Prvdr_Zip5',
                    #locationmode="USA-states",
                    color='Rndrng_Prvdr_Zip5',
                    range_color=(1000, 10000),
                    scope="usa"
                    )
fig.update_layout(margin={"r":0,"t":0,"l":0,"b":0})
fig.show()
this just runs infinitely
my plan is to plot the amount of times a zip code is there on a heatmap
 versed hound
Hi all...I am new trying to use jupyter lite for data analyst just started but it will not give any output..I tried restart kernel with all options....any suggestions??? Tried incognito mode and changing the kernel as well
hollow sentinel
idk what to do, kinda stuck here
versed hound
Ok @hollow sentinel thanks still
hollow sentinel
oh i wasn't talking to you, sorry abt that
versed hound
Oh sorry
hollow sentinel
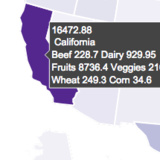
Over 10 examples of Choropleth Maps including changing color, size, log axes, and more in Python.
here's the documentation for what i'm looking to do
an error would be much more helpufl
ugh
import pandas as pd
import plotly.express as px

# Read in data
df = pd.read_csv('zip_code.csv')

# Count zip codes
zip_counts = df['zip_code'].value_counts()

# Rename Series
zip_counts.name = 'zip_count'

# Join counts to dataframe
df = df.join(zip_counts, on='zip_code')

# Convert count to integer
df['zip_count'] = df['zip_count'].astype(int)

# Aggregate to state level
df = df.groupby('zip_code').agg({'zip_count':'sum'}).reset_index()

# Custom color scale
color_scale = [[0,'rgb(242,240,247)'],[0.2,'rgb(218,218,235)'],
               [0.4,'rgb(188,189,220)'], [0.6,'rgb(158,154,200)'],
               [0.8,'rgb(117,107,177)'],[1,'rgb(84,39,143)']]

# Create figure
fig = px.choropleth(df,
                    locations='zip_code',
                    locationmode='USA-states',
                    color='zip_count',
                    scope='usa',
                    width=1000,
                    height=500,
                    color_continuous_scale=color_scale)

# Update layout
fig.update_layout(title='Zip Code Counts by State',
                  coloraxis_colorbar=dict(title='Count'))

fig.show()

smh, but at least we're getting somewhere
can anyone help me out?
desert oar
cerulean kayak
sorry, I'm not seeing the specific huestic methods you mentioned. would you mind...
random search, halving random search (if appropriate for your model type), and any of the several "black box optimization" techniques out there (look into the Optuna and Hyperopt libraries for example)
desert oar
hushed crater
Hey guys, I'm trying to generate a trend line over my stripplot using regplot, b...
what's df['Application_order'].dtype? and can you share a sample dataframe that reproduces the problem?
hushed crater
its float64, and sure one second
desert oar
my guess is that somehow the application order column is being encoded as categorical... not really sure how that would happen, but still. i kind of hate seaborn honestly, i feel like it never quite works right, the docs omit a lot of detail on how it actually works, and it's so much abstraction over matplotlib that it's really hard to debug when something goes wrong.
maybe also try re-encoding to integer if it is in fact integer data
if you have nulls, use pd.Int64Dtype() instead of int, which can handle null values natively without relying on float NaN
hushed crater
hushed crater
desert oar
maybe also try re-encoding to integer if it is in fact integer data
Okay, will try. And I cleansed the data so im sure there is no nuls
desert oar
btw i was able to reproduce immediately, thanks for the good data sample 👍
hushed crater
You're welcome, thanks for trying to help
I actually managed to make it work but i'm not happy with how hacky it is
desert oar
ugh... the int64 thing actually trips up seaborn. maybe the jitter doesn't work with int data
desert oar
hushed crater
You're welcome, thanks for trying to help
I actually managed to make it work but...
how'd you get it to work?
hushed crater
I done away with seaborn
# Draw trend line
p = np.poly1d(np.polyfit(x, y, 1))
extended_x = np.linspace(x.min() - 2, x.max(), 100)
plt.plot(extended_x, p(extended_x), '--', alpha=0.2, color='r')
 desert oar
i was going to suggest that 😆
it looks like this is a known problem/bug https://stackoverflow.com/q/61320854
Stack Overflow
When I set the boxplot and regplot in one chart, I get a shifted regression chart along the x-axis. When I plot it separately, everything is fine. How to fix it?
import seaborn as sns
import matp...
hushed crater
Figures...
desert oar
this might be an open regplot bug actually. the one accepted answer is more of a hack than an answer
hushed crater
So you think I should go with that, or is there a better approach?
desert oar
i always advocate for not using seaborn tbh
i used to encourage people to use it, but i've had nothing but my own annoyance with it. although manually doing matplotlib colormap stuff is also annoying, but at least it's all documented somewhere (albeit hard to follow).
cunning agate
Hello
I want someone to review with me some code and give me some advices, thanks in advance
desert oar
cunning agate
I want someone to review with me some code and give me some advices, thanks in a...
that's asking a lot of a random stranger online. you might get more assistance if you ask a specific question with enough detail that it can be answered right away (e.g. include code and a sample of data)
cunning agate
desert oar
that's asking a lot of a random stranger online. you might get more assistance i...
I mean I want voice discussion to explain my code and get feedback about it
 blazing oxide
hollow sentinel
can anyone help me out?
blazing oxide
hollow sentinel
can anyone help me out?
I can, and I've already figured out the problem
The problem lies in the mismatch between the ‘locations’ parameter in the ‘px.choropleth’ function and the actual data you have.
In your code, you’re passing ‘zip_code’ to the ‘locations’ parameter, which expects state abbreviations if you’re using ‘USA-states’ as the ‘locationmode’. However, ‘zip_code’ is not a state abbreviation.
To fix this, you need to have a column in your DataFrame that contains state abbreviations corresponding to each zip code. Then, you can pass this column to the ‘locations’ parameter.
Here’s an example of how you might modify your code:
 # Assume that 'state' is the column with state abbreviations
fig = px.choropleth(df,
                    locations='state',  # Change this
                    locationmode='USA-states',
                    color='zip_count',
                    scope='usa',
                    width=1000,
                    height=500,
                    color_continuous_scale=color_scale)
guys how to paste a code like that?
tidal bough
blazing oxide
The problem lies in the mismatch between the ‘locations’ parameter in the ‘px.ch...
!rule 10
blazing oxide
tidal bough
!rule 10
But I didnt...
hushed crater
blazing oxide
guys how to paste a code like that?
```<language>
Code
```
blazing oxide
hushed crater
\```<language>
Code
\```
Thanks 👌
arctic wedgeBOT
blazing oxide
blazing oxide
Here’s an example of how you might modify your code:
```py
# Assume that 'stat...
modified
hollow sentinel
blazing oxide
modified
thank you so much
blazing oxide
hollow sentinel
I SEE COLORS!
I'm curious to see the coloured map now XD
blazing oxide
hollow sentinel
thank you so much
You are welcome
hollow sentinel
blazing oxide
I'm curious to see the coloured map now XD
 blazing oxide
hollow sentinel
blazing oxide
hollow sentinel
It's a start
blazing oxide
Always free to help 👍
hollow sentinel
blazing oxide
Always free to help 👍
now if i can amalgamate the data from the latest back a couple years, continue building that zip code dictionary, i think a couple more areas will be highlighted
maybe then my hypothesis of zip codes affecting discharges will be proven correct
blazing oxide
Very nice project I am curious to see the results
lapis sequoia
can someone help me creating a model for sentiment classification using nlp
abstract wasp
lapis sequoia
can someone help me creating a model for sentiment classification using nlp

In this video you will go through a Natural Language Processing Python Project creating a Sentiment Analysis classifier with NLTK's VADER and Huggingface Roberta Transformers. The project is to classify the seniment of amazon customer reviews. 🤗 provides some great open source models for NLP: https://huggingface.co/models. We will look at the d...
He uses pretrained models
lapis sequoia
I need to train a model for an assignment
Does that mean I need to create a model from scratch or I can use any other model and use it on my data
abstract wasp
lapis sequoia
Does that mean I need to create a model from scratch or I can use any other mode...
Building a model from scratch would be like creating the architecture from the beginning. But if your assignment says to just train a model, you can also just use one of the models the guy uses in the vid. and train it with your own data.
lapis sequoia
ok thanks man
abstract wasp
But you should ask your instructor just to double check.
lapis sequoia
abstract wasp
Building a model from scratch would be like creating the architecture from the b...
that's what I was confused about
abstract wasp
lapis sequoia
that's what I was confused about
Just ask to double check lol
cunning agate
i've an error when i want to train my models (ValueError: continuous format is not supported)
abstract wasp
For an autoencoder, what is the common structure of the encoder and decoder? Like for CNN, it's usually some conv. layers, then maxpooling, flatten, dense... what would it be for the encoder and decoder?
cunning agate
from sklearn.preprocessing import StandardScaler
scaler = StandardScaler()
data[numerical_columns] = scaler.fit_transform(data[numerical_columns])
target = data['Y'].dropna()
X = data[numerical_columns].drop('Y', axis=1)
spice mountain
serene scaffold
when you ask a question, always give enough information for people to start answ...
 blazing oxide
cunning agate
i've an error when i want to train my models (ValueError: continuous format is n...
blazing oxide
cunning agate
i've an error when i want to train my models (ValueError: continuous format is n...
Hey there! 👋 It seems like you’re encountering a “ValueError: continuous format is not supported”. This usually happens when a function expects categorical data but gets continuous data instead. Here are some tips that might help:
Check Data Types: Make sure all your numerical_columns are actually numerical (integers or floats). You can do this with data[numerical_columns].dtypes.
Handle Missing Values: The StandardScaler() doesn’t handle NaN values. So, ensure there are no missing values in your data. Use data[numerical_columns].isnull().sum() to check for any.
Target Column ‘Y’: If ‘Y’ is your target variable and it’s categorical, it shouldn’t be in the numerical_columns. This could cause issues.
If these tips don’t solve the issue, could you provide more details or the full error message? The more info you give, the better we can help! 😊
I hope I've helped you out
spice mountain
spice mountain
Okay, it didn't allow me to post the code. It is an .ipybn file.
Basically, I loaded the pretrained CelebAHQ model of the VQGAN and ran it on a picture of a celebrity from the same dataset. I get some very weird results - however, they don't look like complete random noise. Just very weird.
I think the easiest would be to confirm/deny, whether this is the correct way to generate data:
from PIL import Image,ImageShow
import numpy as np
segmentation_path = r"C:\Users\DripTooHard\PycharmProjects\taming-transformers\scripts\taming-transformers\scripts\download.png"
segmentation = Image.open(segmentation_path)
segmentation = np.array(segmentation)
segmentation = torch.tensor(segmentation.transpose(2,0,1)[None]).to(dtype=torch.float32, device=model.device)
print(segmentation.shape)


c_code,c_indices = model.encode_to_z(segmentation)
image_recon = model.decode_to_img(c_indices,c_code.shape)
image_recon.permute(0,3,2,1).shape```

From the VQGAN-transformer.cur romani lupum confrontant...?
blazing oxide
serene scaffold
cur romani lupum confrontant...?
Uh latin, NICE
spice mountain
serene scaffold
cur romani lupum confrontant...?
Vide ut ad alteram partem.
serene scaffold
spice mountain
Okay, it didn't allow me to post the code. It is an .ipybn file.
Basically, I l...
we don't allow most file uploads, but ipynb files aren't intended to be human readable (you're only supposed to open them in a notebook editor). it's best to copy and paste the relevant parts of the text, or copy all the code into a pastebin.
I haven't heard of CelebAHQ or VQGAN. You're trying to generate training data for some downstream purpose?
spice mountain
serene scaffold
we don't allow most file uploads, but ipynb files aren't intended to be human re...
No, I am trying to do a specific research study on VQGAN. So it has to be those two models and datasets 🙂
 short heart
I need some help with pandas. How can I insert array values? Suppose I have a df with id column and "array" column. How would it be possible to do something like df.loc[selected_ids, 'array'] = [[1,2],[2,1]]
serene scaffold
short heart
I need some help with pandas. How can I insert array values? Suppose I have a df...
you're not really supposed to do that. what happens when you try to do df.loc[selected_ids, 'array'] = [[1,2],[2,1]] ?
and what is selected_ids?
short heart
selected _ids means just an array of some indexes id like to insert data to
and such code gives out this error
ValueError: Must have equal len keys and value when setting with an ndarray
serene scaffold
does selected_ids have the same length as the outermost list of [[1,2],[2,1]]?
agile cobalt
!e testing ```py
import pandas as pd
import numpy as np
df = pd.DataFrame({'A': [1, 2], 'B': [0, 0]}, index=['X', 'Y'])
df.loc[:, 'B'] = np.array([[1, 2], [3, 4]])
print(df)
@agile cobalt :white_check_mark: Your 3.12 eval job has completed with return code 0.
001 |    A  B
002 | X  1  1
003 | Y  2  3
...yeah that is weird to say the least
overall I would just strongly recommend not having arrays/lists/dictionaries/custom objects overall inside of dataframes though, why are you trying to do that?
short heart
serene scaffold
does `selected_ids` have the same length as the outermost list of `[[1,2],[2,1]]...
yeah it does
 left tartan
import pandas as pd
df = pd.DataFrame({"array": [[],[],[],[],[],[]]}, index=[1,2,3,4,5, 6])
selected_ids = [1,5]
df.loc[selected_ids, "array"] = [[1,2,3],[2,3,4]]
print(df)
agree with etrotta, really dont like using lists here.
 tired halo
Hi there 👋
While running a script with pyrogram, i replaced the original file with another one by mistake without having any backup.
Script is still running with python3.8
Any idea how I can find a .py or .pyc file of it?
short heart
serene scaffold
does `selected_ids` have the same length as the outermost list of `[[1,2],[2,1]]...
For some reason it works until some point, for example if I try to insert [[1,2],[1]] it works
but it wont let me insert [[1,2,3],[1,2,3]]
wont let me insert [[1,2],[1,2]] too
left tartan
dont just say "wont let me", say what the error is, plz
short heart
short heart
selected _ids means just an array of some indexes id like to insert data to
and ...
the error is above
its the same always
short heart
d = {'id':[1,2,3,4,5,6],
    'array':[[0,0,0] for i in range(6)]}

df = pd.DataFrame(d)

arr = np.array([[1,2,3],[3,2,1]])
ids = [1,2]

df.loc[ids, 'array'] = [[1,2],[1,3]]```it works, but why doesnt mine work?
it seems the same at first glance
left tartan
import numpy as np
import pandas as pd
df = pd.DataFrame({'array':[[0,0,0] for i in range(6)]}, index=[1,2,3,4,5,6])
arr = np.array([[1,2,3],[3,2,1]])
ids = [1,2]
df.loc[ids, 'array'] = [[1,2],[1,3]]
df
works as well, but again i dont understand whats the matter with what I sent
left tartan
It's a broadcasting problem...
short heart
thanks, solved
for dataframe with other columns simply referring to single col helps
df['array'].loc[ids] = [[1,10],[1,3]]``` kind wren
I want to create a language ai that takes sentences and produces new sentences. How can I do this? I want to use tensorflow.
cunning agate
hey,i've a question i want to train my models using pycaret so i did the normal import from sklearn and boosting without using function create_model now i want to use predict_model function can i do it ?
lapis sequoia
hello
is there someone ?
out here in the void XD
i need help on understanding how neural net works using this
# Define the inputs
input1 = 2
input2 = 3

# Define the weights and biases for the first neuron
weight11 = 0.5
weight12 = 0.5
bias1 = 0.1

# Calculate the output of the first neuron
output1 = input1 * weight11 + input2 * weight12 + bias1

# Define the weights and biases for the second neuron
weight21 = 1
weight22 = -1
bias2 = 0

# Calculate the output of the second neuron
output2 = input1 * weight21 + input2 * weight22 + bias2

# Combine the outputs of the two neurons
output = output1 + output2

# Print the final output
print(output)```what kind of help did you have in mind? did you write this code?
 mighty bridge
gpt did
 tidal scroll
lapis sequoia
i need help on understanding how neural net works using this
```py
# Define the...
tidal scroll
lapis sequoia
i need help on understanding how neural net works using this
```py
# Define the...
I think it's uncompleted code right?
 fervent wraith
Hi. Is there anybody that who could help me with sales forecasting model pipeline
I just need help on configuring the data onto the pipeline model and to fix errors on def function in pipeline model to work with a sales forecasting model to find out the next hour sales for top 25 fast moving items
 true saffron
fervent wraith
I just need help on configuring the data onto the pipeline model and to fix erro...
true saffron
fervent wraith
I just need help on configuring the data onto the pipeline model and to fix erro...
A Good Question
When you're ready to ask a question, there are a few things you should have to hand before forming a query.
A code example that illustrates your problem
If possible, make this a minimal example rather than an entire application
Details on how you attempted to solve the problem on your own
Full version information - for example, "Python 3.6.4 with discord.py 1.0.0a"
The full traceback if your code raises an exception
Do not curate the traceback as you may inadvertently exclude information crucial to solving your issue
fervent wraith
I was trying to configure my datasets within the pipeline model. I have config file but when I configure it pops up with error there is no such file or directory. Eventhough the path was correct

 vestal spruce
fervent wraith
I was trying to configure my datasets within the pipeline model. I have config f...
vestal spruce
fervent wraith
I was trying to configure my datasets within the pipeline model. I have config f...
Could you provide the raised error?
fervent wraith
 vestal spruce
fervent wraith
vestal spruce
fervent wraith
Secondly why do you have 2 of the same import reference for get_items_info ?
fervent wraith
vestal spruce
Secondly why do you have 2 of the same import reference for `get_items_info` ?
Sorry that was a typo
vestal spruce
fervent wraith
Sorry that was a typo
you might want to delete the duplicate and re run the top code block then the 3rd code block, see if that solve it.
fervent wraith
vestal spruce
you might want to delete the duplicate and re run the top code block then the 3r...
Still the same
vestal spruce
fervent wraith
Still the same
wait actually since you're using a reference of src.util.datasources_scripts, while the get_items_info is from src.utils.datasources_utils which means that the datasources_scripts must also reference the get_items_info from datasources_utils, if you can try to check the datasources_scripts.py see if the function is being referred correctly there.
does my explanation/guidance makes sense?

 vestal spruce
fervent wraith
vestal spruce
fervent wraith
Well as I see it, what you did is to copy and paste the function from the scripts into your jupyter notebook, am I correct?
I mean that works albeit not as intended, so I guess that's a solution 😅
fervent wraith
Datasources was also intended into the pipeline this was working as the first go when I was tryinh to do it again it didnt work
Just tried getting some help from gpt after and copied still it didnt work
Thats what was the input which I sent you 😂
vestal spruce
vestal spruce
Well as I see it, what you did is to copy and paste the function from the script...
Wait you haven't answer my question.
tidal scroll
Hi guys, just want to ask about CNN, does anybody now how do CNN works?
wooden sail
what do you want to know about them?
a cnn works by learning convolution kernels to achieve a task
tidal scroll
yes I just read about it but I do not know about the "fundamentals" of how it works in literal not by library or code
Its like having so many layers to generate the output, I just wonder about how CNN works, because it use tensorflow right?
hallow light
Hello guys I am trying to build a model that is able to catch anomalies within gas meter values what would be best for this? random forest classifier or rnn?
lapis sequoia
tidal scroll
I think it's uncompleted code right?
well yeah cos i just edited the script that the chatgpt gave me
and i want to learn using like this general VERY EASY WAY
idk
just i want to understand it
lapis sequoia
desert oar
what kind of help did you have in mind? did you write this code?
idk rn
i want to build a VERY simple neural network
and before making it i want to understand how it works
 tender umbra
hallow light
Hello guys I am trying to build a model that is able to catch anomalies within g...
tender umbra
hallow light
Hello guys I am trying to build a model that is able to catch anomalies within g...
try Multivariate Gaussian Process first. Its easy to interpret it. then you can try xgboost. I would avoid RNN
tidal scroll
wooden sail
do you know how a convolution works?
no I dont know, just trying to learn the CNN but the theory itself is confusing
hallow light
tender umbra
try Multivariate Gaussian Process first. Its easy to interpret it. then you can ...
Thanks.
wooden sail
tidal scroll
no I dont know, just trying to learn the CNN but the theory itself is confusing
you should probably learn about convolutions and neural networks before jumping into convolutional neural networks. that is, if your plan is to understand everything in depth
tidal scroll
Wait, there is a separate convolutions theory? I thought only convolutional neural networks
tidal scroll
wooden sail
you should probably learn about convolutions and neural networks before jumping ...
I guess I'll start by learning the basics first before diving straight into CNNs seems a bit confusing for me, so that's why its very confusing. Thanks for the suggestion btw, I appreciate it
hollow sentinel
pd.set_option('display.max_columns', 100000)
print(df.head())
Tot_Dschrgs  zipcode_35007  zipcode_35058  zipcode_35233  zipcode_35235  \
0          30              0              0              0              0
1          16              0              0              0              0
2          20              0              0              0              0
3          18              0              0              0              0
4          43              0              0              0              0

   zipcode_35630  zipcode_35660  zipcode_35801  zipcode_35957  zipcode_35960  \
0              0              0              0              0              0
1              0              0              0              0              0
2              0              0              0              0              0
3              0              0              0              0              0
4              0              0              0              0              0

   zipcode_35968  zipcode_36049  zipcode_36078  zipcode_36106  zipcode_36116  \
0              0              0              0              0              0
1              0              0              0              0              0
2              0              0              0              0              0
3              0              0              0              0              0
4              0              0              0              0              0

   zipcode_36201  zipcode_36301  zipcode_36360  zipcode_36420  zipcode_36467  \
0              0              1              0              0              0
1              0              1              0              0              0
2              0              1              0              0              0
3              0              1              0              0              0
4              0              1              0              0              0
i just wanna see all columns of my dataframe
wooden sail
that's kinda absurd
as you can tell, you can hardly fit more than around 20 in a screen
this is why data visualization techniques and statistical descriptions are a thing
hollow sentinel
true
wooden sail
printing raw data with 100k columns will never give you any useful information
hollow sentinel

zip_columns = [col for col in X_train.columns if 'zipcode' in col]
X_train[zip_columns].sum().plot.bar(figsize=(60,20), rot=0)
plt.title("Sample Distribution by Zipcode")
plt.xlabel("Zipcode")
plt.ylabel("Number of Samples")
it's kinda hard to see
is there anything else i can do? some kind of argument i can provide to make it look better?
past meteor
So your chloropleth map chart didn't work?
hollow sentinel
it did, well kinda
i actually wanted to work on that some more
i think a chloropeth is maybe a better idea
past meteor
I agree with edd that printing 100k columns will not work so the map is your best bet
hollow sentinel
yeah
hollow sentinel
past meteor
I agree with edd that printing 100k columns will not work so the map is your bes...
can i put the code here for my chloropeth map that's not working atm?
i'm a bit confused by the api i'm using to get the data
past meteor
I'm currently on vacation so I won't be of any help but someone else could look
arctic wedgeBOT
Pasting large amounts of code
If your code is too long to fit in a codeblock in Discord, you can paste your code here:
https://paste.pythondiscord.com/
After pasting your code, save it by clicking the Paste! button in the bottom left, or by pressing CTRL + S. After doing that, you will be navigated to the new paste's page. Copy the URL and post it here so others can see it.
hollow sentinel
so the problem is that my request only collects for the state Alabama
but i want data for the years from 2021 all the way to 2013
the geojson data is something i have to get from someone's githubb
i have to merge all the geojson data together
and then save it to a file for the whole country of zipcodes
i need help doing it in an efficient way that doesn't murder my computer's RAM
so yeah it's a bit of a conondrum
my idea is to write a function that pulls the data from api loops through it until there are no more results, pulls all the data from years 2021 to 2013, and then processes the data in a pandas dataframe
once the dataframe is created, it'll be stored in a csv and then read and passed as an argument for the parameter df in the function plot_chloropeth_from_df_and_geojson
and then once that happens, it's going to be the entire map of the US with certain states highlighted
the problem before was that the geojson data did not have the zipcodes that were in the dataframe
which is why i found this: https://github.com/OpenDataDE/State-zip-code-GeoJSON

GitHub
Zip code boundaries for each of the 50 states. Contribute to OpenDataDE/State-zip-code-GeoJSON development by creating an account on GitHub.
i can also open a help channel too, if that's what's needed
but i feel like this is more of a data science question, so it's better here?
but i was thinking the first part should defo be collecting the data from the api
and then worrying about the json merge later on
because from what i can see, the json merge shouldn't be too bad...
at least i don't think so
hollow sentinel
oh goddamnit
import requests
import pandas as pd

BASE_URL = 'https://data.cms.gov/data-api/v1/dataset/{uuid}/data'

uuids = ['cf60c282-a006-444c-9705-268f68b8e96d',
         '635d7ccd-3dd7-4f1d-a82f-4bba7fe97509',
         'e70315f5-4b02-46a8-81f4-16035b8665ab',
         'ca9e33a4-e46c-4de9-8377-3bbcd25d24dd',
         'b61ba5eb-021b-4510-947e-0f198982b0e8',
         '09c12f06-e3fe-4cb0-81e9-945f2078c1df',
         '6f6d93e1-ecf8-4b93-9845-091faf20f274',
         'ef5bdbe1-27b4-4296-b320-52bd5d2183d7'
]

columns = ['column1', 'column2', 'column3']

data = []

for uuid in uuids:

  url = BASE_URL.format(uuid=uuid)

  params = {
    'column': columns,
    'limit': 100
  }

  offset = 0
  has_more = True

  while has_more:

    params['offset'] = offset

    response = requests.get(url, params=params)

    # Convert response to DataFrame
    df = pd.DataFrame(response.json())

    # Append DataFrame to list
    data.append(df)

    # Check for next link
    links = response.links
    if 'next' in links:
      has_more = True
      offset += 100
    else:
      has_more = False

# Concatenate list of DataFrames
df = pd.concat(data)

print(df.columns)
print(df["Rndrng_Prvdr_State_Abrvtn"])
states = df['Rndrng_Prvdr_State_Abrvtn'].unique()
print(states)
it only prints Alabama
why does it do that
i don't know how to fix this 😦
why is the api doc so bad
smh
 narrow fable
I did a neat mapping project like this once before
hollow sentinel
oh nice
yeah i thought it would be cool to show a distribution of zip codes
this is such a headache tho
narrow fable
oh yeah it took me forever

GitHub
Web Application displaying data from movies filmed in Vermont - GitHub - PythonButcher/VermontMoviesDashboard: Web Application displaying data from movies filmed in Vermont
hollow sentinel
nice
 pseudo pasture
Hello,
I need some advice. I have data from an APi and need to extract some data from its merchant name, amount and Category I need to validate it with SQL database. Do I need to USE any NLP Techniques or just simply Extract and match. Let me share data with you guys.
data is in json format as :
<
{
"account_id": "8MnWvqyMqGIllzoLj3LMs8zj9Z8P6lCZeEnJX",
"account_owner": null,
"amount": 25,
"authorized_date": "2023-07-28",
"authorized_datetime": null,
"category": ["Payment", "Credit Card"],
"category_id": "16001000",
"check_number": null,
"counterparties": [],
"date": "2023-07-29",
"datetime": null,
"iso_currency_code": "USD",
"location": {
"address": null,
"city": null,
"country": null,
"lat": null,
"lon": null,
"postal_code": null,
"region": null,
"store_number": null
},
"logo_url": null,
"merchant_entity_id": null,
"merchant_name": null,
"name": "CREDIT CARD 3333 PAYMENT *//",
"payment_channel": "other",
"payment_meta": {
"by_order_of": null,
"payee": null,
"payer": null,
"payment_method": null,
"payment_processor": null,
"ppd_id": null,
"reason": null,
"reference_number": null
},
"pending": false,
"pending_transaction_id": null,
"personal_finance_category": {
"confidence_level": "LOW",
"detailed": "LOAN_PAYMENTS_CREDIT_CARD_PAYMENT",
"primary": "LOAN_PAYMENTS"
},
"personal_finance_category_icon_url": "https://plaid-category-icons.plaid.com/PFC_LOAN_PAYMENTS.png",
"transaction_code": null,
"transaction_id": "3j8QLdkjdgS88QPDlMDnfkjqPeVnX7fZLbeJq",
"transaction_type": "special",
"unofficial_currency_code": null,
"website": null
}

 rancid mango
hi there. how long would it take to create a fully trained ML model. I know that the training data can be fetched from kaggle. But I wanted to know if its too hard or long... thanks
serene scaffold
rancid mango
hi there. how long would it take to create a fully trained ML model. I know that...
how long would it take to learn how to do it, or how long would it take for the training program to run?
echo mesa
Guys, is it recommended to do linear algebra and calculus in parallel? The way I'm doing it is for example I do calculus for a day and when I get "bored" I'll jump onto linear algebra and then visa versa, is this a good idea or should I stick with either of them and then once either of them has been mastered or learned I would switch to the other one?
rancid mango
serene scaffold
how long would it take to learn how to do it, or how long would it take for the ...
not learn but actually create it, and train it and then test it so then it can be deployed for use for my project basically, thanks for the reply
serene scaffold
rancid mango
not learn but actually create it, and train it and then test it so then it can b...
depends entirely on the algorithm and the amount of data. it could range from seconds to weeks.
rancid mango
serene scaffold
depends entirely on the algorithm and the amount of data. it could range from se...
okay no worries thanks
unique ether
Anyone ever use the msno.matrix function?
I'm using it right now and the resulting graph is terrible
All the y axis labels are unalligned so you can't see what they are for
narrow fable
serene scaffold
depends entirely on the algorithm and the amount of data. it could range from se...
also the computing power available
unique ether
What conclusions could I draw from this missingno matrix of my numerical data columns?
Obviously all the ones on the far right are linked
Also does anyone know a good package for Little's MCAR test
 timid dune
how should you go about learning ML?