#data-science-and-ml
1 messages · Page 83 of 1
 desert oar
and even in linear regression, you'll usually do fine by just including both features + their product (i.e. x1, x2, and x1 * x2)
for interpretation of why that works, look up "interaction" in linear models
 weak mortar
yes i heard about a 4 bit version that should work decent. but i dont know if a truncated version of 180b would be preferred over 40b. or maybe some other like llama would be a better fit. purpose is to mainly try out different things with it and see what its capable of, imagining both to train it on custom data , explore the potential of having a self hosted assistant
a family member is struggling with her memory, so my higher goal is also to build an assistant that can be trained on her personal documents and fed with all the things she stops to remember over time, calendar and everything basically
putting my 3060 ti cards to use that are just gathering dust also resonates with me
 misty flint
weak mortar
yes i heard about a 4 bit version that should work decent. but i dont know if a ...
misty flint
weak mortar
yes i heard about a 4 bit version that should work decent. but i dont know if a ...
both of those wont fit on consumer hardware just fyi.
weak mortar
The 4 bit It requires 180 gb of vram. So it would definitely be in the high end of 'consumer hardware'
I imagine the performance is in the sink if one uses vram+ cpu ram ( this method was described in the article, but i dont know anything really)
While what i cant run is good to know, what i can run is also of interest 🙂
 young granite
does one know bout a project which analyses audiofiles to find timestemps where 2 ppl speak at the same time?
What would be ur approach using CNN for classification?
Automate setting 0 for no voice over a threshold, 1 for all other and then manual labeling 2 for 2ppl?
 cunning crystal
young granite
does one know bout a project which analyses audiofiles to find timestemps where ...
cunning crystal
young granite
does one know bout a project which analyses audiofiles to find timestemps where ...
There are a lot of frameworks that provide diarization / speaker detection. https://github.com/pyannote/pyannote-audio is one of them. It also has "overlapped speaker detection", it says
young granite
cunning crystal
There are a lot of frameworks that provide diarization / speaker detection. http...
yeah found pyAudioAnalysis aswell might try out a few and wont even have to build it all myself ty
 granite mountain
I have a set of data that is being recorded at a devices max record rate roughly 120-140hz, and I need to normalize this down to 60hz. The original device records the timestamp w/ each datapoint. I want to do this a losslyly as possible, are there any numpy functions that can do this or do I need to manually divide the data into 60 buckets then take the avg of the points that are in that bucket?
desert oar
granite mountain
I have a set of data that is being recorded at a devices max record rate roughly...
you can do it with pandas pretty easily with resample, but there might be a clever way to do it in numpy using a convolution operator. otherwise yeah, just slice indices and average in each group
 past meteor
granite mountain
I have a set of data that is being recorded at a devices max record rate roughly...
past meteor
granite mountain
I have a set of data that is being recorded at a devices max record rate roughly...
 serene scaffold
.latex
$$P(A|B) = \frac{P(A \cap B}{P(B)}$$
Can anyone explain the intuition behind this? It isn't as obvious as things like "the probability of mutually exclusive events co-occuring is zero"
 strange elbowBOT
 serene scaffold
darn, missed a closing paren.
past meteor
granite mountain
I have a set of data that is being recorded at a devices max record rate roughly...
data = pl.read_csv("...")
normalized = data.group_by_dynamic("timestamp", every="0.0167s", start_by="datapoint").agg(pl.col("max_record_rate).mean())
Biggest question is if you want to pull in an entire dep to polars for 1 thing, I probably wouldn't 🤣 .
 agile cobalt
serene scaffold
.latex
```latex
$$P(A|B) = \frac{P(A \cap B}{P(B)}$$
Can anyone explain the intu...
agile cobalt
serene scaffold
.latex
```latex
$$P(A|B) = \frac{P(A \cap B}{P(B)}$$
Can anyone explain the intu...
not sure if it helps, but: if they were independent, P(A | B) would be just P(A)
(reasoning, but again, if they are independent):
P(A and B) is the same as P(A) * P(B) ; simply, the chances of both events happening at once is equal to the chance of both happening separately
1 / P(B) is just, well, that
P(A) * P(B) / P(B) = P(A)
The chances of A happening after B has happened are: The base chances of both events happening at the same time, divided by how likely it was for B having happened
serene scaffold
agile cobalt
The chances of A happening after B has happened are: The base chances of both ev...
thanks for the explanation. I still don't think I get why it's a division and not a multiplication.
agile cobalt
P(x) is always between 0..1 ; multiplying by it means that you are constraining your state to the chances of it happening, and the inverse operation for that ('freeing' from the constraint so to speak) is dividing by that chance
with a coin toss,
P(<heads, heads, heads>) = 0.5 * 0.5 * 0.5
P(<heads, heads, heads> | <heads, heads>) = P(heads) = (0.5 * 0.5 * 0.5) / (0.5 * 0.5)
though I imagine you would probably have to be a bit more formal to explain it for non-independent cases
serene scaffold
agile cobalt
`P(x)` is always between `0..1` ; multiplying by it means that you are constrain...
that's a really great way of putting it though 😄
past meteor
serene scaffold
.latex
```latex
$$P(A|B) = \frac{P(A \cap B}{P(B)}$$
Can anyone explain the intu...
Very hand-wavy:
It makes more sense to start reading the equation from the denominator. A given B means B must have happened. So we write down P(B) somewhere.
A given B also means we're also interested at the times where A happened so we need to consider P(A and B).
Now what's left is to see how they relate, the only ones that make sense are minus, div and prod.
**Insight 1: ** It cannot be P(A and B) - P(B). That's basically the zone where A occurs without B occurring. By process of elimination you have that it should be some sort of division or multiplication. (draw the venn-diagrams)
Insight 2: The reason why div makes sense is that you need to makes sense is that you're assessing the likelihood of A within the constraint of B. Division adjusts the scale, ensuring you're only measuring within the "area" of the given event B.
Insight 3: Since probabilities are 0 < P(x) < 1 you're "upscaling" within your new domain (B). prodwould make it smaller. (this is the crucial insight).
insight 4: Finally, notice how P(A1|B) + P(A2|B) + ... P(An|B) = 1 these are not your "original" probabilities, they are pieces of B.
Basically you have a cake (omega) and you take a B sliced piece out of it. Within this piece you look at how likely A is.
This is a surprisingly hard one to explain intuitively
serene scaffold
past meteor
Very hand-wavy:
It makes more sense to start reading the equation from the deno...
.latex
It is a lot easier to understand when you consider that $\frac{P(X)}{P(Y)} > P(X)$. Though I'm not sure what you're getting at with insight 4. Are $A_{1..n}$ all the events that could possibly co-occur with $B$?
 serene scaffold
I edited the latex but I can't make the bot re-render it

past meteor
Actually the 4th is the most important and the analogy is what it means in a strange way
agile cobalt
past meteor
Very hand-wavy:
It makes more sense to start reading the equation from the deno...
ensuring you're only measuring within the "area" of the given event B.
a pretty much zooming in / shrinking what you consider as the 'Universe'?
 past meteor
agile cobalt
> ensuring you're only measuring within the "area" of the given event B.
a pret...
past meteor
agile cobalt
> ensuring you're only measuring within the "area" of the given event B.
a pret...
spot on
serene scaffold
did you make that in paint just now?
agile cobalt
yes
serene scaffold
I appreciate it 
agile cobalt
I was also having a hard time visualising what they meant by it tbh
past meteor
You have this cake that has a bunch of fruit on it. You take a B sized slice. Now you're only looking at this slice B, what is the probability you have a cherry? You're not looking at the entire cake anymore, just our B sized slice. The probabilities here must sum up to one.
(Tell me if these analogies are making it worse)
EDIT: the drawing is much better at conveying this.
serene scaffold
past meteor
You have this cake that has a bunch of fruit on it. You take a B sized slice. No...
nope, makes sense you're no longer concerned with how probable it is that B actually happened. Just probabilities within the scope of B, taking it for granted.
agile cobalt
do you understand it now or still a bit unsure?
thought about some simple exercises but if not needed nvm
past meteor
The drawing is giving me shivers of good it is @agile cobalt! I always did venn-diagrams for these but I had no way of expressing this.
serene scaffold
past meteor
The drawing is giving me shivers of good it is <@256442550683041793>! I always d...
here's a jacket 
serene scaffold
agile cobalt
do you understand it now or still a bit unsure?
thought about some simple exerci...
Nope, all good 😄
past meteor
My uni loved these. It was a standalone course (uncertainty in AI) and they tried to jam these into all other ones as well. After computing these conditionals by hand you start dreaming in them.
 serene scaffold
past meteor
My uni loved these. It was a standalone course (uncertainty in AI) and they trie...
serene scaffold
past meteor
My uni loved these. It was a standalone course (uncertainty in AI) and they trie...
we had these in the course I took last semester. it was probably the only useful part of the course.
(and yes we had bayes rule in that course. but I never thought about it that hard.)
past meteor
Everyone had this one ML course that touches the surface of everything, there we had bayes nets and that was enough for me it's a good thing to know (of). Getting a full course was a step too far 🤣 . They also loved logic programming (prolog). They even created this cursed marriage called problog (probabilistic logic programming) which we all had to take etc etc https://dtai.cs.kuleuven.be/problog/ /soapbox over.
 gentle sedge
Could anyone point me in the direction of an ML model or stat-learning practice for continuous numeric feature selection (to 3 categorical labels), similar to a decision tree or RF, that has the potential to learn relationships between labels and relationships between estimators, rather than just label -> estimator. For example, it could identify that the difference between estimator 1 and 2, when > a certain threshold, indicates label A?
Sorry for the wordy question. Any suggestions appreciated.
desert oar
serene scaffold
.latex
```latex
$$P(A|B) = \frac{P(A \cap B}{P(B)}$$
Can anyone explain the intu...
P(A) is the % of the sample space covered by A. P(A & B) is the % of B covered by P(A). when you take the conditional probability P(A | B), you are treating B as a new sample space and re-scaling the probability accordingly.
@serene scaffold

P(A | B) is literally the portion of B covered by A, which we restrict to the region of A that overlaps with B, which is precisely what we mean by A ∩ B
desert oar
gentle sedge
Could anyone point me in the direction of an ML model or stat-learning practice ...
you usually don't want to perform feature selection in the sense of removing unneeded features from a large number of candidates. that said, i don't think i understand the actual goal you are trying to achieve and you might need to clarify
desert oar
past meteor
Everyone had this one ML course that touches the surface of everything, there we...
👀 probabilistic prolog
serene scaffold
desert oar
`P(A)` is the % of the sample space covered by `A`. `P(A & B)` is the % of `B` c...
thank you
gentle sedge
desert oar
you usually don't want to perform feature _selection_ in the sense of removing u...
in terms of best practice? I'd like to see if there are any underlying relationships between numeric predictors and a categorical label (3 classes), and if possible, relationships between the label and interactions between predictors. For example, identifying the fact that when predictor A is > predictor B.... class 1 of the label is most likely
I could make new predictors and equate them to relationships between others (for example, a categorical predictor for when two others meet the A > B condition), but am just curious about the extent of some ML/SL model capabiltiies
 iron basalt
serene scaffold
.latex
```latex
$$P(A|B) = \frac{P(A \cap B}{P(B)}$$
Can anyone explain the intu...
iron basalt
serene scaffold
.latex
```latex
$$P(A|B) = \frac{P(A \cap B}{P(B)}$$
Can anyone explain the intu...
P(A and B) gives you the intersection in a table / diagram, P(A given B) changes the shape of the table / diagram to be focused only on the parts that have B (in table form, this shaves away everything except the row / column containing B).

Multiplication being the opposite of division sort of undoes the focus on just B (given it was divided by P(B)) (adding rows / columns to the table), and after doing so, it appears as a regular intersection (P(A and B)).
 rare ferry
I have a customer spending db with multiple rows for the same customer. I would like to perform customer segmentation. How can i do it when a customer has multiple values?
serene scaffold
rare ferry
I have a customer spending db with multiple rows for the same customer. I would ...
what do you mean by segmentation?
iron basalt
iron basalt
P(A and B) gives you the intersection in a table / diagram, P(A given B) changes...

(Conditional changes table shape)
serene scaffold
rare ferry
I have a customer spending db with multiple rows for the same customer. I would ...
if I understand what "segmentation" means in this context, you can make the segments using customer IDs instead of just assigning rows to segments randomly.
serene scaffold
iron basalt
P(A and B) gives you the intersection in a table / diagram, P(A given B) changes...
thank you for this  I'm signing off soon, but I'll give this a second pass tomorrow.
iron basalt
Bonus, kinda sus: https://en.wikipedia.org/wiki/File:Bayes_theorem_assassin.svg

(Bayes theorem)
iron basalt
iron basalt
Multiplication being the opposite of division sort of undoes the focus on just B...
Note the edit, had it the wrong way around (multiplication / division swapped).
I swapped them because the question is asking it from the POV of dividing P(A and B) by P(A). I usually view it the other way around to make sense of it: P(A and B) = P(B)P(A|B).
(If they are exclusive, the P(A|B) becomes just P(A) (if I flip a coin given I flipped another that does not affect it, it's just the same as probability not given the first flip))
weak mortar
wow its so slow 💀 falcon7b instruct on a 3060 ti
 desert oar
gentle sedge
in terms of best practice? I'd like to see if there are any underlying relations...
desert oar
gentle sedge
in terms of best practice? I'd like to see if there are any underlying relations...
"underlying relationships" sounds like you're interested in causality. that is, you don't care so much about predicting Y as you care about understanding what causes Y. is that right?
if so, you're in for a harder time, and no, you can't in general determine causality by looking at associations within a model
otherwise, i'd like to understand your actual objective before making a recommendation
rare ferry
serene scaffold
if I understand what "segmentation" means in this context, you can make the segm...
Basically the same customer id has multiple values, meaning the same customer has spend multiple times. Usually for customer segmentation, doesn't every customer have a single value in the db?
 modern tundra
Hello everyone I know it's too much to ask but is there any chance possible that someone can help me build a automated document classification system
 tacit basin
modern tundra
Hello everyone I know it's too much to ask but is there any chance possible that...
tacit basin
modern tundra
Hello everyone I know it's too much to ask but is there any chance possible that...
What documents do you want to classify ?
modern tundra
tacit basin
What documents do you want to classify ?
i want to classify pdfs or articles maybe into their types
tacit basin
modern tundra
i want to classify pdfs or articles maybe into their types
Pdfs either using computer vision or ocr to text first?
Other articles what format?
 sharp matrix
Hey! I've got a list of members in a roster for a team.
['Bob', 'Alice', 'Dave', 'Jim', 'Jordan']
These 5 can be mixed in any way of teams of 3 (numbers have been scaled down). What I would like to do is cluster the teams based on how similar they are.
For example
['Alice', 'Jim', 'Jordan'] = Label 2
['Dave', 'Alice', Jordan'] = Label 1
['Dave', 'Jim', 'Jordan'] = Label 3```
What I've tried is basically creating a OneHotEncoder that turns the names into numbers
```['1', '2', '3'] = Label 1
['2', '4', '5'] = Label 2
['3', '2', 5'] = Label 1
['3', '4', '5'] = Label 3```
Then I need some sort of distance metric for the vectors, that doesn't take ordering into account.
I tried kmeans but pretty sure that's not fit for purpose because numbers that are close have nothing to do with each other and ordering doesn't matter
Any ideas for a algorithm I could use in this scenario? jaunty helm
sharp matrix
Hey! I've got a list of members in a roster for a team.
`['Bob', 'Alice', 'Dave'...
jaunty helm
sharp matrix
Hey! I've got a list of members in a roster for a team.
`['Bob', 'Alice', 'Dave'...
Set intersection?
Jaccard Index for example

The Jaccard index, also known as the Jaccard similarity coefficient, is a statistic used for gauging the similarity and diversity of sample sets.
It was developed by Grove Karl Gilbert in 1884 as his ratio of verification (v) and now is frequently referred to as the Critical Success Index in meteorology. It was later developed independently by P...
sharp matrix
That makes sense, can I then cluster the values using the product of the intersection?
sharp matrix
jaunty helm
Set intersection?
Ah I see, I can use HAC but with the Jaccard distance metric, I'll give that a go!
 sleek harbor
how would you interpret Precision score: 80.16% (±4.58%)? What I mean is 80.16 give or take 4.58 percentage points. So, for example, the top bound would be 80.16+4.58=84.74%. However I fear it might be interpreted as 80.16 give or take 4.58 percent, meaning 80.16+(4.58*80.16/100)=83.83.. Was thinking of doing 80.16% (±4.58pp), but idk how common the abbreviation of "percentage point" as "pp" is..
past meteor
sleek harbor
how would you interpret `Precision score: 80.16% (±4.58%)`? What I mean is 80.16...
standard deviation usually
sleek harbor
past meteor
standard deviation usually
so.. as intended basically? using a "%" won't lead to any confusion?
past meteor
Nope you're fine I think
 tidal bough
sleek harbor
how would you interpret `Precision score: 80.16% (±4.58%)`? What I mean is 80.16...
tidal bough
sleek harbor
how would you interpret `Precision score: 80.16% (±4.58%)`? What I mean is 80.16...
you could do (80.16±4.58)% to avoid ambiguity, I guess.
sleek harbor
tidal bough
you could do `(80.16±4.58)%` to avoid ambiguity, I guess.
that's genius
could I do 80.16±4.58(%) tho? 🤔
tidal bough
i'd find that more confusing than the original
sleek harbor
"said the confused reptile" :3
tidal bough
and may well assume that it means a "relative std" of 4.58%, so an absolute one of 80.16% * 4.58% :p
sharp matrix
jaunty helm
Set intersection?
Thanks for the recommendation - 've got somewhere, but I don't think it's doing what I expect.
For example
>>> test = [[356, 380, 366, 368, 367, 347, 355, 338, 341, 0], [403, 349, 372, 348, 344, 361, 375, 356, 0, 0]]
>>> pdist(test, metric="jaccard")
array([1.])
If I change some of the test values to match notably the back ones of vector B
>>> test = [[356, 380, 366, 368, 367, 347, 355, 338, 341, 0], [403, 349, 372, 348, 344, 366, 380, 356, 0, 0]]
>>> pdist(test, metric="jaccard")
array([1.])
It's still one. Any idea why that would be?
It's taking the position into account - Damn
I've tried each distnace metric here but with all seem to take into account ordering : https://docs.scipy.org/doc/scipy/reference/spatial.distance.html#module-scipy.spatial.distance
>>> test_similar_order = [[356, 380, 366, 368, 367, 347, 355, 338, 341, 0], [356, 380, 372, 348, 344, 361, 375, 356, 0, 0]]
>>> pdist(test_similar_order, metric="jaccard")
array([0.77777778])
>>> test_diff = [[356, 380, 366, 368, 367, 347, 355, 338, 341, 0], [403, 349, 372, 348, 344, 361, 375, 356, 0, 0]]
>>> pdist(test_diff, metric="jaccard")
array([1.])
I believe the ones like jaccard are meant to be used on boolean vectors (one-hot-encoded sets)
tidal bough
sharp matrix
That makes sense, can I then cluster the values using the product of the interse...
you could do something basic like np.setxor1d? Though you'd have to use it like pdist(test_similar_order, lambda a, b: np.setxor1d(a, b).size / np.union1d(a, b).size) which is rather inefficient (relies on a lambda)
sharp matrix
Ah okay, that's rough as there are over a thousand labels I would have to encode
Looks good, let me give that a shot
The distances aren't large enough so everything get's clustered the same, but there definitely is a difference in the distance. Thanks @tidal bough
tidal bough
this distance goes between 0 and 1
(and in fact for two random arrays it'll be around 0.5, to get 1 you need, like, one of the arrays to be empty)
sharp matrix
Yeah that's weird, a 2 element change only changes it by .08
>>> test_similar_order = [[356, 380, 366, 368, 367, 347, 355, 338, 341, 0], [356, 380, 372, 348, 344, 361, 375, 356, 0, 0]]
>>> pdist(test_similar_order, lambda a, b: np.setxor1d(a, b).size / np.union1d(a, b).size)
array([0.8])
>>> test_diff = [[356, 380, 366, 368, 367, 347, 355, 338, 341, 0], [403, 349, 372, 348, 344, 361, 375, 356, 0, 0]]
>>> pdist(test_diff, lambda a, b: np.setxor1d(a, b).size / np.union1d(a, b).size)
array([0.88235294])
I can play around with some np functions and see where I get
Any reason why you decided to divide the XOR with the union? Just curious
tidal bough
To normalize it - otherwise the distance can be arbitrarily large for two big arrays
sharp matrix
Great, thanks @tidal bough - I'll play around with it but this has been helpful
weak mortar
good morning, can someone point me in the direction of how i can use multiple GPUs when using torch/langchain/hugginface ? (i have two, it is using one)
input_ids = tokenizer(prompt, return_tensors="pt").input_ids
input_ids = input_ids.to(model.device)
with torch.inference_mode():
    outputs = model.generate(
        input_ids=input_ids,
        generation_config=generation_config,
    )
it was actually not using the gpu at all. realize i have to install cuda toolkit 🫣
tidal bough
weak mortar
it was actually not using the gpu at all. realize i have to install cuda toolkit...
That shouldn't be the case for torch - it bundles its own cuda and doesn't care about the system one.
(make sure you got the GPU version, though - see the get started on the torch site, it needs a nonobvious pip command)
(no idea about whether langchain/huggingface need global cuda)
weak mortar
oh yea i see, i uninstalled torch and did pip3 install torch torchvision torchaudio --index-url https://download.pytorch.org/whl/cu118 instead so it installs the cuda toolkit itself, and then i also had to install bitsandbytes-windows . it seems it is using both GPUs, but a simple "hi" prompt took 244 seconds, compared to ~30 sec on CPU :/
i wasnt actually using langchain anyways, i had just loaded them from the tutorial i was doing. now full focus is just on achieving speed on a simple prompt. i believe that im doing something wrong
 novel jay
there are so many messages in here
weak mortar
i've observed this phenomenon before in various chatrooms
serene scaffold
!voicemute 1065426205769207909 "1 week" Any messages sent only to get your message count up are considered spam.
 arctic wedgeBOT
:incoming_envelope: :ok_hand: applied voice mute to @novel jay until <t:1696522030:f> (7 days).
 charred imp
hi
i am trying to build ai bot for trading
it is clear that most of the youtube videos about making huge profits using ai bot totally fake
but i believe if any person can do trading only %1 profit per day
we can do it with an ai bot for implement instead of us
I will use python mainly
agile cobalt
charred imp
but i believe if any person can do trading only %1 profit per day
you realize that a very large percentage of people have a negative profit right?
charred imp
i have a little bit trust a youtube channel called tradinglab . They made an ai bot which can make a profit about %5 profit in a month(i know it is really small rate...)
charred imp
agile cobalt
you realize that a **very** large percentage of people have a negative profit ri...
yes
but i was mentioning on prefessionalls .
charred imp
wtf i am not joking
charred imp
 cold osprey
its not april 1 yet
cold osprey
its not april 1 yet
which part do you think it is a joke
charred imp
agile cobalt
you realize that a **very** large percentage of people have a negative profit ri...
because majority of people is stupid like every other topics
they have no tactics
no strategy
 north rain
every person who goes into trading thinks they're the one with the real winning strategy, just as a heads up 🙃
charred imp
i am physics undergraduate student.I am astonished by ai but not the coding part but math
i believe there is exist an combination of tactics we can
tidal bough
charred imp
i have a little bit trust a youtube channel called tradinglab . They made an ai ...
about %5 profit in a month(i know it is really small rate...)
no, it's not. it's like 80% per year, fully automated. i'm pretty sure that's "ridiculously high". one could perhaps even say "unbelievable" :p
charred imp
and we can do it an ai for performing for us even trades are manipulated
charred imp
tidal bough
> about %5 profit in a month(i know it is really small rate...)
no, it's not. it...
i do not have huge capital so...
tidal bough
anyway, I think you should consider the fact that algorithmic trading has been a thing for a long time and there's tons of people working in it. So it'd be fairly surprising if a person with neither finance nor CS experience were to figure out a way to outperform, well, a world's worth of people with both.
cold osprey
charred imp
i am physics undergraduate student.I am astonished by ai but not the coding part...
so was i (just the physics undergrad), but ye
charred imp
tidal bough
anyway, I think you should consider the fact that [algorithmic trading](<https:/...

I gave an AI bot $30,000 to trade stocks for me. The results, well, they were pretty interesting...
If you learned something new, leave a like!
🔥 My private Indicator: https://tradinglab.ai/
💵 HankoTrade (Where I Trade Forex): https://login.hankotrade.com/register?franchiseLead=MjQxNg==
🚀 Webull: https://a.webull.com/i/TradingLab
💬 My Trad...
charred imp
tidal bough
anyway, I think you should consider the fact that [algorithmic trading](<https:/...
i have a little bit cs experience
cold osprey
i watched like 3 mins of the video
hes basically just automating trades based on predefined strategies
nothing AI about it
charred imp
i dont know i am not an expert
i only know a few algorithms
classification
regression
i just know if i can find a correct combination of strategy
i can write algorithms
it includes serious work on math , coding and of course trading
if a person can do it
cold osprey
okay buddy
charred imp
ai can do it
cold osprey
good luck
charred imp
thanks
 fallow frost
anybody here has used DuckDB on an S3 dataset?
I'm trying to query a pyarrow.dataset('s3://data') trough duckdb (version 0.8), but I keep getting an empty dataframe
(even after double checking that the bucket/dataset contains the data)
and if I just do dataset.take(first_ten) with pyarrow; it works
 left tartan
fallow frost
anybody here has used DuckDB on an S3 dataset?
left tartan
fallow frost
anybody here has used DuckDB on an S3 dataset?
Yes, I’m on my phone, but I suggest just asking on the Duckdb discord, they have a Python channel
Also, 0.9.0 released this week
With an updated aws extension
 hollow wind
Hi how to start learning data science. Couldn't find right resources
past meteor
hollow wind
Hi how to start learning data science. Couldn't find right resources
Very broad question, it depends on what you already know.
You can't do wrong with starting with kaggle.com
hollow wind
I only know python and oops
past meteor
hollow wind
I only know python and oops
Practical data skills you can apply immediately: that's what you'll learn in these no-cost courses. They're the fastest (and most fun) way to become a data scientist or improve your current skills.
hollow wind
Thanks will look into this
 grand minnow
hollow wind
Hi how to start learning data science. Couldn't find right resources
grand minnow
hollow wind
Hi how to start learning data science. Couldn't find right resources
After learning from kaggle and maybe doing one capstone project, try https://course.fast.ai next
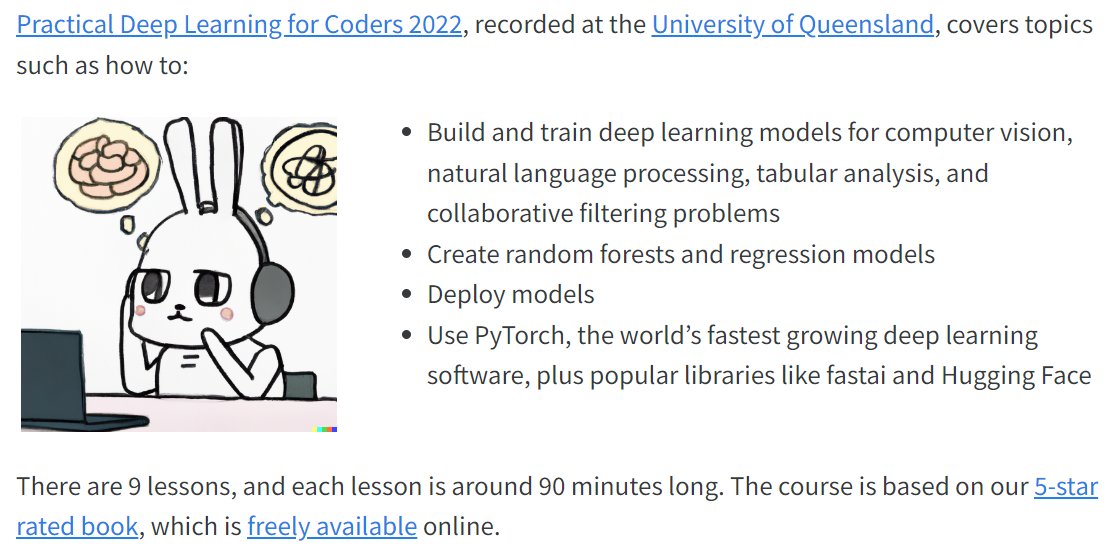
A free course designed for people with some coding experience, who want to learn how to apply deep learning and machine learning to practical problems.
 grand breach
if I copy a conda environment manually and try fixing the path prefixes will it work ?
grand breach
I mean I thought it was easier
grand breach
cold osprey
but why?
is there a way to fix prefixes manually ?
cold osprey
fix what
past meteor
grand breach
I mean I thought it was easier
It's easier to make a requirements file and install it from there
 sterile heath
The news here was just "ooga booga ai violates copyright", as if that whole thing wasn't a thing, what, a year ago? A bit behind the ball on our talking points, aren't we, national broadcasting company?
 verbal oar
how to code partial derivative in code, does one's must just hardcode it?
I know this is done automatically but just curious about it under the hood
because its different from doing it on paper
past meteor
verbal oar
how to code partial derivative in code, does one's must just hardcode it?
Do you mean:
- How does the partial derivative of autograd systems like Torch, Jax, ... work?
- How do you code a partial derivative in general (like you did in math class)
past meteor
You can just take the equation (say mean squared error) and write out what the partial derivative is on paper
verbal oar
hmm so if there is ratio in case of derivative so I could do in similar way with partials?
past meteor
And then you code that up in numpy
verbal oar
f(x+h) - f(x) / h
I'm little confused because in math class I used rules
like x^2 -> 2x
ok so its just about hardcoding partials?
and because its not convinient just use autodiff
past meteor
You pretty much got it
past meteor
verbal oar
like x^2 -> 2x
If you write all these partials you get a vector right
 hazy knot
Is there a difference between median normalization and median centering, and if so, what?
past meteor
@wooden sail I need your expertise.
I'm still looking at good smoothing algorithms that can be used in real-time/online that preferably can be fit on the go or are completely online (like exponential smoothing)
 wooden sail
the answer to 2.) is 1.)
ah your question was about filtering, not the previous discussion 😛
past meteor
I know I can Fourier transform all my data once and remove high frequencies but I'm then leaking data I believe
I can defer this to the big box called "further research" by leaking data and being explicit about it in our work (our client doesn't mind this) but ideally there's some online version of Kallman filtering K don't know of
wooden sail
you can fourier transform short windows of data, which goes by the names short time fourier transform and periodogram/spectrogram depending on who you ask
but doing this results in gaps in your filtering at the edges of the time windows
past meteor
Hmm I might be okay with that. I'll have to look it up. This is nearly always the case anyway
I have a sensor that saturates at a given value but it also unnaturally jumps there as well (and stays for a long time). Another idea would be to isolate all cases where I'm certain it is incorrect data and interpolate 🤷
Thanks!
 frozen fox
Has anyone played around with pytorch-forecasting before? Pulling my hair out over trying to adapt the tutorials. Stuck in a weird no-mans land between "Can build a simple multivariate, multioutput pytorch LSTM for predicting things like stock data" and "can use an off the shelf model for the same". This is supposed to be my bread and butter but I'm lost in the woods and there seems to be 0 help out there outside of the 4 official tutorials which seem really rigid unless I am already deep in the understanding of the specific model, which rather defeats the point of an off the shelf solution.
grand breach
past meteor
It's easier to make a requirements file and install it from there
i went with conda pack and took a backup of my envs instead
 obtuse ruin
ayo, can i run a scenerio by you guys real quick to consider for a model, im looking for ideas on how to approach an issue
why am i asking, imma post the scenerio anyway.
Imagine you're trying to predict wages for union works, you have all these performance metrics that can indicate how well someone is doing from poor to very good
But the wage growth with each increase in skills may be non-linear, so the difference between a poor to mid worker in terms of raise is not nearly as much as mid - very good type of worker. But, if a very good worker regresses and a company feels like that raise was a bad idea, union rules require that a pay cut cant be over 20%. But, the performance of this very good worker is indicative of a worker who'd be paid the wage in the "Bad" scale. But due to wage restrictions, a company cant cut them to that pay range. Meaning, the model gets very confused.
You know what I mean? How do I account for this rigidity? where one year a person can be really good, get an appropiate raise that makes sense, but the next year be really bad but will still make a wage not indicative of their actual skill
This is a methods question, I dont know how to account for this, I dont think analyzing margins is the answer either
The key would to have the model know how much it can deduct pay I guess. There is no upper raise limit, only a deduction limit
 odd meteor
Interested in joining a research project on Data Selection in training LLMs? You can find the details of the project and the application form here: https://docs.google.com/forms/d/e/1FAIpQLSfLrefPl5PC1eJik37KrctBSqV0pANigHHcYqJuDpGYiQGI0Q/viewform
Selections will be made by the end of this week.

Google Docs
Hi everyone,
We are starting a research project on data selection for fine-tuning large language models. We have an experimentation plan for this project and we would like to open up the collaboration to two community members.
What question do we want to answer?
When fine-tuning language models with instruct data, what is the optimum subset of...
desert oar
odd meteor
Interested in joining a research project on Data Selection in training LLMs? You...
can you clarify who "we" is here? and what kinds of work would an applicant be expected to contribute?
 somber hamlet
Hello, I'd like to know if it's possible to extend a subplot size so it fits all the place it needs, without stretching the image. Basically add more padding in the background, so that ylabel is aligned with the rest.
(grid and ticks only here for debugging)

I guess I could manually compute the required aspect ratio and add padding accordingly to the image https://stackoverflow.com/questions/43391205/add-padding-to-images-to-get-them-into-the-same-shape
I was hoping for a simpler solution
 magic dune
 small wedge
ooh thanks for the link
magic dune
small wedge
ooh thanks for the link
it is a little old but such good explanations
 grave summit
hi guys
quick question
let's assume i have a pandas dataframe containing one column and another containing 5, each column has a name
when i concat them, how can i keep the column names in the new dataframe ?
when i concat the columns names are just indexed from 0 to 5
the columns are all of same length containing real numbers
serene scaffold
@grave summit please show both dataframes by doing print(df.head().to_dict('list')) for both and put the text in the chat.
grave summit
          price
0      -0.513769
1     -13.496242
2     -17.666214
3     -15.711187
4     -12.631159
...          ...
8755  317.302857
8756  281.557200
8757  252.873890
8758  234.627928
8759  219.377928
first one
      simulation #0  simulation #1  simulation #2  simulation #3  simulation #4
0         -0.513769      -0.513769      -0.513769      -0.513769      -0.513769
1        -13.501275     -13.492912     -13.499099     -13.498525     -13.495679
2        -17.675157     -17.663440     -17.683095     -17.665653     -17.665477
3        -15.720534     -15.707399     -15.725956     -15.706772     -15.712207
4        -12.639418     -12.633580     -12.640976     -12.629186     -12.631331
...             ...            ...            ...            ...            ...
8755     324.690119     307.777715     331.114169     310.618798     310.500812
8756     288.033801     273.155046     293.932057     275.518979     275.620071
8757     258.779436     245.336347     263.993376     247.504806     247.523361
8758     240.072935     227.627574     244.967196     229.569774     229.572015
8759     224.393548     212.788495     229.074304     214.655675     214.510769
second one
and the concat one
serene scaffold
That's not what I told you to do, but I'll see how far we can get without the actual information I asked for.
anyway, it looks like that you're trying to do, put another way, is add price as a column to the second dataframe.
second_df['price'] = first_df['price']
pretty sure that's all you'd need to do.
grave summit
perfect, let me try
ah one last thing
how can i get the price column to be the first one ?
in the second_df
serene scaffold
grave summit
how can i get the price column to be the first one ?
you usually don't care about aesthetic things like that until the last possible second. as far as the actual data is concerned, column order usually isn't semantically important.
but if you're sure that you need that, I guess you can go back to using concat. can you show what code you had to do concat previously?
grave summit
yes sure
df = pd.concat((df,pd.DataFrame(sim_prices)),keys = ['price', sim_prices.keys], ignore_index=True,axis=1)
sim_prices is a dict
serene scaffold
a dict of what?
is one value a pandas object (Series or DataFrame), and the rest are python objects (lists, strings, etc)?
because if that's the case, we need to back up to prevent that from happening.
@grave summit
grave summit
grave summit
```
price
0 -0.513769
1 -13.496242
2 -17.666214
3 -15...
df is this one
grave summit
grave summit
```
simulation #0 simulation #1 simulation #2 simulation #3 simulation...
sim_prices is this one, but as a dict with the column names as keys and the column values as a list of values for each column
serene scaffold
remember that dict.keys is a method, not an attribute. so ['price', sim_prices.keys] is a list of two items where the first is a string and the second is a function (not the value returned by the function)
so that won't do what you want
anyway
what happened when you ran pd.concat((df,pd.DataFrame(sim_prices)),keys = ['price', sim_prices.keys], ignore_index=True,axis=1) @grave summit?
grave summit
i got this
               0           1           2           3           4           5
0      -0.513769   -0.513769   -0.513769   -0.513769   -0.513769   -0.513769
1     -13.496242  -13.501446  -13.496666  -13.495962  -13.496763  -13.498303
2     -17.666214  -17.671117  -17.663385  -17.667988  -17.668879  -17.672129
3     -15.711187  -15.716338  -15.719165  -15.713032  -15.708605  -15.714106
4     -12.631159  -12.633609  -12.639797  -12.634414  -12.629251  -12.637608
...          ...         ...         ...         ...         ...         ...
8755  317.302857  336.296708  328.107085  310.308771  314.507559  321.370589
8756  281.557200  298.413742  291.232978  275.370928  279.038959  285.132271
8757  252.873890  267.846895  261.591095  247.284280  250.605032  256.036273
8758  234.627928  248.443945  242.655179  229.439094  232.571831  237.584240
8759  219.377928  232.334670  226.778813  214.564159  217.451393  222.259252
notice the 0 1 2 3 4 5
as column names
that's what i wanna change
serene scaffold
try removing ignore_index=True, since the column names are the index for axis 1.
grave summit
NotImplementedError: Writing to Excel with MultiIndex columns and no index ('index'=False) is not yet implemented.
i get an error
serene scaffold
okay, that happens further down
because concatenating two dataframes can't possibly cause Excel-related errors
serene scaffold
@grave summit please run this code, and then copy/paste the result into the chat.
sim_df = pd.DataFrame(sim_prices)
print(df.head().to_dict('list'))
print(sim_df.head().to_dict('list'))
It must be this exactly.
grave summit
{'prezzo': [-0.5137689068847919, -13.496241509949698, -17.666214113037796, -15.711186716208744, -12.631159319561903]}
{'simulation #0': [-0.5137689068847919, -13.497856865551888, -17.666647959288508, -15.716252319885847, -12.631143836613171], 'simulation #1': [-0.5137689068847919, -13.497112399888067, -17.664222851919916, -15.711149783696284, -12.62307252276926], 'simulation #2': [-0.5137689068847919, -13.493474146112233, -17.658044571364826, -15.70310529254211, -12.622963723108391], 'simulation #3': [-0.5137689068847919, -13.501485948278617, -17.661489704869712, -15.70574810400008, -12.628366028354055], 'simulation #4': [-0.5137689068847919, -13.497205573918135, -17.677365267785206, -15.716401837119992, -12.632395646319564]}
prezzo is price in italian
serene scaffold
@grave summit keep the sim_df variable, but delete the print statements.
look at what happens if you do this:
sim_df = pd.DataFrame(sim_prices)
new_df = pd.concat((df, sim_df), ignore_index=True, axis=1)
print(new_df)
               0           1           2           3           4           5
0      -0.513769   -0.513769   -0.513769   -0.513769   -0.513769   -0.513769
1     -13.496242  -13.498972  -13.486244  -13.494394  -13.497973  -13.502755
2     -17.666214  -17.669963  -17.655085  -17.667412  -17.668562  -17.674835
3     -15.711187  -15.714899  -15.705267  -15.703569  -15.715315  -15.716045
4     -12.631159  -12.634840  -12.623933  -12.626908  -12.633617  -12.632754
...          ...         ...         ...         ...         ...         ...
8755  317.302857  325.249086  320.584979  333.488367  316.915854  312.842870
8756  281.557200  288.590899  284.501862  295.944045  281.215181  277.705939
8757  252.873890  259.207544  255.574812  265.909591  252.508031  249.408218
8758  234.627928  240.501512  237.064207  246.736913  234.280974  231.437805
8759  219.377928  224.909850  221.692687  230.676044  219.132384  216.492208
so, the values are where you want them to be. do you see what's wrong, and why?
serene scaffold
right
grave summit
instead i got 0 1 2 3 4 5
do i see what's wrong ?
i think we are overriding something
serene scaffold
we are
grave summit
what about the keys option?
serene scaffold
we don't want that.
grave summit
what do we want then?
serene scaffold
do this
sim_df = pd.DataFrame(sim_prices)
new_df = pd.concat((df, sim_df), axis=1)
print(new_df)
yw
 dusty valve
from scipy.linalg.blas import zaxpy, caxpy, daxpy
import numpy as np

arr1 = np.array((-3, -2, -1, 0, 1, 2, 3, 4, 5))

arr3 = np.zeros(arr1.shape, dtype=np.uint8)

arr1 = arr1*1j
print(caxpy(a=abs(arr1), x=arr1, y=arr3 ), '\n')

arr1 = np.array((-3, -2, -1, 0, 1, 2, 3, 4, 5))
arr3 = np.zeros(arr1.shape, dtype=np.uint8)
arr1 = arr1*1j
print(((abs(arr1)*arr1)+arr3))```Outputs
outputs ```
[0. -9.j 0. -6.j 0. -3.j 0. +0.j 0. +3.j 0. +6.j 0. +9.j 0.+12.j 0.+15.j]
[0. -9.j 0. -4.j 0. -1.j 0. +0.j 0. +1.j 0. +4.j 0. +9.j 0.+16.j 0.+25.j]```
Zaxpy from blas and regular numpy outputs different results
Why?
They are given the same params
What is going on
left tartan
It's this. The abs function, I think: print(((abs(arr1)*arr1)+arr3))
I'm confused. Changing it to arr1[0] actually makes the results match, but now I don't know which one is right
left tartan
dusty valve
```py
from scipy.linalg.blas import zaxpy, caxpy, daxpy
import numpy as np
arr1...
If you change last line to print(((abs(arr1[0])*arr1)+arr3)), the results match (but I dont think is right)
Yah, if you do something like: ```py
from scipy.linalg.blas import zaxpy, caxpy, daxpy
import numpy as np
arr1 = np.array((-3, -2, -1, 0, 1, 2, 3, 4, 5), dtype=np.complex128)
arr3 = np.zeros(arr1.shape, dtype=np.complex128)
arr1 = arr1 * 1j
print(caxpy(a=1, x=arr1, y=arr3 ), '\n')
arr1 = np.array((-3, -2, -1, 0, 1, 2, 3, 4, 5), dtype=np.complex128)
arr3 = np.zeros(arr1.shape, dtype=np.complex128)
arr1 = arr1*1j
print((arr1+arr3))
I need the abs multiply though
left tartan
dusty valve
I need the abs multiply though
Yah, I'm just trying to isolate the issue
dusty valve
Alr
left tartan
Isn't a supposed to be scalar? https://docs.scipy.org/doc/scipy/reference/generated/scipy.linalg.blas.caxpy.html
left tartan
dusty valve
Alr
Yah, caxpy requires a scalar multiplier: https://www.netlib.org/lapack/explore-html/da/df6/group__complex__blas__level1_ga9605cb98791e2038fd89aaef63a31be1.html
dusty valve
Bruh
 obtuse yacht
from datasetFromJSON import x_train, y_train, x_test, y_test, num_class
from keras.models import Sequential
from keras.layers import Dense, Dropout, BatchNormalization, LeakyReLU, Flatten, Activation
from keras.optimizers import Adam
from keras.callbacks import EarlyStopping, ModelCheckpoint
from keras.losses import categorical_crossentropy
from keras.initializers import he_normal
from keras.regularizers import l2


def prediction_model(input_shape:tuple):
    model = Sequential()
    model.add(Flatten(input_shape=input_shape))
    model.add(Dense(65, activation='relu', kernel_initializer=he_normal(), kernel_regularizer=l2(0.01)))
    model.add(Dense(60, activation='relu', kernel_initializer=he_normal(), kernel_regularizer=l2(0.01)))
    model.add(Dense(55, activation='relu', kernel_initializer=he_normal(), kernel_regularizer=l2(0.01)))
    model.add(Dense(50, activation='relu', kernel_initializer=he_normal(), kernel_regularizer=l2(0.01)))
    model.add(LeakyReLU())
    model.add(BatchNormalization())
    model.add(Dense(20, activation='relu', kernel_initializer=he_normal()))
    model.add(Dense(num_class))
    model.add(Activation('softmax'))
    return model


input_shape = x_train.shape[1:]

model = prediction_model(input_shape=input_shape)

model.compile(optimizer=Adam(learning_rate=0.001),  loss=categorical_crossentropy, metrics=['accuracy'])

early_stopping = EarlyStopping(monitor='val_loss', patience=5, restore_best_weights=True)
model_checkpoint = ModelCheckpoint('./checkpoints/model.h5', save_best_only=True, monitor="val_accuracy", mode="max")

model.fit(x_train, y_train, batch_size=64, epochs=50, callbacks=[early_stopping, model_checkpoint], validation_data=(x_test, y_test))
what is the bst model architecture when working of Fast Fourier Transforms of alpha, gamma, and beta waves?
I currently have a validation accuracy of 26%, can someone help improve that
    alpha_min_freq = 8 / 100
    alpha_max_freq = 12 / 100
    beta_min_freq = 12 / 100
    beta_max_freq = 30 / 100
    gamma_min_freq = 30 / 100
    gamma_max_freq = 100 / 100

    alpha_waves =  beta_waves = gamma_waves =  []

    for command in data_file:
        for waves in data_file[command]:

            fft_result = np.fft.fft(waves)
            frequencies = np.fft.fftfreq(len(fft_result))

            alpha_mask = (frequencies >= alpha_min_freq) & (frequencies <= alpha_max_freq)
            beta_mask = (frequencies >= beta_min_freq) & (frequencies <= beta_max_freq)
            gamma_mask = (frequencies >= gamma_min_freq) & (frequencies <= gamma_max_freq)

            alpha_wave = np.abs(fft_result[alpha_mask])
            beta_wave = np.abs(fft_result[beta_mask])
            gamma_wave = np.abs(fft_result[gamma_mask])

            alpha_waves.append((alpha_wave, command))
            beta_waves.append((beta_wave, command))
            gamma_waves.append((gamma_wave, command))

    return alpha_waves, beta_waves, gamma_waves
here is my function to take the Fast Fourier Transform and then split the data
with the command
 slim lance
Has anyone tried Iceberg, Delta Lake and Hudi? I don’t have a use case for them, but I’m fascinated by the idea of using one of these to store my personal data instead of an RDBMS. (Assuming all the processing is done in the client it means I won’t have to run any servers.)
(I know this isn’t the use case, but I sometimes invent use cases to make an excuse to learn something)
desert oar
slim lance
Has anyone tried Iceberg, Delta Lake and Hudi? I don’t have a use case for them,...
i don't really know what you mean by "personal data", but i've used delta lake before within databricks. never bothered to compare with other tools because that's just what we had available and such things were relatively new at the time (or at least new to me). it did the job i wanted it to do, of allowing us to version-track our datasets. however we didn't have anything really resembling a modern ETL pipeline and it was all very ad-hoc
slim lance
I mean home lab stuff.. not work data.. call it a mirror of IMDb or a list of video games or whatever. Just a dataset to work with.
 merry wadi
are there any package in python like R's nor1mix ?
odd meteor
desert oar
can you clarify who "we" is here? and what kinds of work would an applicant be e...
It's an Independent Research project that's led by a Research Scientist at Cohere and one from Google.
Participants are pretty much required to contribute to any of the following, building training pipeline, running experiments, writing research paper, and of course, showing up in the weekly / bi-weekly online meeting (depending on the agreed time) etc.
Everything will take proper form once two more participants has been selected to join the project. More information will be communicated to the selected participants.
desert oar
odd meteor
It's an Independent Research project that's led by a Research Scientist at Coher...
Thanks. Is it paid or volunteer work? What's the expected weekly time commitment?
 gentle igloo
Is the first part asking to list all possible traversal paths in this graph? If so, would the following be valid?
Length 0: a
Length 1: a -> b
Length 2: a -> b -> a and a -> b -> c
Length 3: a -> b -> a -> b
Length 4: a -> b -> a -> b -> a and a -> b -> a -> b -> c
this is a tutorial question and I'm encouraged to discuss my answer before submission. Please do not give me a blank answer, I actually want to understand the question
 serene scaffold
gentle igloo
Is the first part asking to list all possible traversal paths in this graph? If ...
serene scaffold
gentle igloo
Is the first part asking to list all possible traversal paths in this graph? If ...
what definition of "path" are you using? because if it's the conventional definition, which requires that all nodes and edges be unique, there's only two paths starting from a.
gentle igloo
serene scaffold
what definition of "path" are you using? because if it's the conventional defini...
If i remember correctly from my lecture, it is the path you take from one node to the next
serene scaffold
gentle igloo
If i remember correctly from my lecture, it is the path you take from one node t...
there are different kinds of graph traversals:
- walk: any way you can move through a graph. both nodes and edges can be repeated. so
a -> b -> a -> b -> cwould be a walk. - trail: a walk, but with no repeated edges. so
a -> b -> awould be a walk. (it's also "closed" because it ends where it started) - path: a trail, but with no repeated nodes. there's only two in this graph.
I suspect your course is using "path" in some other sense
probably to mean "walk"
@gentle igloo do you know what a cycle is in a directed graph?
gentle igloo
serene scaffold
I suspect your course is using "path" in some other sense

closest definition I found in my lecture
serene scaffold
@gentle igloo I'm just going to assume they mean what "walk" means in the rest of graph theory.
do you know what a cycle is in a directed graph?
gentle igloo
serene scaffold
<@1110526906106904626> I'm just going to assume they mean what "walk" means in t...
would a cycle be repetition in a graph?
such as a -> b
it's drawn as a cycle
serene scaffold
gentle igloo
would a cycle be repetition in a graph?
a cycle is like an infinite loop in the graph, yeah
and this graph has one with a -> b -> a. so there's an infinite number of ways you could walk the graph
so when they say "list all paths of length at most 4" (keeping in mind that they're corrupting what "path" means), they mean "list all the walks, but for the possible cycle, don't list possibilities for more than four"
serene scaffold
gentle igloo
i.e list all walks that have 4 arrows?
I don't know how your instructor defines the length of a path
gentle igloo
serene scaffold
I don't know how your instructor defines the length of a path
one sec
 woven cargo
anyone here wanna help me iron out some of the differences in mathlab and python? https://discord.com/channels/267624335836053506/1157691773766864997
serene scaffold
woven cargo
anyone here wanna help me iron out some of the differences in mathlab and python...
whenever you ask for help, always give enough information in your first message that someone can start answering right away.
yes
gentle igloo
@serene scaffold
 serene scaffold
gentle igloo
<@253696366952316929>
serene scaffold
gentle igloo
<@253696366952316929>
you can infer from this how your instructor is calculating the length of a path
gentle igloo
serene scaffold
you can infer from this how your instructor is calculating the length of a path
3 paths of length 1 is because 3 paths come from arad?
serene scaffold
gentle igloo
3 paths of length 1 is because 3 paths come from arad?
you're talking about something else now. we're just trying to figure out what the length of a path with x nodes and y edges is
how many paths proceed from Arad has nothing to do with that.
gentle igloo
serene scaffold
you're talking about something else now. we're just trying to figure out what th...
yeah here is where I'm confused
serene scaffold
think of it this way: if a path that is just Arad with no edges has a length of 0, then what matters for calculating the length of a path (in your instructor's mind)? nodes, or edges?
gentle igloo
serene scaffold
think of it this way: if a path that is just `Arad` with no edges has a length o...
edges
serene scaffold
right
gentle igloo
and edges refer to the lines?
gentle igloo
so the question is asking the maximum amount of edges? or as many under and up to 4?
serene scaffold
so you have a -> b as a path with what length?
gentle igloo
1
serene scaffold
and what about a -> b -> a
gentle igloo
2
serene scaffold
how many possible paths are there in that graph?
gentle igloo
there are infinite paths because of a cycle between a and b
gentle igloo
infinite
gentle igloo
doesn't "at most 4" mean all paths with length 4 and below?
gentle igloo
i see, and the second part is asking me to create a graph that has a maximum of 4 paths?
serene scaffold
is the second part "obeserve that the search tree ..." ?
gentle igloo
correct
serene scaffold
it's asking you to draw the same graph but as a tree (where nodes are repeated)
gentle igloo
ahh like the Arad one?
serene scaffold
yeah
but when you draw a directed graph that has a cycle as a tree, the branch for that cycle would go on forever
gentle igloo
would it be drawn with a as the start, b below it but with a cycle, and finally an edge that connects b and c?
serene scaffold
so your instructor is saying to stop at 4
serene scaffold
gentle igloo
would it be drawn with `a` as the start, b below it but with a cycle, and finall...
no, trees can't have any edges between branches. everything has to just proceed from the root
but you can have duplicate nodes
gentle igloo
would it be like a -> b -> a -> b -> c from top to bottom?
serene scaffold
gentle igloo
would it be like `a -> b -> a -> b -> c` from top to bottom?
that would be one branch, yeah
gentle igloo
one branch?
if i'm expected to stop at 4 i can only think of 2 trees: a -> b -> a -> b -> c and a -> b -> a -> b -> a
serene scaffold
you can stop before 4 if you go to c
gentle igloo
so a -> b -> a -> b -> c would be more correct
serene scaffold
gentle igloo
so `a -> b -> a -> b -> c` would be more correct
that's just one path. the tree has to represent all paths of four or less
gentle igloo
serene scaffold
that's just one path. the tree has to represent all paths of four or less
I get it now thank you
serene scaffold
and there will be ones that are less than 4. because you can stop doing the a->b cycle as early as you want
gentle igloo
correct
serene scaffold
and if you go to c early, then you're forced to stop
serene scaffold
gentle igloo
I get it now thank you
are you sure?
gentle igloo
serene scaffold
are you sure?
I'm to represent all paths of four or less before going to c
i'm just trying to think of how i'd draw it
 junior stone
Now That ChatGPT Can See, Skm.ai Has Never Been More Important
Medium
With the surge in multimodal AI advancements, we’re rapidly transitioning into a realm where technologies don’t just read or listen — they…
small wedge
!rule 6
woven cargo
import numpy as np
import scipy

function [L,U] = ge_lu[A]

#checking input for square-yness

A=input('input A=')
[m.n] = size(A)
if m != n:
    print('Input matrix should be square!!')
end```

So a classmate of mine wrote most of this in MathLab. I'm trying to create a matrix A of mxn size and run a check to see if its square

and no, I cant use the scipy.solve -type of code to do it, the amount of flops needs to be able to be counted by looking at the code and being able to derive it.

I could use the scipy or numpy packages to possibly create the matrix howeverNo, it's not paid. I don't have much information about the specific weekly time commitment yet
I guess the major compensation is being added as one of the authors of the research paper + other perks that comes with having a published paper at major AI conferences
 abstract wasp
Help, I am trying to augment images and save them into a folder for my dataset, but when I run it, its gives me this error: File ~/Projects/colabs/Lys/project_data/data_augmentation.py:31 ds = tf.keras.utils.image_dataset_from_directory( File ~/opt/anaconda3/envs/spyder/lib/python3.10/site-packages/keras/utils/image_dataset.py:297 in image_dataset_from_directory raise ValueError( ValueError: No images found in directory /Users/avatarvaleria/Projects/colabs/Lys/time/data/time_images/23h. Allowed formats: ('.bmp', '.gif', '.jpeg', '.jpg', '.png')
This is my code:
`import tensorflow as tf
from keras.preprocessing.image import ImageDataGenerator
import os
import matplotlib.pyplot as plt
rotation = ImageDataGenerator(
rotation_range=40,
fill_mode='nearest'
)
flip = ImageDataGenerator(
vertical_flip=True,
)
zoom = ImageDataGenerator(
zoom_range = .4
)
path = '/Users/avatarvaleria/Projects/colabs/Lys/time/data/time_images/23h'
ds = tf.keras.utils.image_dataset_from_directory(
path,
batch_size=32,
image_size=(256, 256),
shuffle=True,
)
output_directory = '/Users/avatarvaleria/Projects/colabs/Lys/time/23haug'
os.makedirs(output_directory, exist_ok=True)
for images in ds:
augmented_ds = rotation.flow(images, batch_size=len(images))
for i, augmented_ds in enumerate(augmented_ds):
    image_name = f"augmented_{i}.jpg"
    image_path = os.path.join(output_directory, image_name)

    tf.keras.preprocessing.image.save_img(image_path, augmented_ds[0])

if len(os.listdir(output_directory)) >= len(ds.file_paths):
    break`
are there any images in the 23h folder? and if so what are their file extensions?
abstract wasp
small wedge
are there any images in the 23h folder? and if so what are their file extensions...
Yes, they are .jpg
woven cargo
Does anybody here know how to do lu_solve() without numpy or scipy?
I’ve been looking for hours for guides on how to do linear algebra in python that doesn’t involve either numpy and/or scipy I’m not getting very far.
Like if I wanted to Matrix A nxn and b nx1
And solve for x in Ax=b without using an inverse, I need to first get LU=A such that L is a lower triangular matrix and U is a upper triangular. LUx=b
Ux=y
Ly=b
Using some forward and backward substitution. And I have to do it where all the steps can be accounted for so one could count the amount of operations it takes.
I can’t really find anything on doing math with arrays in python
small wedge
woven cargo
I’ve been looking for hours for guides on how to do linear algebra in python tha...
well for one that's probably because doing it in native py is very inefficient computationally not to mention tedious af, why don't you wanna use libs like numpy and scipy?
woven cargo
So I can count the Floating Point operations in terms of N.
I’m aware it’s inefficient as hell but that’s the assignment
left tartan
woven cargo
So I can count the Floating Point operations in terms of N.
I’m aware it’s inef...
So what’s wrong with doing it via loops and basic operations? Just like you’d do on paper. If that’s the assignment.
woven cargo
I don't know how. I can't find a guide on how to do it
I could probably do it if I knew to to use specific numbers in an array. I could maybe figure it out.
Like if I had a some matrices and I wanted to run some loop like
i = 1
For i<=n
A[i,1]==A[i,1]+b[i,1]
Stuff like that.
serene scaffold
woven cargo
I could probably do it if I knew to to use specific numbers in an array. I could...
You should pretty much never be writing loops that involve arrays/matrices
woven cargo
But if I HAD to. How would I accomplish it.
serene scaffold
Ignoring loops, your question is how to index numpy arrays
woven cargo
- What does indexing a numpy array even mean.
- How do I implement loops while doing it
serene scaffold
"indexing an array" just means to access a particular element or slice of the array. Since arrays are multi-dimensional, if you have a 2d array, you can index individual elements, or whole columns, or whole rows, or the first n rows, or anything else.
This guide goes over how to do that https://www.programiz.com/python-programming/numpy/array-indexing
I will not tell you how to write loops that involve indexing numpy arrays.
In NumPy, each element in an array is associated with a number.In NumPy, each element in an array is associated with a number. The number is known as an array index. Let's see an example to demonstrate NumPy array indexing. Array Indexing in NumPy In the above array, 5 is the 3rd element. However, its index is 2.
woven cargo
Thank you!
But for reference if I were to do something like
a = 0
b=2
Print A[a,b]
It would pull up the 1st row 3rd column entry?
serene scaffold
woven cargo
Thank you!
But for reference if I were to do something like
a = 0
b=2
Print A[...
try it and see
you can even do it in our server with the !e command in #bot-commands
woven cargo
thank you, should be able to write it up now
woven cargo
@serene scaffold https://discord.com/channels/267624335836053506/1157862359038177340
So i think I'm pretty close at this point. Just need to iron out why the values in y don't change from the loop.
serene scaffold
woven cargo
<@253696366952316929> https://discord.com/channels/267624335836053506/1157862359...
y(i,0) == b(i,0) - L(i,k)*y(k,0)
the way you're using parentheses here should be causing an error of some kind. also, using == returns a new array of boolean values. it doesn't assert that the equality is true or perform assignment.
== checks for equality and = does assignment.
woven cargo
thank you
  File <unknown>:29
    y(i,0) = b(i,0) - L(i,k)*y(k,0)
    ^
SyntaxError: cannot assign to function call here. Maybe you meant '==' instead of '='?```brackets?
serene scaffold
woven cargo
```runfile('C:/Users/Eric/.spyder-py3/matrix example loop.py', wdir='C:/Users/Er...
looks like you meant to do y[i, 0]. you can't use () and [] interchangeably.
Maybe you meant '==' instead of '='?
this isn't true, in your case.
woven cargo
so now its working for the 1st spot in y. but its not for the other 2.
1#yn = [bn-(i=1)sigma(k) of (Lki times yi-1)]
thats what im trying to do in more math terms. When working on this the other day me and a classmate couldn't find a way to have the loop work in MathLab with the 1st iteration so we left it out and started on the next spot.
It isn't clear to me why nothing is happening to the 2nd and 3rd values of matrix y.
serene scaffold
I can't tell what that's supposed to mean. can you find the formula in math notation or write it here with latex? (there's a .latex command)
woven cargo
okay if i write it down and just take a pic of it?
serene scaffold
I guess that's fine if the picture and your handwriting are legible
woven cargo
 serene scaffold
woven cargo
serene scaffold
woven cargo
how does that work for y_0 ?
serene scaffold
what is b, L, and k?
is there a name for this formula?
so that I can just look it up?
woven cargo
#Ax = b
#[LU]x = b
#L[Ux] = b
#L[y] = b
In case you aren't familiar with LU decomposition of a square matrix. k is intended to be the column and i is the row a particular value of a matrix is in
No idea if the equation has a name. Technically its supposed to all be divided by Lkk(the diaganol of the L matrix) but since those are always one it can be left out
serene scaffold
woven cargo
if you have these as arrays named y, b, L, and y, with scalar ints n, i, and k, you'd be writing things like b[n] and L[k, i] (where that's the kth row, ith column)
.latex
Also, that summation can be rewritten as
$$y_{n-1} \cdot \sum_{i = 1}^{n} L_{k, i}$$
 woven cargo
i was unaware the sum thing could be written like that
the Lki and the yn-1 are inside the sum however
serene scaffold
it's the same as the distributive property
# not python
(ab + ac + ad) = a(b + c + d)
.latex
And then $\sum_{i = 1}^{n} L_{k, i}$ is just a formal way of notating "the sum of the kth row"
 serene scaffold
actually I guess that's only true if n is the number of columns
woven cargo
n is the row length and column length of the original nxn matrix
so the matrixies that are nx1 have n rows but 1 column
serene scaffold
which, if that isn't guaranteed to be the case, can be written with numpy as L[k, :n].sum()
woven cargo
if I were doing this for a CompSci class I'd run a check to make sure the intended matricies that i want to be square are so. But it's just presumed we're working with a square matrix.
while 1 <= i <= n:
    while 0 <= k <= i:
        y[i] = b[i] - y_[n-1]\cdot \sum_{i = 1}^{n} L_{i, k}
print(y)
print(np.dot(L,y))``` getting an error on the sum lineit looks like you put latex in the python code.
why are you being asked to do this? it looks like you haven't covered the absolute basics of Python.
woven cargo
Its a Math class. what is latex?
serene scaffold
woven cargo
Its a Math class. what is latex?
a separate langauge for rendering text.
\cdot \sum_{i = 1}^{n} L_{i, k} is latex, not python
woven cargo
i tried out what you wrote first 👀
serene scaffold
when you say "what I wrote", what are you referring to, exactly?
woven cargo
.latex
And then $\sum_{i = 1}^{n} L_{k, i}$ is just a formal way of notating "the sum of the kth row"
strange elbowBOT
 serene scaffold
yes, that's latex, not python
woven cargo
serene scaffold
.latex
```latex
And then $\sum_{i = 1}^{n} L_{k, i}$ is just a formal way of not...
this
while 1 <= i <= n:
    while 0 <= k <= i:
        y[i] = b[i] - y[i-1]*L[k, :n].sum()
print(y)
print(np.dot(L,y))```

its still not doing anything to the 2nd and 3rd entry in yhave you used while loops before?
woven cargo
It's been a long time since I've taken a programming class. Is while the right loop for this?
serene scaffold
whether or not it's "right" is a matter of opinion, but you need to do something that causes the conditions to change
but you never change the values of i or k.
woven cargo
so what kind of loops causes the value of the argument to change on each iteration
or could i just add i =+1?
serene scaffold
it has to be +=, not =+. but that would work.
y =+ 1 would be parsed as y = +1 which is just y = 1
woven cargo
you know when you type and it just starts overwritting stuff instead of moving it right as you type? how do I get it to stop
serene scaffold
push the insert ("INS") button
serene scaffold
I'm glad
woven cargo
while 1 <= i <= n:
    while 0 <= k <= i:
        y[i] = b[i] - y[i-1]*L[k, :n].sum()
        k+=1
    i +=1
print(y)
print(np.dot(L,y))```still not changing the values of y2 and y3
serene scaffold
woven cargo
```y[0] = b[0]
while 1 <= i <= n:
while 0 <= k <= i:
y[i] = b[i] - y...
I'm getting sleepy, but hopefully this will be some good debugging practice for you
woven cargo
You've been a great help, thank you
 quaint loom
I am far from an advanced python writer, so I am here seeking for improvement, any advice or suggestions how the module I have created could perform better. At this moment, the module itself runs very smoothly.
In this code, I’m conducting a detailed analysis of Methane (CH₄) ebullition using a dataset sourced from an Excel file. I start by preprocessing the data to convert time strings to DateTime objects for accurate temporal computations. Following this, I perform session-wise analysis on predefined sessions. Within each session, I compute the Interquartile Range (IQR) to identify outliers and determine the ebullition starting point based on a predefined threshold in CH₄ concentration change.
Subsequently, I visualize the results by plotting CH₄ concentrations, marking the outliers, and annotating various event points like ebullition start and injection times for each session. Lastly, the script calculates and outputs various parameters related to the ebullition process, such as slopes before and after the ebullition starts and total delta CH₄ changes, making it easier to comprehend the underlying patterns and anomalies in the dataset.
Here is the code:
https://paste.pythondiscord.com/5CHQ
 livid goblet
has anyone implemented an agent using one of those openAI gym environments?
odd meteor
woven cargo
I don't know how. I can't find a guide on how to do it
You're not even allowed to use numpy? That's too much in my opinion 'cos it can get pretty complicated real quick when dealing with large matrix . I did something similar something ago on a small matrix to to help someone build intuition on why "NumPy helps us live long" when doing anything linear algebra.
I'm just gonna send some snipe shots. Hopefully, it sort of helps you in making progress in your assignment.
For viz: http://matrixmultiplication.xyz/


An interactive matrix multiplication calculator for educational purposes
 nimble hawk
Hello, I uploaded a data science project on YouTube. I used Pandas, Numpy, Matplotlib, Seaborn and Scikit-learn libraries in the project. I also added the link to the dataset in the description. I am sharing the link, have a great day! https://www.youtube.com/watch?v=9-IQJu-6vhw

Thanks for watching my video. Dataset: https://www.kaggle.com/datasets/mexwell/motorbike-marketplace
We have a discord server where you can ask questions, contribute to the discussions and get help from the text channels in this server. Additionally, I'll be sharing my new videos in the server, so you can join and never miss any of the content ...
 cobalt thistle
Hi, im trying to get the "combined sum" of rows and columns in pandas to later normalize some values
So roughly like this:

So far ive tired to get the sum of each row and column. But like this id have to iterate over every value and add them which seems quite inefficient. Is there any way I can archive a similar result (Im sure there is but Im really lost right now)?
 odd meteor
cobalt thistle
So far ive tired to get the sum of each row and column. But like this id have to...
odd meteor
cobalt thistle
So far ive tired to get the sum of each row and column. But like this id have to...
I'm not sure I got your question correctly, but if 16 (row and column sum) is what you're interested in getting, you can just grab iit using loc or indexing the total column with -1
arctic wedgeBOT
@odd meteor :white_check_mark: Your 3.11 eval job has completed with return code 0.
001 | /home/main.py:11: FutureWarning: Series.__getitem__ treating keys as positions is deprecated. In a future version, integer keys will always be treated as labels (consistent with DataFrame behavior). To access a value by position, use `ser.iloc[pos]`
002 |   print('Method 1 ', contingency_df['Total'][-1])
003 | Method 1  6
004 | Method 2  6
contingency_df['Total'].iloc[-1] should take care of the warning in 1st method.
 errant bison
what is trending nowadays in the field of ai-ml
odd meteor
cobalt thistle
!e
import pandas as pd

df = pd.DataFrame({
    'A': [1, 8, 6],
    'B': [3, 4, 7],
    'C': [5, 9, 2]
})

df['Row_Total'] = df.sum(axis=1)
df.loc['Column_Total'] = df.sum(axis=0)

print(df)

print('_____' * 6)

print(df['Row_Total'].iloc[-1])           #<--- Method 1
print(df.loc['Column_Total','Row_Total']) #<--- Method 2
@odd meteor :white_check_mark: Your 3.11 eval job has completed with return code 0.
001 |                A   B   C  Row_Total
002 | 0              1   3   5          9
003 | 1              8   4   9         21
004 | 2              6   7   2         15
005 | Column_Total  15  14  16         45
006 | ______________________________
007 | 45
008 | 45
A lot. VectorDB, RAGs, LLMs, Amazon's $4B investment in Anthropic, and more
past meteor
errant bison
what is trending nowadays in the field of ai-ml
In the non-NLP space geometric deep learning is somewhat trending.
errant bison
odd meteor
A lot. VectorDB, RAGs, LLMs, Amazon's $4B investment in Anthropic, and more
need to google all! amazon $4B, whats that about? anything else
errant bison
past meteor
In the non-NLP space geometric deep learning is somewhat trending.
oh whats that, related to computer vision?
past meteor
errant bison
oh whats that, related to computer vision?
It's basically a name for neural network architectures that can operate on non-euclidian data, for instance graphs, manifolds, point clouds, ...
errant bison
oh ohkk
past meteor
My favourite example here is Pokemon. If you want to make a model that predicts who wins you have a ton of symmetry, you can shuffle all the moves, all the mons and both players. Many permutations are exactly the same thing, it's a graph. Graph neural networks are "invariant" to permutations. Why does this matter? If the model thinks each permutation is different you're wasting a lot of data.
errant bison
ahh cool
serene scaffold
past meteor
In the non-NLP space geometric deep learning is somewhat trending.
Because everyone in nlp be like "how can we shoehorn LLMs into this?"
left tartan
Because everyone …. (Forget about ‘in Nlp’) 🙂
serene scaffold
left tartan
Because everyone …. (Forget about ‘in Nlp’) 🙂
fixed 😄
left tartan
serene scaffold
fixed 😄
I just talked to an HR team who wanted to apply LLMs to, well, everything.
serene scaffold
left tartan
I just talked to an HR team who wanted to apply LLMs to, well, everything.
like auto resume rejection?
left tartan
Yah, and they wanted to replace a bunch of their people with a chapgpt HR bot.
Imagine. "Hey, my paycheck didn't come through last week, what's going on?"
"Hi, I'd be happy to help. Usually a missing paycheck means you've been fired."
serene scaffold
left tartan
Imagine. "Hey, my paycheck didn't come through last week, what's going on?"
hopefully they wouldn't try to use an LLM to answer things that are temporally bound 😬
past meteor
serene scaffold
Because everyone ~~in nlp~~ be like "how can we shoehorn LLMs into this?"
Exactly and I can't say I'm happy about this 🤷
Maybe it's a me problem though, NLP is the domain I've spent the least time with.
 brave sand
is anyone using tensorflow here? I get this following error:
ValueError: mutable default <class 'official.modeling.optimization.configs.optimizer_config.SGDConfig'> for field sgd is not allowed: use default_factory
do I have to downgrade to python 3.9?
past meteor
brave sand
is anyone using tensorflow here? I get this following error:
`ValueError: mutabl...
Can you show your code?
brave sand
past meteor
Can you show your code?
sure
hold on
@past meteor
    # For real fields, disallow mutable defaults.  Use unhashable as a proxy
    # indicator for mutability.  Read the __hash__ attribute from the class,
    # not the instance.
    if f._field_type is _FIELD and f.default.__class__.__hash__ is None:
        raise ValueError(f'mutable default {type(f.default)} for field '
                         f'{f.name} is not allowed: use default_factory')

return f```https://github.com/huggingface/datasets/issues/5230
this is the fix but i am unsure what it means

GitHub
Describe the bug When I import datasets using python 3.11 the dataclasses standard library raises the following error: ValueError: mutable default <class 'datasets.utils.version.Version'...
odd meteor
past meteor
Maybe it's a me problem though, NLP is the domain I've spent the least time with...
You're always welcome to join the party 😂
brave sand
do I have to downgrade to 3.9? I want to avoid doing that as much as possible
past meteor
brave sand
<@260493929047130113>
Is this your code or the library's?
brave sand
past meteor
Is this your code or the library's?
the library
past meteor
Can you show me your code 🙂
brave sand
I am just running this:
https://github.com/tensorflow/models/blob/master/research/object_detection/model_main_tf2.py
GitHub
Models and examples built with TensorFlow. Contribute to tensorflow/models development by creating an account on GitHub.
 past meteor
brave sand
I am just running this:
https://github.com/tensorflow/models/blob/master/researc...
past meteor
brave sand
I am just running this:
https://github.com/tensorflow/models/blob/master/researc...
That API is deprecated
brave sand
what do I do then?
i need to train a custom object detection model
can I downgrade to python 3.9?
past meteor
Just a second, I used Tensorflow's object detection relatively recently
You can definitely just use whatever versions TF wants you to and run that
Or use the new API
brave sand
past meteor
You can definitely just use whatever versions TF wants you to and run that
which is that?
i am sort of confused on how to approach this
currently, i am using tensorflow 2.14.0
past meteor
I don't know that by heart - you'd have to look for that. I understand that this is confusing though.
brave sand
everything is super unclear on what to use, apparently GPU only supports tensorflow 2.10 now?

welp, time to restart
why isn't there a straightforwards tutorial for this? everyone's tutorials on youtube are all saying different things.
past meteor
brave sand
i need to train a custom object detection model
It's specifically object detection you need to do yeah?
past meteor
I'm a big fan of YOLO: https://pjreddie.com/darknet/yolo/
You only look once (YOLO) is a state-of-the-art, real-time object detection system.
CTRL-F to "Training YOLO on VOC". Imo you're right and TF's object detection is not well documented. YOLO is, I'd run with that unless you're willing to look long enough.
brave sand
past meteor
CTRL-F to "Training YOLO on VOC". Imo you're right and TF's object detection is ...
well does YOLO work for custom images?
past meteor
brave sand
well does YOLO work for custom images?
Yup. I'd read the page in full I linked 😄
You can also go the Keras route, I think they switched to a multi-backend setup but you can see here that they have object detection models and you can train them yourself: https://keras.io/api/keras_cv/models/
In general if you're using Tensorflow you need to bounce back and forth between TF and Keras docs and hope one of the two is documented/recent 😎
brave sand
past meteor
In general if you're using Tensorflow you need to bounce back and forth between ...
Yeah, I had trouble getting CUDA, and tensorflow installed, everything isn't well documented. I'll give the YOLO algoritm a shot then. thanks!
kind of hard to believe YOLO can work on any image
past meteor
brave sand
Yeah, I had trouble getting CUDA, and tensorflow installed, everything isn't wel...
Before you do I'd also read the keras link and decide which you prefer working with
Also Torch etc, try and make a very conscious decision
brave sand
past meteor
Also Torch etc, try and make a very conscious decision
gotcha, thank you
does YOLO store a list of items it can already recongnize?
or how else does it know all this
past meteor
Typically these models are pre-trained with the COCO dataset which has ~20 classes
If what you want to detect is in those 20 you can just use it off the shelf
brave sand
yeah, stuff like mugs, people, cars, common stuff
past meteor
The stuff on TF hub is also trained with those, you can use that off the shelf as well
brave sand
but how does it know other non on the shelf things?
past meteor
You train it with new data
Basically you replace the last layer with outputs for your problem and train it again, possibly just the last layer.
brave sand
alright, I haven't read the whole YOLO article, but hopefully it covers how to do that
past meteor
It does 😉 Good reflex on your part!
quaint loom
quaint loom
I am far from an advanced python writer, so I am here seeking for improvement, a...
Just following up my message if there is any advanced python people who can have a look
past meteor
odd meteor
You're always welcome to join the party 😂
Oh yeah maybe in the future! 😄 I did some information retrieval in uni so the RAG stuff sounds interesting to me. I just haven't done real world NLP projects, only school work and to me that doesn't really count
past meteor
quaint loom
Just following up my message if there is any advanced python people who can have...
Do you want feedback on your methods, the code or both?
quaint loom
past meteor
Do you want feedback on your methods, the code or both?
Both, please : )
 spice mountain
Can LSTM cell states be vectors...?
past meteor
spice mountain
Can LSTM cell states be vectors...?
They're vectors by default
past meteor
quaint loom
Both, please : )
First thing I can say is that if you have blocks of code with comments above them you might as well make those functions
quaint loom
past meteor
First thing I can say is that if you have blocks of code with comments above the...
Would you elaborate?
 hasty solar
right here?
small wedge
You might wanna copy paste the message you wrote earlier explaining your issue as well, so others can have context
hasty solar
Alright
past meteor
quaint loom
Would you elaborate?
You have comments like: Convert to datetime objects from the string representation and Continue with ebullition calculations take the contents of those and make functions like def datetime_to_str(start_time: str, end_time: str) -> Tuple[datetime, datetime]:
hasty solar
I was building a simple MLP by combining simple perceptrons, but the thing is I'm basically defining the value of each hidden layer myself (I'm passing 0101, 0011 and it has two hidden layers with values 0100,0010 which in turn gives XOR output 0110) I wanted to make the MLP to discover those 0100 and 0010 values itself, but don't know how or if it's even possible
quaint loom
past meteor
You have comments like: `Convert to datetime objects from the string represen...
Thank you!, I also made it for me to easy know what I am doing.
hasty solar
quaint loom
hasty solar
https://paste.pythondiscord.com/7ZSQ
please use this page to copy your code into and share it here: https://paste.pythondiscord.com/
small wedge
Last thing can you edit your message and add ```py to the line before it and ``` to the line after (this will make your code more readable)
Or pastebin works yeah
past meteor
quaint loom
Thank you!, I also made it for me to easy know what I am doing.
It's good you're not changing your input dataframe in your function and you're making new variables. Keep doing that because doing the opposite is a recipe for disaster
quaint loom
past meteor
It's good you're not changing your input dataframe in your function and you're m...
Thank you! I think i did this pretty often in the beginning.
spice mountain
past meteor
They're vectors by default
I have added the schematic and the actual formulas for the outputs of the different gates from Wikipedia.
How come there is no tanh in the input gate in the formula...?


Long short-term memory (LSTM) network is a recurrent neural network (RNN), aimed to deal with the vanishing gradient problem present in traditional RNNs. Its relative insensitivity to gap length is its advantage over other RNNs, hidden Markov models and other sequence learning methods. It aims to provide a short-term memory for RNN that can last...
past meteor
quaint loom
Thank you! I think i did this pretty often in the beginning.
About your specific method to catch outliers... it can work. In my use case I have a time series and I use the IQR as a quick and dirty way to find outliers. Ultimately you need to look at the data and see if it's a good heuristic or not 🙂
hasty solar
small wedge
Or pastebin works yeah
First perceptron predicts x1!x2 second one !x1x2 and using both results as an input gives 0110, otherwise it doesn't work because xor isn't linearly separable or smth. at least that's how I tried to solve the problem but it doesn't look good to me. Is it possible to make it guess those hidden layers itself?
past meteor
spice mountain
I have added the schematic and the actual formulas for the outputs of the differ...
You want to know in general why there's no tanh for input gate? The intuition behind it?
quaint loom
past meteor
About your specific method to catch outliers... it can work. In my use case I ha...
I was thinking about Z-score too but I doubt my data will ever be normally distributed. BUT, I could for example, start by calculating the IQR-based outlier boundaries and then use Z-Score to identify outliers that fall beyond these boundaries. This approach can provide a more comprehensive assessment of potential outliers in my data.
spice mountain
past meteor
You want to know in general why there's no tanh for input gate? The intuition be...
What?
past meteor
Like why it's sigmoid and not tanh. I want to be sure I get the question.
spice mountain
Is that the case?
No, I am asking why the expression for the input gate (mathematically) contains only 1 activation function, when the diagram shows two.
quaint loom
past meteor
About your specific method to catch outliers... it can work. In my use case I ha...
What is your preference of method that would be the optimal in my case?
past meteor
quaint loom
I was thinking about Z-score too but I doubt my data will ever be normally distr...
I don't know, I think you should just try both and compare empirically
small wedge
hasty solar
First perceptron predicts x1!x2 second one !x1x2 and using both results as an in...
Okay so 2 things, chaining together two perceptions that train separately like this is different than a multilayer perceptron, because your gradient descent doesn't calculate the partial of weights with respect to the output cost of the last layer, you're training the weights of the perceptron as separate objects. Then the second thing is the hidden layer dimensions, as you can see your perceptions output a dim 1 prediction. This can't be fed back into your dim 2 input for the second perceptron.
past meteor
spice mountain
Is that the case?
No, I am asking why the expression for the input gate (mathem...
Those LSTM diagrams are very very confusing. When I was learning about them I realized they do more harm than good tbf (at least for me). Curious to know if anyone else got value out of them.
That being said, I don't see where you see the input gate having two activations. You see a concat between x and ht-1 right? That gets put into a sigmoid.
quaint loom
past meteor
I don't know, I think you should just try both and compare empirically
I will sure look into it tomorrow. Thank you. I will also return here on discord tomorrow to see if there is any other recommendation for improving it. Again thanks for you time.
small wedge
small wedge
Okay so 2 things, chaining together two perceptions that train separately like t...
You should make a separate class with a hidden layer that doesn't reduce the dimensions to 1, and calculate w w.r.t cost for each of the weights based on a single prediction
spice mountain
past meteor
Those LSTM diagrams are very very confusing. When I was learning about them I re...
RIght there
 past meteor
spice mountain
RIght there
past meteor
spice mountain
RIght there
The sigmoid on the left is the input gate. The one on the right is the is cell input activation ct (the one with the tilde). The top and the bottom one on my screenshot
 spice mountain
Ah I see
past meteor
spice mountain
Ah I see
Want to know the intution behind it or are you good?
spice mountain
Sure, come with it
hasty solar
small wedge
Okay so 2 things, chaining together two perceptions that train separately like t...
Thanks, So my approach is fundamentally incorrect and I should learn more about MLP? I just thought that combining them Is MLP. Can you also just verify the statement that you can't make a simple perceptron to predict XOR, it's just my assignment is asking me exactly that, maybe it's a trick assignment idk
small wedge
A simple MLP can do XOR, a SLP cannot afaik
past meteor
spice mountain
Sure, come with it
Okay the first thing you do is look at the activations as binary, so not between 0 and 1 but exactly 0 and 1 (sigmoid). Not between -1 and 1 but exaclty -1 or 1 (tanh).
The input gate is basically saying "Do I use the input or ignore it" (0 or 1)
The cell input activation is saying "Is this input a positive or a negative" (-1 or 1)
Obviously these are vectors. Btw this is why it does an elementwise multiplication between them: Per dimension in the vector it decides "relevant or irrelevant" and per dimension it also decides "negative or positive". (That's the right part of the image)
Now you may ask: "Why do you need both? Don't you have enough with just the cell input activation? Why do I need the input gate as well." My answer to that my friend is, I have no clue 
Make sense?
 small wedge
hasty solar
Thanks, So my approach is fundamentally incorrect and I should learn more about ...
small wedge
hasty solar
Thanks, So my approach is fundamentally incorrect and I should learn more about ...
Say you have w1 and w2 matrices in your MLP, the partial derivatives of w1 are going to depend on part of the calculation for the partial derivatives of w2, which training them separately doesn't account for (same goes for bias btw)
hasty solar
small wedge
Say you have w1 and w2 matrices in your MLP, the partial derivatives of w1 are g...
I was just learning about the math aspect of the Neural Networks, I will keep this in mind
hasty solar
small wedge
Say you have w1 and w2 matrices in your MLP, the partial derivatives of w1 are g...
While we're at it can you explain me this part of the video about hidden layers https://www.youtube.com/watch?v=IHZwWFHWa-w?t=14m04s

Enjoy these videos? Consider sharing one or two.
Help fund future projects: https://www.patreon.com/3blue1brown
Special thanks to these supporters: http://3b1b.co/nn2-thanks
Written/interactive form of this series: https://www.3blue1brown.com/topics/neural-networks
This video was supported by Amplify Partners.
For any early-stage ML startup fo...
I can't yet grasp how neural network discovers those random patterns
small wedge
x = original input
y = labeled output
z1 = x*w1+b1
a1 = activation1(z1)
z2 = a1*w2+b2
a2 = activation2(z2)
c = cost(a2, y)
∂c/∂w2 = ∂z2/∂w2 * ∂a2/∂z2 * ∂c/∂a2
Note: ∂z2/∂w2 = a1
For the sake of simplicity let d1 = ∂a2/∂z2 * ∂c/∂a2
∂c/∂w1 = ∂z1/∂w1 * ∂a1/∂z1 * ∂z2/∂a1 * d1
Note: ∂z1/∂w1 = x
Note: ∂z2/∂a1 = w2
Here's an old explanation of the math I wrote a while ago for a model with 2 weights, you can see the d1 part which is used to calculate ∂c/∂w1 relies on ∂c/∂z2
past meteor
Do you currently have a neural network with no hidden layers?
small wedge
hasty solar
While we're at it can you explain me this part of the video about hidden layers ...
What timestamp?
small wedge
hasty solar
https://paste.pythondiscord.com/7ZSQ
Here's their code ze
hasty solar
small wedge
What timestamp?
14:30
spice mountain
past meteor
Okay the first thing you do is look at the activations as binary, so not between...
Yeahhhhh, it makes sense.
past meteor
hasty solar
I was just learning about the math aspect of the Neural Networks, I will keep th...
Btw I'd look at linear regression first and then move to neural networks
What you currently have is basically some linear model, it's Lin reg where you clip the output
small wedge
hasty solar
I can't yet grasp how neural network discovers those random patterns
They're not random patterns persay, they just look semi random to us. As he says in the video the model has found a local minimum which can fit a majority of the images, those patterns were created via gradient descent and represent the features the model is looking for to determine its predictions
past meteor
Linear regression is a fundamental building block of neural nets. You can say that each neuron is a mini regression with an activation and the entire thing is trained together 🙂
hasty solar
past meteor
Btw I'd look at linear regression first and then move to neural networks
At which point can I say that I have a good grasp on Linear regression? All i know about it is that it's when you predict stuff by drawing line that minimizes the sum of squared distance between line and each dot
past meteor
hasty solar
At which point can I say that I have a good grasp on Linear regression? All i kn...
Code it up linear regression in an afternoon and then logistic regression (both using stochastic gradient descent). Then add regularisation etc.
Maybe your own dataset, just some linear function with noise.
hasty solar
small wedge
They're not random patterns persay, they just look semi random to us. As he say...
oh so they are created, via gradient descent. My english didn't pick up that part well
hasty solar
past meteor
Code it up linear regression in an afternoon and then logistic regression (both ...
Thanks
small wedge
Yes, gradient descent tells us how to update each of those weights in order to lower the output of the cost function, if you run that enough times the model will have some set of weights that can distinguish features of the images, which is what those visualizations were.
The only random part of this kind of model is the initialization
spice mountain
When we use attention, do we create a context vector first, or is the input sequence outputtet in "real time" to the decoder?
 scenic parcel
Anyone else here use gpt4 for coding?
serene scaffold
scenic parcel
Anyone else here use gpt4 for coding?
I've used ChatGPT to help me come up with mongo queries in low-stakes situations
scenic parcel
serene scaffold
I've used ChatGPT to help me come up with mongo queries in low-stakes situations
Gpt4 specifically
serene scaffold
I don't pay extra for that, so no
 mortal pendant
In matplotlib, how can I clear everything plotted on some axes without resetting everything else (ticks, labels, legends...)? I am plotting a bunch of broken_barh onto an axes and I have a slider which, when updated, needs all the broken_barh to be recalculated, so I need to clear them all first
odd meteor
mortal pendant
In matplotlib, how can I clear everything plotted on some axes without resetting...
If you're using a slider; which I presume is interactive, once the slider is updated, it should automatically clear previous plot and show the updated plot without you rewriting the code.
mortal pendant
Not for me. Even the demo (https://matplotlib.org/stable/gallery/widgets/slider_demo.html) sets the data instead of adding it, and then has to show the updated plot manually (fig.canvas.draw_idle()). If I draw the new broken_barh(s) without clearing the axes, they overlay each other
odd meteor
mortal pendant
Not for me. Even the demo (https://matplotlib.org/stable/gallery/widgets/slider_...
I'm lazy to type long code now 😀 but let me see if I come up something fun you can work with and/or probably adapt to your own code.
odd meteor
mortal pendant
Not for me. Even the demo (https://matplotlib.org/stable/gallery/widgets/slider_...
import numpy as np
import pandas as pd
import matplotlib.pyplot as plt
import seaborn as sns
import ipywidgets as widgets
from IPython.display import display
from sklearn.linear_model import LinearRegression

np.random.seed(50) #<--- Setting a seed; for reproducibility

# Generate random fake prices to be roughly $600 per square-foot
sqft = [0, 100, 200, 201, 210, 214, 215, 220, 500, 550, 600, 750, 800, 850, 855, 856, 857, 890, 892, 899, 900, 920, 1385, 1200, 1400, 1500, 1550, 1800, 2000]

# randomly generate number of bedroom
num_bedroom = np.random.randint(1, 5, len(sqft))
mu, sigma = 600, 200   #<--- mean and standard deviation
prices = [np.round(i * np.random.normal(mu, sigma), 0)**(1/2) for i in sqft]
df = pd.DataFrame({'sqft': sqft, 'bedrooms': num_bedroom, 'price': prices}) #<--- dataframe

X_data = df[['sqft']].values  #<--- Independent variable
y_data = df[['price']]  #<--- Dependent variable

# Create a linear regression model
lr_model = LinearRegression()
lr_model.fit(X_data, y_data)
# Function to update the plot based on the x_value
def update_plot(x_value):
    fig, ax = plt.subplots()
    ax.scatter(X_data, y_data, color='orange', label='Data points')
    ax.plot(X_data, lr_model.predict(X_data), 'black', label='Regression line')

    y_pred = lr_model.predict([[x_value]])
    ax.scatter(x_value, y_pred, color='green', marker='*', s=100, label='Predicted point')

    # Display the predicted y value and sqft value on the plot
    ax.annotate(f'Predicted Price: {y_pred[0][0]:.2f}',
                (x_value, y_pred[0][0]),  # Use scalar value for y coordinate
                textcoords="offset points",
                xytext=(-15, -15),
                ha='center',
                fontsize=10,
                color='black')

    ax.annotate(f'SQFT: {x_value}',
                (x_value, y_pred[0][0]),  # Use scalar value for y coordinate
                textcoords="offset points",
                xytext=(-15, 15),
                ha='center',
                fontsize=10,
                color='black')

    # Draw a trace line from the predicted point to the x-axis and y-axis
    ax.plot([x_value, x_value], [y_pred[0][0], 0], linestyle='dashed', color='gray')  # Trace to x-axis
    ax.plot([x_value, 0], [y_pred[0][0], y_pred[0][0]], linestyle='dashed', color='gray')  # Trace to y-axis

    ax.legend(loc='best')
    ax.set_xlabel('Square Feet')
    ax.set_ylabel('House Price ($)')
    ax.set_title('Interactive Regression Plot')

    plt.show()

# Create an interactive slider widget for X value
x_slider = widgets.FloatSlider(min=0, max=2000, step=10, value=0, description='Sqft Value')

# Use widget.interact to create the interactive plot
widgets.interact(update_plot, x_value=x_slider);
You can further customize this to fit what you're trying to do.
 torpid arrow
anyone got any idea what multi-softmax loss might be? is it just cross entropy multiple times across a dim, sum then avg?
mortal pendant
I mean, re-creating the entire plot every time the slider is updated technically works, but it just seems unnecessary/wasteful, and would also be hard to implement in my particular case because I'm trying to write my code to be able to apply to a few different forms of charts/graphs (with configurable options and kwargs) for the same data and my slider won't know which of those "forms" I'm using. Here is an extract from my code to give you an idea of what I mean- it's not just one linear thing, it's split up into a bunch of functions which can be mixed-and-matched to produce different charts/graphs. Is there not a way to just clear the plot without clearing everything else?
small wedge
torpid arrow
anyone got any idea what multi-softmax loss might be? is it just cross entropy m...
https://arxiv.org/pdf/2109.04290.pdf this paper talks about dual-softmax loss, I'd assume it's similar to this but possibly refers to 2 or more usages of softmax
 torpid arrow
mortal pendant
I mean, re-creating the entire plot every time the slider is updated technically...
torpid arrow
mortal pendant
I mean, re-creating the entire plot every time the slider is updated technically...

Medium
There are cases when we want to plot our data, and the data keeps on coming. We cant wait for the whole process to complete because it may…
torpid arrow
small wedge
<https://arxiv.org/pdf/2109.04290.pdf> this paper talks about dual-softmax loss,...
yeah its wild man - its mentioned in a google paper but with no actual explanation as to wtf is it
torpid arrow
no lol they just through u in the deepend
ill make a help channel - im pretty sure ive got it if you want to see
 severe hare
"Symmetric cross-entropy (SCE) is a loss function that is commonly used in machine learning. SCE is a symmetric version of the standard cross-entropy loss, which uses the Kullback-Liebler (KL) divergence to measure the difference between two probability distributions.
There are different types of symmetric cross-entropy loss, including:
-
Generalized Symmetric Cross Entropy (G-SCE) - this is a generalization of the symmetric cross-entropy loss that allows for tuning a parameter to adjust the balance between sensitivity and specificity of a model. G-SCE has been shown to work well in imbalanced classification problems where different misclassification types have different costs.
-
Asymmetric Symmetric Cross Entropy (ASCE) - is a generalization of the SCE loss designed for imbalanced datasets where the majority class is assumed to have some inherent advantages over the minority class.
-
Weighted Symmetric Cross Entropy - is a version of the SCE loss that assigns weights to each class in the dataset. This is useful when the classes are imbalanced, and the performance needs to be improved on the underrepresented class.
The choice of symmetric cross-entropy loss depends on the nature of the problem, the characteristics of the dataset and the trade-off between sensitivity and specificity that the model needs to achieve."
mortal pendant
torpid arrow
https://medium.com/@vermavinay982/dynamic-graph-plotting-matplotlib-63c94d8fa99f
That's for adding data, though, which is what I'm trying to avoid. I'm needing to re-create the data entirely
severe hare
More specifically "Dual-Softmax Symmetric Cross Entropy (DSCE) is a symmetric cross-entropy loss function used in multi-class classification problems. The DSCE loss function is designed to improve the separability between classes, particularly in scenarios where the classes are closely related.
DSCE loss function uses two softmax functions to transform the input data. The first softmax function, also known as the intra-class softmax, is used to compute the probabilities of the different classes within each data sample. The second softmax function, referred to as the inter-class softmax, is used to calculate the similarities between each data sample and the class centers.
The class centers are defined as the average of the features of all the members of a class in the training data. The inter-class softmax computes the similarity between the class centers and each data sample. By doing this, the inter-class softmax encourages the data points within a class to move together, while at the same time, encouraging different classes to move apart from each other.
The DSCE loss function then computes the symmetric cross-entropy between the intra-class softmax and the inter-class softmax. It penalizes the difference between the predicted probabilities and the actual class labels. The loss function is symmetric because it considers the similarities between each data sample and each class center and penalizes the difference between the two.
In summary, Dual-Softmax Symmetric Cross-Entropy (DSCE) is a loss function that enhances class separability in a multi-class classification problem by using two softmax functions to compute the probabilities of the different classes within each data sample as well as their similarities with the class centers. DSCE then computes the symmetric cross-entropy between the two softmax outputs, which results in a well-separated decision boundary among the classes."
torpid arrow
severe hare
More specifically "Dual-Softmax Symmetric Cross Entropy (DSCE) is a symmetric cr...
hm - i feel like if it was this technique or just a multiplication of this theyd reference right?
i got a help channel going if youd like to join so we dont bog down this channel too much
severe hare
Decides the formalation of a solution to a classification problem. Cross-Entropy decides how alike or dissimilar they are. Calculating entropy loss is the 'energy lost' or resources wasted.
My dad says his entropy is vodka-Redbulls.
Mine is coffee.
torpid arrow
yea im using cross entropy already but it calculates one softmax to determine the similarity of two tensors - not multiple softmaxs like the paper describes
 lapis sequoia
yo i need help
i' musing a large framework which is not avaible actually in chat gpt, i would like to know if it's possible to make a plugins for that framework ?
torpid arrow
lapis sequoia
yo i need help
whats the framework / LM?
lapis sequoia
torpid arrow
whats the framework / LM?
it's a cryptography and networking framework
and more others stuff
torpid arrow
i cant say for certain without knowing the framework if you can make plugins for it or not
lapis sequoia
torpid arrow
i cant say for certain without knowing the framework if you can make plugins for...
do you know any others ways to make anything learn that code?
torpid arrow
the code from the framework? yeah train a language model on a custom dataset for that framework
lapis sequoia
torpid arrow
the code from the framework? yeah train a language model on a custom dataset for...
i have 0 expeience in training LM, so if you can guide me on this step, and tell me all requirement i take all
torpid arrow
if you tell me the framework youre using i can
lapis sequoia
torpid arrow
if you tell me the framework youre using i can
could we continue the discussion in private?
scenic parcel
Do you guys use object oriented programming or functional?
serene scaffold
scenic parcel
Do you guys use object oriented programming or functional?
we use Python, which supports both.
scenic parcel
serene scaffold
we use Python, which supports both.
That is why I asked which you prefer
serene scaffold
scenic parcel
That is why I asked which you prefer
I like writing in a functional style when I can
scenic parcel
functional for Smaller projects, OO for bigger?
severe hare
Anyone know any other servers with tabs that cover DS/ML/AI?
severe hare
scenic parcel
functional for Smaller projects, OO for bigger?
https://www.kaggle.com/code take a look, it ends up being a mix of both.
Kaggle Notebooks are a computational environment that enables reproducible and collaborative analysis.
serene scaffold
scenic parcel
functional for Smaller projects, OO for bigger?
you might be looking for the #software-architecture channel tbh
scenic parcel
serene scaffold
you might be looking for the <#782713858615017503> channel tbh
Yeah I already got a funny response from there
severe hare
Functional programming, on the other hand, treats computation as the evaluation of mathematical functions and avoids mutable data and side effects. Python has built-in support for functional programming constructs such as lambda functions, map(), filter(), and reduce() functions, which are widely used in data science for data transformation and processing." in practice it's both.
serene scaffold
scenic parcel
Yeah I already got a funny response from there
please only post things in one channel, so that you're not monopolizing all the space
this is the data science channel, so let's stick to that.
left tartan
scenic parcel
Do you guys use object oriented programming or functional?
My code (nearly) always has some OO abstractions in it. But, also some functional.
scenic parcel
Well I was wondering how data scientists do things but I see what youre saying
serene scaffold
scenic parcel
Well I was wondering how data scientists do things but I see what youre saying
then say that explicitly.
the data science stack has its own idioms that are often apart from the rest of Python. but if you have one or more AI-based components in some larger system (like how YouTube's video recommendation system is only a small part of the whole system), data scientists/ML engineers aren't necessarily going to be part of designing the greater system
so if you ask a data scientist or ML engineer if they prefer functional or OOP for "large projects", it's likely that they don't do "large projects" in the sense that you have in mind.
scenic parcel
serene scaffold
so if you ask a data scientist or ML engineer if they prefer functional or OOP f...
Ok, did not know that
severe hare
The learning curve for Python is OOP first then functional programming as you get more complex. So any Python student started with OOP most likely.
*unless their parents made them learn C
lapis sequoia
I want to give a big text in .txt file and try to train an AI to know what this text is saying and why not answering to all questions for this text
What to use for my task actually ?
serene scaffold
lapis sequoia
I want to give a big text in .txt file and try to train an AI to know what this ...
you would want to fine-tune a responsive LLM on that text and then ask it questions about the text.
 dry flame
i'm currently training t5-base using this notebook colab as reference: https://colab.research.google.com/github/abhimishra91/transformers-tutorials/blob/master/transformers_summarization_wandb.ipynb#scrollTo=SYbbrrJEnB6w
my question is, i don't see at any point of the notebook where it 'saves' the training so i can use it later on in other projects.
do I have to train and fine-tune it again everytime i want to use the model (obviously not right)?
how do I save the result of this training i'm doing?

 snow horizon
I would recommend just saving it to google drive https://colab.research.google.com/notebooks/snippets/drive.ipynb
The colab VM is ephemeral thus you need to use external storage
dry flame
snow horizon
I would recommend just saving it to google drive https://colab.research.google.c...
i've found how to, it's with model.save_pretrained(path)
I should've clarified that i'm running it locally, i'm just peeking on the google colab notebook to see how to train LLM with pytorch and hugging face transformers.
quaint loom
someone mention to me earlier to never convert the time used in excel (ex: ("12:04:00", "12:13:59") into str. Why and what should I do beside using str?
tacit basin
quaint loom
someone mention to me earlier to never convert the time used in excel (ex: ("12:...
Depends what you want to do with it
 young snow
Is anyone on?
quaint loom
tacit basin
Depends what you want to do with it
When should you not use it?
tacit basin
quaint loom
When should you not use it?
id depends what you want to do
tacit basin
young snow
Is anyone on?
yeah
quaint loom
tacit basin
id depends what you want to do
Would you elaborate your answer?
tacit basin
quaint loom
Would you elaborate your answer?
if you tell what you want to achieve there is higher chances somoen would answer you
lapis sequoia
serene scaffold
you would want to fine-tune a responsive LLM on that text and then ask it questi...
do you hav examples?
serene scaffold
lapis sequoia
do you hav examples?
I don't, sorry
 gaunt geyser
Since BeautifulSoup doesn't work with python 3.10, what web scraping libraries do you guys use/recommend?
tidal bough
BeautifulSoup doesn't work with python 3.10
Huh?
gaunt geyser

Stack Overflow
I was trying to install BeautifulSoup4 in order to learn web scraping. I was using pip to install bs4 package for Python 3.10 but I am unable to install it. Any help to resolve the below traceback ...
Seems to be. It won't install into my project through my IDE, but if I try to install via pip, it says requirement already satisfied haha
tidal bough
This is an old thread - latest bs4 is from april this year: https://pypi.org/project/beautifulsoup4/4.12.2/#history
and I've used it in 3.11 myself.
Seems to be. It won't install into my project through my IDE, but if I try to install via pip, it says requirement already satisfied haha
That probably means these are two different environments.
agile cobalt
lapis sequoia
do you hav examples?
depending on how large exactly it is, you might as well just include it in the prompt/context if it fits instead of fine tuning - the context window for LLMs has been getting pretty ridiculously large
splitting it into parts and throwing into a vector database is also an option if it's too large for the context window and you don't want to fine-tune
gaunt geyser
that makes sense
tidal bough
tidal bough
> Seems to be. It won't install into my project through my IDE, but if I try to ...
(I'd try installing via pip in your IDE's terminal, and looking at the error log. Post it here if you need help)
tacit basin
Do you have any recommendations on how to use gpt3.5/4 to generate custom chat dataset for LLM fine-tuning? Like evol-instruct for example but for chat. 🙏
fallow frost
are there any Athena alternatives to query data from S3 like Duckdb?
Pyarrow is nice but I cant aggregate data using the dataset API
lapis sequoia
agile cobalt
depending on how large exactly it is, you might as well just include it in the p...
do you have examples
agile cobalt
iirc deeplearning.ai has some mini-courses that cover topics tangent to it like text embeddings, but not any particular project that implements everything
you can probably find relatively easily if you search around vector dbs though, just gotta filter out the over-hyped things
 hoary wharf
given the current way to implement the concept of an AI language model, can you make one that would focus on a single data set (i.e a technical textbook) and be as efficient as any AI language model can be when prompted about the concepts mentioned in* said textbook?
serene scaffold
hoary wharf
given the current way to implement the concept of an AI language model, can you ...
when you say "efficient" in this context, I think what you really mean is "performant". there are a lot more terms to describe in what way something is good than just "efficient".
And I think that's unlikely to be the case, because even if you train an LLM only on a single textbook, I think that's probably insufficient for the LLM to "understand" the core vocabulary of that language (presumably English).
hoary wharf
that's true, it can't create patterns out of thin air. so what i described would generate replies like those of years ago, when AI made "movie scenes" where the lines exchanged by the characters were gibberish, lol
agile cobalt
in case you haven't seen it before, maybe take a look at https://arxiv.org/abs/2305.07759

arXiv.org
Language models (LMs) are powerful tools for natural language processing, but they often struggle to produce coherent and fluent text when they are small. Models with around 125M parameters such as GPT-Neo (small) or GPT-2 (small) can rarely generate coherent and consistent English text beyond a few words even after extensive training. This rais...
hoary wharf
what are parameters in the context of the link's text?
agile cobalt
model weights
past meteor
hoary wharf
given the current way to implement the concept of an AI language model, can you ...
So you want to train an LLM on just 1 textbook and ask it all sorts of detailed questions about just that book?
agile cobalt
I assumed you were a bit familiar with deep learning, that might might a bit be too technical for you
hoary wharf
past meteor
So you want to train an LLM on just 1 textbook and ask it all sorts of detailed ...
yes, i get how dumb my question is now, lol
it reminds me of this quote by Charles Babbage:
On two occasions I have been asked [by members of Parliament], 'Pray, Mr. Babbage, if you put into the machine wrong figures, will the right answers come out?' I am not able rightly to apprehend the kind of confusion of ideas that could provoke such a question.
past meteor
It's not a dumb question
past meteor
hoary wharf
yes, i get how dumb my question is now, lol
I used to give computer vision workshops, I'm sure the same applies for NLP. The layers deep down inside the network are basically very primitive ways to "see". The higher you go in the network the more task specific it becomes. There's merit in having other data because that other data can teach you the "basics" and then you can focus on the content of that text book instead of also learning how to understand language from 0.
(Very hand-wavy explanation with tons of antropomorphisms but you get the point 🤣 )
abstract wasp
Hey, random question. If I uninstall Anaconda will my Python files be deleted or will it only delete my environments and the packages I installed there? I’ve seen some mixed comments so I wanted to make sure.
agile cobalt
backup using something like a Github repository first just in case
hoary wharf
past meteor
I used to give computer vision workshops, I'm sure the same applies for NLP. The...
that's true, lol. it would need for example grammar specific data so it can undestand grammar + some other specific datasets related to the very concept of how it can process language (to process the prompt as well as formulate the answer)
otherwise it would produce a scrambled "ctrl - f" equivalent, lol
maybe a better question in my case would be: is there some kind of AI "service" (paid or not) specialized in being fed technical books to process and reply to prompts in natural language?
agile cobalt
your best bet might as well be gpt4 via openai's api
unless there's some domain-specific startup
hoary wharf
i'll check it out. thanks ( :
past meteor
There's a lot of buzz surrounding retrieval enhanced generation
I'd definitely use the GPT api for this, mostly because it's accessible for non-NLP experts like myself.
brave sand
i have tried every workaround, anyone know why this is happening?
ImportError: cannot import name 'model_lib_v2' from 'object_detection' (C:\Users\ethan\OneDrive\Documents\UAS4STEM\tfod\lib\site-packages\object_detection\__init__.py)
model_lib_v2 is in the object_detection folder
im unsure why python cannot find it
 unique ether
Any data pros out there willing to help me out real quick? I reckon you'll be able to solve my problem in around 10-20 seconds
serene scaffold
unique ether
Any data pros out there willing to help me out real quick? I reckon you'll be ab...
when you ask a question, always give enough information for someone to answer it. don't wait for a commitment.
unique ether
serene scaffold
when you ask a question, always give enough information for someone to answer it...
Sorry mate
!pastebin
arctic wedgeBOT
Pasting large amounts of code
If your code is too long to fit in a codeblock in Discord, you can paste your code here:
https://paste.pythondiscord.com/
After pasting your code, save it by clicking the Paste! button in the bottom left, or by pressing CTRL + S. After doing that, you will be navigated to the new paste's page. Copy the URL and post it here so others can see it.
unique ether
Well basically if you run this code and only ask for one experiment, it returns an absolutely ridiculous estimation of pi.
and that is to be expected but the value never changes despite there being no seed
I'm feeling like this is because it only has basically 2 discrete values it can output
but i'm really not sure
It's probably something to do with the fact that the whatever the value of the 1 dart is it just gets turned into a bool at a certain stage either
so actually with 1 dart and 1 experiment there can only be 2 values the code can output
I think I just answered my own question
serene scaffold
!e
import numpy as np

experiment, dart = 2, 3
throws = np.random.uniform(-1, 1, (experiment, dart, 2))
distances = np.sqrt(np.sum(throws ** 2, axis=2))
counts = np.sum(distances <= 1, axis=1)
results = (counts / dart) * 4
print(results)
@serene scaffold :white_check_mark: Your 3.11 eval job has completed with return code 0.
[1.33333333 2.66666667]
!e
import numpy as np

experiment, dart = 1, 1
throws = np.random.uniform(-1, 1, (experiment, dart, 2))
distances = np.sqrt(np.sum(throws ** 2, axis=2))
counts = np.sum(distances <= 1, axis=1)
results = (counts / dart) * 4
print(results)
@serene scaffold :white_check_mark: Your 3.11 eval job has completed with return code 0.
[4.]
I'm not sure.
unique ether
Let me take another look then come back
I appreciate you checking my code out, many thanks!
Also quick question
why is it printing the float like that without even a single zero?
It looks weird
serene scaffold
that's just how numpy does it
unique ether
To save memory?
serene scaffold
no. the memory footprint of the float is the same
remember that the data representation and data visualization are not the same.
unique ether
huh. I think it makes the data visualization look rather awkward
That's just my personal opinion though
serene scaffold
the . is there to tell you that the number is stored as a float and not an int. the trailing 0 doesn't really add anything
serene scaffold
unique ether
That's just my personal opinion though
there's probably a way to change it.
unique ether
serene scaffold
there's probably a way to change it.
I'll have a look into that but yea
[1.6 2. 2.8 3.2 3.6 3.2 4. 2.8 2.8 3.6]
to me that just looks odd
Also the lack of commas..
Is there any way I can create a numpy array like
LN_results = np.array()
and store in it the result of calling dart_throw with 1 experiment and 1 dart then 1 experiment and 10 darts (darts increasing by 1 order of magnitude each time) up until 1 experiment 100 million darts? a bit like list comprehension but for arrays?
or would it be best to just do it through list comprehension then turn it into a np array
I'm just trying to use np arrays as much as humanly possible right now so I can learn as much about them as I can
 dawn vigil
Hey, rn I study economics and was just wondering if anyone had any advice on what I should do to become a data scientist?
serene scaffold
dawn vigil
Hey, rn I study economics and was just wondering if anyone had any advice on wha...
there are no rules about who can be called a data scientist, so if you get a degree in economics, there are probably jobs where the title is "data scientist" that work for your skillset.
have you looked for internships?
 pallid inlet
is opus ai any good

 glacial spoke
VENT: I am just about to give up on conda. Solving environment is just too damn buggy.
 sudden thistle
Hey guys!
In an effort to better understand neural networks i've been trying write my own feed forward neural network from scratch. But i have quite some struggle implementing the backpropagation correctly... (here is the code for anybody interested [or who might even be willing to correct me 😊: https://paste.pythondiscord.com/6UAA ]).
But fundamentally my main question is whether these formulas I've been acquiring from wikipedia and the like are correct... especially the ones boxed in.
Thanks in advanced!
 sudden thistle
maybe to illustrate the issue. this is how the networks developes:
Epoch #2, Cost: 0.09735870996705139
Epoch #3, Cost: 0.09878716004701935
Epoch #4, Cost: 0.09723133946132871
Epoch #5, Cost: 0.0969070493796904
Epoch #6, Cost: 0.09776320087578833
Epoch #7, Cost: 0.09868576910243525
Epoch #8, Cost: 0.09852521636483053
Epoch #9, Cost: 0.0995453016340278
Epoch #10, Cost: 0.09960608043998397```
... were it starts of promising but after ten epochs we are worse of than we originally startedmight this just be related to the step size (learning rate) that i'm taking? - or something else
past meteor
dawn vigil
Hey, rn I study economics and was just wondering if anyone had any advice on wha...
Economics is a good option, you will just need to spend a lot of time brushing up on the CS fundamentals of recruiters to take you seriously
serene scaffold
past meteor
Economics is a good option, you will just need to spend a lot of time brushing u...
idk how it is in Europe, but in the US, there are a lot of positions named "data scientist" because that's the fashionable job title, even if the job responsibilities don't fall under what we might consider a "data scientist"
(plot twist, I secretly don't really consider anyone a "data scientist")
past meteor
serene scaffold
idk how it is in Europe, but in the US, there are a lot of positions named "data...
Same here, I ask about dashboards and plotting in interviews and if that's the job the interview ends then and there.
Edit: I don't mean this in a gatekeepey way btw, just not my speciality or interest.
But still, there's bonafide positions, for juniors as well idk
brave sand
brave sand
how do I export a model?
.
misty flint
serene scaffold
idk how it is in Europe, but in the US, there are a lot of positions named "data...
lots of the DS positions at big tech have responsibilities that map better to a "product analyst" role
i.e. KPIs, metrics monitoring, A/B testing, etc.
 empty furnace
is there any way to remove IllegalCharacters from csv files automatically?
magic dune
how do you rate/evaluate a decision tree
serene scaffold
empty furnace
is there any way to remove IllegalCharacters from csv files automatically?
what is an illegal character?

 rugged comet
In a multiple linear regression problem, what do we do when we find that two columns are perfectly correlated with each other where one is correlated positively with the target and the other is correlated negatively with the target? For example, SurvivalSkills has an R value of 0.43 with the target and RiskTaking has an R value of -0.43 with the target. SurvivalSkils and RiskTaking have an R value of exactly -1 with each other. I was taught that if two columns are colinear, we drop the one which has a weaker correlation with the target. But the absolute values of the correlations to the target are the same. So which column do we drop?
left tartan
By perfectly correlated, you’re saying they have a -1 coefficient? Just wanted to be clear on what you’re saying.
rugged comet
I may be getting the terminology wrong. But yes, I believe the Pearson correlation coefficient is -1.
left tartan
I think the terminology is right, but sometimes people use term’s differently:)
If the two variables are perfectly correlated then yah, one of them is adding no information. Doesn’t matter which one to drop, should get the same result either way. I’d be concerned if the correlation doesn’t make sense (does risk and survival make sense to be inversely related?), or if this is a sampling fluke
rugged comet
I'll check in with the person who got the data. Thanks for the help.
 shut girder
Hello, I just watched a video on the basics of Pandas for data analytics, but I'm not sure if I should move on to learning what I need from matplotlib yet. Does anyone know what are some essential Pandas concepts or things I should learn for data analytics?
past meteor
rugged comet
In a multiple linear regression problem, what do we do when we find that two col...
If two variables have perfect correlation their effect on the target will be the same. So you can drop either one.
Unless your goal is purely inference I'm a bigger fan of using regularisation.
rugged comet
I'll be learning about regularization next week.
I'm more concerned with this qqplot that looks like nothing I've seen on the internet. How am I meant to interpret this other than "The data is not normal"?
 past meteor
rugged comet
I'm more concerned with this qqplot that looks like nothing I've seen on the int...
past meteor
rugged comet
I'm more concerned with this qqplot that looks like nothing I've seen on the int...
I haven't had to read a QQ plot in years. What I always do is simply make a model calculate the error and make a scatter of error vs variable
rugged comet
The error being the residuals?
past meteor
yes indeed
rugged comet
And variable being the target (what we're trying to predict)?
past meteor
Say you have 2 variables, X1 and X1. You make a model and calculate the residuals. Then you plot the residuals vs X1 and then vs X2
rugged comet
Oh okay. I think I understand. I'll try that.
I have no thoughts on these scatter plots.


 past meteor
rugged comet
Oh okay. I think I understand. I'll try that.
past meteor
rugged comet
Oh okay. I think I understand. I'll try that.
The idea btw is that if you a relationship between a target and a variable that is not normally distributed you'll notice it there. I think that's what matters more in regression modelling, not if X and Y are normal in and of themselves but their relationship 🙂
What is on your X and your Y axis?
rugged comet
x is residuals, y is the value of the variable
past meteor
Can you flip them? It's how it's typically done


 past meteor
How come your residuals are always positive?
rugged comet
Is it not supposed to be like that?
past meteor
Usually it's centred around 0, your residuals should be ~ Normal. In your case they're not. Can you show me the code?
rugged comet
I was taking the absolute value of the error.
rugged comet
First, let me try to figure out why I was taking the abs of the error lol
I thought I saw that in class somewhere
I think I was taking the abs of the residuals because in a different lab, we went on to calculate the mean and the standard deviation of the residuals. We took the abs so that the negative errors wouldn't 'cancel-out' the positive errors.
past meteor
That's still strange, they should be 0 mean. Look up Homoscedasticity if you have time later 🙂
rugged comet
Here is the qq plot with the actual residuals.

Here is a displot of the actual residuals.
 past meteor
I'd still focus on plotting the residuals versus the variables
rugged comet
past meteor
I'd still focus on plotting the residuals versus the variables
Here you go 🙂


 past meteor
That looks fine, there's no structure in the error compared to your variables
rugged comet
past meteor
That looks fine, there's no structure in the error compared to your variables
So what does that tell us? That none of the variables contribute significantly to the error?
past meteor
rugged comet
So what does that tell us? That none of the variables contribute significantly t...
If there were a non-linear relationship between any of your variables and the target you'd see it here, the error would be dependent on the variable
rugged comet
past meteor
That's still strange, they should be 0 mean. Look up Homoscedasticity if you hav...
We wanted to see the average absolute error. I think to see how well the model was performing. If we included negative and positive errors, the mean would be close to zero and we wouldn't learn anything.
past meteor
rugged comet
We wanted to see the average absolute error. I think to see how well the model w...
Ah like a mean absolute deviation (MAD). Typically I only use that if I have outliers otherwise I use mean square error
MAD is robust to outliers because in MSE you square them and the metric gets tainted by just a few "bad apples"
rugged comet
past meteor
Ah like a mean absolute deviation (MAD). Typically I only use that if I have out...
More like Mean Absolute Error (MAE) I think.
past meteor
rugged comet
More like Mean Absolute Error (MAE) I think.
They're the same 😄 everything in data science has 25 names
 thick walrus
hello all,
I really need suggestions or help. I am working on the bar chat in matplotlib and using dates. The dates however are going to 1970. I am not sure what I am missing in my code:
import pandas as pd
import matplotlib.pyplot as plt
from datetime import datetime
import matplotlib as mpl
mpl.rcParams["date.converter"] = 'concise'
fig, (ax1, ax2) = plt.subplots(2, 1, layout='constrained')
data = pd.DataFrame({'Date': [datetime(2020, 6, 30),
datetime(2020, 7, 22),
datetime(2020, 8, 3),
datetime(2020, 9, 14)], 'Close': [8800, 2600, 8500, 7400]})
price_date = data['Date']
price_close = data['Close']
ax1.bar(price_date, price_close, linestyle='--', color='r')
ax2.bar(price_close, price_date, linestyle='--', color='r')
plt.title('Market', fontweight="bold")
plt.xlabel('Date of Closing')
plt.ylabel('Closing Amount')
Here is the sample

should I use datetime64?
 viral bobcat
sry for bad english:)
Hi i want to make an artificial life simulation, which creatures that evolve using an neural network, but i don't know whre to start. Can someone please help me:)
lapis sequoia
viral bobcat
Hi i want to make an artificial life simulation, which creatures that evolve usi...
Yeah me too.
viral bobcat
@lapis sequoia do you know how to start? 🙂
past meteor
viral bobcat
Hi i want to make an artificial life simulation, which creatures that evolve usi...
Does it need to be a neural network specifically? Genetic algorithms are very simple to play with.
viral bobcat
i did't consider that
viral bobcat
past meteor
Does it need to be a neural network specifically? Genetic algorithms are very si...
I have a dumb question:) is NEAT a Genetic algorithm?:):)
past meteor
viral bobcat
I have a dumb question:) is NEAT a Genetic algorithm?:):)
Sure but start simpler and tack on stuff when you see it's necessary, especially if you're starting out with genetic algorithms for the first time.
viral bobcat
past meteor
Sure but start simpler and tack on stuff when you see it's necessary, especially...
okey, thanks:)
viral bobcat
past meteor
Sure but start simpler and tack on stuff when you see it's necessary, especially...
do you have eny recomendations?
past meteor
viral bobcat
do you have eny recomendations?
First I'd maybe read (part of) a book on GA's if you're willing to put in the time. Even if it's 1-2 chapters it'll teach you enough of the basics to see if it's what you envisioned for your project. I personally recommend Introduction to Evolutionary Computing.
viral bobcat
thanks:)
verbal oar
how to implement for example linear regression from scratch?
I mean do I need list steps or find these steps and just follow?
like compute mse, compute partials so get gradient then do fit
I dont want to retype someone code as in tutorial it little helps, but I heard implement from scratch yourself to understand fully
past meteor
verbal oar
I dont want to retype someone code as in tutorial it little helps, but I heard i...
That's a good mindset, you've got most of the ingredients already
Now you glue them together, in a loop just 1) Do a prediction 2) Calculate the error 3) calculate the gradient 4) update weights 5) GOTO 1
 ember hazel
hey can you recommend me some project ideas
thick walrus
I am still stuck on my barplot for matplotlib. How do I make sure the dates do not show as 1970?
 bold timber
I have a question about training model from Hugging Face transormers. I am currently working on a sentiment analysis project using the Hugging Face library with TFBertForSequenceClassification. In this project I use the imdb dataset from Hugging Face. I conducted 2 experiments to training the model:
optimizer, schedule = create_optimizer(init_lr = 2e-5,
                                       num_warmup_steps = 0,
                                       num_train_steps = total_train_steps)
#First experiment
bertseq_model.compile(#loss= tf.keras.losses.BinaryCrossentropy(),
                      optimizer= optimizer,
                      metrics= ['accuracy'])
#Second experiment
bertseq_model.compile(loss= tf.keras.losses.BinaryCrossentropy(),
                      optimizer= optimizer,
                      metrics= ['accuracy'])
The accuracy output given in the first experiment is 0.9962, while the accuracy output given in the second experiment is only 0.64332. My question is why the accuracy result is better when no loss is used?
thick walrus
hello all,
I really need suggestions or help. I am working on the bar chat in matplotlib and using dates. The dates however are going to 1970. I am not sure what I am missing in my code:
import pandas as pd
import matplotlib.pyplot as plt
from datetime import datetime
import matplotlib as mpl
mpl.rcParams["date.converter"] = 'concise'
fig, (ax1, ax2) = plt.subplots(2, 1, layout='constrained')
data = pd.DataFrame({'Date': [datetime(2020, 6, 30),
datetime(2020, 7, 22),
datetime(2020, 8, 3),
datetime(2020, 9, 14)], 'Close': [8800, 2600, 8500, 7400]})
price_date = data['Date']
price_close = data['Close']
ax1.bar(price_date, price_close, linestyle='--', color='r')
ax2.bar(price_close, price_date, linestyle='--', color='r')
plt.title('Market', fontweight="bold")
plt.xlabel('Date of Closing')
plt.ylabel('Closing Amount')
not sure what I am missing
dry flame
General question about ML vs deep learning
From what I have read, ML is a subset of AI, and it uses techniques like deep learning to allow the machine to learn from experience
So is it correct if I were to say:
-
AI is the 'umbrella' term.
-
Machine learning is when at some point a process can learn from it's own experience, feed data it got into itself to get better at certain tasks.
-
Deep learning is a technique that mimics organic neural network, where the result we can already use, but it is not machine learning at all.
mortal pendant
In matplotlib, I need a LinearLocator where numticks is either between 1 and 5 or equal to 7n+1, where which of these and the value of n is chosen automatically for scaling. Since there probably isn't gonna be a case where n can be more than 5 and more than 36 ticks are shown, I'm pretty much just needing numticks to be chosen out of [1, 2, 3, 4, 5, 8, 15, 22, 29, 36]. So how can I have such a LinearLocator, where numticks can be one of multiple values?
jaunty helm
So I know you can unskew right-skewed data using sqrts or logs. Here's my question though: what do I do if there are negative values in the data?
past meteor
dry flame
General question about ML vs deep learning
From what I have read, ML is a subse...
AI is the most general one, a machine that makes intelligent decisions, ML is where you have a machine that uses experience to improve and imo neural networks have nothing to do with organic neural networks. They're just a class of ML algorithms, that's all. 🙂
tacit basin
To fine tune LLM base model say llama 2 7b for chat. Do I need dialog like dataset with many turns of user and assistant turns in one conversation or is instructions/answer say alpaca style dataset enough to finetune chat model?
shut girder
Does anyone know any good projects for someone who has no experience in data analysis but has a good understanding of Python fundamentals along with basic understanding of NumPy, Pandas, and matplotlib? I hope to be able to learn while attempting to complete a project.
past meteor
shut girder
Does anyone know any good projects for someone who has no experience in data ana...
One of my first projects was downloading all of my social media data and analysing that.
 lavish kraken
thick walrus
I am still stuck on my barplot for matplotlib. How do I make sure the dates do n...
lavish kraken
thick walrus
I am still stuck on my barplot for matplotlib. How do I make sure the dates do n...
Did you fix it
lavish kraken
past meteor
One of my first projects was downloading all of my social media data and analysi...
What tool did you use to analyze
past meteor
Python
fallow frost
any advice for hot-encoding some long strings on S3 + Parquet ?
the strings are unique in each file, but across the database/dataset they are all duplicates, in fact, most of the aggregation is done by grouping on that specific column, is there a way to hot-encode them across multiple files?
thick walrus
lavish kraken
Did you fix it
still kind of stuck. Changed the import from pandas to numpy and use time delta but still not clear
left tartan
thick walrus
still kind of stuck. Changed the import from pandas to numpy and use time delta ...
Share your current code?
dry flame
past meteor
AI is the most general one, a machine that makes intelligent decisions, ML is wh...
i read that neural networks are what is behind deep learning and the "algorithms that mimics the human brain" kept being brought up
 ruby thunder
Guys can anyone guide me about how can I predict about a Ground water level, Quality of Ground water at a particular location based on the a.v.g rainfall, depth of Ground water level of nearby well and other required data-set of past years.
inshort i want to make an ai based well predictor in which user will select any location and i have to give him predicition if well can be made or not
 red dust
Hello, I'm pretty good at the web, and now I want to learn data science and artificial intelligence. Can anyone recommend suitable books? In this topic I'm totally newbie
 thorn flame
red dust
Hello, I'm pretty good at the web, and now I want to learn data science and arti...
thorn flame
red dust
Hello, I'm pretty good at the web, and now I want to learn data science and arti...
Likewise guys! Help some brothers in need
But after a quick google search, I found this: https://roadmap.sh/ai-data-scientist cc: @red dust

roadmap.sh
Learn to become an AI and Data Scientist using this roadmap. Community driven, articles, resources, guides, interview questions, quizzes for modern backend development.
I'm guessing this is a relatively new stuff because I don't recall it being there
 fading pond
Hey, I'm new to python, and I want to develop AI
 shy geode
thorn flame
But after a quick google search, I found this: https://roadmap.sh/ai-data-scient...
shy geode
thorn flame
But after a quick google search, I found this: https://roadmap.sh/ai-data-scient...
thanks thats helpful!!!
red dust
thorn flame
But after a quick google search, I found this: https://roadmap.sh/ai-data-scient...
Looks good, but could use some books 😛 when I google, I get dozens of books and don't know which one is suitable for someone who already knows Python
past meteor
dry flame
i read that neural networks are what is behind deep learning and the "algorithms...
Yeah, maybe but I don't take this seriously 🤷
It's loosely inspired by the human brain but thinking of it like that will hold you back
magic dune
red dust
Looks good, but could use some books 😛 when I google, I get dozens of books and...
A bunch more here
Also if you look at channel pins you will find resources
magic dune
magic dune
https://www.microsoft.com/en-us/research/uploads/prod/2006/01/Bishop-Pattern-Rec...
I have personally used this one and find it great
left tartan
red dust
Looks good, but could use some books 😛 when I google, I get dozens of books and...
See the Pins in this channel for some suggestions. Also, CS50 for AI is a good start for someone who already knows Python. kaggle.com/learn is fine too, but very basic.
 tardy lark
can anyone help me with installing pystan on a windows pc I've tried installing directly from the git repo but get the filename too long error even though i've enabled long filenames, as well as trying the pip install pystan==2.19.1.1 pip install pystan~=2.14 and a few other variants of those 2
i've also tried in anaconda still having issues
tidal bough
tardy lark
can anyone help me with installing pystan on a windows pc I've tried installing ...
Hmm, its repo mentions it being possible to run in docker: https://github.com/stan-dev/pystan/issues/386
You could also try installing Cygwin and using it from there; that might work.
left tartan
tardy lark
can anyone help me with installing pystan on a windows pc I've tried installing ...
Could also try docker or wsl?
tardy lark
yeah i figured that's what i was gonna end up having to do
past meteor
I'd try it in WSL indeed
 harsh bane
Hoi, for you who delve and play with stable diffusion, in particular automatic1111, do you know which file to alter to not have it automatically load a model on launch? As i use comfyui the most these days, i want to run a barebone automatic1111 with no model loaded simply just to visualize the models and their names in extra networks tab on one screen, and comfyUI with all the video memory for itself on my main screen.
 tepid parcel
Hey, I am struggling with seaborn and matplotlib for ploting a graphic, could someone help me?
I posted my question here:
https://discord.com/channels/267624335836053506/1159188902947586088
Anyways, thanks!
 copper umbra
Pandas pivot tables question.
I am creating complex pivot tables but instead of nesting multi indexed row I want one sent of categories below the next set.
Is there a way to do this instead of appending
import datetime
df = pd.DataFrame(
{
"A": ["one", "one", "two", "three"] * 6,
"B": ["A", "B", "C"] * 8,
"C": ["foo", "foo", "foo", "bar", "bar", "bar"] * 4,
"D": np.random.randn(24),
"E": np.random.randn(24),
"F": [datetime.datetime(2013, i, 1) for i in range(1, 13)]
+ [datetime.datetime(2013, i, 15) for i in range(1, 13)],
}
)
pd.pivot_table(df, values="D", index=["A", "B"], columns=["C"])
Above is example an example I don't want
Fixed it but doing this but was wondering if there is a better way
pd.pivot_table(df, values="D", index="A", columns=["C"]).append(pd.pivot_table(df, values="D", index= "B", columns=["C"]))
df16BCI.columns

If the end append method is best I will make to do so may 15+times. So the example is simplified but reality will get complex
left tartan
copper umbra
If the end append method is best I will make to do so may 15+times. So the examp...
append is deprecated/removed from Pandas, you should use concat...
copper umbra
I know. It annoys me. Append was my friend
left tartan
copper umbra
If the end append method is best I will make to do so may 15+times. So the examp...
What you're doing just seems weird to me. You want a pivot by index=A and you want an index by index=B. Just seems odd to want to put these togehter like you are.
copper umbra
It is to recreate a federal reporting table that has age group then genders then races. I am trying to replicate it in my output
left tartan
hmm, in sql, we'd call this grouping sets (ie: https://duckdb.org/docs/sql/query_syntax/grouping_sets.html)
I don't think Pandas supports this
copper umbra
Ty I will look into
serene scaffold
copper umbra
I know. It annoys me. Append was my friend
Being friends with pandas append is like being friends with someone who hates you
gaunt geyser
does anyone know why python is trying to apply this function to the entire series instead of the values one by one?
df['release_date'] = df['released'].astype('str').split(" (")[0].to_datetime()
it throws the error "'Series' object has no attribute 'split'" so I assume that's what's going down
left tartan
gaunt geyser
does anyone know why python is trying to apply this function to the entire serie...
Instead of astype str, just use .str.
gaunt geyser
that helped, thank you
gaunt geyser
Okay there is development on my problem. I am able to split the string into a list of two parts, but when I use [0] to access the first item in the list, pandas pulls out the first value in the series instead.
The working code is df['release_date'] = df['released'].str.split("(")[0] and this returns the list from the first row in the dataset, for every row haha
That actually kinda makes sense
How do I make it pull the [0] list value from the corresponding rows instead of the [0] from the series?
nimble hawk
Hello, I shared a data analysis and a machine learning project using Python, I used same dataset on both projects. I shared the videos in my YouTube channel. I also provided the dataset link in the description of the video, I am leaving the link below. Have a great day!
Data Analysis Project -> https://www.youtube.com/watch?v=sV5JUFFResA
Machine Learning Project -> https://www.youtube.com/watch?v=QSb4BPCEbFM

In this video, we will explore an insurance charges dataset using Python libraries such as pandas, numpy, seaborn, and matplotlib. Through this exploratory data analysis, we will gain insights into factors that affect insurance charges such as age, BMI, smoking habits, and more. We will use various visualizations and statistical measures to unde...

Thanks for watching my video.
Some other videos I published:
- Python Data Analysis Project: https://www.youtube.com/watch?v=xuSx4jpsTz8
- Python Machine Learning Project: https://www.youtube.com/watch?v=47EzTeIuHYo
- Python Course: https://www.youtube.com/watch?v=RTClDF2jJF8
- Excel Course: https://www.youtube.com/watch?v=9PT7qOtxYmA
My web...
fallow frost
I'm comparing DuckDB's peformance to Datafusion, and the former is 10 times faster. I was suspecting it was using cached results, but I tried with different quries, and now I'm sure its much faster
it seems that on average Duckdb is 2x faster than Datafusion for SQL queries on Paruqet files on S3
and it caches automatically, unlike datafusion
 queen current
hey guys
is there an AI tool that can handle my codes ? chatgpt gets broken halfway through when i give him a 200+ line file to audit and fix minor errors
 rapid cedar
hey, any suggestion on what should i learn before learning pytorch? i already learned numpy btw
left tartan
rapid cedar
hey, any suggestion on what should i learn before learning pytorch? i already le...
The usual ones I suggest are: Kaggle.com/learn and cs50 for ai. Kaggle is just the basics but it’ll cover any weak points you might have. Cs50 for ai gives you a broad survey of ai/ml stuff.
left tartan
rapid cedar
hey, any suggestion on what should i learn before learning pytorch? i already le...
That’s not covering any of the math/conceptual stuff. For an absolute starter, see 3b1b: https://youtube.com/playlist?list=PLZHQObOWTQDNU6R1_67000Dx_ZCJB-3pi&feature=shared.
past meteor
rapid cedar
hey, any suggestion on what should i learn before learning pytorch? i already le...
Imo it depends on how far you want to go in ML. If you're a SWE and you just want to build stuff that uses AI from time to time, just use Keras, not even Pytorch. Then you're likely good to go to read their docs and learn the basics.
If you're in it for the long haul, then it's less about learning libraries, that takes a day max, but more about the underlying maths, stats etc.
desert oar
odd meteor
I guess the major compensation is being added as one of the authors of the resea...
Fair, I'd love to participate, but without a sense of the commitment it's hard to agree. Have a family and a day job
queen current
@left tartan@past meteor@desert oar
left tartan
queen current
<@738234281146712084><@260493929047130113><@389497659087650836>
What’s the question?
queen current
left tartan
What’s the question?
is there better alternative than chatgpt
3.5
for helping to fix my code
left tartan
I don’t use ai to write/fix my code. The better alternative is either to figure it out yourself, or ask for help #❓|how-to-get-help
left tartan
No idea. What’s your actual problem?
queen current
im building GUI window, but there is unexpected results that i dont want
left tartan
GPt/ai is not a solution for writing code. It writes bad code, buggy code that often doesn’t work or meet the requirement, and is unusable unless you have sufficient skill to understand the code
So try to isolate the problem or question you’re having, and then ask in #python-discussion or #❓|how-to-get-help . Don’t just post a huge block of code: isolate the problem and explain it
queen current
😭
i donnu where the issue exactly i would have to post a huge block code of nearly 200 line
left tartan
queen current
i donnu where the issue exactly i would have to post a huge block code of nearly...
200 lines isn't that huge, the question is: can you isolate your problem and clearly explain what exactly isn't working?
Anyway, this is the wrong channel for this, just open a help thread plz.
queen current
sure, its more of one of the icons that should save data in .json file, but it never does, as soon i close GUI window, it resets litturarly
tardy lark
can anyone help me out i've tried a few different things and i keep getting this error shown below I've tried setting dtype=object and without it get the same error but that's the only fix i could find on the ole' google
setting an array element with a sequence. The requested array has an inhomogeneous shape after 1 dimensions. The detected shape was (5807,) + inhomogeneous part.
        scaled_data = scaler.fit_transform(final_data)
        x_train_data, y_train_data=[],[]
        for i in range(60,len(train_data)):
            x_train_data.append(scaled_data[i-60:i,0])
            y_train_data.append(scaled_data[i,0])

        x_train_data = np.asarray(x_train_data, dtype=object).astype(np.float32)
        y_train_data = np.asarray(y_train_data, dtype=object).astype(np.float32)

        #lstm model

        lstm_model=Sequential()
        lstm_model.add(LSTM(units=50, return_sequences=True, input_shape=(np.shape(x_train_data)[1], 1)))
        lstm_model.add(LSTM(units=50))
        lstm_model.add(Dense(1))

        model_data=data[len(data)-len(valid_data)-60:].values
        model_data=model_data.reshape(-1,1)
        model_data=scaler.transform(model_data)

        lstm_model.compile(loss='mean_squared_error', optimizer='adam')
        lstm_model.fit(x_train_data, y_train_data, epochs = 1, batch_size = 1, verbose = 2)

        x_test=[]
        for i in range(60,model_data.shape[0]):
            x_test.append(model_data[i-60:1,0])
        x_test=np.array(x_test)          -------------------------------------> error occurs here
        x_test=np.reshape(x_test, (x_test.shape[0], x_test.shape[1], 1))
i-60:1 is a strange slice - since i>=60, that's always going to be 0-sized, isn't it?
tardy lark
tidal bough
`i-60:1` is a strange slice - since i>=60, that's always going to be 0-sized, is...
idk i'm still new to data science but that did fix the issue, but now i'm getting the error
setting an array element with a sequence.
at
y_train_data = np.asarray(y_train_data, dtype=object).astype(np.float32)```Don't use dtype=object - it won't work anyway, it allows you to make ragged arrays but the model won't accept them.
tardy lark
tidal bough
Don't use `dtype=object` - it won't work anyway, it allows you to make ragged ar...
when i remove that it goes back to giving me the error
tidal bough
What's the type and shape of scaled_data? That first loop looks like it should be producing a non-ragged sequence.