#data-science-and-ml
1 messages · Page 71 of 1
 civic elm
 left tartan
If you’re very interested, I enjoyed this book; Advances in Financial Machine Learning https://a.co/d/0jXn9FR

Advances in Financial Machine Learning
 sleek harbor
does it matter which dummy variable you drop? Just looking for confirmation that the following is accurate: "The choice of which dummy variable to drop is arbitrary and doesn't affect the model's overall performance." I've read somewhere else that one should drop: the most populated category; the least populated category; the category that least contributes to the target variable. What is correct, or does it not matter at all? And if it indeed doesn't matter at all for the performance of the model, what about interpretability?
 shadow viper
sleek harbor
does it matter which dummy variable you drop? Just looking for confirmation that...
shadow viper
sleek harbor
does it matter which dummy variable you drop? Just looking for confirmation that...
The tutorial I follow always drop the last dummy variable.
Maybe it doesn't matter which you drop. I guess it all depends on which column is most important to you
 lapis sequoia
sleek harbor
does it matter which dummy variable you drop? Just looking for confirmation that...
lapis sequoia
sleek harbor
does it matter which dummy variable you drop? Just looking for confirmation that...
i think it doesn't matter
I'm using the IOU variant introduced in this paper: https://arxiv.org/abs/2303.15067. It worked well until now when i was using SGD as optimizer but when i use Adam sometimes the training works and i get results and sometimes i start getting large negative values for IOU and i don't know why. Its the same code, when i launch it a first time i get good results with adam and when i do that another time i can get values like -100000. Does anyone have some intuition on this or can enlighten me as to why this is happening?
 hasty mountain
Hey guys, can someone give me some help on deciding hyperparameters for feature extraction in neural networks?
I want to decide how many convolution channels and linear weights I should add to my neural network for feature extraction on CIFAR100 dataset. Problem is, I don't know if, from 32x32x3 images I should make the model make like, 16 convolutions, 64, 128...
I know that this is a bit of trial and error, but isn't there a trick so I can have a range of possibilities to test?
lapis sequoia
hasty mountain
Hey guys, can someone give me some help on deciding hyperparameters for feature ...
What i do is that I first try to make a training loop that works by making a simple models that doesn't necesseraly perform well but that can at least overfit the data. So I train it on 1 batch only and check if it can overfit. If yes, then everything else seems to work fine. I then proceed to train on the whole dataset and would get some low results on both train and val since its a simple model. I start adding layers with large layers first and small layers at the end (not to have a bottleneck). I start doing so to at least get enough model complexity to be able to learn the training set and maybe perform poorly on validation (overfitting) then i would change a little bit the architecture in order to have less overfitting or maybe tweak other hyperparameters. This is not a recipe this a rule of thumb for me as to how i would start working on this
lapis sequoia
hasty mountain
Hey guys, can someone give me some help on deciding hyperparameters for feature ...
this may help you http://karpathy.github.io/2019/04/25/recipe/?fbclid=IwAR14qzU0WPypUSd2cJDn8_3GVDh6VjIcHBHcVJsLN9t7HtUkUfxzrluaaYY
Musings of a Computer Scientist.
hasty mountain
lapis sequoia
this may help you http://karpathy.github.io/2019/04/25/recipe/?fbclid=IwAR14qzU0...
Thanks! I was kind of thinking about doing something like, using a certain architecture, begin tests with as few features to be extracted as possible, and then increasing them.
lapis sequoia
start with a simple cnn to get some intuition as to what is happening there
 abstract mirage
https://www.youtube.com/watch?v=E1kffL4_AS8 looking for somthing like this
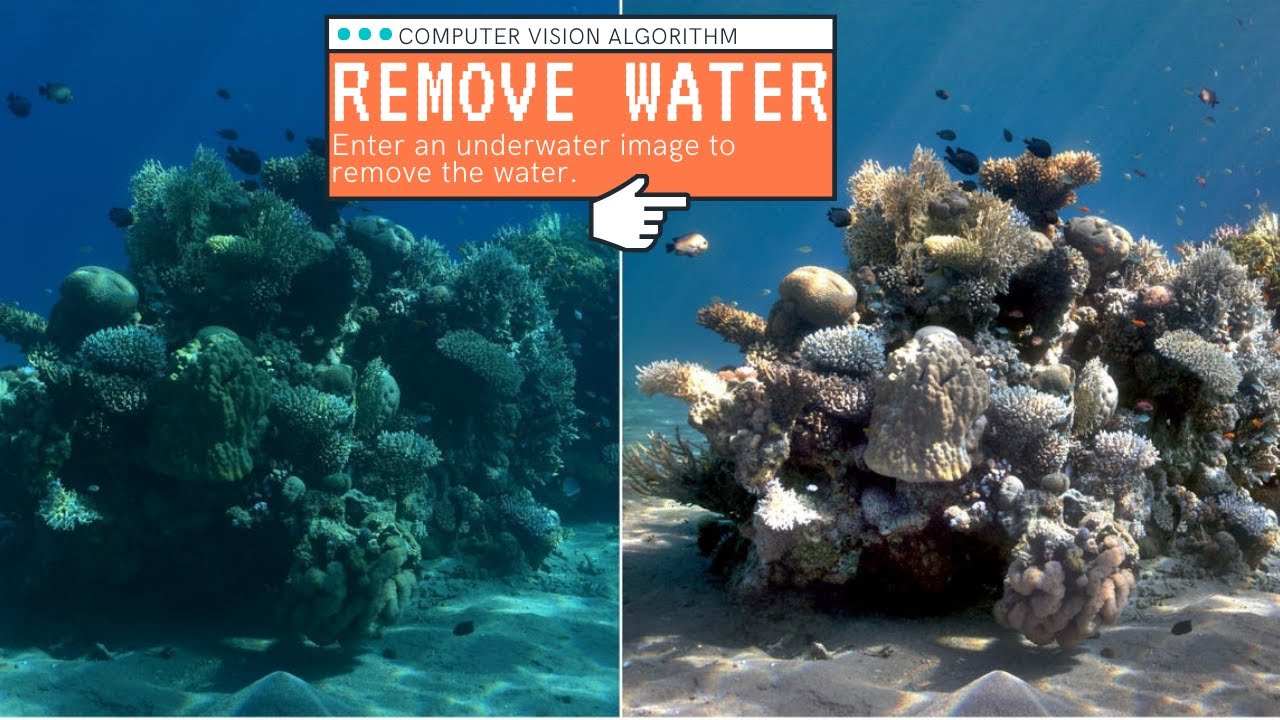
Read the article: https://medium.com/towards-artificial-intelligence/this-ai-removes-the-water-from-underwater-images-d277281bcd0f
The paper: https://openaccess.thecvf.com/content_CVPR_2019/papers/Akkaynak_Sea-Thru_A_Method_for_Removing_Water_From_Underwater_Images_CVPR_2019_paper.pdf
The project & datasets: http://csms.haifa.ac.il/profiles/tTre...
 rancid mango
It is recommended for a top down learning path or bottom up? for ML
lapis sequoia
is it feasible to have an imaginary conversation with a historical person, like let's say Moses or Aristotle via machine learning? Like I thought of asking chatgpt to prented to be this person and answer my questions, but I was thinking since chatgpt is trained on a lot of data, maybe it would be better to make something specialized for a specific person
 tidal bough
Go check out character.ai, I guess.
Though most of these are, notably, trained more to act like a chatbot pretending to be that character than to act like that character. As in, I don't think they are actually trained to replicate a dataset made from someone's writings. E.g. the basic character creation on character AI is literally just a prompt: https://book.character.ai/character-book/how-to-quick-creation
and adding any behaviour examples at all is in "advanced".
 pseudo spire
@rancid mango I don't understand how top down learning is possible. More complex things are based on simpler ones
 plucky bolt
Anyone here know the difference between draw and show methods for matplotlib plots? It looks like within my for loop, I am not even requiring any of it for the figure window to continueously update my plots.
 timid grove
Hey folks,
Hope you all are doing good.
I am making an english - marathi translator, i fine tuned different pre trained 🤗 models (IndicBert(AI4Bharat) , facebook's mbart50) on my english - marathi dataset which has 3.5 million rows.
But i achieved lowest loss of 1.2. I want to further lower my loss.
Anyone please find time and suggest some ways to improve my model's loss.
I also tried to add some custom layers(LSTM, Conv1d, Linear layers) to the pretrained indic bert model body as the model is small in size, but did not achieved good results.
I could also provide the github repo link if anyone wants to have a look at my code.
Any of your inputs will be highly appreciated.
Thank You in advance.
timid grove
Please share your inputs
It will be highly appreciated.
 soft badge
guys anyone know if this web site usses anyone model of IA, like GPT, stablle difusion?

Design Architecture with AI, transforming your ideas into stunning reality.
 cerulean kayak
hey guys, real quick would this elbow method give me an elbow point of 3, 4, or 5?

 past meteor
sleek harbor
does it matter which dummy variable you drop? Just looking for confirmation that...
past meteor
sleek harbor
does it matter which dummy variable you drop? Just looking for confirmation that...
Doesn't matter which one you drop
past meteor
hasty mountain
Hey guys, can someone give me some help on deciding hyperparameters for feature ...
Ideally you would cross validate. NN's are expensive to train so this isn't done.
Next best thing is train and evaluate on your validation set while training. If your network is small or you have multiple GPUs you random search because it's embarrassingly parallel. If not, bayesian opt or something similar. Do it in a principled way, don't do graduate student descent https://en.m.wiktionary.org/wiki/graduate_student_descent https://sciencedryad.wordpress.com/2014/01/25/grad-student-descent/

On January 24, I attended a 1-day data science symposium at Harvard University with the fun title ‘Weathering the Data Storm’. I imagine being in a tiny boat on the endless beautiful se…
sleek harbor
past meteor
Doesn't matter which one you drop
does that change if you afterwards end up dropping more dummy categories? Like.. say first you drop A (so it's now the reference). A is an informative category. Next you drop B, which is not an informative category. That effectively merges A+B to make the reference, which makes it less informative. If you know that you will potentially be dropping features that don't contribute much to the target variable, then does it make more sense to initially drop the lease "informative" dummy? Or does it still not matter?
When and how should you center/standardize your predictor variables when applying polynomial transformations? In one place I read that you should center, not standardize, before, to minimize multicollinearity, and standardize afterwards to bring them to the same scale. In another place I read that you should standardize before and center afterwards (and this is supposedly the default in some R packages).. most tutorials do nothing before and standardize afterwards.. What is the correct way, and if "it depends", then on what?
plucky bolt
cerulean kayak
hey guys, real quick would this elbow method give me an elbow point of 3, 4, or ...
I am not sure what you are asking about but n=5 looks like where the “elbow” is. And I say that because the rate of change changes dramatically after that point compared to the previous change.
past meteor
sleek harbor
does that change if you afterwards end up dropping more dummy categories? Like.....
Not really, don't overthink it. The dropped category can be considered as "rest", that's all
You can group variables by dropping both of them
 high lark
my first ml algorithm (linear regression), any improvements?
import pandas as pd
import matplotlib.pyplot as plt
plt.style.use('nord.mplstyle')

data = pd.read_csv('data.csv')

def mxline(slope, intercept, start, end):
    y1 = slope*start + intercept
    y2 = slope*end + intercept
    plt.plot([start, end], [y1, y2])

def grad_desc(data, w=0, b=0, alpha=0.001, epochs=1000):
    for _ in range(epochs):
        for i in range(len(data)):
            w -= alpha * 2 * data['x'][i] * (w * data['x'][i] + b - data['y'][i])
            b -= alpha * 2 * (w * data['x'][i] + b - data['y'][i])
    return w, b

w, b = grad_desc(data)

plt.scatter(data['x'], data['y'])
mxline(w, b, 1, 11)

plt.show()

well the grad_desc function is the only actualy machine learning part
tidal bough
I'd declare x,y = data["x"], data["y"] before the loop to simplify the code in the loop
(because it's python, it'll even slightly speed it up by removing the extra accesses, but mostly this is for readability)
Also, if you use numpy arrays you won't need loops over the lists.
Oh, although I guess it'd technically change the process since it'll be equivalent to using big batches rather than 1-data-point ones.
shadow viper
Hey everyone, hope all is going well
I was trying to install tensorflow 2.12 using pip and it's size is 272mb and installing tensorflow_intel
The tutorial I was following was 430mb and it was just tensorflow 2.7
Why is mine different?
hasty mountain
past meteor
Ideally you would cross validate. NN's are expensive to train so this isn't done...
Lol, Grad student descent.
Thanks!
Ok, I think I never used Bayesian optimization to select hyperparameters.
For my NNs, I could then define a neural network that must produce outputs that provide the minimum KL-Divergence between that output and a Gaussian Distribution? Something like it's done for a VAE Encoder?
hasty mountain
Hm... I've read a bit about it. I think it's something more or less used in Reinforcement Learning...surrogate function, surrogate loss in PPO...
I suppose I could make a simple, shallow network that could try to predict the next value of an objective function(or, the cumulative reward for that training session) while also modifying my model's hyperparameters...
Or I could simply use skopt library, which would be more efficient...but less fun

sleek harbor
can't get rid of warnings.. anyone know how to suppress them?
 left tartan
Yah, there’s a flag… https://stackoverflow.com/questions/32612180/eliminating-warnings-from-scikit-learn#33616192

Stack Overflow
I would like to ignore warnings from all packages when I am teaching, but scikit-learn seems to work around the use of the warnings package to control this. For example:
with warnings.catch_warnin...
sleek harbor
left tartan
Yah, there’s a flag… https://stackoverflow.com/questions/32612180/eliminating-wa...
it.. doesn't work 😭
left tartan
See the part about running in different namespaces than main: https://docs.python.org/3/library/warnings.html

Python documentation
Source code: Lib/warnings.py Warning messages are typically issued in situations where it is useful to alert the user of some condition in a program, where that condition (normally) doesn’t warrant...
(Since you’re running in a notebook)
I can try to repro later and see if there’s something funky here, but I’ve had to do this before with sklearn
sleek harbor
locals() returns '__name__': '__main__', so.. idk
left tartan
When I get home I can check my repo for what I did
sleek harbor
left tartan
When I get home I can check my repo for what I did
pls @ me if u find anything
 crimson summit
@iron basalt I read everything and it makes alot more sense now. The only thing I dont understand is how does the Q network not converge to the incorrect target since the target network is being updated much slower. I understand that the target network is being updated slower to be more stable but wouldnt the Q network just converge to the incorrect target because the network that is providing the estimate for future values (target network) is being updated slower so it will be in accurate for longer ?
 potent sky
sleek harbor
can't get rid of warnings.. anyone know how to suppress them?
potent sky
sleek harbor
can't get rid of warnings.. anyone know how to suppress them?
Idk specifically about sklearn but warnings.filterwarnings() might help?
!d warnings.filterwarnings
 arctic wedgeBOT
warnings.filterwarnings(action, message='', category=Warning, module='', lineno=0, append=False)```
Insert an entry into the list of [warnings filter specifications](https://docs.python.org/3/library/warnings.html#warning-filter). The entry is inserted at the front by default; if *append* is true, it is inserted at the end. This checks the types of the arguments, compiles the *message* and *module* regular expressions, and inserts them as a tuple in the list of warnings filters. Entries closer to the front of the list override entries later in the list, if both match a particular warning. Omitted arguments default to a value that matches everything.Oh mb I didn't check the pic in your question, was in a hurry
I guess you've tried using just simplefilter()?
sleek harbor
potent sky
I guess you've tried using just simplefilter()?
yeah, didn't work
potent sky
sleek harbor
yeah, didn't work
Have you tried wrapping it in a warnings.catch_warnings() context
And removing all the capture magic
A simplefilter should work tho...idk what I'm missing here
sleek harbor
potent sky
Have you tried wrapping it in a warnings.catch_warnings() context
And removing a...
yeah, tried that. No result
left tartan
Hah, I found this in one of my notebooks: ```py
for sklearn
def warn(*args, **kwargs):
pass
import warnings
warnings.warn = warn
I don't recommend it tho
potent sky
sleek harbor
can't get rid of warnings.. anyone know how to suppress them?
What type is the study object?
sleek harbor
potent sky
What `type` is the `study` object?
optuna.study.study.Study 🤷♀️
potent sky
sleek harbor
optuna.study.study.Study 🤷♀️
So I had a look at the source and it looks like since you've not set the n_jobs parameter, the default will spawn n_jobs in parallel the same as the number of CPU cores on your machine
This means each of the spawned jobs might not inherit the same warnings filter setting set in the original job/file the code was run in
Try setting n_jobs explicitly to 1
Or if you want to take advantage of parallel jobs, explicitly set the environment variable os.environ['PYTHONWARNINGS'] = 'ignore'
Apart from maintaining the filterwarning() ofcourse
sleek harbor
potent sky
Try setting `n_jobs` explicitly to 1
Or if you want to take advantage of paralle...
this does nothing, i didn't even know it had an n_jobs parameter.. didn't see it in the documentation
sleek harbor
potent sky
Try setting `n_jobs` explicitly to 1
Or if you want to take advantage of paralle...
but this worked! Thanks!
I have no idea what that line of code does tho, are there any drawbacks? Works :3
potent sky
It'll ignore all python warnings ig ;-;
Cleaner way would've been to just not have any spawned jobs and a filterwarning() would've worked
Weird how you say n_jobs=1 doesn't help
Maybe they've got something under the hood
cerulean kayak
plucky bolt
I am not sure what you are asking about but n=5 looks like where the “elbow” is....
So first off, this is for a homework in datascience (yes gross college). I asked my peers (because they also have to do the assingment) and they got 5 as well.
How/why? x=4 looks more like an "elbow" to me than x=5.
Is the elbow point the point where the derivitive changes from being "super negitive" to "slightly negitive"/asyntopic?*
*and as you can tell by the way that I am butchering these math terms, I am not interested in an exact mathmatical way of getting an anwser; however, because I am new to this and not able to easly make a judgement, I want to word it in more concrete terms.
sleek harbor
potent sky
Cleaner way would've been to just not have any spawned jobs and a filterwarning(...
idk how that would help, but maybe it's cus I'm also running cross_val_score with n_jobs at -1 (and when I "optimize" the study, it executes the cross_val_score function, and a pipeline, which also has -1 specified everywhere I could find such a parameter). Idk how things work under the hood). I just specify n_jobs to -1 whereever I can to make things "faster".. that's how it works.. right?
lapis sequoia
Hello, i need help in langchain, conversational memory and embeddings
Is this the right channel?
left tartan
sleek harbor
idk how that would help, but maybe it's cus I'm also running cross_val_score wit...
Stargazers environment variable answer is probably what I’d go with.
sleek harbor
left tartan
Stargazers environment variable answer is probably what I’d go with.
yeah, it's the only thing that worked
potent sky
sleek harbor
idk how that would help, but maybe it's cus I'm also running cross_val_score wit...
Yep then I suspect when it's running trials for that study to perform hparam optimization, each individual trial itself will spawn multiple jobs
To which the filterwarning() won't be applied
Phew, finally makes sense
I looked at the source and seems like that's what it's doing
left tartan
Yah, that makes sense. That's one of my frustrations with multiprocessing (logging/etc)
 iron basalt
crimson summit
<@119925597395877889> I read everything and it makes alot more sense now. The on...
iron basalt
crimson summit
<@119925597395877889> I read everything and it makes alot more sense now. The on...
If I estimate the prices for items using a table, but update the table once a month I can still improve, just more slowly and in a way that is less affected by noise.
crimson summit
iron basalt
If I estimate the prices for items using a table, but update the table once a mo...
But if you estimate prices for items using a table and then you correct your model (Q network) based on that table wont it converge with the results of the incorrect table faster than the table (target network) can correct itself ?
wont the q network converge with target network before target network reaches the point where it is outputting accurate estimations if you are updating q network so often and target network so little so it will match the bellman equation but the target estimation will still not have gotten to accurate estimation ?

idk if this shitty sketch helps with my question lol
iron basalt
crimson summit
wont the q network converge with target network before target network reaches th...
You are ignoring the actual immediate reward values.
crimson summit
iron basalt
You are ignoring the actual immediate reward values.
i know i add the immediate reward value in the bellman equation and then add that to the estimate of target network but how exactly does that help with what i am talking about ?
my bad if i am sounding redundant
iron basalt
The Q network does not converge to the target Q only. The TD target is reward plus the discounted Q value from the target Q.
So you are adjusting to the actual rewards, plus an estimate, and that estimate part changes more slowly every few steps, rather than every step.
The goal is to not have a moving target (reduced movement from your own estimation updates).
crimson summit
iron basalt
The goal is to not have a moving target (reduced movement from your own estimati...
but if the estimated target is not accurate then whats the use ?
iron basalt
crimson summit
but if the estimated target is not accurate then whats the use ?
It will take mostly random actions. It does not know what it does not know yet.
Note that terminal states are only the immediate reward.
Q learning creates a backwards chain of bread crumbs.
Like an ant leaving a chemical trail for others to follow once it randomly found food.
crimson summit
iron basalt
It will take mostly random actions. It does not know what it does not know yet.
that the exploitation vs exploration part of the equation i think
iron basalt
crimson summit
that the exploitation vs exploration part of the equation i think
Yeah. But since the estimates are bad, the max actions according to the Q estimate is also more or less random nonsense at first.
It has the immediate rewards to help, but it's getting randomness from the estimates.
crimson summit
iron basalt
Yeah. But since the estimates are bad, the max actions according to the Q estima...
your not making weight updates at this stage yet or you are ?
iron basalt
If your reward is something nice like a scent that grows stronger the closer you get to food, you always have an immediate reward signal to follow. Harder is when you get all zeros until you reach the food.
The replay buffer helps create the chain bit by bit randomly. Rather than having to rerun again and again.
crimson summit
iron basalt
It has the immediate rewards to help, but it's getting randomness from the estim...
so how does the algo ensure that your not updating the weights to so that the q network will not output the same value as the reward+incorrect estimate but outputs the reward +correct estimate
crimson summit
iron basalt
The replay buffer helps create the chain bit by bit randomly. Rather than having...
oh okay 👍
iron basalt
crimson summit
so how does the algo ensure that your not updating the weights to so that the q ...
Try making up some reward values and random estimates to start, update the estimate by hand following the equation.
 gritty mural
guys, know well explanation the concept of coding about Supervised Learning, Unsupervised Learning and Reinforcement Learning in ML. These 3 topics are hard to understand, can you help me?
 small wedge
gritty mural
guys, know well explanation the concept of coding about Supervised Learning, Uns...
small wedge
gritty mural
guys, know well explanation the concept of coding about Supervised Learning, Uns...
Supervised: all the data in the dataset has labels (a ground truth for us to calculate error for the model's predictions)
Unsupervised: all of the data is unlabeled
Reinforcement learning: an agent interacts with some environment. this agent has a policy which tells it how to preform actions, and a reward function that tells it which policies are better or worse
gritty mural
small wedge
Supervised: all the data in the dataset has labels (a ground truth for us to cal...
but about the coding, i need an examples of linear & logistic regression and others that make me understand easily based on that 👆
small wedge
you're asking for code for supervised, unsupervised, and reinforcement learning algorithms? or just descriptive examples of the data you are working with for linear and logistic regression being applied with each?
gritty mural
not being applied, as a learning and understand the concept for coding to develop as own
 vestal spruce
How can speech recognition model distinguish a dialogue from monologue?
hasty mountain
vestal spruce
How can speech recognition model distinguish a dialogue from monologue?
I suppose it must be able to distinguish different people speaking.
Afterall, different people have different voice tones, different frequencies in their voices, different waveforms... 
 abstract sinew
Could I get some eyes on https://discord.com/channels/267624335836053506/1125076298331594842 . My guy needs some help
 dusk tide
Hi guys, I am trying to render a line plot (made with plotly) in streamlit but it is not happending .The code is correct and is working fine on kaggle notebook. Can someone help? Left one is on streamlit and right one on kaggle.


 thin geyser
Anyone here good with deep learning?
left tartan
dusk tide
Hi guys, I am trying to render a line plot (made with plotly) in streamlit but i...
If code is identical, compare versions(plotly, pandas, etc). But given the axes are rendering diff, maybe also check the df.dtypes to see if they’re different, I suspect they are.
 umbral delta
hi how can i get a tf tensor from tfds.load()
 sharp zenith
there's an AI to compress files?
 boreal valley
there will most likely never be
you'll never get your data back if it's compressed with AI
 mild dirge
boreal valley
you'll never get your data back if it's compressed with AI
mild dirge
boreal valley
you'll never get your data back if it's compressed with AI
That is completely not true, and an autoencoder (encoder+decoder) does exactly that, compressing data @sharp zenith
But those are not loss-less, and some artifacts will definitely be there
small wedge

mild dirge
Here are some examples from a project I did the other day, which compresses point clouds and then decodes them again. The point cloud is 1024 3d points (so 3072 floats) and the encoded file is only 20 floats.

Obviously the decoded ones are not the same, but for compressing it to only 0.6% of original size it is pretty good
 proven sigil
sharp zenith
there's an AI to compress files?
proven sigil
sharp zenith
there's an AI to compress files?
AI is just math functions. So yes.
I mean feed forward neural networks
boreal valley
mild dirge
Obviously the decoded ones are not the same, but for compressing it to only 0.6%...
Yeah, you don't get the original data back, so therefore it is not your original data.
For a lot of uses, that makes it completely useless
Try compressing a 1GB log file with your thing, and see if the same log file is put back out
mild dirge
It's not for all use cases yeah, but formats like jpg are still very widely used 😛
compression with loss isn't useless
boreal valley
I havent used jpg in over a decade lol
lossless compression is very important for a lot of usecases
mild dirge
Right, but that doesn't contradict what I just said
Anyways, it's possible, do you need it to be lossless, what kind of files do you even want to compress @sharp zenith
past meteor
mild dirge
Here are some examples from a project I did the other day, which compresses poin...
Was this pointnet or some geometric deep learning architecture?
mild dirge
Really simplified point-net. Just 1d convolutional layers, took it mostly from some github just to play around with it.
!paste
This is the architecture if you care about it
past meteor
Thanks, good stuff
 zenith hedge
What python library is recommended for RL visualization, GUI side? Should I use Kivy or is other recommended library for this functionality?
past meteor
I usually render with the command line but Pygame works
sharp zenith
proven sigil
AI is just math functions. So yes.
I believe it's possible too, but we have some public AI to do it ?
My question is about find the best compression method using AI
For example, most compress algorithm use a dict to minimize data and then restore it when decompressing
Is there some AI capable to find the best dict solution?
loss-less
sharp zenith
mild dirge
Anyways, it's possible, do you need it to be lossless, what kind of files do you...
any type, since it's possible convert bytes to text
iron basalt
zenith hedge
What python library is recommended for RL visualization, GUI side? Should I use ...
Any game engine, e.g. Panda3D. If you are doing robotics, PyBullet. If just 2D, pygame-ce. Anything that creates an OpenGL context can use the Python Dear ImGUI package for a GUI.
 wanton sentinel
Does anyone know why pandas sample(frac=0.5) wouldn't be returning exactly 50% of a DF? It's very close, but not exact.
all_tmp = all_df.loc.sample(frac=0.1)
val_a = all_tmp.sample(frac=0.5).index
val_b = all_tmp.drop(val_a).index

Total group (all_df):       125633
10% group (all_tmp):        12556
50% of 10% group (val_a):   6282
Remainder 10% group (val_b):6274
Never mind... I'm a real dumb dumb. There were multiple layers of grouping, so of course the sampling isn't gonna be precise across them all.
 late jungle
Hey friends, I tried to explain the subject of "decorator", which is called meta programming in Python and we can add different features to it without changing the source code of the function. I hope you will like it. Any feedbacks are more than welcome!
https://semih-gulum.medium.com/python-decorators-6635b69b131e

 twilit swan
Any of you guys know how to solve this issue? My python version is 3.10 and i have the latest stattools installed
 sleek harbor
I'm having some trouble with XGBoost reproducibility.. the following are 3 runs of the same notebook. As you can see, everything is the same.. except for XGBoosts results run on test data.. I don't get it at all tbh. First of all, if I just rerun the notebook (with kernel reboot) - everything is fine, even with XGB. But if I reboot my laptop - then results for XGB change.. but only for the scores on test data, not cross val scores on train data.. I've put random_state seeds everywhere, train_test_split is done properly, with a seed (works for everything else). I can't imagine I messed up somewhere, because I'm calling the same function on all of these to calculate the test score.. but for XGB it's different, but only when I reboot my laptop, and only for some parameter sets. (p.s. the numbers (i.e. test_1, test_2) are hyperparameter combinations, and I checked - they remain the same.. so something different must be happening either when I .fit(), or .predict() with XGB)
I got no idea what's up, especially because if you look at test_3, test_4 - the results don't change.. and one time it didn't change for test_1 either, and one time it got the same value for test_2.. 🤔 I can't imagine what the problem is..


 devout oak
Guys any idea where i can find HTTP payloads with a bunch of malicious code in them, let it be SQL injections or Cross-Site Request Forgery and others , need this data to train a model
 dusky merlin
so cooool
 amber shoal
Great Medium blog about chatgpt for blogging
https://medium.com/@murataliavcu1/free-chatgpt-course-for-blogging-7550fafb6490
Medium
ChatGPT: The Personalized Blogger App — Unleash Your Creative Potential!
 serene scaffold
amber shoal
Great Medium blog about chatgpt for blogging
https://medium.com/@murataliavcu1/...
serene scaffold
amber shoal
Great Medium blog about chatgpt for blogging
https://medium.com/@murataliavcu1/...
Did you write this?
 subtle knot
Are most data science and machine learning jobs looking for only people with masters/PhD and a lot of work experience?
serene scaffold
subtle knot
Are most data science and machine learning jobs looking for only people with mas...
you usually need a masters
subtle knot
What roles could I get as somebody with only their bachelors
serene scaffold
subtle knot
What roles could I get as somebody with only their bachelors
I got a role as a computational linguist with only a bachelors, but only because I had experience with formal linguistics and published in an academic journal as an undergraduate.
do you already have a bachelors, or are you pursuing one currently, or what?
subtle knot
I am currently pursuing one
I was learning data science for the last few months so wanted to know about the opportunities after I get my degree
thin geyser
I'm trying to train a ddpm with the https://github.com/openai/guided-diffusion repository. I'm using lambda labs to run the program. I'm trying to train it on a custom dataset. It worked with Google colab initially but was too time consuming and kept getting disconnected (hence the switch to lamdalabs cloud). With a pretrained model as checkpoint, there are some weights and biases missing and without a pre trained model, there is a cuda memory error. Can I get some help with this?

GitHub
Contribute to openai/guided-diffusion development by creating an account on GitHub.
hasty mountain
thin geyser
I'm trying to train a ddpm with the https://github.com/openai/guided-diffusion r...
This model is obscenely expensive. It's an agglomerate of many models together(I think there's an Attention UNet, the Diffusion Model and, if you're using conditioned outputs, I think there might be another one, or at least more layers). I suppose that's why they don't even measure the training through "epochs", but through "steps". And I think it also generates many image samples through training
It's best to try and train it from scratch using low hyperparameters to try to make it less expensive
thin geyser
hasty mountain
This model is obscenely expensive. It's an agglomerate of many models together(I...
So generally, for GANs at least, the procedure is to check the reconstructed images using models saved after different epochs so as to get a good picture of the best performing model. What would that be like here? From my understanding, each step refers to one batch of input passed forward and backward through the model. What would be a good way to evaluate the performance here?
hasty mountain
thin geyser
So generally, for GANs at least, the procedure is to check the reconstructed ima...
You could try to calculate how many steps would be equivalent to N epochs, and then try to evaluate the images after those steps
thin geyser
hasty mountain
You could try to calculate how many steps would be equivalent to N epochs, and t...
Hmm okay
 rich sail
Hey, could anyone help me with my problem in #1035199133436354600 ?
 iron valve
should i be learning probability before stats?
left tartan
iron valve
should i be learning probability before stats?
Isn’t that the normal path? How else could you learn stats without understand prob first?
serene scaffold
@left tartan @iron valve they're closely interrelated, are they not? The one stats course I took taught both in the same course
left tartan
Yah, I mean, a stats course starts with basics of prob
 slender kestrel
past meteor
I usually render with the command line but Pygame works
slender kestrel
past meteor
I usually render with the command line but Pygame works
heey !
 remote saddle
Does anyone know where I could go for talk about PySpark?
past meteor
iron valve
should i be learning probability before stats?
Probability is a prerequisite go statistics but is different imo
 tulip marsh
remote saddle
Does anyone know where I could go for talk about PySpark?
tulip marsh
remote saddle
Does anyone know where I could go for talk about PySpark?
Are you asking for a video, tutorial or event?
past meteor
The things I learnt in probability theory are not directly relevant to DS work imo
remote saddle
tulip marsh
Are you asking for a video, tutorial or event?
more like place to ask questions, similar to how here is for python
 dire violet
im new to ds and i wanted to ask, in terms of calculating cosine similarity it depends on the dimensions right? how do people normally calculate (for example) if a person likes this movie or not. Given that the person likes 2 categories of movies, and there are millions of movies each having multiple categories, wouldnt there be a lot of dimesnions?
civic elm
Any tips on how to get past week 2 of Andrew ng course?
I really want to understand linear regression in terms of coding and not whiteboard lecturing
I'll get there eventually
serene scaffold
civic elm
I really want to understand linear regression in terms of coding and not whitebo...
If you know python, and you understand linear regression, then you should be able to code it
If not, at least one of those two is missing.
dire violet
how come my kernel crashes whenever i run this:
from scipy.sparse import coo_matrix

interactions = coo_matrix((df["Score"], (df["UserId"], df["ProductId"])))
model = LightFM(loss="warp")
model.fit(interactions, epochs=10)
its something to do with the fit part but im not sure why
 slim lance
Is there a good discord server/channel for BI/DE?
 deft sinew
Can you work with excel files the same way you could work with CSV? Or should excel files be transformed into CSV format. For reference I want to access columns and data like I can with CSV or JSON files.
small wedge
deft sinew
Can you work with excel files the same way you could work with CSV? Or should ex...
in general you can interface with excel files the same way you would with CSV files using something like pandas, without the need to convert file formats. In some cases there can be formatting issues though depending on your specific excel file.
deft sinew
thanks
slender kestrel
past meteor
The things I learnt in probability theory are not directly relevant to DS work i...
hello you avalible for a moment i had a question
for finding the correlation between 2 time series data should i use the percentage change values of the data or should i directly use the data values
like in pearson correlation ik that i should use the percentage change
but in TLCC
should i use the data values of should i sue the percentage change values
similarly in DTW and Instantaneous phase synchrony
 little vector
dire violet
im new to ds and i wanted to ask, in terms of calculating cosine similarity it d...
little vector
dire violet
im new to ds and i wanted to ask, in terms of calculating cosine similarity it d...
Yeah if you want to know the similarities between 2 person, you eventually have to add all the movies they both watched and rated.
This can add a lot to the dimensions.
slender kestrel
you here ?
 wooden sail
which one makes sense depends on the type of data
slender kestrel
wooden sail
which one makes sense depends on the type of data
can you give me a example coz i am not able to find anything about it on the internet
past meteor
slender kestrel
for finding the correlation between 2 time series data should i use the percenta...
2 entire time series or the correlation or lagged values in 1 series?
slender kestrel
past meteor
2 entire time series or the correlation or lagged values in 1 series?
2 entire time series
past meteor
You've mentioned DTW, that's what I would reach for but that's not a correlation.
wooden sail
what are the two time series? do you expect time warping to be necessary?
slender kestrel
i found a video giving the example that stock price and ufo citing both go up but they are not correlated but just by looking at it we can get confused that they are correlated so we find the pct change in values and then look at the correlation between them
past meteor
slender kestrel
i found a video giving the example that stock price and ufo citing both go up bu...
DTW wouldn't make sense here
slender kestrel
wooden sail
what are the two time series? do you expect time warping to be necessary?
basically i have 2 data one of ethylene gas and the other one of color change i causes in our film and my professor wants to know how effectively it does it so they wanna know the correlation between both data
past meteor
People at work were doing something with temporal correlation across time between time series so I can ask
wooden sail
you're not looking for similarity here, i agree dtw doesn't sound like a good approach
slender kestrel
wooden sail
you're not looking for similarity here, i agree dtw doesn't sound like a good ap...
ok
past meteor
For something like this I'd definitely just read a bunch of papers. Reason being that I can come up with some bootleg approaches on the spot but best to look at how people solve this problem correctly
slender kestrel
soo what should i exactly do coz the more i google it the more confusing it gets
past meteor
ACF and PACF but with t being series 1 and everything before t being series 2 is how I would intuitively try and solve this one
slender kestrel
past meteor
For something like this I'd definitely just read a bunch of papers. Reason being...
i found people doing TLCC for such problems but i wasnt sure so i wanted to confirm from someone who knows this
wooden sail
not the kind of similarity dtw looks for, at any rate. a vanilla xcorr sounds like a good place to start, but you'd need some reference values
past meteor
Yes I think they were using an advanced version of TLCC
Find a survey paper and read it
wooden sail
that sounds reasonable
slender kestrel
past meteor
Yes I think they were using an advanced version of TLCC
so i should try with that right ?
slender kestrel
past meteor
Find a survey paper and read it
yup most of the survey papers did this so imma try to do the same
past meteor
Like, find a good paper that covers TLCC, look through cited by and find a survey that covers it and other methods for your specific problem
Then you get to see alternatives and their tradeoffs
slender kestrel
past meteor
Like, find a good paper that covers TLCC, look through cited by and find a surve...
alright thanks ! also you too @wooden sail
🙏 you two are always of really great help
past meteor
Edd-As-A-Service (EaaS) to the rescue
slender kestrel
past meteor
Edd-As-A-Service (EaaS) to the rescue
lol
slender kestrel
past meteor
Edd-As-A-Service (EaaS) to the rescue
btw correct me if i am wrong but in time series TLCC is same as CC coz CC is pearson correlation with lags right
past meteor
I honestly haven't looked into TLCC deeply except hearing intermediate results of my colleagues
sleek harbor
First of all, I'm well aware that you should avoid all sorts of data leakage when building a model for production that will be making predictions on unseen new data. But..
What if we're building a model to just predict one set of missing (target) values? Basically like on kaggle? Target leakage is always bad, but what about train-test leakage? Since we only care about how accurate a score we'll get on the test data, does it make sense to not take the usual steps to avoid train-test leakage? I mean.. if you have missing values, wouldn't it make more sense to impute them using the entire dataset, rather than the train data, since we are only interested in predicting the target for that one test dataset and nothing else?
past meteor
sleek harbor
First of all, I'm well aware that you should avoid all sorts of data leakage whe...
Can I ask you a question just to be sure?
What is in your opinion the reason why do splitting and why we care so deeply about not leaking?
sleek harbor
past meteor
Can I ask you a question just to be sure?
What is in your opinion the reason wh...
Generalization? So it'd work well with unseen data¿
past meteor
That's half of it imo. Not your fault because it's the worst thought part of data science imo 🥴
sleek harbor
past meteor
That's half of it imo. Not your fault because it's the worst thought part of dat...
So what's the full story
past meteor
You need to keep data on the side to estimate how well your model is, that simple
And that ties in with generalization etc.
sleek harbor
past meteor
And that ties in with generalization etc.
Ok, yeah, that's the splitting part. But leaking? I mean yeah, I understand y we need train-val-test (tho it took me a while to get the val part)
past meteor
If you leak data your performance estimate will be optimistic
sleek harbor
past meteor
If you leak data your performance estimate will be optimistic
So what? I mean if I don't care if I got the right estimate, but only care that I actually got the best model (which I don't think will be hindered by the leakage)
past meteor
Imagine if you're building a model to trade stocks and you leaked data. Your performance is inflated and you go to market with a shitty model
Or you leak data while making your imputation model, your performance estimate is inflated, it was actually worse than a mean imputation, etc. I could make a thousand of these 🙂
sleek harbor
past meteor
Imagine if you're building a model to trade stocks and you leaked data. Your per...
But I'm specifically asking about not a production model. Model that is only used once to predict data that is already on hand
past meteor
Sure, how do you know the model is better than just saying every value is 1363783736?
sleek harbor
past meteor
Sure, how do you know the model is better than just saying every value is 136378...
Say u want to predict the price for which u can sell a given years crops. Some years do good, some bad. Among the features are: amount of items (for example 250 pickles) and the item itself (pickles, wheat, tomatoes). One year, the count of pickles is missing (some dumarse forgot to write that down). The years data (note, this doesn't necessarily have to be in linear time, so it's not a time series problem) is essentially your "unseen" data, you want to predict the profits. Now how to deal with the missing pickle count? I think it makes sense to predict it using the very unseen data that we shouldn't (otherwise how will we know if the year was good or bad?).. similarly you can look that way at all kaggle competitions and when you only want to build a model to predict once on one set of data that you already have
past meteor
Yes but there's a million and one ways you can impute that value
sleek harbor
past meteor
Sure, how do you know the model is better than just saying every value is 136378...
You don't, and you won't until u get the true value, but in all likelihood, it will, since it does on the train data
past meteor
There's obviously one that is better than the other one
sleek harbor
past meteor
There's obviously one that is better than the other one
But how will u input it at all not knowing how good the year was?
past meteor
I might just take the previous year and call it day
sleek harbor
past meteor
I might just take the previous year and call it day
U gotta agree that almost definitely, that would be a lot worse than using the given years data..
As I see it, in this case we'd want to do a bit of "leaking", to "overfit" (not really the right word) to the given data we're trying to predict. And then throw away the model and never use it again
past meteor
sleek harbor
U gotta agree that almost definitely, that would be a lot worse than using the g...
Yes but you have no way to know
I might also just treat different imputation methods as a hyperparameter
sleek harbor
past meteor
Yes but you have no way to know
Intuitively 🗿 say last year the table was overflowing, and this year.. it wasn't. One would have to assume that imputing 10k pickles (from last year) is optimistic..
sleek harbor
past meteor
I might also just treat different imputation methods as a hyperparameter
I'm pretty sure that's done. But back to my original question.. would train test leakage actually be a bad thing here? I don't see how
past meteor
We're going in circles, do what you want 
sleek harbor
I want to know if there are scenarios when train test leakage could actually be a good thing, or is it always a bad thing? The way I see it, u can get higher scores on kaggle of u do all ur preprocessing together (and I've seen quite a few notebooks, the "top" ones, intentionally doing just that). So that got me thinking.. is it really always a problem, if we are only going to predict on data that we already have? If we just want to make one round of predictions, as accurately as possible, like in my yearly crops profit example?
past meteor
I've had discussions on kaggle and top Kagglers acknowledge this and call it semi supervised learning. Personally I never do this on Kaggle, I always handicap myself by treating it like a real world problem
You're overthinking this massively, go back to the question I asked and look at that discussion.
sleek harbor
I'm actually thinking of making a recommendation system (no time in the near future, but some day), and one of the possible ways it'll work is: create a separate model for each user, and predict whether they'll like a given piece of existing media. Load it all in and get the result. So if I'll be making a separate model for each user, and only making one set of predictions.. wouldn't it make sense to standardize my features using all the data? Like.. what benefit do I get of standardizing on all my train data and then applying the transform on the features fo the data split that contain what I want to predict?
past meteor
To repeat, the core of statistical modelling is estimating the performance of models. If your performance estimates are biased due to leakage then you're doing it for nothing
Why? You're likely comparing against baselines that do not have any leakage (lazy predictors). If you leak to hard they'll always beat the baselines when in reality that's not certain
sleek harbor
past meteor
You're overthinking this massively, go back to the question I asked and look at ...
I always overthink it, cus if I don't I'll always be left wondering. And it doesn't just have to be kaggle, this could have real world applications.. the pickles!!
past meteor
Yeah well the pickles still have the issue that you're not quantifying how well your model is
It's the same thing (see how we're going in circles?)
There's ways that you can fit a model on a single dataset and estimate the performance at the same time if you believe in the "framework" enough / if the assumptions are met. Certain Bayesian approaches or AIC, BIC come to mind
sleek harbor
But what if I don't care how well my model is doing.. can't I just assume that using more "up to date"/actual information it should do better that with inaccurate information? I don't care how well it's doing as long as it is doing something (and in all likelihood, it's not doing worse than a guess, which would be little worse than using old data)
past meteor
Then why don't you pick 0
sleek harbor
past meteor
Then why don't you pick 0
Why would I?? I know there are more than 0 pickles.. the best way of estimating the actual number, imo, is leakage.. so.. that's what I think makes most sense, contrary to all guides and tutorials
past meteor
If you wouldn't pick 0 or any random number you care about the performance
Tbh you want to do what you want to do, so do it anyway idc 😑
sleek harbor
past meteor
If you wouldn't pick 0 or any random number you care about the performance
I care about the performance, obviously, otherwise I wouldn't be trying to get the best. But I don't care about quantifying it
sleek harbor
past meteor
Tbh you want to do what you want to do, so do it anyway idc 😑
I want to know what not to do
past meteor
I've explained it enough and I tried to keep it as simple as possible. I've got nothing to add, you're just ignoring me
sleek harbor
past meteor
I've explained it enough and I tried to keep it as simple as possible. I've got ...
Thanks anyway, I appreciate the effort. Maybe in a month or two I'll get it
slender kestrel
past meteor
I honestly haven't looked into TLCC deeply except hearing intermediate results o...
alright :) !
slender kestrel
past meteor
I honestly haven't looked into TLCC deeply except hearing intermediate results o...
heey just an update the normal pearson correlation worked for my problem coz both data were supposed to be highly correlated in theory and i got the value -0.945 as the coefficient value so thanks a lot for all your time please keep up the good work
just for suretiy i will also try CC
and also i managed to undestand when we use the percentage change values of 2 time seires data for correlation and when we use the direct values
Using Percentage Change (Relative Change):
When you have two time series datasets and you want to find the correlation between them using percentage change, you are essentially looking at how much each variable changes relative to its own previous value. This approach is often used when you are interested in studying the proportional changes over time rather than the absolute values. It can be particularly useful when dealing with data that has different scales or magnitudes
this is what i found hope its not wrong ;-;
When you use the direct values of time series data to find the correlation, you are interested in understanding the linear relationship between the actual values of the two series at each time point. This approach is more suitable when you want to study the direct effect of one time series on the other or when you are looking for predictive relationships.
 cinder urchin
How can you make the AI's NN or Brain to automatically expand and create new layers so it can adapt and to be better at getting stuff right.
For the Tourch library.
Is there a config or another library?
Because if there is that would help a lot.
wooden sail
slender kestrel
heey just an update the normal pearson correlation worked for my problem coz bot...
note that the person correlation coefficient is almost the same thing as the TLCC with a lag of zero. the differences are the centering (subtracting the mean) and what you divide by to get the data normalized. you should expect to see good results with TLCC then, with the added benefit that if there is some lag separating the peaks on the compared signals, the TLCC will find it
slender kestrel
wooden sail
note that the person correlation coefficient is almost the same thing as the TLC...
heey thank you again for the advise i looked TLCC up and it said that i need the series to be stationary so i used ADF to check if it was stationary it wasnt ;-; so i used differencing using pandas .diff() function and then used ADF again it was stationary now so now i can use TLCC i assume please correct me if my approach is wrong anywhere
wooden sail
that does make the result a little more difficult to interpret though
you can use the general cross correlation function expression, which is a function of two lag values instead of only 1
slender kestrel
wooden sail
you can use the general cross correlation function expression, which is a functi...
what do you mean by 2 lag values ?
edd ;-; you there ?
slender kestrel
wooden sail
you can use the general cross correlation function expression, which is a functi...
wait do you mean that amount of lag you (k vaule in mathematical formula) can go up to 2 ?
wooden sail

in general the xcorr function depends on both the time t1 and the time t2. if jointly wide sense stationary, then only the quantity t1 - t2 matters, which is what is usually called "lag"
but generally the function depends on two time values, t1 and t2
lapis sequoia
sleek harbor
I want to know if there are scenarios when train test leakage could actually be ...
In most of the Kaggle competitions(even real world projects),one of the most important step imo is to have a "leak free" validation set to compare the results. Competitions & projects are months long, each requires hundreds of experiments to come up with good solutions. What most of us kagglers do is until the last stage of competition, we keep our pipeline leakfree. To get some additional score boost, we try to apply certain tricks like: full data training (ex. we know models are always conveging at Nth epoch, instead of using just train data, we use (train+val) data and run for N_epoch * len(train) // len(train+val)). , also the preprocessing you are talking about, apply PCA/ normalization/ other FE techniques by using both train & test set, or do Knowledge distillation using OOF predictions, do pseudo labelling with test data predictions,etc.
So, it's fine to apply all these leaky techniques, but you need to be really careful & isn't a good practise to deal with any problem.
sleek harbor
lapis sequoia
In most of the Kaggle competitions(even real world projects),one of the most imp...
thanks for the info. I've come to the temporary conclusion that it's fine to perform preprocessing on the entire dataset before splitting into train/val/test (basically allowing "leakage"), if you have the entire population data, not just sample data (and will be predicting for the population), or if you treat your sample data as if it were the entire population (and only predict for the sample data, not the population). If you only have sample data, and want to predict population data, then no leakage should be allowed. Kaggle always falls under the first two (depending on whether you consider the data given to you as sample data and treat it as population data, or whether you are actually given population data), so it's pretty much always ok to allow train-test contamination (knowledge leakage, there's a billion names for roughly the same thing..), if your goal is to get the highest score possible just this once, not build a model that will actually be reusable in the future
 hoary jay
hey guys anyone familiar with autocorrelation analysis? i used np.corelate() on a range of values of data with itself to check for periodicity and i got the following plot, what insights do u think ican make from this..?
 past meteor
sleek harbor
thanks for the info. I've come to the temporary conclusion that it's fine to per...
past meteor
sleek harbor
thanks for the info. I've come to the temporary conclusion that it's fine to per...
I think you still misunderstood @lapis sequoia
Also if you have the entire population you would not need to do any modelling
Modelling is making statements about the population based on a sample
I had a meeting recently with key stakeholders of my project at work. We discussed methods for dealing with some issue we had in our data. The conclusion was that we could do some tricks that could potentially leak data but work around them. Doing this properly is an advanced thing and in most cases it's really not worth the effort. In Kaggle it probably is because sub 1 % improvements matter. This is a high risk very low reward thing
Finally, since you in reality, never have the population (even not on Kaggle...) but just a sample you cannot simply use the entire sample because you can't know whether the approach is giving you the highest score possible because you need to do that on an out-of-sample basis
I think for many data scientists this is a top 3 red flag and interview question. The reason why I'm being harsh about it is that if you don't understand the trade-offs here the interview is over imho.
sleek harbor
past meteor
Also if you have the entire population you would not need to do any modelling
By "entire population" there I mean all features (without the target). If u count all the veggies on the farm, u still need to figure out the profit, and u gotta do something about those missing pickles. (P.s. I know ppl don't set prices using ml, and I know pickles don't grow and r made from cucumbers 👀). The data collected on the farm would be the population, but we still need to figure out the overall profit -> make a model
sleek harbor
past meteor
I had a meeting recently with key stakeholders of my project at work. We discuss...
I can imagine, but u likely aren't making a one time train->predict->throw away model, but something reproducible that can be put into production, not just getting the one time profit for the year and leaving it at that
past meteor
How are you ever going to compare whether or not your method is better than any other method
It's not about just using something once at all
When I say quantity it's not like I'm interested in getting a real number, I'm interested in knowing method A > method B
sleek harbor
past meteor
Finally, since you in reality, never have the population (even not on Kaggle...)...
Why don't u ever get the entire population? I don't really get this part. The way I see it is that if u just have a sample, and ur predicting within that sample, the parameters of that sample is all that matters, not the population it came from
past meteor
You can't know this without having a set you do not use
sleek harbor
past meteor
I think for many data scientists this is a top 3 red flag and interview question...
O interviews they likely want smth reproducible, so ofc on an interview I wouldn't even mention smth like this. But I want to understand
past meteor
Like, to me this isn't about pickles anymore but about why you do ML, stats, data science at all
sleek harbor
past meteor
How are you ever going to compare whether or not your method is better than any ...
The usual way.. just with the normal train/val/test splits. Do ur cv tuning, choose the best u got, and then check how it did on the test, same as usual. Could use nested folds to make it even better
sleek harbor
past meteor
When I say quantity it's not like I'm interested in getting a real number, I'm i...
Wouldn't u get that with normal train/val/test??
past meteor
Yes, you're also in the process of answering your own question
If you're building an imputation model there's a million ways to impute but you need to know which one produces the best score
And yes, you do care about that otherwise why not have every imputation be 42 or 69
sleek harbor
past meteor
If you're building an imputation model there's a million ways to impute but you ...
So.. what's wrong with just using the test for checking the final models score?
past meteor
What do you mean with that?
sleek harbor
past meteor
What do you mean with that?
Train on the train data, evaluate on the test data. Idk how else to say what I mean
past meteor
Weren't you going to skip your test set completely?
sleek harbor
past meteor
Weren't you going to skip your test set completely?
No, not at all. I was just gonna do the preprocessing before the splits, thus causing train-test leakage..
And not just before the splits, but using both the data from the data with the target variable, and "unseen" data without it
past meteor
Yeah the reason why you wouldn't do that is that you don't want to inflate your scores artificially. Reason is that not all methods will leak so the methods you use that don't leak will be at an artificial disadvantage
If all methods leak and your leakage causes you to inflate your estimates in an order preserving way then I guess it's fine. But look at the number of assumptions I had to make before I could say it's fine. None of these are testable
sleek harbor
past meteor
If all methods leak and your leakage causes you to inflate your estimates in an ...
What exactly is meant by different methods? Like could I get some examples? And I honestly don't see why that matters. I mean, we have our laid aside test data.. we do our training and tuning on train/val data, whichever has the highest score on the test wins (cus the test is essentially exactly the same as the "unseen", except that it has the target). So.. potentially, there is a chance that I could overfit to the test data, but then I could just use multiple test splits, CV for the test splits, nested outer CV (call it what u will) and that would fix it (as much as CV fixes what it using does).. so the way I see it, doesn't matter, tis perfectly safe
past meteor
One of your benchmarks should always be a dummy regressor or dummy classifier in sklearn. For time series this is for example the Naive predictor. These do not leak.
On some problems these "stupid" approaches can be ridiculously good.
If you then compare it to a method that is leaking A) the distance between them will be larger or B) it might "beat" the other method unfairly just because it's leaking while it's actually worse in practice
sleek harbor
past meteor
If you then compare it to a method that is leaking A) the distance between them ...
how can it be worse in practice if it beat it 😭
past meteor
Because it's only good because it's using information it's not supposed to have....
I think you have to rethink modelling from an exercise to create the best model to an exercise to create unbiased performance estimates because it's actually the latter
And to do that you need to do Kaggle competitions, I suggest tabular playground.
sleek harbor
past meteor
Because it's only good because it's using information it's not supposed to have....
Why do I care, and who decided it's not supposed to have it? I can understand that target leakage is always a taboo, and that train-test leakage is bad if u want a model that generelizes well and can be reused, but if I just want this one time specific prediction..
past meteor
It's not enough to be able to say target leakage is taboo when you don't understand why
sleek harbor
past meteor
And to do that you need to do Kaggle competitions, I suggest tabular playground.
Is tabular playground a competition on kaggle, or another site?
past meteor
Yes
And we're full circle, even if you want to make a prediction this one time
Why not just predict 42 or 69?
Or 0
sleek harbor
past meteor
It's not enough to be able to say target leakage is taboo when you don't underst...
I do understand why target leakage is taboo, I don't understand why train-test leakage in certain circumstances are taboo
past meteor
Because you want a good prediction.
sleek harbor
past meteor
Because you want a **good** prediction.
Exactly, I don't just want a good prediction, I want the best! And my thought process tells me that I'll get the best prediction if I have the most accurate data, which I can only get by using train-test leakage..
past meteor
past meteor
I think you have to rethink modelling from an exercise to create the best model ...
This really has to sink in for you
If you leak you can't be certain if your best model is actually the best
sleek harbor
but why not 😭
past meteor
Because other methods do not have access to that information. Is it better because it has that info or is it intrinsically better
Even if all methods have access to that extra info, maybe 1 benefits from it disproportionately
sleek harbor
past meteor
Even if all methods have access to that extra info, maybe 1 benefits from it dis...
Isn't that a good thing, meaning that this model is the best one..¿ If it predicts the test data better, then that's all one could hope for.. I seriously don't get it
past meteor
Why don't I just take the test labels and call that my model?
sleek harbor
past meteor
Why don't I just take the test labels and call that my model?
?? How would that even work?
past meteor
Yeah so I just make a function that looks up y true and predicts that
I'm just taking this idea to its logical conclusion
sleek harbor
past meteor
Yeah so I just make a function that looks up y true and predicts that
That's target leakage..
past meteor
That's the most extreme case. You see how that model would be the best right?
sleek harbor
Obv, target leakage always gives inaccurate scores
past meteor
What I'm saying is that there's a spectrum and what you're saying is somewhere on that spectrum but not on the very very end of it compared to what I proposed
Using your test set more than once is also somewhere on that spectrum
sleek harbor
But it's a completely different concept.. target and train-test leakage aren't even on the same plain :/
past meteor
I can't explain this any better than I have, maybe someone else can have a go now
sleek harbor
past meteor
Using your test set more than once is also somewhere on that spectrum
I can see that, but that's where nested loops come on and the such, not talking about that rn
past meteor
I will check if any of my coursework explained this properly when I'm back, if so I'll send it your way.
lapis sequoia
sleek harbor
Is tabular playground a competition on kaggle, or another site?
Yes they used to be hosted every month on Kaggle, not anymore. but you can still do late submissions like titanic one.
lapis sequoia
sleek harbor
But it's a completely different concept.. target and train-test leakage aren't e...
https://www.kaggle.com/competitions/lish-moa/discussion/196913 I think this discussion thread should answer most of your questions.

Can you improve the algorithm that classifies drugs based on their biological activity?
I asked a similar question as you three years ago :))
 past meteor
lapis sequoia
I asked a similar question as you three years ago :))
past meteor
lapis sequoia
I asked a similar question as you three years ago :))
Exactly why people call Kaggle "semi supervised learning" I asked a similar question years ago as well haha
left tartan
sleek harbor
Exactly, I don't just want a good prediction, I want the best! And my thought pr...
I think the logical fallacy here is that there is a ‘best’ prediction, since what you’re trying to measure is how well the model will perform with future unknown data… not how well it performs with the data you have. The only measure that matters is how well this model predicts the not-yet-measured. The test data serves as a proxy for ‘future’ data: so while you could use it, you’d no longer be able to consider whether the model is predictive of new data.
past meteor
I don't like doing this because to me that's too Kaggle specific and I compete to have fun and not to win but the last option is indeed the best in th context of winning a competition.
sleek harbor
lapis sequoia
https://www.kaggle.com/competitions/lish-moa/discussion/196913 I think this disc...
I looked through it, but this really has nothing at all to do with my question. Using repeated folds is mentioned, and one comment mentioned nested CV, but that's about it and not the point of my question. Thanks anyway
sleek harbor
lapis sequoia
I asked a similar question as you three years ago :))
That last sentence 👀
sleek harbor
left tartan
I think the logical fallacy here is that there is a ‘best’ prediction, since wha...
But I don't want it to perform well on future unknown data.. I'll only be using it just once, that's it, never again
past meteor
The paper linked in the thing Nis sent is actually the best thing you can read
From the paper: Maybe we should address the previous question from a different angle: "Why do we
care about performance estimates at all?"
I'm trying to "challenge" you to answer this question, exhaustively, you've got most of the points so far but are struggling on the last one
left tartan
sleek harbor
But I *don't* want it to perform well on future unknown data.. I'll only be usin...
Then why build a model? Just store the x and y mappings and be done.
past meteor
The paper lists 3 reasons for performance estimates and your case is exactly the last one.
sleek harbor
left tartan
Then why build a model? Just store the x and y mappings and be done.
Because we don't have the y for a set of existing data. But it's not new, just doesn't have the y
lapis sequoia
past meteor
Exactly why people call Kaggle "semi supervised learning" I asked a similar ques...
haha 🤝
sleek harbor
past meteor
The paper linked in the thing Nis sent is actually the best thing you can read
The 49 page pdf, or a different link?
past meteor
Yes, just read point 1.1, you don't need to read the full paper
They list 3 reasons, you understand 2/3 imo
Tbh if your concern was that you're just going to construct the features on your entire dataset then it's close to the screenshot's suggestion. PCA on all the data can work in Kaggle, same as standard scaling etc.
But that's different from imputing a column or so
sleek harbor
Read it and didn't get it.. I'm not interested in the "absolute performance of a model", I'm only interested in the relative rank performance of different models, so the way I see it - shouldn't matter.
Elsewhere I got this reply: "If you never expect to perform inference on new data with respect to preprocessing, yes, you're correct.
So if you're removing the mean, and you can guarantee the mean from your training and test will never alter from the population mean AND the combined training test mean is a better representation than just the training mean, then you can use it without issue"
Idk, I'm not getting anywhere here.. also I don't see how doing pca/standardization differs in terms of train-test leakage from imputing. Maybe I need a break and come back with a fresh mind. Everyone says that helps.. never helped me much before, but maybe this time
sleek harbor
past meteor
But that's different from imputing a column or so
Thanks a bunch for the effort, but I'm just not getting it. Maybe tomorrow, or I'll just stop trying to understand and just do as everyone
past meteor
It depends on how you're imputing. If it's a mean imputation then using your test set will usually improve the performance on test. Again, this is a Kaggle specific way of doing things and it's a bad habit almost anywhere else. Unless you want to become a Kaggler I would stay clear of it for now
lapis sequoia
sleek harbor
Read it and didn't get it.. I'm not interested in the "absolute performance of a...
imputing is the same as pca or any other preprocessing for that matter. If test sample is provided, you are good to go. But in cases where you want to use that model on further unseen data, probably not the ideal thing to do as we do not have access to test labels. we can't always tune the strategies based on test data score.
sleek harbor
lapis sequoia
imputing is the same as pca or any other preprocessing for that matter. If test ...
I'm specifically not interested in ever using the model again for any future predictions
lapis sequoia
even on Kaggle, almost all competitions have hidden test set now :))*
past meteor
Literal billions have been lost because of overly optimistic ML models. People's focus is producing models that perform better at any cost while the focus should nearly always be high fidelity estimates 🤷♂️
sleek harbor
lapis sequoia
even on Kaggle, almost all competitions have hidden test set now :))*
Yeah, ik about the public/private thingie
past meteor
Zillow lost most of their market cap because of bad models afaik, meanwhile everything looked good in training
lapis sequoia
sleek harbor
Yeah, ik about the public/private thingie
Yes, even for public leaderboard, test samples are hidden now.
lapis sequoia
sleek harbor
I'm specifically not interested in ever using the model again for any future pre...
you can use it then, if it helps you achieve good results on that specific test data.
sleek harbor
lapis sequoia
Yes, even for public leaderboard, test samples are hidden now.
:0 didn't know that, my question wouldn't be applicable there. But the question remains, despite the existence or none existence of kaggle..
How u make submissions btw? Upload the model itself?
lapis sequoia
sleek harbor
:0 didn't know that, my question wouldn't be applicable there. But the question ...
competitions are now either csv based or inference based. For the later one, you can train models locally, load them on kaggle notebooks and perform inference. You can't access any test samples (mostly just 1 sample is given). Once you submit the notebook, it will be rerun on test data & submission will be scored.
So this strategy fails, as you just have limited time to perform the inference. Training within that submission time limit is hard.
left tartan
past meteor
Zillow lost most of their market cap because of bad models afaik, meanwhile ever...
Although perhaps a black swan situation, it’s tough to equate that to a normal ‘bad model’ situation but bad meta-model
cerulean kayak
rq: does anyone know what method is used to evaluate Kmeans clustering?
 molten hamlet
with tf.compat.v1.Session():
    model = Sequential()
    model.add(Dense(50, input_shape=(20,)))
    # model.add(LSTM(50))
    model.add(Dense(60))
    model.add(Dense(60))
    model.add(Dense(60))
    model.add(Dense(60))
    model.add(Dense(1))
    model.compile(optimizer='adam', loss='mean_squared_error', metrics=['accuracy'])

    model.fit(X, Y, verbose=True, epochs=3)
Can I enforce tensorflow to use GPU other way than doing context?
windows, so max version is tf==2.9
and gpu is detected, but its using cpu by default 😐
 past meteor
left tartan
Although perhaps a black swan situation, it’s tough to equate that to a normal ‘...
past meteor
left tartan
Although perhaps a black swan situation, it’s tough to equate that to a normal ‘...
Yeah for sure, these things are only correlated at best but there was this whole period when their model was buying houses far above actual market value while everything looked fine from their pov
slender kestrel
wooden sail
in general the xcorr function depends on both the time t1 and the time t2. if jo...
ooh wait i remember studying this i thought lag was supposed to be

this k is supposed to represent the lag
like how much i am shiting one singal
i.e how much one singal is lagging wrt to the other
hello zestar !
past meteor
To me it's also just crazy people go to prod without baking in a method to monitor performance. Could be as simple as validating a random sample every so often
slender kestrel
this was the scatter plot i think pearson correlation defines it the best edd

zestar if you dont mind you hava a look too please
wooden sail
what am i looking at
slender kestrel
wooden sail
what am i looking at
the scatter plot of the data i am smashing my head on ;-;
mild dirge
Ah, "data" 😛
slender kestrel
slender kestrel
also this am i wrong in here ?
slender kestrel
mild dirge
Ah, "data" 😛
lol
mild dirge
What are the x-axis and y-axis?
slender kestrel
wooden sail
what am i looking at
x axis the color value from rgb sensor
and y value is the conc of ethlyene
so as conc of ethylene goes up the
film changes its color and
thats the follwing plot of it
mild dirge
Yeah, seems like there is a pretty clear linear relation
wooden sail
slender kestrel
this is correct for deterministic discrete functions
there's a lot of discussion underlying the problem. stuff regarding whether the data is random, or if it has deterministic + random components, or is deterministic
there are subtleties that are different in all cases
slender kestrel
wooden sail
there are subtleties that are different in all cases
man this is just painful ;-; so much math
slender kestrel
mild dirge
Yeah, seems like there is a pretty clear linear relation
well so i dont think i need to find the cross correlation in here tho i tried using the xcorr function of matplotlib
wooden sail
if you have a deterministic + stochastic signal, it will very likely not be stationary if we treat the deterministic portion as the mean of the random process. if we instead think of it as a 0-mean process + a deterministic part, and endow the 0-mean process with nice properties (via simplifying assumptions), then things become simpler
wooden sail
slender kestrel
man this is just painful ;-; so much math
this IS math
slender kestrel
slender kestrel
well so i dont think i need to find the cross correlation in here tho i tried us...
this was the output
 slender kestrel
wooden sail
if you have a deterministic + stochastic signal, it will very likely not be stat...
slender kestrel
wooden sail
if you have a deterministic + stochastic signal, it will very likely not be stat...
and i thought it would be as simple as using a function ;-;
let me try all the stuff you said wait
 boreal thistle
Guys if anybody want to use free gpt-4 , i found this app on playstore -
https://play.google.com/store/apps/details?id=com.projecthit.aichat

AI Chat Assistant powered by GPT-4 & GPT-3.5 - Unlimited Chat & Possibility
slender kestrel
slender kestrel
this was the output
wait isnt x corr with 0 lag supposed to be equal to corr ?
but the output i am getting from both are different why is that
the output from xcorr seems to be wrong since the scatter plot show a down ward trend so the cross correlation is supposed to come out negative
deft sinew
Import "word2number" could not be resolvedPylancereportMissingImports
I am getting this error from VSCode but I installed word2number through the command prompt and it said it successfully installed word2number so I am not sure why it's throwing this error
timid grove
hello everyone,
i am collecting dataset for text to code generating chatbot for Data Science field only.(Means a text to code generation bot for deep learning , machine learning NLP etc only.)
please share some tips for collecting such kind of data for finetuning pretrained 🤗 chatbots.
Thank You!
small wedge
timid grove
hello everyone,
i am collecting dataset for text to code generating chatbot for...
scraping github (or using their api yk) and using doc comments as inputs where function/class/variable definitions are the labels sounds like the easiest way
timid grove
small wedge
scraping github (or using their api yk) and using doc comments as inputs where f...
Thank You for the timely reply.
Could you please refer me any youtube video or document that tell us a bit about GitHub scraping?
Like once i have the github repo links then how to extract code from those repo links?
lapis sequoia
hey y'all have any good sources to start machine learning
small wedge
timid grove
Thank You for the timely reply.
Could you please refer me any youtube video or d...
hm there are probably a lot of ways but I'd look into the search functionality https://github.com/search/advanced or the api https://docs.github.com/en/rest/repos/contents?apiVersion=2022-11-28#get-repository-content
I haven't implemented either before so I couldn't go into specifics
small wedge
lapis sequoia
hey y'all have any good sources to start machine learning
I always recommend the 3b1b playlist on neural networks for complete beginners https://www.youtube.com/watch?v=aircAruvnKk&list=PLZHQObOWTQDNU6R1_67000Dx_ZCJB-3pi and I've seen that google has a free crash course https://developers.google.com/machine-learning/crash-course/. A lot of people recommend Andrew Ng's courses if you're interested in learning through a course as well.
lapis sequoia
small wedge
I always recommend the 3b1b playlist on neural networks for complete beginners <...
intresting ... thanks a lot
 weak tusk
lapis sequoia
intresting ... thanks a lot
weak tusk
lapis sequoia
intresting ... thanks a lot
if you wanna learn how it works check out sentdex video on making a neural network. (ofc that does assume you know some math and are well versed in python.) it sadly is missing the last video or two but it gives a great idea of how it works. I have never seen that playlist though so it may be better.
 rose walrus
hellow there ( sorry for my language im French) i need help for data grabing from a website , i use request and beautifullsoup , but the output doesnt fit with willing output data
 lilac cove
is anyone good with machine learning related problems? i need help with this error i cant seem to understand the error im really lost
 small wedge
lilac cove
is anyone good with machine learning related problems? i need help with this err...
small wedge
lilac cove
is anyone good with machine learning related problems? i need help with this err...
Looks like there is some text in your train/test data
The values need to be numeric
lilac cove
small wedge
Looks like there is some text in your train/test data
how do i fix it?
lilac cove
small wedge
The values need to be numeric
idk how to🥲
small wedge
Well to help I gotta know what you're doing. Is this classification?
lilac cove
small wedge
Well to help I gotta know what you're doing. Is this classification?
yesss
im doing logistic regression
lilac cove
small wedge
Can you show me what your data looks like?

X = df.drop("h1n1_vaccine", axis=1)
y = df["h1n1_vaccine"]
X_train, X_test, y_train, y_test = train_test_split(X, y, test_size=0.2, random_state=42)
small wedge
Hm okay so you're passing all these non-numeric fields as part of X?
status: 'Married' things like these need to be converted to numeric representations
So if the options were married or unmarried you could use 0 and 1
Or you could just pass the numeric fields
lilac cove
small wedge
Or you could just pass the numeric fields
yesss someone helped me fix where i was going wrong thank you for the help! ❤️
dire violet
why is it that when i use the fit method, my kernel crashes?
from scipy.sparse import coo_matrix

interactions = coo_matrix((df["Score"], (df["UserId"], df["ProductId"])))
model = LightFM(loss="warp")
model.fit(interactions, epochs=10)
 limber kiln
Can someone please help with this - https://stackoverflow.com/questions/76615910/why-is-my-gaussian-elimination-algorithm-failing
I posted this on #algos-and-data-structs , but i suppose this is better
Stack Overflow
In gaussian elimination, we take our matrix A and another matrix I.
We proceed to convert the matrix A into an identity matrix. Once that's done, we apply the same steps that we did on A on the ide...
 pale hemlock
@cobalt imp yes yes i know the world is here but thank you
@cobalt imp Check this out, aside from her being cute and my new crush this is actually quite interesting

👉 Invest in Blue-chip Art by signing up for Masterworks: https://www.masterworks.art/anastasi
Purchase shares in great masterpieces from Pablo Picasso, Banksy, Andy Warhol, and more.
See important Masterworks disclosures: https://www.masterworks.com/about/disclaimer?utm_source=anastasi&utm_medium=youtube&utm_campaign=6-27-23&utm_term=Anastasi+in...
lapis sequoia
can anyone here help me with langchain + vector db, stuff??
 sharp wyvern
I need a python for data science course (free if possible) 🙏
thin geyser
I'm having trouble using this codebase. Please help. I am trying to perform unpaired image to image translation from zebras to horses. https://github.com/ChenWu98/cycle-diffusion/issues/9 I am trying to follow the steps in this thread but I am not able to get an output
GitHub
Thanks for sharing the great work! How to train the unpaired image-to-image translation on one GPU? export CUDA_VISIBLE_DEVICES=1 export RUN_NAME=translate_afhqcat256_to_afhqdog256_ddim_eta01 expor...
lapis sequoia
Thoughts on reinforcement learning? Is it worth studying? Because I heard there are better methods nowadays like SSL
 wet cedar
I wonder if anyone here is experienced with OpenCV? Looking for anyone who has some experience with math + cv for a few tasks like measuring distance and angle from webcam and such
Additionally, things like perspective transforms.
If anyone has good experience with math/cv in python could you perhaps DM me?
In addition, I wanted to leverage EAST detection to segment an image into 20 rectangles where each is identified as text or image but it didn't work too well.
I made a post in WoC to look for a potential developer as I needed something commisioned along these lines but didn't find anyone (:
slender kestrel
sharp wyvern
I need a python for data science course (free if possible) 🙏
you can learn the basic python from coding with mosh
slender kestrel
lapis sequoia
Thoughts on reinforcement learning? Is it worth studying? Because I heard there ...
well deep q learning is quite used and reinforcement learning can be helpful not like its useless so you can look it up
slender kestrel
lapis sequoia
hey y'all have any good sources to start machine learning
you can always ask doraemon ;-; for this
jk you can learn the basics from
andrew ng deep learning specialization
if you are done with that you can look for machine learning algorithms
on youtube josh stammer explains them very nicely
then krish naik is also there
lapis sequoia
slender kestrel
well deep q learning is quite used and reinforcement learning can be helpful no...
Hmm deepq learning huh. Yeah currently I'm thinking of studying q learning (and deepq should just be neural networks which I already studied) and look into REINFORCE and A2C because they seem to be used on gymnasium at least
As I understand it, the downside of RL is the need for a lot of data
I guess also there is a lot of possible human error in setting up hyperparameters and policy
slender kestrel
lapis sequoia
I guess also there is a lot of possible human error in setting up hyperparameter...
you can always use different cross validation techniques to do it
slender kestrel
lapis sequoia
Hmm deepq learning huh. Yeah currently I'm thinking of studying q learning (and ...
yess there is no harm in learning it if you are able to understand the math behind it
lapis sequoia
The more I learn about data science the more I realize how much more I have yet to knoe
slender kestrel
when i tried learning reinforcement learning back then it was really hard for me to keep up with the math took me a lot of time to get a hang of it
slender kestrel
lapis sequoia
The more I learn about data science the more I realize how much more I have yet ...
its just too vast ;-;
lapis sequoia
Never heard of self supervised learning before... I think it is what was used to make gpt
OpenAI is a big fan of that
While DeepMind likes RL more
slender kestrel
lapis sequoia
While DeepMind likes RL more
yess deep mind was working on RL since 2016
slender kestrel
lapis sequoia
Never heard of self supervised learning before... I think it is what was used to...
self supervised learning were also used in developing self driving cars its state of the art
 restive narwhal
Would self supervised be the model creating its own labels during training process
lapis sequoia
slender kestrel
self supervised learning were also used in developing self driving cars its stat...
Yeah the question was should I spend time studying RL or jump straight into SSL
But I guess RL cant harm, at worst it's good practice
slender kestrel
restive narwhal
Would self supervised be the model creating its own labels during training proce...
nope its more like you are supervising your model what response is better than the other and model understanding what is a good and a bad output
for example i asked my bot a question
and it gave me 3 possible outputs
then i will rate those outputs and model will learn from it
slender kestrel
lapis sequoia
But I guess RL cant harm, at worst it's good practice
true the only part i hated about it was the math ;-;
sleek harbor
lapis sequoia
The more I learn about data science the more I realize how much more I have yet ...
Hahaha, same. I thought it'd be simple.. a year later and I feel I won't know even half of what I want to in 10 years. And every answer brings up another 10 questions, so.. :3
 finite condor
`print(titanic['age'].shape)
titanic['age'] = titanic['age'].values.reshape(-1,1)
titanic['age'] = titanic['age'].to_frame()
print(titanic['age'].shape)`
Guys I want to make the 1 appear on the shape of every column in my DataFrame object titanic
the shape currently of all columns is (891,) which is causing some problems for the missing 1
left tartan
finite condor
the shape currently of all columns is (891,) which is causing some problems for ...
What’s the shape of titanic, tho?
finite condor
left tartan
What’s the shape of titanic, tho?
(891, 15)
left tartan
Ok, so i don’t understand your question then. A single column is 1 dimensional, so (891,) makes sense. Do you want a single column as a (891,1) shape? That’s just creating a new df from the single column.
finite condor
the origin of the problem is that I wanted to apply an imputer to every column:
for column in titanic.columns: titanic[column] = imputer.fit_transform(titanic[column])
However I'm getting this error that tells me to reshape the columns:
Reshape your data either using array.reshape(-1, 1) if your data has a single feature or array.reshape(1, -1) if it contains a single sample.
left tartan
Try titanic[[column]]
finite condor
Thank you a lot dude
I have another question though...
why is the order of transformers applied while creating pipeline so important?
I mean:
this line of code tends to create a pipeline based on the categorical features in my dataframe:
categorical_pipeline = make_pipeline(SimpleImputer(strategy='most_frequent'),OneHotEncoder())
the order of transformers is wrong because you have to encode labels first then impute them,hence:
categorical_pipeline = make_pipeline(OneHotEncoder(),SimpleImputer(strategy='most_frequent'))
it is supposed to know that encoder get applied first then imputators..
Sorry but this change of order of parameters issue has taken an hour of life xD
because encoding tends to replace categorical features with numerical ones, why doesn't the imputer work directly on categorical features? why the need to encode first then impute?
left tartan
Not sure I follow. Are you asking why we encode categorical variables?
finite condor
No, encoding categorical variables is to be able apply statistics on them, but why don't SimpleImputer() work directly on categorical variables
I need to encode the variable first then impute
Cannot use most_frequent strategy with non-numeric data: could not convert string to float: 'male'
this error comes when trying to impute with most_frequent strategy on a categorical variable sex
left tartan
Can you share the code? I don’t use SimpleImputer but a brief google suggests it should work with categoricals
lapis sequoia
;))
 hasty mountain
lapis sequoia
Yeah the question was should I spend time studying RL or jump straight into SSL
hasty mountain
lapis sequoia
Yeah the question was should I spend time studying RL or jump straight into SSL
I think Reinforcement Learning could be visualized as more or less a semi-supervised learning...
But, to be honest, you could study SSL in a short time, and then go to RL, which may take quite a while
For instance, I've been trying to study RL for some time now and I think I still don't quite get it (since I still didn't manage to make an AI work with RL...having problems around local optima)
lapis sequoia
hasty mountain
I think Reinforcement Learning could be visualized as more or less a semi-superv...
by SSL I'm referring to self-supervised not semisupevised, which is a completely different beast I think
 sick ember
lapis sequoia
;))
sick ember
lapis sequoia
;))
Dang
sick ember
lapis sequoia
;))
nis do you work with language model?
lapis sequoia
I have a model that predicts with 90% accuracy on validation. I need to get to at least 92% so i need to hyperparameter tune to find the right set of parameters. The problem is the model takes 280 epochs to get there so i can only test something once a day. Is there hyperparameters other then learning rate (already high) and batch size (i cant change it for different reasons) that can help my model converge faster ie: in less epochs?
small wedge
lapis sequoia
I have a model that predicts with 90% accuracy on validation. I need to get to a...
Which optimizer are you using? A momentum term could help but you have to be careful of overshooting global minima
lapis sequoia
small wedge
Which optimizer are you using? A momentum term could help but you have to be car...
optimizer = torch.optim.SGD(model.parameters(), lr=0.01, momentum=0.937)
small wedge
Hm it's already pretty high, what about lr/momentum decay scheduling, any of that going on?
lapis sequoia
small wedge
Hm it's already pretty high, what about lr/momentum decay scheduling, any of tha...
i tried at some point but got bad results so i removed it but too many things changed in the model and in the training loop since then so i can maybe try again
small wedge
Decay scheduling would allow you to start the lr higher without worrying about not converging
I mean obviously lowering the number of trainable parameters will help speed up convergence assuming the model has enough for a proper function estimation
lapis sequoia
small wedge
Decay scheduling would allow you to start the lr higher without worrying about n...
do you have some ressources or a code snippet please?
also would it be better to try an adaptive optimizer?
small wedge
You could maybe try something like greedy layerwise training, where you train the model as only its first layer, then you lock the weights/biases for that and add a new layer, repeat until the end. That helps to deal with the inner layers updating very slow from small partials if you have a very deep nn
small wedge
lapis sequoia
also would it be better to try an adaptive optimizer?
If memory usage isn't a massive issue then yeah
sick ember
Tonabrix1 can you help me out
lapis sequoia
small wedge
https://pytorch.org/docs/stable/generated/torch.optim.lr_scheduler.StepLR.html
thank you very much
sick ember
my model is good but its generating very wrong auc graphs
small wedge
sick ember
my model is good but its generating very wrong auc graphs
Idk much about the methods used to qualify preformace of models like AUC
sick ember
my model has 92% test accuracy but I'm getting something like this

it almost like it got flip
sick ember
small wedge
Idk much about the methods used to qualify preformace of models like AUC
ah thank you though
lapis sequoia
small wedge
You could maybe try something like greedy layerwise training, where you train th...
in fact, i'm trying to achieve the same results as an old model we have while having a less complexe model to win on inference time since our old model is somehow overkill. So i took the backbone of the old model which had a segmentation head + postprocessing to get bounding box and added a head with a linear layer at the end that can regress directly the bounding box coordinates and predict if the class is there or not, so 5 neurons for every class we have. We were achiving 92% and my model is achiving 90%. All of this to say that i'm trying to leave the backbone as is and only play around the head
 full yacht
sick ember
my model has 92% test accuracy but I'm getting something like this
full yacht
sick ember
my model has 92% test accuracy but I'm getting something like this
how do you make that
 nova bane
Hello
I am new here
full yacht
tell me
sick ember
full yacht
how do you make that
I actually made a post
I have pastebin there, thank you lol
cerulean kayak
will I have to get dummies for a boolean categorical varible?
cerulean kayak
left tartan
Just recode it to 1 or 0
so if they already are then you don't need to? Correct or incorrect? (not a test question btw)
lapis sequoia
small wedge
https://pytorch.org/docs/stable/generated/torch.optim.lr_scheduler.StepLR.html
how do you choose the lr lambda for the scheduler?
small wedge
lapis sequoia
how do you choose the lr lambda for the scheduler?
I would just leave it at the default, 10% of the lr is decayed every, n steps. (oh you said lambda I assumed you meant gamma)
if you're converging on 230 epochs at a lr of .01 you probably want to approach .01
so you could start at .5 and decay 10% every 25 steps or so
left tartan
cerulean kayak
so if they already are then you don't need to? Correct or incorrect? (not a test...
I don’t really understand the question: if you have a boolean 0 or 1, then you are good.
cerulean kayak
okay. thanks
lapis sequoia
small wedge
if you're converging on 230 epochs at a lr of .01 you probably want to approach ...
i thought i was doing this to have less then 0.01 maybe the model if overshooting the global optimums
small wedge
do you think the model is overshooting?
lapis sequoia
it gets to 85% at 30 epochs, to 89% at 120 epochs and to 90 at 230 epochs so i thought maybe it is that
because between 89 and 90 for exemple it keeps fluctuating
lapis sequoia
small wedge
okay yeah you might want to aim lower than .01
thank you
lapis sequoia
 regal wharf
In my project
regal wharf
In my project
you need to write directly your question and when someone can or knows he/she would help you
 timid kiln
Main Question aka tl;dr Is there a pandas function to split a dataframe when a value in one row changes to another value in the subsequent row? Or is there an "easy" way to split a dictionary in the same circumstance?
I have a nested dictionary that I need to split up into separate dataframes. Or maybe separate dictionaries, I'm not entirely certain which would be better. The data will be merged with some additional data and then "exported" into folium to produce a pipeline system map. A dataframe seemed to make sense to me in this regard. The data comes from this 3rd party software. Here's the program output in dictionary format (first time using pastebin so lemme know if I'm doing this wrong...): https://pastebin.com/TR3sMQvr
In that data, the column Flowline contains two named flowlines (e.g. pipeline), C-1 and C-2. What I need to do is the following:
Main Goal
- Split the dictionary or dataframe so that when the value in Flowline goes from 'None' to something else, everything after that is separated out into another dataframe and reindexed.
Maybe don't need to do this...
- Once the dataframes are split (or perhaps during the process of parsing through the dataframe), replace 'None' in that column with the flowline name. Personally I think this would help with readibility if/when I export it to review the data.
Caveats
Some of these dictionaries have only one value in the subkeys. Those should be skipped as they aren't actually flowlines but "points" on the map.
Thinking about it out loud, I assume that I'll need to convert to a dataframe and then iterate through the dataframe row by row to detect a change between None and something other than None. That value could be any combination of letters, numbers, hyphens, etc.
I'm about to get off the train so I may not respond immediately. Please tag me if you respond. Thanks!
Pastebin
Pastebin.com is the number one paste tool since 2002. Pastebin is a website where you can store text online for a set period of time.
molten hamlet
is tensorflow with docker good option ?
tidal bough
timid kiln
**Main Question aka tl;dr** Is there a pandas function to split a dataframe when...
Hmm, seems to me you could do np.diff(df["col"] == None), and then the nonzero elements of that array would be the change points, at which you'd want to split the dataframe.
 wise quarry
Hiya, is anyone here familiar with AR models?
serene scaffold
wise quarry
Hiya, is anyone here familiar with AR models?
be sure to always ask your actual question, not if someone knows about a topic.
wise quarry
I have to create a small program where I create an AR model, without the AutoRegression library. So basically I need to code the equation myself, but I don't really know how to start. More specifically, I don't know how to calculate the coefficients needed (for example with the yule-walker equation). Anyone who can help me with that?
left tartan
timid kiln
**Main Question aka tl;dr** Is there a pandas function to split a dataframe when...
Use lag() to get a series of previous values, then compare lag series to value
timid kiln
tidal bough
Hmm, seems to me you could do `np.diff(df["col"] == None)`, and then the nonzero...
I took the dictionary and converted it to a dictionary of DataFrames, so main key → key and the key/value pairs → DataFrame.
As I'm not familiar with that syntax, I tried this:
d: dict = #3rd party program output
dataframes: dict = dict_to_df(d)

for key, df in dataframes.items():
    if len(df) == 1:
        continue # df with 1 row should be ignored

    value = np.diff(df["BranchEquipment"] == None)
The result is value = False False False False False False False False False False False False]
I apologize for being so obtuse. I don't know how to use that?
tidal bough
timid kiln
I took the dictionary and converted it to a dictionary of DataFrames, so main ke...
Hmm, this result should mean that the elements in df["BranchEquipment"] are either all None or all non-None (and hence, there's no rows at which their None-ity changes). Is that the case?
timid kiln
left tartan
Use lag() to get a series of previous values, then compare lag series to value
So I made this to try to test out what you're talking about, if I understood it correctly:
    df = pd.DataFrame({'BranchEquipment': ['C-1', None, None, None, None, None,
                        'C-2', None, None, None, None, None, None]}
                    )
    df['lagged_col'] = df['BranchEquipment'].shift(-1)
    print(df)
At this point, I have the two columns. The first column has C-1 in 'BranchValue' and None in 'lagged_col'. I'm not sure how else to do this other than go row by row in the dataframe to detect a difference between the two columns? Perhaps I didn't explain myself very well in my original post. All the rows from C-1 until one row before C-2 should be stored in a DataFrame, and then all the rows from C-2 until the last row should be stored in another DataFrame.
They shouldn't be. I made a little routine to test out what @left tartan suggested just above. That's what the data is going to look like in that column, although in some cases there will be many more rows of None.
timid kiln
tidal bough
Hmm, this result should mean that the elements in `df["BranchEquipment"]` are ei...
I tried this and got the same result:
    df = pd.DataFrame({'BranchEquipment': ['C-1', None, None, None, None, None,
                        'C-2', None, None, None, None, None, None]}
                    )
    value = np.diff(df["BranchEquipment"] == None)
    print(value)
In my non-optimized n00b brain, I think the process is go row by row and add the row to a DataFrame, and if the value in BranchEquipment changes from None to not None, start a new DataFrame and save off the one I just completed.
I just think that'll take a long time if I have a lot of pipelines in the program output.
tidal bough
timid kiln
I tried this and got the same result:
```py
df = pd.DataFrame({'BranchEquip...
Ah, how annoying, pandas seems to convert Nones into a different representation internally, so even though None == None, <that column>==None is all False.
Use instead np.diff(df["BranchEquipment"].isna()).
tidal bough
timid kiln
In my non-optimized n00b brain, I think the process is go row by row and add the...
That naive solution might actually work fine if you have less than, say, millions of rows. just make sure not to append to a dataframe, but append to a normal list and only then convert the list to a dataframe.
 untold bloom
is this something like the desired?
In [47]: df
Out[47]:
   BranchEquipment
0              C-1
1             None
2             None
3             None
4             None
5             None
6              C-2
7             None
8             None
9             None
10            None
11            None
12            None

In [48]: list(df.groupby(df["BranchEquipment"].notna().cumsum()))
Out[48]:
[(1,
    BranchEquipment
  0             C-1
  1            None
  2            None
  3            None
  4            None
  5            None),
 (2,
     BranchEquipment
  6              C-2
  7             None
  8             None
  9             None
  10            None
  11            None
  12            None)]
I've seen that in other examples, where a nested list is created and then converted to a DataFrame. Would you be able to help me understand why that's the better way to do it?
timid kiln
untold bloom
is this something like the desired?
```py
In [47]: df
Out[47]:
BranchEquipmen...
YES! 🙂
untold bloom
check the non-NaNs: it gives a True/False Series. Then take the cumulative sum of that to determine the groups
because True is 1 False is 0, when accumulating the sum, at the turning points, the groups change
if that makes sense
tidal bough
timid kiln
I've seen that in other examples, where a nested list is created and then conver...
Due to how dataframes are internally stored (each column is a numpy array), appending a row to a dataframe requires copyign all the data (the new row and all the old rows) to a new dataframe. That's very slow. Appending to a list meanwhile is constant-time.
untold bloom
untold bloom
because True is 1 False is 0, when accumulating the sum, at the turning points, ...
so after the groups are determinable, we .groupby. But we won't do any aggregation or something, but instead want the grouped frames
it turns out, when iterated, a GroupBy object yields the grouper and the grouped frame as tuples
the grouper here is the 1, 2 ... due to the cumulative sum of the mask. that's immaterial and you can ignore it
so what's left is extracting the frames out of that list of tuples
timid kiln
untold bloom
so after the groups are determinable, we `.groupby`. But we won't do any aggrega...
so what's left is extracting the frames out of that list of tuples
Yep, was just pondering that..
timid kiln
untold bloom
are you familiar with that?
I know what it is, I can't say that I have ever come up with the correct syntax for one without asking for help, which means someone else did it for me, heh.
timid kiln
untold bloom
are you familiar with that?
I'll give it a try and then if I can't figure it out I'll ping you here, if that's OK?
untold bloom
sure
timid kiln
untold bloom
sure
Well, I tried this:
        myResult: list[tuple] = list(df.groupby(df['BranchEquipment'].notna().cumsum()))
        flowline = [group for group in myResult]
and flowline has the same value as myResult. So that's no good.
This splits out each tuple, but I haven't figured out how to convert a tuple to a dataframe:
        for group in myResult:
            print(group)
            print("")
So my conclusion at the moment is once I figure out how to convert a tuple to a dataframe, stick that logic into the list comprehension? So then the dataframes are created in the list comprehension, yes?
untold bloom
timid kiln
Well, I tried this:
```py
myResult: list[tuple] = list(df.groupby(df['B...
yes you are close, sorry for the late reply
you can unpack each iteree and get the interesting part
[group for group_num, group in your_result]
since your_result gives back a 2-tuple in each iteration, which is composed of the group_number and the group frame itself, we can meet it with for group_num, group to destructure
alternatively, but badly, you can also do
[group_num_and_group[1] for group_num_and_group in your_result]
see the difference? now we didn't destructure right away, but instead keep it as a single thing
then we access the desired part of that thing (that tuple) by indexing with [1]
both achieve the exact same thing, but as they say, the first one is more Pythonic
that [1] is ugly ngl
even better than the first option is
[group for _, group in your_result]
_ stands for not caring about the thing
we don't care about the group number, so we might as well not give it a full name and increase the cognitive load there
untold bloom
untold bloom
then we access the desired part of that thing (that tuple) by indexing with [1]
what you did was this but without the [1] part, so you'd get the same tuples back, and ergo the same list of tuples back at the end.
So my conclusion at the moment is once I figure out how to convert a tuple to a dataframe, stick that logic into the list comprehension?
so in short yes to this: but we don't convert tuples into frames but instead access the desired part in the tuples (either via unpacking/destructuring in the for part of the comprehension, or via [1]).
timid kiln
untold bloom
sure
I was in the middle of replying and someone came in my office. We ended up with pretty much the same thing, more or less. I did try the part where you had the [1] but I kept getting errors, so I ended up with this:
myResult: list[tuple] = list(df.groupby(df['BranchEquipment'].notna().cumsum()))
flowlines = [group_df.reset_index(drop=True) for key, group_df in myResult]
df1, df2 = flowlines
print(df1)
print(df2)
In this case I know there's just two flowlines in myResult, in the future I'd just loop using len(myResult).
What's confusing for me is when I print(flowlines) it looks like one list, with what appears to be two dataframes separated by one comma. I don't understand (perhaps I don't need to understand but I want to) how python knows that the two entities separated by that comma are two dataframes?
untold bloom
actually it doesn't know
all it does when printing a list is
ask each element of the list "what is your representation?"
there's a function built-in called repr
timid kiln
But if I print(type(df1)) it does say it's a dataframe.
timid kiln
untold bloom
ask each element of the list "what is your *repr*esentation?"
Ah, I get it now.
untold bloom
when you put things into a list, though, Python doesn't put specific effort to know what it contains
it's a list of objects, is all
when it comes to printing, it asks the objects
so yeah
timid kiln
It's nice when things are encompassed by [] or () or {}. Nothing like that for a dataframe tho, right?
untold bloom
yeah those are literal makers, and only for (some) built-in types
not for a DataFrame or Series
timid kiln
Thank you SO MUCH for your help! Very much appreciated!
untold bloom
glad to be of help!
timid kiln
untold bloom
glad to be of help!
So now that we did all that... Do you think it would be "better", whatever that might mean, to perform these operations on the form the data was originally in? In this case the data was stored in a nested dictionary which I converted to a dataframe(s) and then came here for help. As I'm working through this, once they're split up I need to convert them back to dictionaries in order to keep track of which dataframe goes with which flowline, as there's more data to merge/concat together before I'm done.
 cedar owl
Hi there! Apologies if this is the incorrect place to post something like this, but I have been working on a project that uses NEAT in python to try to build a solver for the old popular number tile sliding game 2048. I have a git link to my work so far, was hoping to connect to people that might also be interested that would want to look into it and see potential improvement points. Thanks in advance!
dire violet
how would i load a very large text dataset? the dataset is in json format
 agile cobalt
how large are we talking, and load for what?
< 1GB you can probably just use the json module from the standard library (or look up jsonlines if it contains multiple documents separated by newlines instead of the entire thing being one document)
1~4GB you might want to look into more efficient modules
4GB you probably had better dump it into a database like MongoDB and work with it there (at most using python to query it)
 bold timber
# Decoder
class Decoder(tf.keras.Model):
  def __init__(self, vocab_size, embedding_dim, dec_units, sequence_length):
    super(Decoder, self).__init__()
    self.embedding_dim = embedding_dim
    self.vocab_size = vocab_size
    self.dec_units = dec_units
    self.sequence_length = sequence_length

  def build(self, input_shape):
    self.embedding = Embedding(input_dim = self.vocab_size,
                               output_dim = self.embedding_dim)

    self.gru = GRU(units = self.dec_units,
                   return_sequences = True,
                   return_state = True)

    self.attention = BahdanauAttention(self.dec_units)
    self.dense = Dense(self.vocab_size, activation = "softmax")


  def call(self, x, hidden, shifted_target):
    outputs = []
    context_vectors = []
    attention_weightss = []
    shifted_target = self.embedding(shifted_target)

    for t in range(0, self.sequence_length):
      context_vector, attention_weights = self.attention(hidden, x)
      dec_input = context_vector + shifted_target[:, t]
      output, hidden = self.gru(tf.expand_dims(dec_input, 1))
      outputs.append(output[:, 0])

    outputs = tf.convert_to_tensor(outputs)
    outputs = tf.transpose(outputs, perm=[1,0,2])

    outputs = self.dense(outputs)
    return outputs, attention_weights
For example, if we have the output token as 20 tokens, then the output will be 20 tokens that have their own vector values. If we now use return_state=True, the vector we get is the same value as the vector of the 20th token. Why do we need to use the vector of the 20th token?
 covert crest
https://paste.pythondiscord.com/ogucegowey
this is my code but my epochs are 5 and I know that but i've seen other guy making good val accuracy and low val loss with just 5 epochs I followed it and my loss starts at 100 maybe or more (not val loss just normal loss) is there any ways to make it better?
sleek harbor
dire violet
how would i load a very large text dataset? the dataset is in json format
orjson is supposed to be a faster json parser than the default module
left tartan
dire violet
how would i load a very large text dataset? the dataset is in json format
I use duckdb, as i can combine multiple steps in my pipelines together. Duckdb uses yyjson behind the scenes: https://duckdb.org/2023/03/03/json.html . If interesting, the developer did a video on this topic: https://www.youtube.com/watch?v=7MtJZqBdYTI
 cinder jay
hey
i have this doubt:
I am designing a neural network of 0, the idea is that the neural network solves a boolean function, I am in the phase of calculating the weights and the activation thresholds. Does anyone know how to do it??
past meteor
left tartan
I use duckdb, as i can combine multiple steps in my pipelines together. Duckdb u...
Seconding DuckDB
That is, if you like SQL workflows. Otherwise something like Polars is great.
 rapid pewter
cinder jay
i have this doubt:
I am designing a neural network of 0, the idea is that the ne...
rapid pewter
cinder jay
i have this doubt:
I am designing a neural network of 0, the idea is that the ne...
this sounds interesting
untold bloom
timid kiln
So now that we did all that... Do you think it would be "better", whatever that ...
hi, sorry for the late reply. it's easier & faster to do it in the pandas domain because they put a lot of effort on for loops being on lower levels for speed & abstracted operations (like cumsum) whereas any trial to do this turning-point based splitting in pure Python will inevitably involve Python level for loops which are slower let alone being more cumbersome to write (itertools.accumulate, itertools.groupby and some list comprehensions here and there need collobaration I think, which are not so flowingly writable IMHO).
wet cedar
Hi, I'm not sure where to post this exactly but I'm looking for someone who has experience with OpenCV for tasks such as text detection and image segmentation, will be happy to pay for a commission
left tartan
wet cedar
Hi, I'm not sure where to post this exactly but I'm looking for someone who has ...
I'm not a mod or anything, but this discord has a no solicit rule, but if you ask your question, someone may be able to help.
!rule 9
wet cedar
Oh, I see.
Alright, perhaps I can ask here.
I'm trying to improve the accuracy of an image segmentation script with breaks a script into 20 pieces and detects text in each, and was wondering if there any tips for the same.
def process_image(image_path, rows, cols):
    import cv2
    import numpy as np
    import os
    import time
    import concurrent.futures
    from PIL import Image
    import pytesseract
    from functools import partial

    IMAGE_PATH = image_path
    SUB_DIRECTORY = 'sub_images'

    def load_image(image_path):
        image = cv2.imread(image_path)
        if image is None:
            raise ValueError(f"Failed to load image: {image_path}")
        return image

    def classify_image(image):
        image_pil = Image.fromarray(image)
        text = pytesseract.image_to_string(image_pil)
        return text.strip() != ''

    def process_sub_image(sub_image):
        has_text = classify_image(sub_image)
        return sub_image, has_text

    def save_sub_images(sub_images):
        os.makedirs(SUB_DIRECTORY, exist_ok=True)
        for i, (sub_image, has_text) in enumerate(sub_images):
            if has_text:
                sub_image_path = os.path.join(SUB_DIRECTORY, f"text-sq{i + 1}.png")
            else:
                sub_image_path = os.path.join(SUB_DIRECTORY, f"image-sq{i + 1}.png")
            cv2.imwrite(sub_image_path, sub_image)
        print("Sub-images saved successfully.")

    def break_image(image, rows, cols):
        height, width, _ = image.shape
        sub_height = height // rows
        sub_width = width // cols
        sub_images = []
        for i in range(rows):
            for j in range(cols):
                sub_image = image[i * sub_height:(i + 1) * sub_height, j * sub_width:(j + 1) * sub_width]
                sub_images.append(sub_image)
        return sub_images

    def main():
        image = load_image(IMAGE_PATH)
        sub_images = break_image(image, rows, cols)

        with concurrent.futures.ThreadPoolExecutor() as executor:
            processed_sub_images = executor.map(process_sub_image, sub_images)

        save_sub_images(processed_sub_images)

    start_time = time.time()
    main()
    end_time = time.time()
    runtime = end_time - start_time
    print(f"Runtime: {runtime} seconds.")
 warm hollow
hello! I have a question about selenium. I don't know much about selenium and my english is not good too. I want to make a little ai that can browse internet(for educational purposes). Is it posibble to make a simple recorder like code that records steps what I do in browser for training data? (XPATH, IDs ...) pls replay with @warm hollow
timid kiln
untold bloom
hi, sorry for the late reply. it's easier & faster to do it in the pandas domain...
You're pretty darn sharp my friend. As a beginner (for the past 18 months lol) I can't tell you enough how much your experience and guidance help. Thank you!
Last question for the moment, I'm using folium to take this data and put it on a map. I don't see a GIS or map channel, so what channel do you think would be best to post questions about folium?
serene scaffold
.randomcase I version my notebooks

 strange elbowBOT
i VeRSioN MY nOtebOOKS
untold bloom
timid kiln
You're pretty darn sharp my friend. As a beginner (for the past 18 months lol) ...
thanks. i don't know about folium nor GIS, sorry. (while writing the message i looked at them, but still don't know what channel could fit for it as there are many channels here and i go in like 3.5 channels, sorry.)
 wooden forge
Hey there, it's going to be tricky to explain because the experimental data I used are under NDA. I am working on charge stability diagrams of quantum dots (it's okay if you don't know what that is, an example is attached). I am working on recognising line slopes using a ML algorithm. The issue I have right now is a very high standard deviation. I normalise my angles between 0 and 1 (takes the radian and divide by 2 pi) so when the standard deviation is 0.1 it's equivalent to 0.1 x 2pi x 180 / pi = 36° so it's pretty big. I am trying to reduce it below 0.07 which for now is the max I can achieve. But it's tricky. I used different loss functions (MSE, SmoothL1, MAE). Different learning rates. Different batch sizes, etc. But I am really struggling.
The data are small patches of 18 by 18 pixels, because the goal is to avoid a full scan and only probe small regions to calibrate a device. For now I only focus on patches with one line (this filtering is done prior to the training of course).
I tried using a different method for the loss, because the angles observes a symmetry (3rd attachment), so an angle of 0° is equivalent to 180° with respect to the vertical axis. I subtract from the predicted angle pi if it's above a certain threshold like 175° and then use the smallest loss between the prediction and the expected value. This gave me much better results, but I'm blocked at 0.07.
Sorry if this is a bit evasive, but mayhaps someone would know how to tackle this issue.
Edit: I use the gradient of the image to help the network find the features
Edit 2: I have a constraint to make a small network so not too much hidden layers


 tidal bough
One idea I have is to calculate the gradient of this image (so, a 2-channel image - the discrete derivative vertically and horizontally) and see if that'd be easier to analyze. The gradient here should have sharp edges at the limits of the lines, but it might also have noticable angular dependency.
past meteor
There's someone at work that is brilliant at what he does but creating several copies of a notebook is his vibe
Bio(-med) domain knowledge is important for us and that's what he brings. I try to avoid his code being used in any halfway important place.
wooden forge
tidal bough
One idea I have is to calculate the gradient of this image (so, a 2-channel imag...
Ho yeah that's what I did, should have mentioned that!
wooden forge
It's a simple feed-forward on the derivate of the patches haha
well derivative of the whole diagram and then I cut it into small patches to train the network on
iron basalt
Do you need ML for this, why not use line detection methods?
wooden forge
Calculation time, also the pictures are very small so it could be difficult to use something like that I think
ML was kinda to go to
iron basalt
Not sure how fast it needs to be, but regular line detection methods are pretty fast.
wooden forge
Well I need to find the angle of the line. This tasks comes after detecting a line
iron basalt
wooden forge
Well I need to find the angle of the line. This tasks comes after detecting a li...
Yeah if you have the line, you have the angle.
wooden forge
There is also a lot of variability in the diagrams and between different device
wooden forge
iron basalt
Yeah if you have the line, you have the angle.
It just detects there is a line, it's just 0 or 1 (no line, line)
it doesn't tell the coordinates
iron basalt
wooden forge
It just detects there is a line, it's just 0 or 1 (no line, line)
Line detection methods give you points, point angle, etc.
wooden forge
mmh
iron basalt
When it comes to detecting things that are basic shapes, like lines, regular non-ML CV methods work well. ML is more for things that are not just simple shapes / we can't even really specify it well to the computer (like how would I program it to detect a "dog," it's not as obvious).
wooden forge
Thing is the data are very noisy
lines aren't always perfect, sometimes it's very messy
iron basalt
Yeah, line detection CV methods have parameters for noise and such.
Btw, the gradient of the image is how most of these methods start.
And also probably some blurring on larger images for noise.
molten hamlet
What shape do I need for LSTM?
Docs says inputs: A 3D tensor with shape [batch, timesteps, feature].
so if I have 1 sample with 5 values then is this (None, 1, 5) ok ?
serene scaffold
molten hamlet
What shape do I need for **LSTM**?
Docs says `inputs: A 3D tensor with shape [b...
batch is the number of instances that you have at a time, so it would be (1, ???, 5). we still need to know how many timesteps there are
molten hamlet
and thats the confusing part, cause I know im making 5 stamp slices, but batch size is unkown
serene scaffold
that's just how many instances you want to run through the model at a time
molten hamlet
serene scaffold
that's just how many instances you want to run through the model at a time
yes, and its specified with None, cause its flexible 😐
serene scaffold
right. but you said you only have one instance, did you not?
molten hamlet
instance of what?
serene scaffold
uh, what does your model do?
molten hamlet
    layer_in = Input(shape=(tser_size + ft_size,))
    print(f"Inp: {layer_in.shape}")
Inp: (None, 6)
Thats shape with unspecified batch
 serene scaffold
higher level
molten hamlet
predict stock
serene scaffold
okay, and your data points are what?
serene scaffold
you said you have five features. what are they?
molten hamlet
5 prices in sequence
serene scaffold
over time, for the same company?
molten hamlet
yes
serene scaffold
how many rows of data do you have total?
serene scaffold
okay. what is a timestep, in this context?
wooden forge
iron basalt
And also probably some blurring on larger images for noise.
I want to avoid pre-processing, this has to be a very generic method, because of the variability of the diagrams
 serene scaffold
molten hamlet
I dont pass timestamps to model, only prices splited into 5elements segments
serene scaffold
molten hamlet
I dont pass timestamps to model, only prices splited into 5elements segments
so it's a sliding window of 5 values?
molten hamlet
yes
serene scaffold
then I guess it would be (batch_size, 1, 5)
molten hamlet
X is 5 price values, Y is 6th price value
def to_sequences_1d(dataset, seq_size=1):
    x = []
    y = []

    for i in range(len(dataset) - seq_size - 1):
        # print(i)
        window = dataset[i:(i + seq_size), 0]
        x.append(window)
        y.append(dataset[i + seq_size, 0])

    return np.array(x), np.array(y)
could I improve that somehow? maybe I should add some timestamps ?
serene scaffold
molten hamlet
could I improve that somehow? maybe I should add some timestamps ?
I've never done time series data
I do NLP
molten hamlet
it will probably solve itself if I do 2d 🤔
wooden forge
iron basalt
Line detection methods give you points, point angle, etc.
Yeah also big issue with this, I need to manually set the parameters, but again big variability issue
molten hamlet
serene scaffold
then I guess it would be `(batch_size, 1, 5)`
im reading stack and they say other wise, (batch, 5,1) but im gona find some more discussions
serene scaffold
molten hamlet
im reading stack and they say other wise, `(batch, 5,1) ` but im gona find some ...
it's not guaranteed to be the same for all possible LSTMs for this task.
iron basalt
wooden forge
Yeah also big issue with this, I need to manually set the parameters, but again ...
What color format are you pixels?
Does the color matter or just grayscale?
wooden forge
iron basalt
Does the color matter or just grayscale?
doesn't matter
it's normalize between 0 and 1 anyway, and it would be fake color
I use a copper cmap because it looks better but that's for display
iron basalt
wooden forge
doesn't matter
How many shades of gray? 8 bit?
wooden forge
iron basalt
How many shades of gray? 8 bit?
50
lol just kidding
I huh, I don't know?
The tensor containing all the pictures is of size [n, 1, N, N]
iron basalt
I'm assuming N is 18, so what is n?
wooden forge
number of patches
iron basalt
wooden forge
number of patches
Have you look at the ones it gets wrong? Maybe it's not actually possible to do much better (without a bigger patch).
wooden forge
iron basalt
Have you look at the ones it gets wrong? Maybe it's not actually possible to do ...
Patch size is mendatory, so I can't change that, also, I know it struggles with vertical lines, possibly because as I mentioned in my initial message, it gets the loss wrong, hence why I changed the way to calculate it.
iron basalt
wooden forge
Patch size is mendatory, so I can't change that, also, I know it struggles with ...
Yeah you need angles opposite are the same and either should be valid.
wooden forge
iron basalt
Yeah you need angles opposite are the same and either should be valid.
Wait say that again?
iron basalt
wooden forge
Wait say that again?
If your target is 0 deg and it outputs 180 deg, since it's a line that should be error 0.
wooden forge
yes yes
so what I do is take the prediction minus pi and calculate a second loss, and then I take the minimum between this and the initial 'raw' loss
iron basalt
But with patches only so big, and lines not aligning perfectly on a pixel grid (they are infinitely thin), you can only get the angle so correct without a bigger image size, e.g. pixel art lines.
The bigger the image, the more you can get a line made of pixels to match an actual line.
wooden forge
yeah
iron basalt
So some error in angle is expected, and since it's only 18x18, you may be at the lower bound.
iron basalt
For example, if you took a "line" of pixels and draw a non-pixel line from the center of the pixel of one end to the center of the other, you have parts where the pixels under the line are not even filled in. The way line drawing algorithms work is that they choose to draw the line with most pixels overlapping / least error. But there still is some error.
Now going in reverse, it's not obvious what the angle is from just a small segment.
iron basalt
wooden forge
Patch size is mendatory, so I can't change that, also, I know it struggles with ...
You may not be allowed larger patches, but you could test it with larger patches anyhow, to make sure that is not the problem.
iron basalt
wooden forge
I see
As an extreme case:

Consider your patch is the yellow. What is the angle? Maybe you would say 45 deg. But in reality, it's not.
 opal pike
Is here a good place to ask a question about scipy? Specifically signal
serene scaffold
opal pike
Is here a good place to ask a question about scipy? Specifically signal
this is the place. whether it's a good place is up to you.
wooden forge
iron basalt
Consider your patch is the yellow. What is the angle? Maybe you would say 45 deg...
also, if I take patches too big, I might get more than one line on a single patch, which I don't want
cedar owl
cedar owl
Hi there! Apologies if this is the incorrect place to post something like this, ...
Anyone know of a better place to look for something like this?
 misty flint
Have you met your data?
💀💀

 unique crane
can you use this formula for any convolution operation?
 wooden sail
unique crane
can you use this formula for any convolution operation?
wooden sail
unique crane
can you use this formula for any convolution operation?
you don't show what S and P are here, but it looks like this is for symmetrically padded data, each side padded with P samples, and with stride S. there are differences depending on whether you want to do linear or circular convolution and how you define the edge behavior
 grave summit
lapis sequoia
grave summit
lapis sequoia
I am looking to start working as a programmer and I've never looked at this site before and I was wondering if someone could explain this to me.
I Am Not Taking This Job!!!!! I as wondering if I even have the skills or what it would take to do this job. Im pretty sure I could eventually figure it out....
https://www.freelancer.com/projects/python/port-tensorflow-code-pytorch
obviously I would need to install TensorFlow and PyTorch.... what does produce the same output mean? Would it be re-creating functions that TensorFlow uses in PyTorch?
If this isn't the place to ask, please let me know

Python & Neural Networks Projects for $30 - $250. I am looking for a freelancer who can help me port my TensorFlow 1 codebase to PyTorch. The codebase is small, consisting of 150 lines, most of which will remain unchanged. It runs as is with no error...
agile cobalt
lapis sequoia
I am looking to start working as a programmer and I've never looked at this site...
data science is a huge field in itself
if you want to work professionaly with pytorch/tensorflow, you'll have to dive deep into how machine learning works - I'm talking months if not years of actively studying it
if you want to work as a programmer, I'd recommend just avoiding it for now
hasty mountain
tSNE can be quite...curious...
I really hope there's nothing wrong with that...

I mean...there isn't, right?
The plot seems too...harmonious...it feels like tSNE tried to draw something
lapis sequoia
agile cobalt
data science is a huge field in itself
if you want to work professionaly with py...
Thank you for your reply 🙂
hasty mountain
Though...I suppose that, the lack of consistence between "color N goes to dimensions (X,Y)" indicates that my model isn't performing that well on entropy minimization...
 turbid fox
Heya! I want to make a simple ML model that can understand and play [at in intermediate level] the game of chess.
The issue i run into is data generation, as there are many permutations. Is there already data that exists for this, or is there a better way to generate a training and testing model without necessarily training via permutations?
left tartan
turbid fox
Heya! I want to make a simple ML model that can understand and play [at in inter...
There are lots of databases, such as https://database.lichess.org/
turbid fox
left tartan
There are lots of databases, such as <https://database.lichess.org/>
Cool, thanks 🙂
 vestal widget
Hey, are there anyway to train a txt or yml dataset for a tensorflow chatbot? I can only find mention about using json file.
wanton sentinel
I feel real dumb, but how would you filter a dataframe based on a multiindex conditional and a col value conditional? The following works, but I feel like I should be able to do it in a single loc.
df.loc[(slice(None),'2000'),:].loc[df['CONDITION'] == '1']
single loc, not sure. maybe query?
df.query("name_of_the_second_level == \"2000\" and CONDITION == \"1\"")
it's flexible in the regard of mixing index levels and column name queries
 marsh kiln
can we collect the data which is give in image format and can we convert into json format
left tartan
Simplest is something like ```py
import pandas as pd
data = {
"col1":[1,2,3,4,5,6,7,8,9,10],
"col2":['a', 'b', 'c', 'b', 'e', 'b', 'g', 'b', 'i', 'b'],
"col3":[10,20,30,40,50,60,70,80,90,100]
}
df = pd.DataFrame(data).set_index(["col1", "col2"])
df[(df.index.get_level_values('col2') == 'b') & (df['col3'] > 50)]
Could also use df.loc[] at the end, instead of df[]
I personally just avoid multi-indexes, and would probably just drop reset them and filter as regular columns. As a database guy, Pandas indices annoy me.
left tartan
wanton sentinel
I feel real dumb, but how would you filter a dataframe based on a multiindex con...
The main thing here is: you can combine two conditions with the & (and boolean).
hasty mountain
hasty mountain
tSNE can be quite...curious...
I really hope there's nothing wrong with that...
Curious...I tried to make a model to minimize data entropy, and ended up with a model that creates dot figures.
Too bad I think I'll have to re-train it 
 left tartan
hasty mountain
Curious...I tried to make a model to minimize data entropy, and ended up with a ...
left tartan
hasty mountain
Curious...I tried to make a model to minimize data entropy, and ended up with a ...
Looks like a fish.
 strange plinth
I'm looking for any complete code sample that uses tf.keras.Model.call(). Anyone have something on GitHub? I know nothing about Tensorflow, I just need an example that runs.
wanton sentinel
left tartan
The main thing here is: you can combine two conditions with the & (and boolean).
I'm aware of logical and, but your structure is a single index. Mine is a multi-index using the tuple of (slice(None),'2000') to get all indices matching '2000' for the second level, then matching all cols (:). I tried adding the CONDITION restriction in as the col indexer, but it errored. I'm likely doing something wrong - still trying to learn the ways of loc after primarily using more inefficient ways previously.
left tartan
wanton sentinel
I'm aware of logical and, but your structure is a single index. Mine is a multi-...
Could you share a minimal repro of your df? My example was a multi-index, using col1, col2.
wanton sentinel
I will try and recreate something quickly. It was work related, so unshareable anyway.
left tartan
Yah, I just mean something like I shared... just dummy data/structure.
I think all you need is something like df.index.get_level_values('col2'), but curious what's different.
wanton sentinel
No, you're totally right. Your method will work for what I want. Have never seen the get_level_values function before. Thanks!
Much cleaner than the tuple/slice method for grabbing a single multi-index level.
sick ember
hasty mountain
Curious...I tried to make a model to minimize data entropy, and ended up with a ...
Hmm how do you get this graph
wooden forge
wooden forge
Hey there, it's going to be tricky to explain because the experimental data I us...
Since @tidal bough and @iron basalt, you were involved in this little discussion I hope you don't mind the ping. So I managed to get the standard deviation down to 0.06 (~22°), which is better but still not satisfying. When I check for the loss value between the prediction I look also at the loss with the prediction being reset to the vertical axis like follow:
# Loss
loss1 = criterion(y_pred, y_batch)
loss2 = criterion(resymmetrise_tensor(y_pred, normalize_angle(settings.threshold_loss * 2 * np.pi / 180)),y_batch)
loss = torch.min(loss1, loss2)```
I basically subscract pi from the prediction if it exceeds a certain value and I consistently get `0.06` with the threshold set between 130 and 136°.Do you have it already?
I can lift something from my GitHub if not
strange plinth
past meteor
Do you have it already?
i've had a few samples, but none show this problem: https://github.com/nedbat/coveragepy/issues/856
past meteor
I can have a look and provide you with another sample tomorrow morning (I'm GMT+2) if that's any help
strange plinth
past meteor
I can have a look and provide you with another sample tomorrow morning (I'm GMT+...
that would be great. it's no rush, the issue is 3.5 years old...
hasty mountain
sick ember
Hmm how do you get this graph
I passed my model outputs to an array, then applied tSNE to this arrays and plotted the resulting outputs
cinder urchin
oh
sick ember
hasty mountain
I passed my model outputs to an array, then applied tSNE to this arrays and plot...
Thank you!
 quasi rock
Hi Guys!
I need important help please. Has anyone tried this using this Motion Detector in python?
https://www.geeksforgeeks.org/webcam-motion-detector-python/
I have set one up today to send notifications to my phone but it kept malfunctioning and sending the notifications all the time. I only need this because someone with a key to my house might try to enter and damage my things or take things of mine, I am not allowed to change locks just yet and this code was all I could get in such short notice 😦
Could some help me find out, is it because it uses pictures and as it gets later in the day it gets darker so the code thinks there is motion because the images are different?

GeeksforGeeks
A Computer Science portal for geeks. It contains well written, well thought and well explained computer science and programming articles, quizzes and practice/competitive programming/company interview Questions.
 errant spear
Would anyone be able to explain how an LSTM model works? As an example, let’s say you’re trying to predict the price of a stock the next day based on 30 previous days of closing prices, open prices, highs, lows, and the trading volume, how would you go about doing it?
 subtle crag
Does anyone know where can i start ml as a beginner
small wedge
 nova timber
subtle crag
Does anyone know where can i start ml as a beginner
nova timber
subtle crag
Does anyone know where can i start ml as a beginner
it depends where you're coming from... ML can be approached from two sides: from programming, or from science
 cloud sapphire
is there any tutorial on creating .h5 models for predictions? im new to this
 sharp nimbus
cloud sapphire
is there any tutorial on creating .h5 models for predictions? *im new to this*
sharp nimbus
cloud sapphire
is there any tutorial on creating .h5 models for predictions? *im new to this*
do you already have a model? (Tensorflow, Pytorch, etc)?
cloud sapphire
sharp nimbus
do you already have a model? (Tensorflow, Pytorch, etc)?
i want to make a tensorflow model
sharp nimbus
so what predictions do you wanna make? like a classifier or regression? anything more spesific than just predictions?
cloud sapphire
sharp nimbus
so what predictions do you wanna make? like a classifier or regression? anything...
like i wanna make a bot for poketwo bot which would send prediction messages on pokemon spawned, and i just got to know that it needs tensorflow model.h5 to do so , so im here to ask for help like to suggest a tutorial or teach maybe
i do have a code already but didnt work , the accuracy was all 0
sharp nimbus
hm can you send the code?
cloud sapphire
sharp nimbus
you already have the data right?
sharp nimbus
and you've already ran that training script but got 0.0 accuracy?
cloud sapphire
yes
sharp nimbus
is it changing per epoch?
cloud sapphire
no ig its remaining the same
lemme do it again
the accuracy remained the same
Total params: 401,209
Trainable params: 401,209
Non-trainable params: 0
this was in the starting of the code aswell as in the ending as the summary
sharp nimbus
mhm and does it train?
cloud sapphire
nah since the non-trainable param are 0 in the end , it means it didnt train the model instead just saved the previous one with the same name
what could be the error due to?
sharp nimbus
uh non-trainable should remain 0 cuz you didn't set any layers to trainable=False
sharp nimbus
sure
 cursive crown
Hi guys. I need some help in running a linearmodels.PanelOLS regression. I have the basic setup ready and it works almost all the time but for this one particular stat in a particular timeframe, the t-stats I get is simply empty. I get a valid parameter value but t-stat is just empty.
It gives valid t-stat for all other statistics I'm running the regression for, even for the same stat over a longer time period, the t-stat is an actual number but for this particular time period, it's empty.
I have checked if it's because there are too many nans in the column (which is a possibility) but after removing nan, I still have nearly 400 observations so it should be alright. Please let me know your thoughts on this. Thanks!
cursive crown
Also, not just t-stat, std err and p value are also empty.
 hybrid mica
If there is a feature with "yes" and "no", should I use one-hot encoding or label encoding?
 lunar kraken
hi! i have a dataframe of years to percentual change of some stock market index value (i.e. 2000 -> 12%, 2001 -> -10%, ...). i want to create a new series where i apply the percentual changes to a starting value of e.g. 100. with itertools, it goes like this: itertools.accumulate(sp500_index_pct_change, func=lambda a, b: a * (1 + b), initial=100). i can turn this into a pd.Series, but is there a "more elegant" solution using the pandas/numpy api? i.e. something that gives me a new datafram with the year indices intact, but accumulating in chronological order (the df data is sorted from newest to oldest)?
left tartan
lunar kraken
hi! i have a dataframe of years to percentual change of some stock market index ...
Is this just a cumulative product? https://pandas.pydata.org/docs/reference/api/pandas.DataFrame.cumprod.html
lunar kraken
i'm new to this stuff, so... maybe 😄 i'll have a look
left tartan
hybrid mica
If there is a feature with "yes" and "no", should I use one-hot encoding or labe...
OneHotEncoding a boolean is the same as just converting the boolean to 1 or 0. So yes, convert to a binary column either directly or onehotencoding.
lunar kraken
left tartan
Is this just a cumulative product? https://pandas.pydata.org/docs/reference/api/...
Yep, that seems to be it. Thanks!
 coral ledge
Hey guys! I am learning machine learning and have enrolled a course from Udemy. There is a problem with that course, it does not cover all the topics completely and nor it explains everything in depth. It doesn't even touch the mathematics behind the models. I am very very confused about how should I learn ML.
I watched many roadmap videos. They say you should practice on websites such as Kaggle, I tried that too but it was very overwhelming for me. I am very lost right now. Can anyone please guide me and tell what should I do right now?
 desert oar
coral ledge
Hey guys! I am learning machine learning and have enrolled a course from Udemy. ...
desert oar
coral ledge
Hey guys! I am learning machine learning and have enrolled a course from Udemy. ...
Advice #1 is avoid video tutorials unless it's about math or workflow stuff. Advice #2 is to accept that ML and DS is a huge field and it will be impossible to learn all of.
What's your background, and what are your goals?
coral ledge
#1, #2 understood, I am from Computer Science background itself completed first year going to second year. My goal is not really precise but want to do career in ML
desert oar
coral ledge
#1, #2 understood, I am from Computer Science background itself completed first ...
If you have a DS or ML specialization in your CS department, sign up and start talking to an advisor in your department ASAP
university is the single best place to get off to a good start
you shouldn't be doing udemy stuff in school if you can avoid it, don't want to split your time and energy too much
school is where you can learn all the math and get lots of hands on project experience in a controlled structured format
and most importantly you can seek out mentorship from faculty, get an advisor, do a capstone project, etc
all of that stuff sets you up for success in a way that noodling around on udemy does not, unless you are an unusually focused and motivated individual
if you don't have a DS/ML specialization, talk to an advisor about constructing one for yourself, and try to at least get advice from someone in the stats and/or math departments about what courses to take
coral ledge
desert oar
if you *don't* have a DS/ML specialization, talk to an advisor about constructin...
First of all I really appreciate your help and thank you for this.
The problem in my university is that the faculty is not skilled at all. There are times when the faculty asks students to solve their problem. So learning under university is pretty complicated.
That is why I had no option but to switch to the mercy of internet. And in Internet there are millions of courses which results in confusion.
What should I do right now? I have no other option besides Internet
desert oar
coral ledge
First of all I really appreciate your help and thank you for this.
The problem ...
Sometimes faculty give their research problems to students as a deliberate exercise, are you sure it's not that?
coral ledge
desert oar
Sometimes faculty give their research problems to students as a deliberate exerc...
I am 100% sure
desert oar
coral ledge
What should I do right now? I have no other option besides Internet
If this is truly the case, then to some extent you are stuck with constructing your own curriculum to follow. What does the Udemy course cover? I assume it's a lot of hands on practice and relatively little theory
can you share a link to the course?
coral ledge
desert oar
If this is truly the case, then to some extent you are stuck with constructing y...

Udemy
Learn to create Machine Learning Algorithms in Python and R from two Data Science experts. Code templates included.
It has covered only the programming part, not the theory and mathematics is completely discarded
desert oar
coral ledge
https://www.udemy.com/course/machinelearning/
This doesn't look bad. The #1 thing you will be missing is the math. you will want to learn calculus, linear algebra, and probability. Frankly I don't know where to go to learn calculus well the first time. For linear algebra, you can start with the MIT open courseware course, the instructor Gil Strang (recently retired) is something of a legendary math teacher. If you already know this material but you feel like you don't have a good intuitive understanding, I can't speak highly enough of the 3blue1brown Youtube channel, Who has comprehensive "intuitive" over views of both linear algebra and calculus. The creator is a math professor and does an excellent job of presenting subtle and sophisticated concepts.
I'm not sure where to go for probability either. I believe MIT and a few other top universities publish calculus and probability lecture videos, homework, etc. that you can study from
left tartan
desert oar
This doesn't look bad. The #1 thing you will be missing is the math. you will wa...
For calc, I'd second the 3b1b, followed by Strang's HS intro to calc, then the full OCW calc. https://ocw.mit.edu/courses/res-18-005-highlights-of-calculus-spring-2010/ followed by the full course: https://ocw.mit.edu/courses/18-01-calculus-i-single-variable-calculus-fall-2020/
desert oar
A good textbook is also essential of course, don't feel bad about buying a used copy or pirating a copy, they're too damn expensive. Self studying is harder than doing it in an actual structured course setting, it requires a lot of discipline
coral ledge
desert oar
A good textbook is also essential of course, don't feel bad about buying a used ...
I completely agree
left tartan
desert oar
A good textbook is also essential of course, don't feel bad about buying a used ...
There's also https://openstax.org/details/books/calculus-volume-1, which Strang also contributed to
desert oar
After you've covered the math, you will probably want to cover some statistics as well, since the focus on "machine learning" will tend to leave some gaps in your understanding of stats fundamentals. There are a handful of good online textbooks for this kind of thing, but you have enough work for now
coral ledge
I should first completely learn calculus, linear algebra and probability and then only should go on to ML models? What is your suggesstion?
coral ledge
desert oar
After you've covered the math, you will probably want to cover some statistics a...
So mathematics is the highest priority first right?
desert oar
coral ledge
I should first completely learn calculus, linear algebra and probability and the...
More realistically, every time you get through a new topic in calculus or linear algebra, you will get a new understanding of something you have already seen in your ML course. I prefer to learn a little bit of each thing at a time, and then try to apply them together. Trying to learn an entire subject all at once before moving onto another subject does not promote understanding, and it is much more tiring
A big benefit to taking a handful of courses simultaneously in school is that you have many opportunities to synthesize ideas. Some topics in calculus become clearer when you understand linear algebra, and vice versa
So if you are designing your own self study path, you can emulate that a little bit by alternating among subjects. maybe do a couple weeks of calculus just to get a solid understanding of derivatives, then a couple weeks of linear algebra, and then spend some time trying to apply this to the ML stuff you've already learned
It's also worth remembering that humans tend to learn best by "spaced repetition". Spending a chunk of time with the subject and then stepping away for a while allows it to settle in your brain, so to speak. Of course, if you jump around too quickly, you never learn anything at all. You'll have to find a balance that feels right
Note that I am not a professional educator and this is entirely my own opinion
I just recently came across this textbook online, I have only read the preface so far but it seems useful for someone like you https://www.mosaic-web.org/MOSAIC-Calculus/
I believe it's funded by some government grant, which is why it's free
coral ledge
desert oar
So if you are designing your own self study path, you can emulate that a little ...
I really like this appraoch. It would be similar to creating my own "university" consisting of various subjects and different learning timing for it. I have been guilty of completely engrossed in a particular topic/subject and getting burnt out and finding it difficult to get back learning. I would try this altering of subjects method
coral ledge
desert oar
Note that I am not a professional educator and this is entirely my own opinion
I understand
@desert oar
I thank you once again for your guidance.
serene scaffold
@desert oar wb 
desert oar
coral ledge
<@389497659087650836>
I thank you once again for your guidance.
Good luck and hopefully this works out for you
 fleet nexus
Hi everyone I'm working on an API with FastAPI, and I was wondering if anyone help me deploy it on the Google Cloud Platform.
The API creates AI-generated scannable QR codes. If your interested in being part of the project LMK
 marsh kiln
@left tartan bro do u know all about ml and know how to convert pdf and image convert into json
left tartan
marsh kiln
<@738234281146712084> bro do u know all about ml and know how to convert pdf and...
I certainly don't know all, or even much at all. For reading PDF, look at pypdf2. I don't do much/anything with images.
 twin valve
im making a model to detect diseases in plants for a school project
ran into some errors
cant upload the txt file of errors here
can someone help me
if so, dm me
mild dirge
!paste @twin valve
arctic wedgeBOT
Pasting large amounts of code
If your code is too long to fit in a codeblock in Discord, you can paste your code here:
https://paste.pythondiscord.com/
After pasting your code, save it by clicking the floppy disk icon in the top right, or by typing ctrl + S. After doing that, the URL should change. Copy the URL and post it here so others can see it.
past meteor
The Python version of the GOAT ml book dropped: https://www.statlearning.com/
An Introduction to Statistical Learning
Definitely worht putting in your reading list if you're getting started out 🙂
 iron widget
Can someone help me make a snake ai using neat and look at my code? I can't seem to get it to work (I'm quite a beginner)
 sacred raven
iron widget
Can someone help me make a snake ai using neat and look at my code? I can't seem...
sacred raven
iron widget
Can someone help me make a snake ai using neat and look at my code? I can't seem...
dunno neat but send the code
also anyone of yall know like any good datasets for a chatbot ? like im building a chatbot i have the structure it learns but now i just need da data.
 dusty valve
I remember seeing a 250 gig dataset of every public reddit comment available, lemme see if i can find it

reddit
1,038 votes and 240 comments so far on Reddit
I dunno if you would want this much tho
 verbal venture
I'm training a GAN, with 200k images. I have a medium complex model. It fails to improve the loss functions after the third iteration fo the first epoch. What should I change? I tried different learning rates, and batch sizes, but it made no difference. I can't change the dataset
hasty mountain
verbal venture
I'm training a GAN, with 200k images. I have a medium complex model. It fails to...
What happens to the loss after the third iteration? It keeps constant?
verbal venture
Yes!
hasty mountain
verbal venture
Yes!
Hm... strange... You're using keras, right? So applying gradients shouldn't be a problem if you managed to apply iteration to discriminator and then to generator and discriminator again.
The problem is that you're probably monitoring the loss of just one of the models... Which model is providing you with the loss? What is the loss you're using?
If the loss is the discriminator loss, then I suppose the loss is gets lower and lower until it stabilizes at a low value. If the loss is the generator loss, then it's strange, but it may happen that your models aren't converging. But if you've tried different learning rates and batch sizes...it should've fixed it...
If the discriminator loss would get lower and lower and stabilize at a low value, the generator should get a loss that would increase constantly
errant spear
Would anyone be able to explain how an LSTM model works? As an example, let’s say you’re trying to predict the price of a stock the next day based on 30 previous days of closing prices, open prices, highs, lows, and the trading volume, how would you go about doing it? I’m slightly confused as to what the difference is between a single unit in an LSTM, and a single layer. I also don’t understand how you would feed the training data into the model.
past meteor
errant spear
Would anyone be able to explain how an LSTM model works? As an example, let’s sa...
Do you understand vanilla RNN's fully because I'd start there if you don't
RNNs typically model the hidden state as a non-linear function of the previous hidden state and the input. The hidden state is then used to predict the output at time T.
There's weight sharing, which basically means you do this entire procedure in a for-loop with the same weights. You start at day t-30 and set the previous hidden state to for example 0, then you use the input weights and the weights of the prev hidden state to determine the hidden state at t-30, this you use to make a prediction. Then you move to the next position in the loop and you repeat. You keep repeating this until you reach time = t. You essentially end up making 30 predictions but you may only care about the last one depending on your application
LSTMs are specifically designed to solve issues that vanilla RNNs may (or may not) have for your problem so I suggest you start there 🙂
errant spear
past meteor
RNNs typically model the hidden state as a non-linear function of the previous h...
This may sound stupid, but how do you initialise the weights?
And also, in an LSTM, what do you set the previous cell state to in the first unit?
Also, what exactly is a bias? Is it any different to a weight?
serene scaffold
errant spear
This may sound stupid, but how do you initialise the weights?
depends on what library you're using, but it's probably not something you have to explicitly do.
if you're new to ML, I would not start with neural networks. I would start with something that's more explicitly statistical, so that you can become more familiar with the general concepts
like what "data" is in the context of ML, what features are, what different kinds of features are, the difference between X and y, etc.
errant spear
serene scaffold
like what "data" is in the context of ML, what features are, what different kind...
Ah, I see. The only reason I am doing this is because I hoped to do my school research project on how effective LSTM’s are at predicting the prices of stocks. Since, based on background research, I presumed other models weren’t as effective for this, as RNN’s are designed to handle sequential data, I assumed a good place to start would be to firstly understand how RNN’s actually work.
serene scaffold
errant spear
Ah, I see. The only reason I am doing this is because I hoped to do my school re...
if you're part of a project, then I guess you should use whatever the project is using.
anyway, neural networks can be thought of as having layers. basic neural networks are "feed forward", which just means that as data moves through the network, there's no way for it to get back for layers it has already been to.
whereas in recurrent neural networks, data can revisit layers it has already visited before being outputted.
errant spear
serene scaffold
whereas in recurrent neural networks, data can revisit layers it has already vis...
This may be unreasonable, but is it possible to provide an example of how data would move through the network to make a prediction?
I’m not sure if it would be better to make it a classification model, like classifying if the stock will go up, down, or stay the same, but I would’ve thought regression would be more appropriate. How does this work inside an RNN?
 merry ridge
The more common way you would use something like a neural network for stock prices is to start with some stochastic differential equation and treat your volatility and other parameters are unknowns to be fit. At the end of the day the movement itself is still powered by a brownian motion.
sacred raven
dusty valve
I remember seeing a 250 gig dataset of every public reddit comment available, le...
thtas incredible. i would need to actually free up some space currrently i have. fuck 400mb left 💀
sacred raven
well the thing is im building a chatbot go simple structure input output pairs but my data is not enough i just need some dataset that has input output pairs and nothing else because im too lazy to actually modify my code to support anything else than input output pairs. so if anyone maybe has a good dataset maybe i could use it.
 fallow leaf
Where can I ask Excel questions?
serene scaffold
fallow leaf
Where can I ask Excel questions?
Only in the off topic channels
Unless you're asking about pandas or openpyxl
 dapper hollow
Hey,
I want to make an AI with tensorflow that turns ascii Art to normal Text. I am quite new to AI so I wanted to ask how to start this off.
I have a Dataset like this
dataset/:
-> ABDT.txt
-> DECTB.txt
-> DVXXDLE.txt
-> ACDFLE.txt
and inside ACDFLE.txt for example is the ascii art. In this case it looks like this:
  __ _     ___        _     __    _     ___
 / _` |   / __|    __| |   / _|  | |   / _ \
| (_| |  | (__    / _` |  | |_   | |  |  __/
 \__,_|   \___|  | (_| |  |  _|  | |   \___|
                  \__,_|  |_|    |_|
@dapper hollow for each ASCII "font", is it always possible separate letters with vertical whitespace?
dapper hollow
serene scaffold
<@1115326727099527168> for each ASCII "font", is it always possible separate let...
You mean if I could seperate them vertically?
 pine wolf
serene scaffold
<@1115326727099527168> for each ASCII "font", is it always possible separate let...
pine wolf
serene scaffold
<@1115326727099527168> for each ASCII "font", is it always possible separate let...
i don't know about this dataset, but with something produced by, say, figlets there's an option to "smush" characters so that they overlap
serene scaffold
dapper hollow
You mean if I could seperate them vertically?
for the example you gave, it's possible to draw vertical lines between each letter that completely separate them. if you can always completely separate the letters with vertical lines, and just train the model on letters, that makes the problem easier than having to consider whole words at a time.
dapper hollow
well on an imagine you could but in whitescpacec / text form you coudlt. Som Characters are 6 some 5 some 4 and some 3 wide
mostly 5
mild dirge
You could still find out where all lines have a space in the same x-coordinate
Which at least allows you to separate the letters
@dapper hollow
 boreal gale
i think it's worth clarifying whether you want to treat this as a text problem or an image problem. (edit: this was a comment for OP in case it wasn't clear)
mild dirge
It's a text problem I think, but could always convert to image if that makes it easier
But the data is in text form
mild dirge
Evenly?
Why do the characters all need to be same width?
Rnns/transformers work on strings of multiple lengths, and images can be resized
 hot tangle
Hello! It is possible to build an AI model that predicts the value (in some kind of currency) of x based on its age and popularity, (all of them are integers). However, if the output (currency) is restricted to 8 specific values (its because my dataset only has 8 values (prices)), the AI model will only be able to predict one of those 8 values. In other words, the model won't be able to generate arbitrary values beyond the predefined set. Is it possible to make it generate those arbitrary values, because right now if something is super expensive the model would still categorize it with slightly less expensive item making them worth equal price which is not the case.
dapper hollow
mild dirge
Rnns/transformers work on strings of multiple lengths, and images can be resized
Well if not evenly there is no garuntee every letter always looks the same.
It can range from 4-8 letters so I think it would have to be evenly especially if u want to compare it in a Map
marsh kiln
left tartan
I certainly don't know all, or even much at all. For reading PDF, look at pypdf2...
i try but it not work properly
left tartan
If pypdf2 isn't working, maybe open a help thread? Probably not really appropriate here, but I've used it and it works fine for my needs. @marsh kiln
 raw compass
How would you guys train a model on a python library? so like that model would be able to answer questions such as "show me how to draw a circle by using ... library"
dapper hollow
mild dirge
Rnns/transformers work on strings of multiple lengths, and images can be resized
Images I agreee that would most likely work but this way. I also noticed that it isnt even spaced apart like in the example I gave
 limpid cloud
Hey folks! Im working on a problem using the sklearn package and ive built a column transformer as follows
runtime_pipeline = Pipeline([
    ('runtime_impute',SimpleImputer(strategy='constant',fill_value=120.0)),
    ('runtime_scale',MinMaxScaler())
])

aud_score_pipeline = Pipeline([
    ('aud_impute',SimpleImputer(strategy='mean')),
    ('aud_scale',MinMaxScaler())
])

class MyLabelBinarizer(TransformerMixin):
    def __init__(self, *args, **kwargs):
        self.encoder = MultiLabelBinarizer(*args, **kwargs)
    def fit(self, x, y=0):
        self.encoder.fit(x)
        return self
    def transform(self, x, y=0):
        return new
    def get_params(self,deep=True):
        return self.encoder.get_params(deep=deep)

mlb = MyLabelBinarizer()

preprocessor = ColumnTransformer([
    ('runtime_pipe',runtime_pipeline,['runtimeMinutes']),
    ('aud_pipe',aud_score_pipeline,['audienceScore']),

    ('ohe', OneHotEncoder(sparse_output=False), ['isTopCritic','isRestricted']),
    ('target_enc',TargetEncoder(),['movieid',
                                   'director']),
    ('genre_pipe',mlb,['genre'])
])
Now the issue here is that when I try to call fit_transform() on this columntransformer I get the error
I have some ideas as to what might be going on but does anyone know the actual reason?
I think the problem here is the TransformerMixin class that implements MultiLabelBinarizer since its transformation returns an array of shape (1,4) but If thats the case, I dont know how I can solve this
lapis sequoia
hey guys if anybody is interested in contrubuting in a federated learning framework, that has just been released, please DM to provide furthe info on the project!
civic elm
I just made a linear regression script in python. Yay me!
finally understood forward propagation
I think somehow my brain always pictures a 3x3 matrix
now onto eigenvectors and pca
sal khan is the goat
sacred raven
i have this problem with tensorflow. i made a cahtbot got some data and its a lot to crunch so i tried to use gpu instead of cpu and idk why but it isnt working i installed the cuda thing pasted the things inside and it didnt work. updated to the version double checked if i have compatible versions but i have no clue what is wrong. neither do i know what to do so i am asking if anyone has a clue on how to fix this
serene scaffold
sacred raven
i have this problem with tensorflow. i made a cahtbot got some data and its a lo...
When asking for help, it's good to just never say that something "didn't work". If you got an error message, show the whole error message. Otherwise, explain what happens that wasn't what you expected.
sacred raven
serene scaffold
When asking for help, it's good to just never say that something "didn't work". ...
didnt have time to write everything
i know how it is just dont have time
ill try to get the error msg
lapis sequoia
How can realtime audio processing help me with making a realtime voice assistant? (Voice to text).
sacred raven
serene scaffold
When asking for help, it's good to just never say that something "didn't work". ...
cant get the exact same error
cuz different script technically
and i dont remember how i had it
wait tf 2.1.0 i see that tf-gpu is depricated and i should use tf 2.1.0
ill try it with that
ah this is the right one
serene scaffold
sacred raven
ill try to get the error msg
if you don't have time to ask your question in a way that people can start answering it, you should probably wait until you're more available. it's also important that when you ask for help, you're ready to actively receive that help.