It depends on if you are comparing the movies as individual movies or series. Since it looks like you are looking at collections I'd use sum of revenue as that compares all the collections and states that the avengers collection performed best. However, if you want to argue/understand which series had better performing individual movies you would take the mean because that tells you that on average each movie performed better. With that in mind it's possible that the sum is higher because one or two of the Harry Potter movies performed really well with the others falling short (hence the averengers performing better on average). What are you trying to understand from the data here?
#data-science-and-ml
1 messages · Page 70 of 1
 junior rain
 cold osprey
more movies = larger sum
a collection with 2 movies will underperform one with 4 movies assuming all else equal
junior rain
lol that's the simple way to look at it. I overexplained my bad. I totally forgot that there's twice as many harry potter movies as avengers. look at @cold osprey response.
 latent tundra
Is it true that OpenAI gym, tensorflow environments and similar are just different representations of Markov Decision Processes. Are there any major advantages to using one over the other?
 past meteor
latent tundra
Is it true that OpenAI gym, tensorflow environments and similar are just differe...
past meteor
latent tundra
Is it true that OpenAI gym, tensorflow environments and similar are just differe...
An MDP is an MDP, regardless of the software you use for it.
It could be that the same problem was made into a gym and then tensorflow environment and it has slightly different features though but that's more related to the implementation and not inherent to gym vs tf
latent tundra
ok, thx for clarifying
 cerulean kayak
So most or at least alot of you guys who do Data-science here are like "Death destroyer of worlds" for Data/just gods of Data, so I'd like to ask you guys a subjective question about how things go from your experience.
How often do you think I should use snippits? Because at the moment, I basically make 4-5 snippets per topic that I learn in Data Science. I am wondering if you guys think this will lead to me using it too much as a crutch?
at me if you got anything
 sleek harbor
so.. I read this thing, not very attentively cus I'm tired and bout to hit the bed. But I think that's.. not what I was talking about, at all. When I said "cross validating sequential feature selection" what I meant was sklearns SequentialFeatureSelector. As far as I understood, in the article, the technique they were on about was just using a statistical test, such as correlation or t-tests or whatever (I didn't catch what they actually used), and just taking "steps" in the direction from most important to less.. and with no CV 💀.. yeah, that could definitely go wrong in many ways. Also the article kept on saying how "computationally efficient" stepwise is, which made me confused at first, cus sklearns SFS is not computationally efficient. Basically, theses are different approaches. Sk's version (not even sure you can call it a version of the same thing, considering how different they are) is: "At each stage, this estimator chooses the best feature to add or remove based on the cross-validation score of an estimator", so it does separate CVs for adding (or removing) each feature at each stage.. so "For example in backward selection, the iteration going from m features to m - 1 features using k-fold cross-validation requires fitting m * k models".. that is so not comp efficient, and is very different than stepwise which uses a stat test as the criteria. So these two are very different things, as far as I see it. I didn't even know about stepwise, it seems. I don't think what is said in the article applies to sequential selection in sk's implementation.
In addition to that, not that I intend to use stepwise, but theoretically, I think most of what was said there was about a naive implementation that could be improved.
Simply say, do cv and store the resulting "best" features, then discard the features that only appear in few fold (or only select those that are selected in most/all folds), do repeated cv instead of normal and most of their arguments would go down the drain, or so I think. At least that would be significantly better than just the naive algorithm.
I can see what they mean by finding coincidentally good features which are meaningless, but saying that data mining based on statistics without theory is absolutely useless (which is what it sounds like they're saying to me) is, imo, wrong.
"Data mining goes in the other direction, analyzing data without being motivated or encumbered by preconceived theories. Data-mining algorithms are programmed to look for trends, correlations, and other patterns in data. When an interesting pattern is found, the researcher may argue that the data speak for themselves and that is all that needs to be said. We don’t need theories-data are sufficient. In addition to those who believe that theories are unnecessary, some believe that data should be used to discover new theories." - I honestly don't see anything wrong with that, as long as the data is properly handled. Statistics don't lie, it's just that sometimes things are misinterpreted or simply done wrong. Kinda strayed off of the topic of stepwise and feature selection.. 😅
All that said, I actually plan on using permutation importance + a threshold (which I'll tune) for feature selection, cus.. that's relatively computationally efficient and I have no patience for smth like SFS. Thoughts on this?
Anyway, I sleep now 😴
that was a reply to this, discord never does what I tell it to..
 dire violet
how do i clean a csv dataset? is there any tips or tricks because it seems practically impossible to do by hand
 lusty lotus
I am working on a chess AI which is trained on chess games where the AI learns from "moments" of the game by selecting a random state of the board and predict whether it will win or not, given move turn. This is helpful to creating the evaluation function for my chess AI. It works but I want to have as good as an evaluation engine as possible.
Attempts At Solving:
i have read online that adding optimisers and L1 and L2 can help convergence speed
i have also read that more epochs can also help sometimes
i have batchnorm1d, i heard it also improves performance
i was advised to use tanh(x/200)
in addition, I also have some questions in hyperparameter tuning:
i want to use hyperparameter tuning to find the optimum sets of hyperparameters for my training but i want to avoid grid search since i want more flexibility in the params and too many params would take too long to experiment with
how can i implement genetic approach? how useful/quick will that be if i have rapid iterations
how about like "gradient adjustments"? like say if the MSE error decreases too quickly then adjust the lr or smth?
I'm still a beginner so i don't fully get how things work
Code for training loop:
https://pastebin.com/uNC8SzpT
NN architecture:
https://pastebin.com/5LzUxcaC
 rose dagger
I have trained a model on a small dataset a few times and it seems that it sometimes gets very good results with fast decaying loss and sometimes it is pretty much stagnant / doesn't improve much and the results are very poor. In all training attempts i have kept the model and hyperparameters the same.
To me, this seems to suggest that the training is very sensitive to certain random components of the training process, e.g. a random initialization of the weights. What can i do to make the training "more robust" i.e. get more consistent results?
 small wedge
rose dagger
I have trained a model on a small dataset a few times and it seems that it somet...
small wedge
rose dagger
I have trained a model on a small dataset a few times and it seems that it somet...
can you list out the hyperparameters/optimizer/network architecture you are using? there could be lots of things that would influence this process.
lusty lotus
lusty lotus
I am working on a chess AI which is trained on chess games where the AI learns f...
can anyone help me with this? thanks
 white flint
is it possible for me to perform deep image searches on online github directories?
cerulean kayak
dire violet
how do i clean a csv dataset? is there any tips or tricks because it seems pract...
1). Fill null values with average of the column (only works on continious varibles)
Ex: assume dataframe df has 100 values that are null in column "Score",
lam=int(df['Score'].mean())
df['Score']=df['Score'].apply(lambda Score : lam if pd.isnull(Score) else Score)
2). df.dropna values if there are very few null values in a column
3). df.drop the entire column if there are so many missing valuesw it's unsalvagable.
 agile cobalt
cerulean kayak
1). Fill null values with average of the column (only works on continious varibl...
agile cobalt
cerulean kayak
1). Fill null values with average of the column (only works on continious varibl...
you should avoid using apply whenever there are alternatives, not only is it hundreds of times slower than built in methods, it is also easier for you to introduce bugs with it than just calling the existing methods.
For example, df['Score'] = df['Score'].fillna(lam) instead of that apply()
agile cobalt
dire violet
how do i clean a csv dataset? is there any tips or tricks because it seems pract...
filling in missing values (be it with 0, with the mean, with some other fixed value, or even joining with another dataset) or dropping them can make sense in general, but what exactly to do varies case-by-case.
You must understand what exactly you are working with, what it means for the data to be the way it is, and why is it that way. After that you should be able to determine whenever makes the most sense to do.
overall, information is worthless without context about it.
it's that context which tells you what you can use that information for, and up for you to determine how to use it in that context
cerulean kayak
agile cobalt
you should avoid using `apply` whenever there are alternatives, not only is it h...
it is also easier for you to introduce bugs with it than just calling the existing methods.
Can you eloberate on that? Any refrences of articles or somthing of that nature would be appreciated.
agile cobalt
there are a few dozens of different ways to check if something is NA-ish
you could easily use an incorrect one if you tried to write it yourself instead of just using fillna() there
e.g., if you used == np.nan instead of pd.isnull, it wouldn't work as expected
 serene scaffold
agile cobalt
e.g., if you used `== np.nan` instead of `pd.isnull`, it wouldn't work as expect...
serene scaffold
agile cobalt
e.g., if you used `== np.nan` instead of `pd.isnull`, it wouldn't work as expect...

 gaunt lotus
hey
past meteor
sleek harbor
so.. I read this thing, not very attentively cus I'm tired and bout to hit the b...
SFS is a better stepwise. It's more robust but it's indeed computationally inerficient. I wouldn't trust forwards selection at all either.
past meteor
sleek harbor
Simply say, do cv and store the resulting "best" features, then discard the feat...
"as long as the data is properly handled statistics doesn't lie" is why there's so much de facto multiple testing, if you use your test set more than once it's technically already MT
past meteor
sleek harbor
Simply say, do cv and store the resulting "best" features, then discard the feat...
Last but not least, idk why you're so bothered about feature selection in the first place - just use regularization.
For tree based algos you can also just use cost complexity tuning: https://scikit-learn.org/stable/auto_examples/tree/plot_cost_complexity_pruning.html together with the method I spoke about (adding 2 noise features and removing everything around the noise)

scikit-learn
The DecisionTreeClassifier provides parameters such as min_samples_leaf and max_depth to prevent a tree from overfiting. Cost complexity pruning provides another option to control the size of a tre...
 dusk tide
junior rain
It depends on if you are comparing the movies as individual movies or series. Si...
dusk tide
junior rain
It depends on if you are comparing the movies as individual movies or series. Si...
I was practicing EDA on movies dataset. I had a confusion that even Harry Potter movies has 8 movies , it's mean revenue is less than **The Avengers **so I was not able to understand that whether Harry Potter was more successful than avengers or not. If we talk about mean then we talk about a single movie in the collection??
past meteor
Where I use feature selection at work is that we had 3 data sources in our clinical trial with several features each. If we find out that one source in its totality is redundant that'd be great as it reduces the real world cost of our model.
I typically just make my models "simpler" for most models that's regularization, for most decision trees that's cost complexity pruning and for gradient boosting it's reducing the number of estimators, all with cross validation. All of them require tuning not more than 3 hyperparameters or so. Finally I look at the feature importance and it's a wrap.
 slate patio
I'm taking a course in ai and one exam prep question was something like this:
Why can you implement Bayes Decision Rule (Bayes Classifier) only by using the likelihood and prior?
The answer to that question was:
Since the evidence is class independent it can be ignored in the decision rule (which optimizes over all classes):
I'm sorry to ask such a basic question, but I'm really confused by that?
I see why we could ignore the classes when setting a decision boundary (as seen in the screenshot), but I don't see how this applies to the decision rule in general?

 wooden sail
slate patio
I'm taking a course in ai and one exam prep question was something like this:
Wh...
wooden sail
slate patio
I'm taking a course in ai and one exam prep question was something like this:
Wh...
the idea is that we look at the probability of the class being w_k given x, and this involves the probability of observing x independently of the class, i.e. the marginal distribution of x after integrating over all the classes. this value is different for each observed value of x, but independent of the class, so it does not affect the optimization problem where we look for the class of x
 iron basalt
slate patio
I'm taking a course in ai and one exam prep question was something like this:
Wh...
iron basalt
slate patio
I'm taking a course in ai and one exam prep question was something like this:
Wh...

In statistics, naive Bayes classifiers are a family of simple "probabilistic classifiers" based on applying Bayes' theorem with strong (naive) independence assumptions between the features (see Bayes classifier). They are among the simplest Bayesian network models, but coupled with kernel density estimation, they can achieve high accuracy levels...
slate patio
Thanks you two 😄
I feel like edd's explanation helped already, but I still have a superficial understanding on what this actually means (I get it in mathematical terms, but it "didnt sink in")
I'll look into the link asap squiggle 🙂
iron basalt
slate patio
Thanks you two 😄
I feel like edd's explanation helped already, but I still hav...
A simple way to look at it. I am trying to classify if some text is spam or not spam. I compute some value for how "spammy" it is and how "not spammy" it is (an estimation). Bigger value means it's more like that. Now if I want to decide if it's spam, I can simply choose the one with the bigger value. If during the computation of these two values I divide them both by the same positive value, my decision does not change.
(It's about the relative values)
If I did not care about which is bigger and/or wanted actual probability values, then I would care about the divisor.
slate patio
iron basalt
If I did not care about which is bigger and/or wanted actual probability values,...
thanks that helps a lot! also the wikipedia article is very well written
Edit: Also your explanation was super intuitive, so I think I got it now 🙂
dusk tide
I am working on movies dataset. I am practicing data cleaning. I have used Knn , Iterative , Median/Mean imputation techniques but the** standard deviation of my revenue column**( which had 85% missing values ) is changing drastically before and after doing imputation(before-146149230.48676416)and (after-61660105.86339897) . I need this column and cannot drop this. What should be done ??
cold osprey
dusk tide
I am working on movies dataset. I am practicing data cleaning. I have used **Knn...
Why is a high standard deviation 'bad' ?
dusk tide
cold osprey
Why is a high standard deviation 'bad' ?
what i mean is that the standard deviation is changing drastically. which should not happen
cold osprey
Why? Or why not
dusk tide
cold osprey
Why? Or why not
I read online on blogs and also many people also told this. The distribution should not change/distort while doing imputation . You can look this is happening . Their is distortion in the distribution. What should be done??

The left one is after imputation , the right is before impuatation . After every imputation technique, the kde plot is coming same as see on left side.
 young pewter
could someone explain this error to me
 dusk tide
young pewter
could someone explain this error to me
dusk tide
young pewter
could someone explain this error to me
I think it should be train.columns
young pewter
u mean without parenthesis?
ah ic tysm
also could someone explain this error to me as well
 dusk tide
young pewter
also could someone explain this error to me as well
dusk tide
young pewter
also could someone explain this error to me as well
try removing **numeric_only **parameter.
young pewter
still get same error
ik removing annot changes nothing but removing annot also changes nothing
dusk tide
young pewter
still get same error

Stack Overflow
i'm new to python and machine learning and try to learn the subject , i'm following an online course ,
i have imported a dataset in jupyter notebook and try to execute following python script on i...
young pewter
dusk tide
https://stackoverflow.com/questions/49680331/typeerror-dataframe-object-is-not-c...
sry but solutions there didnt really help much
lemme lock back further into my code
young pewter
anybody here did the spaceship titanic kaggle competition??
 hasty mountain
Hey guys, I wanted to have a metric to give me an idea whether or not my neural network is still being optimized or not.
I know that, it may happen that, due to gradient descent, my model may have its gradients optimizing it towards an optimal point A for batch Alpha. After an interation with batch Beta, however, my model may be optimized towards an optimal point B, which is optimal for batch Beta.
If my model is able to be optimized, the next iteration with batch Alpha will make the model be optimized towards a point that is not A, then the next iteration with batch Beta will make the model be optimized towards a point that is not B. However, if my model has reached its peak of performance, the next iteration with Alpha will move it back to point A, and the next with Beta will move it to B, and so on.
So, would it be a good idea to simply sum over the mean of all the gradients of the previous epoch in order to have this metric? I was thinking that this metric would be like: the closer it is to 0, the closer the model is to a local/global optima.
PS: Yes, I know that the batch must be shuffled partly in order to avoid this problem. I'm just illustrating my idea.
 lapis sequoia
young pewter
anybody here did the spaceship titanic kaggle competition??
lapis sequoia
young pewter
anybody here did the spaceship titanic kaggle competition??
I did spend some time on it, what do you need help with?
young pewter
lapis sequoia
I did spend some time on it, what do you need help with?

finding how that makes sense
i dropped the Cabin column for X_train, but then cabin reappears
oh wait i figured it out
young pewter
lapis sequoia
I did spend some time on it, what do you need help with?
did you get a chance to submit your models?
lapis sequoia
young pewter
i dropped the `Cabin` column for X_train, but then cabin reappears
probably you dropped Cabin feature at initial stage & defined X_train, but later you used x, y for train_test_split, which have Cabin column. drop the column from x as well
young pewter
lapis sequoia
probably you dropped Cabin feature at initial stage & defined X_train, but later...
yep it was that I defined X_train and y_train instead of defining X and y
ty for help :)
young pewter
btw could you explain this error to me?
 lapis sequoia
young pewter
did you get a chance to submit your models?
lapis sequoia
young pewter
did you get a chance to submit your models?
No, It's tutorial competition. I was planning to publish a starter notebook, but many KGMs already did so I gave up.
lapis sequoia
young pewter
btw could you explain this error to me?
https://scikit-learn.org/stable/modules/generated/sklearn.metrics.confusion_matrix.html you will need to provide predictions in binary form too in order to get confusion metrics.
scikit-learn
Examples using sklearn.metrics.confusion_matrix: Visualizations with Display Objects Visualizations with Display Objects Label Propagation digits active learning Label Propagation digits active lea...
young pewter
binary as in 0s and 1s?
lapis sequoia
young pewter
binary as in 0s and 1s?
yess
young pewter
these are my prediction results how would I convert those int 0s and 1s?
 lapis sequoia
young pewter
binary as in 0s and 1s?
lapis sequoia
young pewter
binary as in 0s and 1s?
either apply a threshold on predictions, or simply use .round()
 undone wadi
how do you make the text not overlap?
 young pewter
lapis sequoia
either apply a threshold on predictions, or simply use .round()
young pewter
lapis sequoia
either apply a threshold on predictions, or simply use .round()
wym a threshold?
lapis sequoia
Seems like your predictions are in logits, apply sigmoid function and then round off the array to 0-1
young pewter
undone wadi
how do you make the text not overlap?
try changing the aspect?
like aspect = 2?
young pewter
lapis sequoia
Seems like your predictions are in logits, apply sigmoid function and then round...
so log reg?
lapis sequoia
threshold = 0.5
sigmoid_preds = 1 / (1 + np.exp(-predictions))
binary_preds = np.where(sigmoid_preds > threshold, 1, 0)
young pewter
lapis sequoia
threshold = 0.5
sigmoid_preds = 1 / (1 + np.exp(-predictions))
binary_preds = np...
could you reword that into simpler terms?
sorry im just bad at understanding
lapis sequoia
undone wadi
how do you make the text not overlap?
probably rotate the x-axis labels with an angle.
plt.xticks(rotation=90)
Hello, i have a question. is possible connect local maxima between their with a line in python? for instance i have a value (154) and i want to connect it with the nighboour considering the trend of values with a line and interrupt the line when there is a new trend ( for instance from decrasing is passing to increasing). I have no expericne with coding unfortunately...
lapis sequoia
young pewter
could you reword that into simpler terms?
Looking at the predictions plot of yours, it seems values are ranging from -1 to 3.x, so I concluded those could be the raw logits. To convert them in probability score, we apply sigmoid function, values will then be transformed to range 0-1. Then we can either apply a threshold, lets say 0.5, above which scores will get rounded off to 1 else 0.
undone wadi
lapis sequoia
probably rotate the x-axis labels with an angle.
plt.xticks(rotation=90)
thx it's worked
lapis sequoia
undone wadi
thx it's worked

lapis sequoia
lapis sequoia
Hello, i have a question. is possible connect local maxima between their with a ...
so basically you have 1 dimensional array and you want to point out local maximas on a plot and connect with a line?
lapis sequoia
Hello, I have a problem with chunking, langchain, embeddings:
I have a directory of documents with 200 docx files, will increase to 15 lac eventually.
They are converted to a list of paragraphs, using the python-docx.
Then they are converted to embeddings and stored in a csv. (paragraphs, embeddings, metadata)
Then I am getting the results by the similarity function.
Problems:
I have not yet applied chunking but I want to.
If i apply chunking and overlapping, It will give back similar results but they would be need to be re-processed by text davinci to make sense.
But I can't do that because I want the exact wordings from the docx files, not even re-phrased.
Code:
def write_to_csv(
    paragraphs: List[str],
    paragraph_embeddings: List[List[float]],
    filename_metadata: str,
    filename: str = "paragraphs.csv",
    mode: str = "w",
) -> bool:
    fieldnames = ["paragraph", "embedding", "metadata"]
    file_exists = os.path.isfile(filename)
    with open(filename, mode, newline="",encoding='utf-8') as csvfile:
        writer = csv.DictWriter(csvfile, fieldnames=fieldnames)
        if not file_exists or mode == "w":
            writer.writeheader()

        metadatas = [{"filename": filename_metadata} for _ in range(len(paragraphs))]
        for i in range(len(paragraphs)):
            embedding_str = (
                "[" + ",".join(str(x) for x in paragraph_embeddings[i]) + "]"
            )
            writer.writerow(
                {
                    "paragraph": paragraphs[i],
                    "embedding": embedding_str,
                    "metadata": json.dumps(metadatas[i]),
                }
            )
    return True

def read_from_csv(
    filename: str = "paragraphs.csv",
) -> Tuple[List[Tuple[str, List[float]]], List[dict]]:
    data = []
    metadata = []
    with open(filename, "r",encoding='utf-8') as csvfile:
        reader = csv.DictReader(csvfile)
        for row in reader:
            embedding = ast.literal_eval(row["embedding"])
            data.append((row["paragraph"], embedding))
            metadata.append(json.loads(row["metadata"]))
    return data, metadata
def main(query: str) -> List[dict]:
    """
    query: string
    description: query is the string that you want to search for in the csv.
    returns a list of dictionaries with the page content and the document name.
    """
    embeddings = OpenAIEmbeddings(openai_api_key=OPENAI_API_KEY)
    write_all_to_csv(embeddings=embeddings)
    text_embeddings_metadata = read_from_csv(filename="paragraphs.csv")
    knowledge_base = FAISS.from_embeddings(
        text_embeddings_metadata[0], embeddings, metadatas=text_embeddings_metadata[1]
    )
    similar_paragraphs = knowledge_base.similarity_search(query.strip())
    page_content_list = [
        {"content": x.page_content, "document_name": x.metadata["filename"]}
        for x in similar_paragraphs
        if len(x.page_content) > 50
    ]
    return page_content_list
my array is 3d, where each local maxima have a longitude and latitude. They are georeferenced data
Anyone who can add incremental learning for an AI program to make music by leanring midi?
https://github.com/Adrianxh/mozartcomposer <---Fully working AI model to feed it with midi files and get music output. Right now, I'm struggling to add support for polyphonic midi and incremental learning

GitHub
AI model to train midi. Contribute to Adrianxh/mozartcomposer development by creating an account on GitHub.
hasty mountain
Hey guys, as a matter of curiosity...what should I expect from a Variational AutoEncoder that is overfitting?
I've seen that, for a normal AutoEncoder, overfitting would be equal to the AE not being able to learn anything and simply become an identity function(rather than an approximation), so input = output.
However, should I also expect that for a VAE that is overfitting? I mean...VAEs have the regularization thing and some mathematical tricks, so maybe it could be a bit different.
Besides...it's kinda desirable that certain latent spaces to have similar patterns(i.e. points between [0.0235,0.02700] would return an image of a person wearing a hat, points between [0.071, 0.072] would return a bald person), so I got a bit confused
EDIT: I think I may have had an insight while re-reading this last part... A VAE should be able to properly allocate images with certain patterns into determined latent spaces, and images from that latent spaces will have those patterns...but they shouldn't be equal. So, an overfit VAE would be one that, for a certain latent space, would return the same image rather than similar ones?
I'm also remembering that...when I tried GANs where both the Discriminator and the Generator had learning rates that were too low (1e-8), the diversity of outputs would decrease severely 
 shadow viper
Good day everyone
Is it ok if I installed tensorflow in my CPU rather than GPU?
I tried installing it in my GPU but it has so many dependencies that's causing one error to another
The CPU is 16Gb ram, 2.90 GHz. It should be able to run basic tasks efficiently yh?
cold osprey
Proly will be slow
shadow viper
😭😭😭
cold osprey
Y not pytorch?
shadow viper
The GPU isn't all that really
Quadro M1200 Nvidia
4gb
serene scaffold
shadow viper
Is it ok if I installed tensorflow in my CPU rather than GPU?
I tried installing...
most modern model training will be prohibitively slow without GPU acceleration
at least the kind of model training that you'd be doing with tensorflow or pytorch
 tidal bough
The 4GB VRAM is pretty limiting, but for models small enough for that, the GPU will probably still be faster.
(to know for sure, install a gpu version, try some example model on CPU and GPU, and compare the times)
shadow viper
tidal bough
The 4GB VRAM is pretty limiting, but for models small enough for that, the GPU w...
Ok how can I install tensorflow properly without getting errors during importation
Or attribute errors along the way
cold osprey
Windows?
shadow viper
cold osprey
Windows?
Yes
cold osprey
Ull need WSL for the latest versions of tensorflow gpu
shadow viper
cold osprey
Ull need WSL for the latest versions of tensorflow gpu
What's WSL?
tidal bough
tensorflow is installed straightforwardly, via pip. though they dropped windows support recently, so you'll want something like python -m pip install "tensorflow<2.11" --upgrade --force-reinstall to get latest version that supports windows.
shadow viper
tidal bough
tensorflow is installed straightforwardly, via `pip`. though they dropped window...
I'm really really new to all these
How can do this with conda(anaconda)?
tidal bough
I don't use conda (or TF, for that matter), but I think it's something like conda install -c conda-forge tensorflow<2.11
shadow viper
tidal bough
I don't use conda (or TF, for that matter), but I think it's something like `con...
Thanks
shadow viper
tidal bough
I don't use conda (or TF, for that matter), but I think it's something like `con...
What do you use?
tidal bough
Pytorch installed via pip.
(if you decide to try pytorch, note that it specific installation instructions: https://pytorch.org/get-started/locally/)
hasty mountain
shadow viper
Is it ok if I installed tensorflow in my CPU rather than GPU?
I tried installing...
Personal experience advice: prefer to run complex processes (which includes neural networks in general) in your GPU.
If something goes wrong (a.k.a. the process is way more memory consuming than you expected), the worse thing that will happen is your Youtube videos crashing and you having to restart your browser and your projects.
In your CPU, if the same thing happens, your entire computer will get frozen and you'll be unable to do anything until that process finishes or some security break gets activated (which may lead you to having to force-restart your computer, which may lead to some catastrophes...)
shadow viper
tidal bough
Pytorch installed via `pip`.
(if you decide to try pytorch, note that it specifi...
Alright
Can I also use CNN on pytorch?
hasty mountain
shadow viper
Alright
Can I also use CNN on pytorch?
Yes. And it's a bit like in tensorflow...or even easier...
Just have to know how classes work
shadow viper
hasty mountain
Personal experience advice: prefer to run complex processes (which includes neur...
Yh... But the issue is tensorflow doesn't run properly
hasty mountain
Hm... I think tensorflow used to have separate versions for running on CPU and on GPU...
shadow viper
So many attribute errors
Numpy objects, tensorlike etc
shadow viper
hasty mountain
Hm... I think tensorflow used to have separate versions for running on CPU and o...
Yes... I installed the GPU but 2.3 was installed
hasty mountain
Oh, I see...
Well, I don't really use tensorflow, so...sorry.
But yes, you can do most things you do in tensorflow in Pytorch.
You just have to convert your numpy arrays to torch tensors
shadow viper
hasty mountain
You just have to convert your numpy arrays to torch tensors
It won't be bad to have knowledge of two libraries
 blazing viper
Why name it AGI if it’s not AGI
 long locust
!rule 6 - your message has been removed according to this rule. If you think this is a mistake please contact @sonic vapor
blazing viper
thank you kind moderator for getting rid of the bloat of ai apps
small wedge
blazing viper
Why name it AGI if it’s not AGI
the first rule of business - lie, lie, lie
 simple tapir
Why do you need sub-gradient descent at all? I've seen that subgradient descent is used where cost function is not differentable but how is it possible that cost function isnt differentable? Don't we also find the minimum value in a linear regression model, by derivating it without having sub-gradient used here?
 mint palm
any tips to follow if computer vision interview is tomm? assume its probably gonna be harder than average
 tranquil gust
Hello, Is there any one who have experienced with anthropic api?
sleek harbor
past meteor
Last but not least, idk why you're so bothered about feature selection in the fi...
oh I'm just bothered about everything at this point, as I don't really know what I should be focusing on. Since I have little to no idea how to do proper feature engineering, my plan was: add the reciprocal (multiplicative inverse) for all features, then do a 2nd degree polynomial transform with the purpose of taking care of non-linear features and feature interactions (including ratios) in one go. But that, in all likelihood, will add.. quite a bit of correlation among features, so.. thus my interest in feature selection and ways of dealing with multicollinearity :3
 sick ember
Hello, can anyone explain why we need to reshape an image or preprocess it before putting into CNN model?
serene scaffold
sick ember
Hello, can anyone explain why we need to reshape an image or preprocess it befor...
depends on what the model is intended to do, and what the images are like. but different model architectures will have different expectations for what the inputs will be
like, it might be required that every input image be exactly 60 by 60 pixels
sick ember
serene scaffold
depends on what the model is intended to do, and what the images are like. but d...
Ah I see thank you
sick ember
serene scaffold
like, it might be required that every input image be exactly 60 by 60 pixels
So what if we have something like(-1,IMG_SIZE, IMG_SIZE, 1)
Where IMG_SIZE=60
sick ember
serene scaffold
like, it might be required that every input image be exactly 60 by 60 pixels
Wait hold up where can you find the requirement though?
How do you know is 60 by 60
serene scaffold
sick ember
How do you know is 60 by 60
I don't. that's an arbitrary example.
do you have a link to the docs or tutorial that you're following?
sick ember
Yeah
Python Programming tutorials from beginner to advanced on a massive variety of topics. All video and text tutorials are free.
Why did he set IMG_SIZE to 50
Also the training model doesn’t really specifics IMG_SIZE need to be 50
sick ember
serene scaffold
I don't. that's an arbitrary example.
Also in the line
model.add(Conv2D(256, (3, 3)))
“3,3” is the dimensions of the convolutional filter?
lapis sequoia
sick ember
Also in the line
model.add(Conv2D(256, (3, 3)))
“3,3” is the dimensions of the...
Right.
lapis sequoia
sick ember
Why did he set IMG_SIZE to 50
probably he wanted to do quick experiment? There is no point of keeping image size that small for deep cnn networks.
sick ember
lapis sequoia
probably he wanted to do quick experiment? There is no point of keeping image si...
Thank you!
sick ember
lapis sequoia
probably he wanted to do quick experiment? There is no point of keeping image si...
How should I resize my sample if I’m doing signal instead of images? Say if we give amplitude per seconds
lapis sequoia
sick ember
How should I resize my sample if I’m doing signal instead of images? Say if we g...
the goal of resize in images is to scale the num of pixels high or low. for 1D signals, you may resample the data with tuning sampling rate. (can refer to librosa/scipy library for code)
we have two ways major ways to deal with signals, either use 1D convolution blocks or convert signals to mel spectrogram, treat them as images and use Deep 2D Cnn networks.
some augmentation strategy differs but basic preprocessing could be applied to spectrograms as well.
wooden sail
note that mel spectrograms are often used for audio, but not necessarily in other applications
cnns also enforce spatial invariance. depending on what you're doing, neither of these are a good pick. that's where your expertise in the area comes in
sick ember
lapis sequoia
we have two ways major ways to deal with signals, either use 1D convolution bloc...
1D convolution blocks? Where can I read more? How are the different from 2D?
wooden sail
they are different in that they are 1d 😛
the operation is largely the same. you can unfold any N-dimensional convolution into a 1-D one
the idea is the same: multiply elementwise with a filter/mask, then add up to obtain a scalar result. shift and repeat
lapis sequoia
sick ember
1D convolution blocks? Where can I read more? How are the different from 2D?
kernel slide over in just one dimension.
sick ember
lapis sequoia
kernel slide over in just one dimension.
Can you use 2D convolution in 1D data set like signal?
wooden sail
you can, but you're wasting resources. you have to choose some sort of padding because the signal is not defined along the 2nd axis other than at index 0
if you pad with zeros, it turns into a regular 1d conv and you're wasting time and resources
if you pad with something else, you have to ask yourself if you meant to do this in the first place
so the short answer is "that doesn't make sense in general"
sick ember
wooden sail
if you pad with zeros, it turns into a regular 1d conv and you're wasting time a...
I see, thank you!
lapis sequoia
One plus point of converting into 2D is you can use pretrained imagenet weights ig. but yeah as Edd mentioned, most signals data doesn't required to be converted into spectrograms.
wooden sail
the nicest (imo) way to think of convolutions is as the linear transformation applied by toeplitz matrices. N-D convolutions turn into n-level block-toeplitz matrices after flattening the data into a vector
dire violet
how do you know if a dataset needs to be cleaned? or do you just assume by default that all need to
sick ember
lapis sequoia
One plus point of converting into 2D is you can use pretrained imagenet weights ...
Converting them into 2D? You mean converting them into pictures with length and width?
iron basalt
hasty mountain
Hey guys, as a matter of curiosity...what should I expect from a Variational Aut...
Overfitting is still the same as usual, if it can get away with being the identity it will. VAE's prevent this more than a regular AE, but it's still a fundamental (mathematical) problem.
agile cobalt
dire violet
how do you know if a dataset needs to be cleaned? or do you just assume by defau...
kind of assume that need to, but it depends on where you are getting that data from.
you should always check for NAs, outliers and other weird values like dates outside of the range that should be possible
lapis sequoia
sick ember
Converting them into 2D? You mean converting them into pictures with length and ...
I meant mel spectrograms, raw signals --> Fourier Transform --> mel scale --> log, the output will be in 2D right showing image like characterstics.
iron basalt
iron basalt
Overfitting is still the same as usual, if it can get away with being the identi...
But unlike GANs you don't have this race between the two parts as well.
sick ember
lapis sequoia
I meant mel spectrograms, raw signals --> Fourier Transform --> mel scale --> lo...
I see thank you!
lapis sequoia
sick ember
I see thank you!
Usually prefer the 2D approach when time dimension is large enough.
dire violet
agile cobalt
kind of assume that need to, but it depends on where you are getting that data f...
i see, are there any libraries/tools that make cleaning a dataset easier?
agile cobalt
pandas / polars and alike 🤷
maybe Spark and such if it's too large to fit in memory
sick ember
lapis sequoia
I meant mel spectrograms, raw signals --> Fourier Transform --> mel scale --> lo...
If I decide to continue to work with raw signal, how should I reconfigure my sample reshape, In 2D like images, we have (-1,IMG_SIZE, IMG_SIZE, 1), would 1 D just be (1, -1, 1)?
past meteor
sleek harbor
oh I'm just bothered about everything at this point, as I don't really know what...
Make predictions, visualise residuals with respect to each feature and think of what new ones would be relevant
lapis sequoia
sick ember
If I decide to continue to work with raw signal, how should I reconfigure my sam...
assuming -1 is batch size and 1 is number of channels. will simply be (-1, len(raw signal), num channels)
sick ember
lapis sequoia
assuming -1 is batch size and 1 is number of channels. will simply be (-1, len(r...
I see thank you!
len(raw signal) is outputting number of data points?
lapis sequoia
sick ember
len(raw signal) is outputting number of data points?
yea, basically shape of signal, (time domain representation)
sick ember
lapis sequoia
yea, basically shape of signal, (time domain representation)
Thank you so much!!!
 terse frigate
Can anyone tell me how to work with NetCDF data
 lunar knoll
You guys use Jupyter? with Jupyter you can render graphs and data right? I want to display a 2d array in a html table basically. Is there a way to do that with Jupyter notebooks or whatever? Maybe I can just use an underlying rendering library?
I guess my question is "How dues Jupyter work?" Does it create a webserver that shows you a gui in a web app? What can I do with that API?
wooden sail
the plots are made with modules. jupyter just lets you organize the code as cells and show the plots those modules make in the same place
simple tapir
Can we use GridSearchCV() with Lasso/Ridge regressions as well as SVM?
 prisma knoll
hi, im getting SettingWithCopyWarning: A value is trying to be set on a copy of a slice from a DataFrame. Try using .loc[row_indexer,col_indexer] = value instead
for my code snippet here
df_final['sp_playstyles_avg'] = df_final['sp_playstyles_avg'].astype(str).apply(lambda x: hours(x)).astype(float)
 left tartan
lunar knoll
I guess my question is "How dues Jupyter work?" Does it create a webserver that ...
left tartan
lunar knoll
I guess my question is "How dues Jupyter work?" Does it create a webserver that ...
It’s a messy stack, but ultimately it’s web.
prisma knoll
any help would be appreicated!
 crimson cedar
I have some issue with Databricks, can someone help?
I have a Python file from my project that needs to read a function from another file in a different folder and I'm pulling my hair out trying to get it to work. Can someone please help?
I've tried putting in init.py files in both folders,
I've tried from project_folder.second_folder.second_file import the_function_i_need
And I've tried fiddling with path.append, but it always returns me the ModuleNotFound error.
If I do %run on the second_file.py it seems to work, but then it runs the whole file and I want just the function.
I also want to add that I'm trying to have the whole project in .py and have that codebase that's independent of Databricks structure (so no Jupyter notebooks or .SQL files)
Why isn't this working? Can someone advise?
Worst part is I had this issue about a month ago and suddenly it started working when I was brute forcing different solutions, but I cannot remember what it was
lunar knoll
crimson cedar
I have some issue with Databricks, can someone help?
I have a Python file from...
Once I had an issue with me being stupid and naming my script file the same as a standard library. The import statement then imported the pip library and not my own identically named file.
As far as I can recall, importing your own files is as simple as "import myfile.py". Seeing that you named your file "init", I'm thinking that's GOTTA be a name collision.
lapis sequoia
Hello, any AI expert here, please ping me :)
lunar knoll
Just tested the syntax for importing your own file in the same directory.
from myfilenamenoext import *
if you put in a subdirectory, the path seperator is dot for some reason.
left tartan
crimson cedar
I have some issue with Databricks, can someone help?
I have a Python file from...
Ar e the repos in your PythonPath?
crimson cedar
lunar knoll
As far as I can recall, importing your own files is as simple as "import myfile....
No I didn't name it init.py, I put an additional init file in it for Python to recognize the files in that subfolder as a module
crimson cedar
lunar knoll
if you put in a subdirectory, the path seperator is dot for some reason.
My file is actually in a folder parallel to my run file, so let's say:
Project/folder1/main.py
Project/folder2/import.py
I tried importing them with a dot from the project folder, so in the above case;
From Project.folder2.import import function
crimson cedar
left tartan
Ar e the repos in your PythonPath?
I'm not sure, as in the repo sits in the repo, but once it gets pushed to dev, it gets build and lands in the standard Databricks Workspace
And the imports will not work neither from the repo, nor from the Workspace
 crimson summit
Currently doing a course on reinforcement learning. It says the neural network randomly initializes the Q function. I am wondering how it is possible for the Q function to get slightly better each time if it is just a random initialization of y. When I was learning logistic regression it made sense how the weights and biases were adjusted as the network trained to give a output closer or equal to why but in this case y is just a guess. so i am not sure how that works ?
 past meteor
crimson summit
Currently doing a course on reinforcement learning. It says the neural network r...
past meteor
crimson summit
Currently doing a course on reinforcement learning. It says the neural network r...
Q is initialised randomly but it's updated as you go
Have you done regular Q learning before doing DQN? It's a very simple algo if you look at it in its original form
left tartan
crimson cedar
And the imports will not work neither from the repo, nor from the Workspace
Raise this question in a regular help, since it's really just a python/path issue (I think). Lots of people can help with it. See "how to get help" on how to open a help
crimson summit
past meteor
Have you done regular Q learning before doing DQN? It's a very simple algo if yo...
at the top of the picture it just says initialize NN randomly as a gues of Q(s,a)
past meteor
crimson summit
at the top of the picture it just says initialize NN randomly as a gues of Q(s,a...
Yeah you just randomly initialize your Q function. Your Q function is being approximated by the neural network
Can I just send you my implementation of regular Q-learning. It's really short and probably something you should write before doing DQN because it's an extension of the basic one
crimson summit
past meteor
Can I just send you my implementation of regular Q-learning. It's really short a...
ya sure
past meteor
https://paste.pythondiscord.com/xoxatebena I initialize Q as 0 which isn't good, it should be random but the rest is the same.
Given a state (S) you act (A) and get a reward (R) and a next state (Sp), you act again (Ap) and then you use the max operator for your update.
In my case Q is a table. In DQN Q is represented by a function approximator, aka a neural networks with weights.
crimson summit
past meteor
https://paste.pythondiscord.com/xoxatebena I initialize Q as 0 which isn't good,...
im just confused on how you can get a more accurate Q value when that is the target in the first place
sorry if I am sounding redundant
past meteor
It's not the target, it's just where you start off
And then while "looping" you slowly converge to a value
iron basalt
crimson summit
im just confused on how you can get a more accurate Q value when that is the tar...


Reinforcement Learning, second edition: An Introduction (Adaptive Computation and Machine Learning series)
crimson summit
iron basalt
thx ill check it out
iron basalt
crimson summit
thx ill check it out
Book by the people that invented it.
past meteor
Sutton & barto, good stuff, good stuff
That's what I read and that's where my own implementation came from
Gotta do regular Q learning before you do DQN because the book, and the algos, are simple
iron basalt
The book also has many other ideas that most (some are exploring it / have explored it) ML does not / has not made use of yet. But they are powerful and work well.
hasty mountain
It's only sad that the way they say how a Policy can be a optimizable model is so subtle...
At least I took a while to notice that...and only noticed it because I was reading someone else's code
iron basalt
Yeah you have to be willing to get there and then it all falls into place with NNs and all that.
New edition has added information on that too I think.
Yeah part 3.
Psychology, neuroscience, applications and case studies (e.g. AlphaGo), and frontiers.
crimson summit
iron basalt
Psychology, neuroscience, applications and case studies (e.g. AlphaGo), and fron...
Reinforcement Learning, second edition: An Introduction (Adaptive Computation and Machine Learning series)
is that this book ?
iron basalt
Yes.
 rare socket
Hello, could anyone suggest me a good pretrained model for instance segmentation?
hasty mountain
iron basalt
Yeah part 3.
Hm... I don't remember which part I've read... but it was a free pdf, so it may be an obsolete one
iron basalt
hasty mountain
Hm... I don't remember which part I've read... but it was a free pdf, so it may ...
It's in the online book link given by zestar75:
 hasty mountain
Oh...that wasn't in the one I've read. I remember there wasn't any illustrations there 
Or I didn't get it by the time...which is also likely
Yesterday I was re-reading the paper that made me want to dive deep into GANs addiction and I noticed that there was many things there that I didn't get by that time
Things that are quite...simple
 subtle knot
I have learnt and practiced the basics of numpy pandas matplotlib but I dont know how to learn further.How do I go to an intermediate or advanced level as rn I cant do much with my limited knowledge.Any resources or tips?
serene scaffold
subtle knot
I have learnt and practiced the basics of numpy pandas matplotlib but I dont kno...
if you're wanting to learn AI, keep in mind that AI is applied math, and you have to learn all the theoretical concepts as an entirely separate thing from programming. You cannot code your way to understanding AI.
that being the case, you should follow along with a textbook or course
 serene scaffold
 serene crater
going forward, please always show code as text, and not as a screenshot or as a camera picture.
You are not putting the color= values in quotes, so they are interpreted as comments.
serene crater
serene scaffold
going forward, please always show code as text, and not as a screenshot or as a ...
Ok got it thank you
 heady tusk
i am trying to make an ai anticheat using tensorflow, i know it may not be the fastest but i am doing it to learn how to make neural networks, but i am having major issues and am looking for some help, if anyone is willing to help me, please dm me. i have tried youtube videos and chat gpt for a couple hours now. heres my code:
import pandas as pd
import numpy as np
from sklearn.model_selection import train_test_split
from sklearn.preprocessing import MinMaxScaler
from tensorflow.keras.models import Sequential
from tensorflow.keras.layers import Dense

# Load the dataset
df = pd.read_csv("Legit_Data.csv")

# Preprocess the data
df["Falling"] = df["Falling"].map({"true": 1, "false": 0})
df["Jumping"] = df["Jumping"].map({"true": 1, "false": 0})
df["Cheating"] = df["Cheating"].map({"true": 1, "false": 0})

# Map additional columns
df["Magnitude"] = df["Magnitude"].astype(float)  # Assuming Magnitude is a numeric column
df["PosX"] = df["PosX"].astype(float)
df["PosY"] = df["PosY"].astype(float)
df["PosZ"] = df["PosZ"].astype(float)
df["Sitting"] = df["Sitting"].map({"true": 1, "false": 0})
df["VelocityX"] = df["VelocityX"].astype(float)
df["VelocityY"] = df["VelocityY"].astype(float)
df["VelocityZ"] = df["VelocityZ"].astype(float)

# Split the data into features (X) and labels (y)
X = df.drop("Cheating", axis=1)
y = df["Cheating"]

# Normalize the input features
scaler = MinMaxScaler()
X = scaler.fit_transform(X)

# Split the data into training and testing sets
X_train, X_test, y_train, y_test = train_test_split(X, y, test_size=0.2, random_state=42)

# Build the model
model = Sequential()
model.add(Dense(units=32, activation="relu", input_dim=len(X_train[0])))
model.add(Dense(units=64, activation="relu"))
model.add(Dense(units=128, activation="relu"))  # Additional layer
model.add(Dense(units=64, activation="relu"))   # Additional layer
model.add(Dense(units=1, activation="sigmoid"))

# Compile the model
model.compile(loss="binary_crossentropy", optimizer="adam", metrics=["accuracy"])

# Train the model
model.fit(X_train, y_train, epochs=200, batch_size=32, validation_data=(X_test, y_test))

# Evaluate the model
loss, accuracy = model.evaluate(X_test, y_test)
print("Test Accuracy:", accuracy)
heres the dataset im using:
https://paste.pythondiscord.com/obiguseceq
and i cant seem to get above a 0.0 oon the training, can someone help?
my end goal is to make the ai detect abnormal movements in my game, im sending the players data to my pc via a web request
and i wanna try and get a precentage from 1-100 on how sure it is that its abnormal
simple tapir
Can we use GridSearchCV() with Lasso/Ridge regressions as well as SVM?
past meteor
simple tapir
Can we use GridSearchCV() with Lasso/Ridge regressions as well as SVM?
Yes, any particular reason you're in doubt?
lapis sequoia
heady tusk
and i cant seem to get above a 0.0 oon the training, can someone help?
0 training loss?
simple tapir
past meteor
Yes, any particular reason you're in doubt?
due to kernel trick
past meteor
I don't exactly understand the issue. Kernel trick or not, you still need to hyperparameter tune the C parameter for SVMs as well as the gamma
Also, the kernel trick only works if your dataset isn't large. You need to form a so-called kernel matrix in memory that is of size N x N. You can do de math and see when it becomes too big for your RAM 🙂
undone wadi
How do you get rid of the numbers in the red box?
sns.heatmap(cm, annot=True, fmt=' ', cmap='Blues')

total_samples = np.sum(cm)
for i in range(cm.shape[0]):
    for j in range(cm.shape[1]):
        count = cm[i, j]
        percentage = count / total_samples * 100
        text = f"{count}\n\n\n({percentage:.2f}%)"
        plt.text(j + 0.5, i + 0.5, text, ha='center', va='center', color='black', fontsize=12)

plt.xlabel('Predicted Values')
plt.ylabel('Actual Values')
plt.title('Confusion Matrix')
plt.xticks(ticks=[0.5, 1.5], labels=['False', 'True'])
plt.yticks(ticks=[0.5, 1.5], labels=['False', 'True'])

plt.show()

 boreal gale
undone wadi
How do you get rid of the numbers in the red box?
```plt.figure(figsize=(8, 6))...
boreal gale
undone wadi
How do you get rid of the numbers in the red box?
```plt.figure(figsize=(8, 6))...
via the annot argument in sns.heatmap
 potent sky
You guys are pretty neat at resolving questions lol. I've been a little busier lately so I check this channel less often, but whenever I do, everything is already answered xd 🔥
 eternal cloud
Guys, what are the most challenging regression datasets to fit a model to?
I am writing my thesis and am trying different public datasets.
The problem is, LR is 90% of the time doing better than many models such as KNN, DT, MLP, SVR, GPR etc. Which to me is crazy. I am using Bayesian optimization to find the best params in the defined search spaces for the models.
Still LR is doing a better job. Either I am doing something wrong or LR is just on steroids.
I tried many different datasets. Any ideas?😫
mint palm
today i was interviewed for a position that require 10 yr of exp. i have 0 prof exp., lmao. It didnt go bad, but he told me they are looking for more senior candidate 😂
past meteor
eternal cloud
Guys, what are the most challenging regression datasets to fit a model to?
I am ...
If there's a primarily linear relationships then it makes sense lin reg outperforms the rest
eternal cloud
past meteor
If there's a primarily linear relationships then it makes sense lin reg outperfo...
could you help me a bit by finding out about this whether it exists or not?
Right now, I am making a correlation heatmap between my features to see if there is a strong correlation between them. There is most of the time no correlation at all. Isn't this a sign that there isn't a linearity?
 verbal venture
Can anyone expalin what mapping column names mean in this context: # use the pd.read_csv() function to read the movie_review_*.csv files into 3 separate pandas dataframes
Note: All the dataframes would have different column names. For testing purposes
you should have the following column names/headers -> [Title, Year, Synopsis, Review]
def preprocess_data() -> pd.DataFrame:
"""
Reads movie data from .csv files, map column names, add the "Original Language" column,
and finally concatenate in one resultant dataframe called "df".
mint palm
verbal venture
Can anyone expalin what mapping column names mean in this context: # use the `pd...
check dataset, what comlumn names does it have?
verbal venture
They all have Name Year Synopsis Reviews. In French the column names are the french equivalent same for spanish @mint palm
mint palm
verbal venture
They all have Name Year Synopsis Reviews. In French the column names are the fre...
and what the funciton returns, or expected to return?
one df?
verbal venture
yup
mint palm
verbal venture
They all have Name Year Synopsis Reviews. In French the column names are the fre...
one dataset, columns translated in multiple lang, you mean?
verbal venture
yeah. so the data in each of them is the same but in their respective languages. 3 dataframes with each column name in their respective language
mint palm
i think they want you to change columns of other dataframes(the ones in other lang) to [Title, Year, Synopsis, Review] and add language column for each 3
i am not sure, you can look at rest of the code to figure out
subtle knot
serene scaffold
that being the case, you should follow along with a textbook or course
Could you suggest a book or course to learn data science further?most of the ones I see are for complete beginners
 austere vessel
It does state it is beginner friendly, but Humble Bundle has a decent Python bundle in Software Bundles.
https://www.humblebundle.com/software/complete-python-mega-bundle-software

Humble Bundle
Pay what you want for <<>> and support a charity of your choice!
shadow viper
heady tusk
i am trying to make an ai anticheat using tensorflow, i know it may not be the f...
good day Jahman, i really like how readable and clean your code is. has anyone answered you yet?
heady tusk
shadow viper
good day Jahman, i really like how readable and clean your code is. has anyone a...
Nobody has answered, i used chatgpt to help make it more readable, so i cant really take credit for that
heady tusk
lapis sequoia
0 training loss?
Im assuming 0.0 means its not getting it correct
simple tapir
Why do we need to normalize our data to fit in the same range of others? I mean, what happens if we don't?
shadow viper
simple tapir
Why do we need to normalize our data to fit in the same range of others? I mean...
To make the model building run faster maybe?
shadow viper
heady tusk
Nobody has answered, i used chatgpt to help make it more readable, so i cant rea...
Still yours... I want to work on something tangible
I want to improve my nnet skills
simple tapir
shadow viper
To make the model building run faster maybe?
hmm, may be. Thanks!
heady tusk
shadow viper
Still yours... I want to work on something tangible
I want to improve my nnet s...
Gotcha, it still doesnt work and idk what i have incorrect, idk of its nit advanced enough or if i need to give it more training data or what
Or if i just coded it wrong or badly
shadow viper
simple tapir
hmm, may be. Thanks!
Like I saw it somewhere where we had to convert a whole number into 2 decimal place and the instructor said we had to do it that way to make the model building better and faster
He called it scaling
shadow viper
heady tusk
Gotcha, it still doesnt work and idk what i have incorrect, idk of its nit advan...
Try adding more training data to your dataset and if the result remains the same, try going through the code line by line
heady tusk
Its 670 lines if data in a csv file, is that not enough?
simple tapir
shadow viper
Like I saw it somewhere where we had to convert a whole number into 2 decimal pl...
oh, thanks a lot
shadow viper
heady tusk
Its 670 lines if data in a csv file, is that not enough?
Honestly I think it is.
Do you see any change at all in the result?
Even if it's a little
heady tusk
Nope, no matter how much data i give it, doesnt get above 0.0 on the training
tidal bough
I'm developing a tool to recommend songs to me that I used to listen to, and then forgot about.
I have detailed data on when I listened to what songs (let's say a big dataframe with columns title, timestamp and duration).
I want to calculate some sort of score that is:
- low if I never listened to the song much
- also low if I listened to it recently (even if I also listened to it a lot months ago!)
- but high if I listened to it a lot months ago but not a lot recently.
Any ideas? Mine are along the lines of "takenow-timestamp, apply some function liketanh, and sum the results", but this has problems like being linear with the total time listened, which I'm not sure I want.
cold osprey
Some weighted average ?
tidal bough
Hmm, indeed, I guess I could use sqrt(duration) as the weights instead of duration, that'd make the score only scale as the sqrt of total time listened.
hasty mountain
tidal bough
I'm developing a tool to recommend songs to me that I used to listen to, and the...
Maybe you could search something around how Anki does it with flash cards
At least it could help with the recent songs part...
heady tusk
How many lines of data minimum do u think is needed to train an ai decently?
shadow viper
heady tusk
Nope, no matter how much data i give it, doesnt get above 0.0 on the training
Try tuning some parameters
boreal gale
hasty mountain
Maybe you could search something around how Anki does it with flash cards <:pith...
probably some sort of spaced repetition system 🤔
heady tusk
shadow viper
Try tuning some parameters
like chanking the
model = Sequential()
model.add(Dense(units=32, activation="relu", input_dim=len(X_train[0])))
model.add(Dense(units=64, activation="relu"))
model.add(Dense(units=128, activation="relu"))  # Additional layer
model.add(Dense(units=64, activation="relu"))   # Additional layer
model.add(Dense(units=1, activation="sigmoid"))
this part?
shadow viper
heady tusk
like chanking the
```python
model = Sequential()
model.add(Dense(units=32, acti...
Yes
Try using sigmoid for most of the activation
shadow viper
heady tusk
like chanking the
```python
model = Sequential()
model.add(Dense(units=32, acti...
Good day @left tartan ... Please can you help him out?
tidal bough
hasty mountain
Maybe you could search something around how Anki does it with flash cards <:pith...
From a few minutes of googling, I think it doesn't calculate a score and simply uses exponentially increasing intervals, where the factor depends on how hard the user rates the card: https://faqs.ankiweb.net/what-spaced-repetition-algorithm.html
shadow viper
heady tusk
or all of em
Most of them
tidal bough
maybe I should look at some song library thingie, but the specific thing I'm trying to do might not be implemented by any..
heady tusk
i did all but 2
shadow viper
heady tusk
i did all but 2
What's the result?
heady tusk
lemme try this
 shadow viper
heady tusk
like chanking the
```python
model = Sequential()
model.add(Dense(units=32, acti...
shadow viper
heady tusk
like chanking the
```python
model = Sequential()
model.add(Dense(units=32, acti...
You used len(X_train[0])
What if you just use len(X_train) in the input_dim
heady tusk
it errors with this:
Input 0 of layer "sequential" is incompatible with the layer: expected shape=(None, 508), found shape=(None, 11)
i changed them all to sigmoid
shadow viper
heady tusk
it errors with this:
Input 0 of layer "sequential" is incompatible with the laye...
You input shape isn't complete then
Check the difference between (None,508) and (None,11) using chatgbt
Ask it to show you
heady tusk
shadow viper
You input shape isn't complete then
Check the difference between (None,508) and ...
my input data?
shadow viper
How can I download the dataset?
I tried downloading it but it's not working
I want to run the code myself to see
shadow viper
heady tusk
i can dm u the file?
Sure
heady tusk
if u want
 void veldt
anyone here familiar with scipy?
sick ember
can anyone help me out
I'm getting some weird erros on my pooling size
ValueError: Input 0 of layer "max_pooling1d_5" is incompatible with the layer: expected ndim=3, found ndim=4. Full shape received: (None, 50, 46, 3000)
what does this mean ;-;
tidal bough
sick ember
```
ValueError: Input 0 of layer "max_pooling1d_5" is incompatible with the laye...
did you try to run inference on one sample?
tidal bough
A very common mistake that gives an error like this is to try to pass a single image to a model - the model expects the input to be 4d (the first axis being the sample index) always. If there's one sample, the shape along the first axis will simply be 1. You can add that 1-sized axis via e.g. img[None, ...].
sick ember
tidal bough
A very common mistake that gives an error like this is to try to pass a single i...
I’m still a little confuse
How do you know it requires “4d”?
tidal bough
Oh, good point actually, looking at your error it's the opposite, 4d recieved instead of expected 3d.
What are you passing to the model that causes this error?
sleek harbor
is there any point in ever having a constant feature? I don't see the point, considering that the intersept exists.. but PolynomialTransform has an include_bias parameter (which is true by default), which does basically that - adds a "column of ones". Why?
sick ember
tidal bough
What are you passing to the model that causes this error?
hold up
I figure out
part of it
I was in the wrong directory
this is what I put in:
  [ 2.25071e-04]
  [ 2.20798e-04]
  ...
  [ 5.50851e-05]
  [ 1.78531e-05]
  [-1.75479e-05]]]
basically raw EEG signal data with 2500 data points in amplitude per seconds
now I'm getting a different error
ValueError: Exception encountered when calling layer "max_pooling1d_8" (type MaxPooling1D).

Negative dimension size caused by subtracting 2 from 1 for '{{node max_pooling1d_8/MaxPool}} = MaxPool[T=DT_FLOAT, data_format="NHWC", explicit_paddings=[], ksize=[1, 2, 1, 1], padding="VALID", strides=[1, 2, 1, 1]](max_pooling1d_8/ExpandDims)' with input shapes: [?,1,1,3000].

Call arguments received by layer "max_pooling1d_8" (type MaxPooling1D):
  • inputs=tf.Tensor(shape=(None, 1, 3000), dtype=float32)
There is also 2500 of them, randomized and label as “seizures “ or “no seizures”
tidal bough
Maybe you didn't orient your data correctly? What it's complaining about is that a max pooling layer that will be reducing the size along a dimension by 2 is getting data with size only 1 along that dimension, which isn't allowed.
If this is temporal data, I'd guess it's meant to be oriented along that dimension you're pooling over.
sick ember
tidal bough
Maybe you didn't orient your data correctly? What it's complaining about is that...
Ahhh I see
sick ember
tidal bough
If this is temporal data, I'd guess it's meant to be oriented along that dimensi...
Temporal data?
tidal bough
Well, you said it's "amplitude per seconds".
sick ember
I see, is there any suggestions you have on orientating my data? Like X = np.reshape(…?)
tidal bough
I'd expect you want a .transpose(0,2,1) or something like that.
sick ember
tidal bough
I'd expect you want a `.transpose(0,2,1)` or something like that.
Thank you! I will try to orient my data
 frigid geode
sorry to bug you all but i was doing a code academy course , and found out it doesnt get you a cert , anyone know a good free cert program ?
serene scaffold
frigid geode
sorry to bug you all but i was doing a code academy course , and found out it do...
you don't need to apologize for asking a question. but none of those certs have any value anyway and will not help you get a job. So just focus on finding resources that keep you engaged in learning the material.
sleek harbor
serene scaffold
you don't need to apologize for asking a question. but none of those certs have ...
how do u get a job tho if certs don't help? 😐
serene scaffold
sleek harbor
how do u get a job tho if certs don't help? 😐
a university degree
sleek harbor
serene scaffold
a university degree
and that's the only way?
serene scaffold
sleek harbor
and that's the only way?
for AI? definitely yes. for other development types? mostly also yes.
frigid geode
So i should just find the resources to learn the language and the build up a github ?
sleek harbor
I'm doomed
serene scaffold
frigid geode
So i should just find the resources to learn the language and the build up a git...
yes, but if you want to work in AI (this is the AI channel), you need at least a bachelors and probably also a masters.
frigid geode
I was leaning more towards analytics
serene scaffold
then you probably need a degree in statistics
sleek harbor
do data analysts use machine learning?
serene scaffold
no
sleek harbor
frick.. been leaning the wrong things all along and will end up with a frankenshtien portfolio
serene scaffold
sleek harbor
frick.. been leaning the wrong things all along and will end up with a frankensh...
what education or professional experience do you have?
sleek harbor
serene scaffold
what education or professional experience do you have?
education - bachelors in economics, but from a worthless university in a country that's not popular. Professional experience.. lets just say none 🗿
serene scaffold
sleek harbor
education - bachelors in economics, but from a worthless university in a country...
hmm. portfolio projects might help you.
sleek harbor
serene scaffold
hmm. portfolio projects might help you.
but what if they're ai type projects..? As far as I understand, I won't be able to land a DS/MLE job as a junior with no experience.. which leaves analytics as the closest alternative, but if analysts don't use ML.. then my projects will kinda be.. in the wrong area :/
serene scaffold
sleek harbor
but what if they're ai type projects..? As far as I understand, I won't be able ...
"use ML" could mean a lot of things, but analysts (at least going by strict definitions) don't do ML model development. Jobs that involve ML development generally have the highest education requirements of any developer-type job.
past meteor
sleek harbor
but what if they're ai type projects..? As far as I understand, I won't be able ...
Imo analytics has transferable skills to ML/AI jobs if you don't stay in it indefinitely
sleek harbor
past meteor
Imo analytics has transferable skills to ML/AI jobs if you don't stay in it inde...
but does it go the other way around? 🗿
serene scaffold
maybe I'm misunderstanding you, but it sounds as though you expect a job in "analytics" to have essentially the same job responsibilities as a "ML engineer" job, but for the "analytics" one to have lower requirements.
cerulean kayak
when is StandardScaler appropriate vs MinMax scaler?
At me if you have any idea.
past meteor
sleek harbor
but does it go the other way around? 🗿
A bit, both of them work with data but analytics is much more "pragmatic", they tend to care about solving data problems in whatever way possible which is the canonical powerpoint and excel stack
If you go a bit up the maturity scale you get to places that focus more on SQL + dashboarding. You won't use ML but I guess ML people can do it in some capacity because it requires working with data and problem solving.
sleek harbor
serene scaffold
maybe I'm misunderstanding you, but it sounds as though you expect a job in "ana...
it's not that I expect the same responsibilities, it's just that I've been studying more on the ds/ml side, but from what I've heard, I don't think I have a high chance at getting a ds/ml job (considering I got no experience).. so the closest thing is analytics, but they generally deal with different stuff, more visualizations, more "storytelling" or whatever. But my portfolio projects will be more on the ds/ml side. So my question actually is, will that be valueable at all if I'm trying to just get my leg in the door, which means I'll prob be going for an analyst job. Or will a recruiter look at my stuff, say "nah, he doing ml, we don't need that" and toss me in the trash?
sleek harbor
past meteor
A bit, both of them work with data but analytics is much more "pragmatic", they ...
that's a bit of a problem. I went straight for sql and skipped excel.. Never liked the laggy thing. And I absolutly hate powerpoint 💀
past meteor
If you dislike Excel then avoid companies that are heavy on it, it's fine
sleek harbor
I'll take anything that pays more than nothing, as long as I pass the interview)
past meteor
Well, you have a degree in economics. Just play to your strengths, no?
Go for some analytics type role in finance, accounting, operations research etc. I think you're a good candidate for them because you know about the domain and you have technical skills. Keep doing your personal projects on the side and save up money. Leave to do a masters and then you're a really employable data scientist, especially within the domain you worked in.
sleek harbor
But I don't like the domain (banking to be specific). But yeah, I'll be trying everything once I feel I'm ready
is there any premade darkmode style for seaborn? 🤔
past meteor
Any particular reason? Banks can be a good (but also horrible) employer for data / AI roles depending on what team you land in.
iron basalt
If you really need a job you can't be picky. Any job experience will help a lot when you find another job.
sleek harbor
yeah, I'll accept anything I can
iron basalt
It's also going to probably be better than you think, you will learn a lot.
sleek harbor
past meteor
Any particular reason? Banks can be a good (but also horrible) employer for data...
I worked in a bank for a total of.. idk, 3 months or so. Not a data role, but it was pretty terrible. And everyone I asked told me it doesn't get better. Had an internship like thingie in a department where they did analysis, and the manager said that if I could manage, I should go elsewhere.. But it could just be the banking system in the country, so maybe it's better elsewhere
past meteor
Yeah, I've heard horror stories about banks. I have numerous friends in bad jobs there as we speak but also ones on advanced teams doing cool stuff. It just depends tbh.
sleek harbor
iron basalt
It's also going to probably be better than you think, you will learn a lot.
I bet. The difficult part is always the interview. Especially for me, a cat with no social skills who scored a whooping 98% introverted on the 16 personalities test :3
iron basalt
You can find stories like that in pretty much every field. There are red flags for sure, try to find one that challenges you in some way. Even if the job is comfy, it's not a great idea to get too comfy and stagnate.
sleek harbor
my end goal is I bet pretty cliche and laughable, but I'll say it, just for the sake of laughs: Imma make an Ai trading bot and retire early 🗿
fr tho, I wrote my bachelors thesis on Techincal Analysis, and that's actually what inspired my to get into DS in the first place. But the more I study, the less plausible it seems to achieve that goal, simply because of the amount of things one needs to know.. For every answer I find I have another 10 questions, and my bookmarks are only growing, reading list is overflowing, and I even had to download an extension for saving tab groups in the browser cus I was running out of space.. I feel like I could study for 50 years and not be satisfied with my knowledge.. And the field is just developing at faster and faster rates! I don't know how y'all keep up, let alone how to catch up myself..
past meteor
Pick your battles, you're never going to know everything so scope yourself
Many techniques are also just very similar so over the years you do just get faster at picking stuff up or you can say "oh this is just a special case of X" and you move on
junior rain
dusk tide
I was practicing EDA on movies dataset. I had a confusion that even **Harry Pott...
Mean is the average price a single movie can be expected to earn. So, Harry Potter (with 8 movies) on average earned less per movie. Avengers on the other hand has four movies that on average earned more than the average harry potter film. Mean is the same as average *(calculated as the total amount earned/number of movies) *so we are talking about the average that a single movie in the collection. The avengers, however, has only 4 movies (the set is the averngers series only and not Marvel as a whole) that on average (total amount earned/4 movies) earned more per movie. The key difference here is the number of movies. Since Harry potter had 8 films it had a greater sum of revenue, but on average each filmed earned less than the avengers. We can use this logic to say that ***if ***the avengers had the same number of movies it would probably have a greater sum.
 unreal charm
Hi. Im writing my bechlor degree theiss about ML and NLP i nchatbots. At the end of Ml chapter I wanted to show how someonce should use diffrent Ml technics like supervised, unsupervised and reinforcment. But it is good to show unsupervised avg score next to the other? Isn't that some kind of mistake?
 junior rain
dusk tide
I was practicing EDA on movies dataset. I had a confusion that even **Harry Pott...
junior rain
dusk tide
I was practicing EDA on movies dataset. I had a confusion that even **Harry Pott...
Also to further clarify your question, when we take the mean it isn't exactly a single movie. Lets say for simplicity sake that each avengers movie earned $1, $2, $3, and $4, respectively. The average is calculated as (1+2+3+4)/4 = $2.5 on average. So it's safe to predict that another movie will make $2.5, but notice that no movie actually made $2.50. If you wanted to represent a real value you should use medium, which simply takes the middle item when sorted in order of earnings. So if we had 1,2,3,4,5 then the movie that made $3 is our median. Note that with median if we have an even number of items like in 1,2,3,4 then we average the 2 middle terms so 2 +3/2 = 2.5 and in this case our mean and median of the set it the same. One thing to understand about the median is that if we have outliers it doesn't represent that spread well in our data set. for example in the set: 1,2,3, 10 the median is 2.5 but if we looked at 2.5 without the rest of the set it wouldn't represent the true spread of the set whereas the mean of 4 does a slightly better job. Sorry if I overexplained, I hope this clarifies it.
void veldt
anybody do least squares work with scipy or lmfit?
 young granite
unreal charm
Hi. Im writing my bechlor degree theiss about ML and NLP i nchatbots. At the end...
young granite
unreal charm
Hi. Im writing my bechlor degree theiss about ML and NLP i nchatbots. At the end...
depends what u compare what makes u think its unsuited?
unreal charm
I can show You the code
young granite
void veldt
anybody do least squares work with scipy or lmfit?
ask ur question directly, makes it easier for us to help
 languid chasm
sleek harbor
But I don't like the domain (banking to be specific). But yeah, I'll be trying e...
languid chasm
sleek harbor
But I don't like the domain (banking to be specific). But yeah, I'll be trying e...
Not in the industry but if anything banking and finance aren’t one in the same. You can be a (financial) analyst and not work in a bank or in banking. Ex: my hospital is hiring for an investment analyst to oversee their portfolio(s).
unreal charm
young granite
ask ur question directly, makes it easier for us to help
import pandas as pd
import matplotlib
import matplotlib.pyplot as plt
from sklearn.model_selection import train_test_split
from sklearn.linear_model import LogisticRegression
from sklearn.cluster import KMeans
from sklearn.ensemble import RandomForestClassifier
from sklearn.metrics import accuracy_score, silhouette_score

df = pd.read_csv(’titanic.csv’)
print(df)

median = df[’age’].median()
df[’age’].fillna(median, inplace=True)
median = df[’fare’].median()
df[’fare’].fillna(median, inplace=True)
most_common_value = df[’embarked’].mode()[0]
df[’embarked’].fillna(most_common_value, inplace=True)
df.drop(’cabin’, axis=1, inplace=True)
df.drop(’boat’, axis=1, inplace=True)
df.drop(’body’, axis=1, inplace=True)
df.drop(’home_dest’, axis=1, inplace=True)
df[’sex’] = pd.factorize(df[’sex’])[0]
df[’embarked’] = pd.factorize(df[’embarked’])[0]

X = df.drop([’survived’, ’name’, ’ticket’], axis=1)
y = df[’survived’]
X_train, X_test, y_train, y_test = train_test_split(X, y, test_size=0.2, random_state=42

model_supervised = LogisticRegression()
model_supervised.fit(X_train, y_train)
y_pred_supervised = model_supervised.predict(X_test)
accuracy_supervised = accuracy_score(y_test, y_pred_supervised)

model_unsupervised = KMeans(n_clusters=2)
model_unsupervised.fit(X)

labels = model_unsupervised.predict(X)
silhouette_avg = silhouette_score(X, labels)

model_reinforcement = RandomForestClassifier()
model_reinforcement.fit(X_train, y_train)
y_pred_reinforcement = model_reinforcement.predict(X_test)
accuracy_reinforcement = accuracy_score(y_test, y_pred_reinforcement)

labels = [’Supervised’, ’Unsupervised’, ’Reinforcement’]
accuracies = [accuracy_supervised, silhouette_avg, accuracy_reinforcement]
plt.bar(labels, accuracies)
plt.ylabel(’Dokładność’)
plt.title(’Porównanie dokładności dla różnych technik’)
plt.show()
generally it's based on titanic data, but I used difrent accuracy scores, but My professor was woried if I really can comapre unsupervised with others
I jsut want to know if it's ok, or I cant compare unsupervised learning accuracy to for exmaple supervised learning accuracy
void veldt
young granite
ask ur question directly, makes it easier for us to help
I have, in pythonhelp
the question is about determination of variance using scipy, I understand the use of the inverse Hessian, but it appears the inverse Hessian needs to be scaled
young granite
unreal charm
```
import pandas as pd
import matplotlib
import matplotlib.pyplot as plt
from s...
so i suggest u not simply doing 1 prediction but rather something called crossvalidation (look that up if its new for u), in general sure u can compare results of ML algos. with each other but to do so u need to define parameters u want to compare and then think if its suited to do so
unreal charm
young granite
so i suggest u not simply doing 1 prediction but rather something called crossva...
so I've find that I should use crossvaldiaiton on supervised and reinforcment learning, beacasue unsupervised learning model does not require cross-validation as it doesn't have a target variable
young granite
unreal charm
so I've find that I should use crossvaldiaiton on supervised and reinforcment le...
indeed i wasnt precise enough what i wanted to tell u is u shouldnt "throw one dart hit 50 and call it a day"
unreal charm
fair enough
young granite
u want to check whether or not ur models are well generalised or not
performance wise u can afterwards compare lets say cv=10, cv=5 etc.
and for unsupervised just random sample urself
unreal charm
ok, thank You
The last thing, do You know some good articale or book with definisions for supervised, unsuperviced and reinforcment learning I can cite to my thesis and add something mroe to the bibliography?
young granite
unreal charm
```
import pandas as pd
import matplotlib
import matplotlib.pyplot as plt
from s...
is this all u got for ur bachelor?
ur just a quick example?
unreal charm
no no, ML is just one chapter
young granite
O´REILLY data science books are pretty well written and easy to follow
unreal charm
The title is "Mechanisms of chatbots operation in terms of machine learning and natural language processing"
young granite
Rule #1 everything is linear algebra 😄
unreal charm
yea true, but Im trying to show how chatbots are working in IT and cognitive science way
unreal charm
young granite
Rule #1 everything is linear algebra 😄
so my thesis is not that mathematican
anyway thanks for You help
young granite
sure thing
hasty mountain
I was planning to ask something here about an error I'm having with my Variational AutoEncoder with the Encoder returning NaN after a certain number of epochs, but then I decided to rerun it again to make sure I wouldn't know what is happening...
...so far, my remaining GPU time in kaggle is less than 1 hour and the error didn't appear, and I don't know how to feel about it, because it'll probably haunt me again sometime 
My Encoder gradients suggest that it could be the encoder being optimized to generate mean and standard deviation outputs that are so small that when I use torch.exp(standard_deviation/2), it would return NaN. But then I've seen that torch layers usually do that when it's a case of number that tends to infinite
dusk tide
junior rain
Also to further clarify your question, when we take the mean it isn't exactly a ...
Thanks. The things you said about outliers , where there are outliers in our feature/column and we want to compute the missing value then we use median(instead of mean)??
junior rain
dusk tide
Thanks. The things you said about outliers , where there are outliers in our fea...
Let me clarify, there's no missing value. I'm not to sure what you mean by missing value. I said we use median when we want a value that exists in our real data set. Let me give you a real example I'm using; I have data of people's brain waves that I'm averaging. I average them using the median because I don't want an average that can't exists in the real world and I know there's no such thing as outliers with brain waves. Using median in this case will always return a whole number that truly exists in the real world.
junior rain
dusk tide
Thanks. The things you said about outliers , where there are outliers in our fea...
Here's a simple key to deciding. If you want a real value in your data set as an average and don't have outliers or don't care about representing the outliers then use median. If not, use mean.
lapis sequoia
guys can yall give me curriculums or resources that I could use to learn mathematic for machine learning and DS
the pre-req math that I know is high school mathematics
 woeful hatch
Im having a problem with langchain's write file tool
If we ask it to "create a file hello there.txt with content as hello there"
then it will start a new chain and then return this:
{
  "action": "write_file",
  "action_input": {
    "file_path": "hello there.txt",
    "text": "hello there"
  }
}
Sometimes it works and completes the action but most of the times it returns the above dict without completing the action
Code used:
toolkit = FileManagementToolkit()

memory = ConversationBufferMemory(
    memory_key="chat_history")

llm = ChatOpenAI(temperature=0.5,
                 model="gpt-3.5-turbo-16k-0613",
                 max_tokens=3500)

agent_chain = initialize_agent(toolkit.get_tools(), llm, agent=AgentType.STRUCTURED_CHAT_ZERO_SHOT_REACT_DESCRIPTION, early_stopping_method='generate',
                               verbose=True, memory=memory)
while True:
    text = input("User: ")
    if text == "quit":
        break
    else:
        output = agent_chain.run(input=text)
        print("AI:", output)
I am new to LSTM,
Task: given input: batch_size, sequence_len, embed_dim, output: batch_size
Is this implementation correct?
LSTM_HIDDEN = 8
LSTM_LAYER = 8
batch_size = 128
learning_rate = 0.001
epoch_num = 1000

class CpGPredictor(torch.nn.Module):
    ''' Simple model that uses a LSTM to count the number of CpGs in a sequence '''
    def __init__(self):
        super(CpGPredictor, self).__init__()
        self.lstm = nn.LSTM(1, LSTM_HIDDEN, LSTM_LAYER, batch_first=True)
        self.fc = nn.Linear(LSTM_HIDDEN, 1)

    def forward(self, x):
        batch_size, seq_len, _ = x.size()

        # Create initial hidden and cell states
        h0 = torch.randn(LSTM_LAYER, batch_size, LSTM_HIDDEN).to(x.device)
        c0 = torch.randn(LSTM_LAYER, batch_size, LSTM_HIDDEN).to(x.device)

        out, _ = self.lstm(x, (h0, c0))

        out = out[:, -1, :]

        output = self.fc(out)
        output = nn.functional.relu(output)

        return output

model = CpGPredictor()
loss_fn = nn.L1Loss()
optimizer = torch.optim.Adam(model.parameters(), lr=learning_rate)

# training (you can modify the code below)
from tqdm import tqdm

t_loss = .0
model.train()
model.zero_grad()
for _ in range(epoch_num):
    for batch in train_data_loader:

        batch_inputs, batch_targets = batch

        outputs = model(batch_inputs.unsqueeze(-1).to(torch.float32))

        outputs = outputs.squeeze()
        loss = loss_fn(outputs, batch_targets.to(torch.float32))

        t_loss += loss.item()

        loss.backward()
    print(t_loss)
    t_loss = .0
ISSUE:
- gradients barely changes.
out[:, -1, :]is same for all inputs- out is not same for all inputs
- Loss almost constant, minor fluctuations
ok i am *** stupid i forgot to add
optimizer.step()
optimizer.zero_grad()
omgggggg
hasty mountain
hasty mountain
I was planning to ask something here about an error I'm having with my Variation...
Hm... Maybe forcing the Encoder to extract 16,000 features and from this amount generate 128 latent spaces is a bit tough...at least I think the matrix multiplication in this process will result in the summation of many, many numbers
But it's strange, though... I never had problems with bottleneck fully connected layers generating NaN values when using classifier models. The worse thing that would happen is the loss of information and a really bad loss
potent sky
as you suspect, it might be a vanishing or exploding gradients problem if your data is alright
simply summing them over should generally not cause any problem in my experience
but it's difficult to say without the code
past meteor
I have something that's been bugging me at work. My domain is medical stuff.
Our variable of interest comes from a device that measures at a frequency of t. For about a third of our sample the frequency is t/3. How would you resolve this?
sick ember
Is it normal for training accuracy to be stuck at a certain number and not increasing?
past meteor
I'm not a fan of interpolating because it's a high risk, low reward strategy. The problem is inherently time series and you really really have to make sure you're not leaking data because to interpolate t+1 and t+2 you need access to t+3 at time point t. Specially, future points influence past points. We can make this work without leaking but I rather not.
Other alternatives are keeping them separate and using partial pooling models, extrapolating instead of interpolating t+1 and t+2 or modelling these 2 as separate exercises.
What would you guys do?
dusk tide
junior rain
Here's a simple key to deciding. If you want a real value in your data set as an...
thanks. Actually I was doing the data analysis to fill in the missing values in other features. PS. I am also practicing Data Cleaning
wooden sail
past meteor
I have something that's been bugging me at work. My domain is medical stuff.
O...
why is the frequency t/3 :x
also temporal interpolation being an issue depends on what kind of analysis you're doing
past meteor
wooden sail
why is the frequency t/3 :x
Maybe t/3 is not the most ideal way to explain it but let's say that one group of people used an older device that only measures once every 3 minutes while the others measure every minute
wooden sail
aha
and is the thing you're trying to analyse some sort of pattern in the time domain?
past meteor
Yes, we're modelling a variable that the devices measures over time
wooden sail
and does this have to be done in real time?
past meteor
I'd say yes, we're still in the proof of concept phase but at some point it'd have to go live
wooden sail
i'm still not sure this is something i'd classify under "data leak" though
past meteor
It can leak if you don't take precautionary measures and it limits real world applications
wooden sail
the practical solution is to introduce a delay of 1 snap shot in the pipeline
otherwise you have to live with the reality that anything you do will have some error
past meteor
Say someone wants to get a prediction at T1. Not possible because we only measure T0 and T3, T1 depends on having observed T3
wooden sail
yep i understood, the sampling rate of two data sets is different
there's no way of doing this without error if you don't use the next sample
unless you already have a very accurate parametric model, which is probably what you're trying to find in the first place 😛
past meteor
The solution could be interpolating in the training set and only predicting non-interpolated values. When we go live de only make predictions at T0 and T3
wooden sail
that's the same as downsampling the data from the set with a higher sampling rate
if the information is already present in the t/3 data, you don't need the higher sample rate
(and no form of interpolation generates new data)
past meteor
wooden sail
unless you already have a very accurate parametric model, which is probably what...
Indeed, but the short horizon predictions are easier hence why I was thinking I could make a model on the higher frequency dataset and use that to model the two subsequent points
past meteor
Good question, I hope not. This was a failure in experimental design by my colleagues. If it's up to me, no
wooden sail
only on the new one?
because then there's really no problem with just interpolating the slow machine data as a pre processing step and then feeding that "as if it were live data" when training
i really don't see this as a huge problem. recall that the ideal fourier interpolator is convolution with a sinc in the time domain
so if you simply delay by 1 sample, you can already do the interpolation this way
past meteor
The only reason why I care about interpolating is that there's also "events" from different data sources that are placed in the closest time bucket. The buckets are larger for that group, which is unfortunate.
wooden sail
or maybe i'm oversimplifying where the nulls of the sinc land 
aha
yeah that can't be undone in any way 😛
discretization of that kind is lossy
past meteor
That's somewhat fine. For example, we measure how much someone ate. It's better to know in what 5 minute interval it happened than in what 15 minute interval.
wooden sail
mhm
past meteor
Last but not least, my other concern is ensuring colleagues don't actually leak data. It would leak if you for instance interolate throughout the entire dataset and then split
wooden sail
like use data from one measurement/time series to interpolate another?
past meteor
Let's say we have a week's worth of data and the last 2 are our test set. In this example we use an autoregressive model that has access to y_true at the next time step.
If you interpolate on the entire dataset and then use say AR(3) at some point you will have 1 real followed by 2 artificial points that are highly dependent on the next point you are going to predict
Maybe I'm overthinking this
wooden sail
this is an issue of how you interpolate the data though
i do think you are
smooth data has inherently the property that knowing everything about a single point in time gives you all of the information everywhere in time
that's basically what taylor series do
if you had access to all the derivatives of the data at one point, you immediately know the future everywhere in the region of convergence
this is a property inherent of the data
the current point constrains the future ones, and if you miss the current one, you can use the future one to get it back
the problem is when you use one arbitrary method of interpolation, use that to fill in the gaps, and then treat it as ground truth and predict with the same method
you'll get exactly the same thing, and a very nice overfitting
i would say it makes sense to interpolate over the whole data with the ideal interpolator, but then process the data with the actual pipeline you will use (the ideal interpolator would be impossible in that case anyway, that's why you use stuff like AR models)
which is more or less a way of saying "the information is already in the data, and not using it only generates wrong data for training"
past meteor
Hmm this all makes sense but I'll have to think it through
wooden sail
i'm also not familiar with your work so maybe everything i told you is wrong 😌 but yeah, give it some thought
past meteor
What I just need to do is work from back to front and figure out if we need predictions at T1 and T2 because everything hinges on that somewhat
lapis sequoia
TheStrange-007
This repository contains a deep learning project that utilizes Convolutional Neural Networks (CNN) to build a digit recognizer using the MNIST dataset.
crimson summit
I understand most of DQN now but i am still confused on how this part of the bellman equation is estimated in the target network [Q(s', a')] I am not exactly sure how this gets better over time ? Is it through memory replay and the weights combining or am I on the wrong train of thought ?
 thorn isle
looking for 2k token coding llm that is able to be ran on light hardware like starcoder
 spare briar
What is wrong with starcoder? What hardware constraint do you have?
past meteor
crimson summit
I understand most of DQN now but i am still confused on how this part of the bel...
Your neural network ~ Q(S, A)
There's tons of proofs that aren't too bad in sutton & barto's reinforcement learning, an introduction that explain why semi-gradient descent does converge to a value.
thorn isle
spare briar
What is wrong with starcoder? What hardware constraint do you have?
way too much ram needed
I am looking for something I can host on a ryzen cpu
past meteor
It's not due to memory replay, you can swap out the neural net for say linear regression as your approximation of Q and it'll also move towards pi*
spare briar
past meteor
I have something that's been bugging me at work. My domain is medical stuff.
O...
A frequency t signal can't be resolved if you sample at a rate t/3. Nyquist-Shannon theorem states that reconstructing a frequency t signal requires 2t samples
The device sampling at rate t would need to be massively (wastefully) oversampling
past meteor
spare briar
A frequency t signal can't be resolved if you sample at a rate t/3. Nyquist-Shan...
Signal processing is sadly far from my domain 😩. I think I need a good and long read here. I look at this stuff from a statistics pov. but there's many good ideas here...
spare briar
The important factor here is the frequency of the signal you want to resolve
not the instrument sampling frequency
If your instrument at rate t is oversampling then you may be fine at t/3
but if the instrument at rate t is optimally sampling (it should be if it is a medical device), your t/3 signal will be unable to detect the high frequency signals
small wedge
thorn isle
I am looking for something I can host on a ryzen cpu
have you looked into quantized models?
thorn isle
yes
past meteor
spare briar
but if the instrument at rate t is optimally sampling (it should be if it is a m...
No I actually think that the thing we're measuring is probably measurable at a higher frequency than what we have but somewhere down the line it just got undersampled
spare briar
Do you mean measurable at lower frequency?
or do you mean that you are currently undersampling
if you are undersampling even at t you are sort of doomed
measurement won't have the necessary information to resolve any signal higher frequency than t/2
past meteor
Let's say the device can measure once per second. It likely aggregates it over three minutes and then gives that as an output. We only have that for device A.
small wedge
thorn isle
yes
seems like that'd be the solution then right? just look for quantized versions of llm's https://github.com/qwopqwop200/GPTQ-for-LLaMa they're really common since GPT-Q dropped. Or is even that too much vram?
spare briar
What is the frequency of the actual signal you are trying to detect
past meteor
Device B is in the majority though and device B has a measurement every minute
past meteor
spare briar
What is the frequency of the actual signal you are trying to detect
Sorry, I'm actually not that good with the signal processing vocab on this topic. What do you mean concretely?
spare briar
you are measuring a time series
suppose that the signal you are measuring is the heart beat
and the heart beats once per second
if you measure only once per second you will never see it beat
you will measure a constant
you need to measure twice per second
to see the beat at the beginning and halfway through
so you need to measure at a frequency of twice per second to be able to count heart beats
what I'm asking is what is the frequency of the thing you are trying to measure
spare briar
you need to know something about its rate of fluctuation in order to decide the sampling rate required to detect it
past meteor
The thing is, what does that change for me?
spare briar
it tells you whether the sampling rate of the instruments even matters
like if the fluctations are on the order of once per second, and instrument A measures 1000 times per second, instrument B measures 300 times per second, there is no consequence to downsampling instrument A to 300 time per second
both still easily detect the signal
past meteor
We get the data as-is, we're not in the business of making the measurement device. I'm pretty sure if you measure every millisecond or so you would see a change if your device is accurate enough.
spare briar
but if the fluctuations are 1000 times per second you are screwed with instrument B
past meteor
Say we're measuring oxygen levels in someone's blood, what would the sampling rate be of something like that
(Thanks for hearing me out btw! I'm just a bit confused)
spare briar
It depends on what you are measuring
If you are trying to measure fluctuations, you need to know the rate of fluctuation and sample at a frequency of 2*rate of fluctuation
If you are trying to detect when it exceeds a certain level, sampling doesn't matter (you only need a single measurement), but the sampling rate will introduce latency (you won't get the information that it exceeded that level until you sample)
past meteor
Our measurement in this case would be the exact level every minute (or an average of the past minute, idk). The task at hand would be to predict what the level at t+n is
What I'm gathering from this convo is that I really need to read the spec of the devices.
spare briar
Nono you need to know what factors influence blood oxygen and at what timescales they operate
the t+n level will be a combination of signals at different frequencies
you need to know how important the high frequency signals are to prediction
have you looked at the frequency spectrum of your signal?
past meteor
Yeah, so that's where we are right now. The other factors that we believe are important (from the literature) are "aligned" to be with their closest blood oxygen observation
So if someone smoked we know that they smoked at say 00:31 and we align it to be at 01:00
(our domain is not blood oxygen, I'm just thinking of relevant examples)
past meteor
spare briar
have you looked at the frequency spectrum of your signal?
No, because they're not common in canonical time series or seq2seq problems. Typically people look at (partial) autocorrelation but I'm writing frequency spectrum down.
spare briar
your question was related to the relative sampling rates of the instruments
this difference only matters if there is information in the higher frequencies that you are able to measure with one instrument but not with the other
this is why im asking about the frequency spectrum
 dusky coyote
Hey all hope you're doing well.
Has anyone come across any good resources (perhaps empircally based research papers/ blogs posts etc) on ways to make use of GPT-4 as part of technical workflows? An example being using it to learn data-science/ ai related concepts (in python)?
Note: First hand experience/ points would also be great if direct resources can't be found.
small wedge
modern language models are not reliable sources of information and thus shouldn't be used to learn topics. Instead they are very good at assisting with simple/repetitive tasks and producing creative ideas.
past meteor
spare briar
this difference only matters if there is information in the higher frequencies t...
From my pov it matters for 2 reasons:
- Complete pooling is not feasible if your time series has different sampling rates. Partial pooling is, but not all models can do it. This is interesting because this means we could train 1 model for everyone.
- Our other variables may happen at say 1:31 which means it gets assigned to 3:00 instead of 2:00 which may or may not be an issue.
spare briar
I see, on (1) I don't know much about how to downsample signals. But ideally you would be able to just downsample the higher sampling rate to the lower one without losing info.
On (2) this is an empirical question, whether the higher time resolution matters for model performance
past meteor
My colleagues are mostly interested in point 2. hence why I'm spending so much time on this. If it's up to me I'd do complete pooling within device A and device B but not across, partial pooling and no pooling.
Downsampling means we lose 2/3rds of our data
spare briar
But you don't seem to know whether the higher sampling rate even matters (that 2/3rds of data may be oversampling and irrelevant)
past meteor
That's a very fair point
spare briar
I usually work with imaging data, where I would downsample with bilinear interpolation
Upsampling doesn't work without an extremely good and domain specific generative model
past meteor
Just from eyeballing the data it doesn't seem to be oversampling. Blood oxygen isn't our domain but it's definitely something that is pretty much continuous
spare briar
Every signal is continuous
but a lot of it is noise
what is the highest frequency of real information
I know you cant answer that
but you should try to answer that, and if you can't you don't know what are the consequences of downsampling
past meteor
I can't but I should think in those terms
spare briar
I need to go now but good luck!
past meteor
Thanks, both you and edd gave me a lot to think about
crimson summit
past meteor
It's not due to memory replay, you can swap out the neural net for say linear re...
its just messing with my mind how the y value is changing and "giving a better estimate" after each itteration
in all the ML stuff I learned so far the y value is the unchanging target lol
i guess i just need to think on it more and it will make sense eventually
past meteor
You need to trust us on this one and read the book tbh
There's so much more going on with DQN than with basic dynamic programming.
The stuff you're struggling with seems to be the core of reinforcement learning, general policy iteration (GPI)
crimson summit
past meteor
You need to trust us on this one and read the book tbh
i already ordered the book I am just completing a course right now that gave a very brief explanation of dqn and it has me doing a lab but I just want to understand what I am doing lol
past meteor
I left the page number inside so you can look it up. In the case of DQN it's Q (s, a) instead of v(s) and Q(s,a) is represented by your neural network
 past meteor
crimson summit
i already ordered the book I am just completing a course right now that gave a...
past meteor
crimson summit
i already ordered the book I am just completing a course right now that gave a...
The most important thing to know for now is that you have a loop where you use your policy, update your Q function (= your neural network) after which you select a new policy and then use it again
Looping with these 2 steps make you converge in the long run. The reasons for this can be found in the bellman equation itself
dusky coyote
small wedge
modern language models are not reliable sources of information and thus shouldn'...
While I do mostly agree with this point I certainly believe that GPT-4 has learn't internal representations which can make it a somewhat decent reasoning engine for technical tasks (in particular for more routine ML using python) but as you say not as a primary tool for learning.
I feel using it as a subsidy tool alongside main material can sometimes be useful and as such curious to know whether anyone has done so within their workflow (or come across useful empirically tested resources which show how others have), if so how.
small wedge
I disagree that it has developed a reasoning engine. The internal representation it has is of the statistical likelihoods of the next token given an input sequence. As a result, the wording of your question to a language model can give you completely contradictory outputs, even if the two input questions are logically the same.
To be fair, I agree there are cases where its output is useful for reasoning or helpful to some extent. My point is simply that it's not reliable at that task as a result of the architectures of these models (and more specifically the training data), so I wouldn't call that reasoning. I think there is room to use it as a tool in workflows like copilot has demonstrated. Hope someone can provide what you're looking for!
junior rain
dusk tide
thanks. Actually I was doing the data analysis to fill in the missing values in ...
Ah that makes sense now. Glad I could help, good luck
I am conducting a chi-squared test using scipy.stats.chisquare() and I'm getting a P value of NaN but a good X^2 value. I'm running identical tests seperated for men and women. This first block is to get me the values I need for the test. the Df for women and men that I keep calling is my dataframe of frequency values```expectedValues_chi_Women = []
observedValues_chi_Women = []
observedValues_chi_Men = []
expectedValues_chi_Men = []
#sum totals to use as constants to calc expected values (both values are constant but just for consitencies sake they are treated seperately)
WomenDFtotal = chiSquared_DF_Women.sum().sum()
MenDFtotal = chiSquared_DF_Men.sum().sum()
#degrees of freedom for the chi test (calculated as [num rows - 1][num col - 1]) (both values are constant but just for consitencies sake they are treated seperately)
chiDDOF_Women = (len(chiSquared_DF_Women) - 1)*(len(chiSquared_DF_Women.columns) - 1) #same for both
for column in chiSquared_DF_Women: #expected and observed values for women in age v offset
for aperOffset_index, row in chiSquared_DF_Women.iterrows(): #df is indexed by the offset so get offset and column for to get observed values
if row.sum() != 0: #omit cases of row tot equal zero causing f_exp to be zero (works because ddof is constant)
observedValues_chi_Women.append(chiSquared_DF_Women.loc[aperOffset_index, column])
expectedValues_chi_Women.append(row.sum() * chiSquared_DF_Women[column].sum()/WomenDFtotal) #expected value formula is row total * column total / total```
chi2_stat_Women, chi2_pValue_Women = scipy.stats.chisquare(f_obs= observedValues_chi_Women, f_exp=expectedValues_chi_Women, ddof=1000000000)

# Perform chi-squared test on chiSquared_DF_Men
chi2_stat_Men, chi2_pValue_Men = scipy.stats.chisquare(f_obs= observedValues_chi_Men, f_exp=expectedValues_chi_Men, ddof= chiDDOF_Men)

print(str(chi2_stat_Women) + "|" + str(chi2_pValue_Women) + "\n\n" + str(chi2_stat_Men) + "|" + str(chi2_pValue_Men))
this is my output: ```846.9660236851139|nan
712.7748947008497|nan```
Does anyone konw why?
 sullen sage
6
crimson summit
@past meteor Is this it or still wrong ? the bellman equation uses the q value of the new state s' and a batch of previous experiences to form the target values which is then used in MSE to find the cost ?
past meteor
crimson summit
<@260493929047130113> Is this it or still wrong ? the bellman equation uses the ...
I still encourage you to think disconnect this from DQN first. Do you know exactly what the Q function is expressing on its own?
crimson summit
past meteor
I still encourage you to think disconnect this from DQN first. Do you know exact...
isnt it the expected cumulative reward when taking action a in state s ?
past meteor
crimson summit
isnt it the expected cumulative reward when taking action a in state s ?
Great, that's it. The hand wavy explanation is the quality of the state / action pair. The goal is to have an accurate estimate, aka to converge to Q*(s,a).
Is your question actually just why (semi-)gradient descent brings you closer to convergence?
crimson summit
my question is how does the bellman equation know how to get Q(s', a'). I understand that once you take an action you enter a new state and get an immediate reward. But how is this part Q(s', a') found ? The future action part is the part of the equation that i don't know how its being calculated. Is it calculating the reward from future actions based on the expirience buffer ?
past meteor
crimson summit
my question is how does the bellman equation know how to get Q(s', a'). I unders...
Oh, that way.
For regular Q learning:
- You have state a S
- You do an action A
- Observe S' (in the code, Sp)
- Check what A' (in the code Ap) would be given Sp
- Use both to evaluate Q(S', A')
  def simulate_TD_episode(self) -> float:
        G = 0
        done = False
        S = self.env.reset()

        while not done:
            A = self.agent.act(S)
            Sp, R, done, info = self.env.step(A)
            Ap = self.agent.act(Sp) if not done else 0
            self.agent.update(S, A, R, Sp, Ap, done)# in DQN you add it to your experience buffer instead
            S = Sp
            A = Ap
            G += R
        # in DQN you perform one training step here instead
        return G
Does this answer your question?
 mild dirge
That looks like SARSA not Q learning
past meteor
Q learning and sarsa have the same form, the only difference is the max operator
The Ap is redundant though indeed, specifically because of the max operator. I wrote it this way so I can pass in SARSA, Expected Sarsa, Q learning, Double Q, ...(hence simulate_TD_episode)
crimson summit
past meteor
Oh, that way.
For regular Q learning:
1. You have state a S
2. You do an acti...
It helps just trying to relate it to the code that is shown in the course
past meteor
I'm worrying I might confuse you more at this point :p
crimson summit
lol
hasty mountain
Hey guys, about Feature Extraction with neural networks...
I know that the hyperparameters are kinda trial and error, but I want to know if there's a logic that I should follow when I decide how many features I want my model to extract.
I said that my VAE was facing some stability issues, and it seems the cause was due to the fact that I was making my Encoder extract 1024x4x4 features(16,384 features) features from 32x32x3 images(which have 3,072 pixels) and produce a latent space with size 128.
The latent space size in relation to the amount of features doesn't seem to be the problem, as upon addition of a bottleneck layer to filter those 16,384 features into 4096 didn't appear to quite fix the issue. However, changing the amount of features that would be extracted from 1024x4x4 to 256x4x4 (thus, changing the number of filters in all convolutions) made the model stable.
I want to know if there's a logic that can allow me to estimate if I'm being a bit too...exagerated on the number of features I want my model to extract
Curiously, from what I remember, this stability issue only showed up once I replaced the Transposed Convolution layers in my Decoder by Upsampling + Convolution sequences...
iron basalt
crimson summit
my question is how does the bellman equation know how to get Q(s', a'). I unders...
History, you have two steps of time already.
Well, one and the next action.
If an equation requires some future value, you can just shift all the time subscripts down.
(So you need multiple steps into the past instead / same thing different POV)
dire violet
i currently have something like this in my csv and i wanted to convert it to just a list in 1 column instead of the span of multiple. I have this ["Never", "Once a month", "Few times a week", "Once a day", "Several times a day"] and it's supposed to determine how frequent it is, based on that the data in the csv file would be replaced with a number. Once a day would be 4. How do i do this using pandas?

 warm copper
you need to use encoder @dire violet
that turns cat variables into dummy ones
scikit-learn
cerulean kayak
So I just found a YouTube video that said logistic regression is a regression algorithem. Is everything I know a lie?
agile cobalt
logistic regression is just linear regression with a fancy activation function
cerulean kayak
agile cobalt
logistic regression is just linear regression with a fancy activation function
I don't think you answered my question,
or maybe im too inexperienced to know what you said.
agile cobalt
linear regression tries to predict a number
logistic regression puts the output of the linear regression through a function that scales it to 0~1.0
cerulean kayak
but not such that the output are either the integers 1 or 0?
because otherwise it is a regression problem as he claimed
agile cobalt
you just take a cut like output >= 0.5 after the scaling
cerulean kayak
agile cobalt
you just take a cut like `output >= 0.5` after the scaling
So according to stackexchange:
Logistic regression is emphatically not a classification algorithm on its own. It is only a classification algorithm in combination with a decision rule that makes dichotomous the predicted probabilities of the outcome.
So by decision rule do they mean if the algorithem gives you an output >=0.5: True else: false
and said cut is the decision rule?
dire violet
warm copper
https://scikit-learn.org/stable/modules/generated/sklearn.preprocessing.LabelEnc...
im confused how that works. im looking at the example right now and ```py
le = preprocessing.LabelEncoder()
le.fit(["paris", "paris", "tokyo", "amsterdam"])
LabelEncoder()
list(le.classes_)
['amsterdam', 'paris', 'tokyo']
le.transform(["tokyo", "tokyo", "paris"])
array([2, 2, 1]...)
list(le.inverse_transform([2, 2, 1]))
['tokyo', 'tokyo', 'paris']
would the fit method be what you compare your values to?Im a bit confused by the suggestion, and just wanted to throw in; perhaps a pandas melt would achieve what you are going for
warm copper
For example
‘’’# Get Dummy Values for Status
enc = OrdinalEncoder(dtype=int)
bankruptcy[['Status']] = enc.fit_transform(bankruptcy[['Status']])
print(bankruptcy.head())
print(bankruptcy.info())’’’
dire violet
so like my goal is, instead of having multiple columns having how frequently it appears, i want it to be just one column like:
1,4,2,5 and the number correspondes with how frequent, and the order they appear matches the order the columns appeared in the original image
warm copper
So you choose columns
And turn the values stored in them into numbers
Jesus code syntaxing is not working on mobile
Hmmmmm
What you can do then is just change the values @dire violet
Use replace
dire violet
how would that work? do i loop through each cell? i've read online that for larger datasets its very inefficient
or is replace a method
warm copper

pandas.DataFrame.replace() function is used to replace values in column (one value with another value on all columns). This method takes to_replace,
@dire violet
warm copper
No problem
dire violet
dire violet
i currently have something like this in my csv and i wanted to convert it to jus...
another question, it's not really towards the code this time but more so logic. The list that i have only contains 5 elements because I wanted to alter it based on a scale of 1-5. however there are 8 unique answers in the dataset. what would be a good approach to include the 3 others
warm copper
Hmmm
You can combine them?
Let’s say I have beginner lower intermediate intermediate upper intermediate and advanced
I can just say lower and upper intermediate is intermediate
And number it as 2
dire violet
hmm so use a dict i guess?
dire violet
i see, alright
warm copper
I think there’s an example on that website with dictionary
dire violet
let me check
warm copper
It’s the 5th option
It says replace with dictionary
@dim olive sir how do I get a helper role
dire violet
oh thats useful
warm copper
Lol
dire violet
warm copper
https://sparkbyexamples.com/pandas/pandas-replace-by-examples/?expand_article=1
is it possible to restrain it to only replace within x-y columns?
dire violet
i meant like from this column to that column
only replace values in between those 2 columns
warm copper
you can specificy the column
dire violet
is that a parameter?
warm copper
df['column name'] = df['column name'].replace(['old value'], 'new value')```oh
warm copper
replacement_mapping_dict = {
    "The Fellowship Of The Ring": "The Fellowship of the Ring",
    "The Return Of The King": "The Return of the King"
}
df["Film"].replace(replacement_mapping_dict)
so you create a dictionary
and the use that dictionary on the columns you want
fluency = {
        "Advanced" : 1,
        "Intermediate" : 2,
        "Beginner" : 3
}

df[['Student French Status', 'Student English Status']].replace(fluency)
like this @dire violet
dire violet
sorry what does the first code block have to do with the second one?
warm copper
There are two different examples
I see you have Never Once a month a few times a week once a day and several times a day
so
frequency = {
  "Never" : 0,
  "Once a month" : 1,
  "Few times a week" : 2,
  "Once a day" : 3,
  "Several times a day" : 4
}
Lets say you have different columns like
What is your weekly fish intake, what is your weekly red meat intake, what is your weekly poultry intake and what is your weekly vegetable intake
you can map your values to those columns
lets assume the dataset is called nutrition
frequency = {
  "Never" : 0,
  "Once a month" : 1,
  "Few times a week" : 2,
  "Once a day" : 3,
  "Several times a day" : 4
}

nutrition[['What is your weekly fish intake', 'What is your weekly red meat intake']].replace(frequency)
I only chose fish and read meat here as you see
and mapped the new values into those columns
left tartan
But still: doesn’t the question still require a melt? Original question was about narrowing multiple columns to a single column.
(Even after coding)
warm copper
single column?
why does he want them all in single column
Do those columns have the same column name?
if so he can do that
@left tartan
he can do this I think
concat_values= np.concatenate([df1.A.values,df1.B.values])
or something like this
pd.concat([df.loc[:, col] for col in df.columns], axis = 0, ignore_index=True)
stan are you still with us? @dire violet
 dire violet
yeah sorry im just trying to apply this rn
warm copper
okay
left tartan
warm copper
<@738234281146712084>
Yah, I think that’ll work too. I was just going to the original message which mentioned one column: #data-science-and-ml message
warm copper
damn thats an ass long column
dire violet
did i do something wrong? ```py
categories = {
"Never":1,
"Once a month":2,
"Less Often":2,
"Few times a week":3,
"Often":3,
"Once a day":4,
"Several times a day":5,
"In every meal":5
}
df[['What is your weekly food intake frequency of the following food categories: [Sweet foods]',
'What is your weekly food intake frequency of the following food categories: [Salty foods]',
'What is your weekly food intake frequency of the following food categories: [Fresh fruit]',
'What is your weekly food intake frequency of the following food categories: [Fresh vegetables]',
'What is your weekly food intake frequency of the following food categories: [Oily, fried foods]',
'What is your weekly food intake frequency of the following food categories: [Meat]',
'What is your weekly food intake frequency of the following food categories: [Seafood ]',
'How frequently do you consume these beverages [Tea]',
'How frequently do you consume these beverages [Coffee]',
'How frequently do you consume these beverages [Aerated (Soft) Drinks]',
'How frequently do you consume these beverages [Fruit Juices (Fresh/Packaged)]',
'How frequently do you consume these beverages [Dairy Beverages (Milk, Milkshakes, Smoothies, Buttermilk, etc)]']].replace(categories)
print(df['What is your weekly food intake frequency of the following food categories: [Sweet foods]'])
lil bit messy but after i print, it the column still has strings and not numbersso what does it say when you type the values in columns
does it say string?
df['DataFrame Column'] = pd.to_numeric(df['DataFrame Column'])
its probably because you used a dictionary
left tartan
Like, im imagining a df with a ‘food type’ and ‘frequency’ column, rather than a column per question.
warm copper
pd.to_numeric will make the column values numbers
yeah
would you mind sending me the dataset?
maybe I can help you faster
warm copper
thanks
dire violet
im gonna be gone for a bit, ill come back though
 fast jay
hey everyone
i am having issue with github pages
it is not generating the link
what should i do
warm copper
categories = {
    "Never": 1,
    "Once a month": 2,
    "Less often": 2,
    "Few times a week": 3,
    "Often": 3,
    "Once a day": 4,
    "Several times a day": 5,
    "In every meal": 5
}

df.iloc[:, [7, 8, 9, 10, 11, 12, 13, 14, 15, 16, 17, 18]] = \
    df.iloc[:, [7, 8, 9, 10, 11, 12, 13, 14, 15, 16, 17, 18]].replace(categories)

print(df['What is your weekly food intake frequency of the following food categories: [Sweet foods]'])
@dire violet
so your problem was that you didnt assign variables to your replacements
also instead of using the long names of columns you can just refer to their index locations
iloc[Row:Column]
we need all the rows and columns from 7 to 18
so we can use df.iloc[:, [7,8,9,...]]
so basically you need to
this is an example:
df.iloc[:, [7, 8,...]] = df.iloc[:, [7, 8,...]]
.replace(categories)
or the long way
df[['Sweet Food', 'Fruit Juice',...]] = df[['Sweet Food', 'Fruit Juice',...]].replace(categories)
first one is quicker and easier
less typing more fun
😄
 lone plaza
Hello hope you're all well. I've got a question regarding the loss of neural network and it's correlation to accuracy. I go with the assumption that as I decrease the loss, I get an increase in accuracy. For some reason in my case it seems to be the opposite of, in fact it even slightly increases as accuracy increases

Can somebody explain to me why I observe this behavior?
woeful hatch
Im having a problem with langchain's write file tool
If we ask it to "create a file hello there.txt with content as hello there"
then it will start a new chain and then return this:
{
  "action": "write_file",
  "action_input": {
    "file_path": "hello there.txt",
    "text": "hello there"
  }
}
Sometimes it works and completes the action but most of the times it returns the above dict without completing the action
Code used:
toolkit = FileManagementToolkit()

memory = ConversationBufferMemory(
    memory_key="chat_history")

llm = ChatOpenAI(temperature=0.5,
                 model="gpt-3.5-turbo-16k-0613",
                 max_tokens=3500)

agent_chain = initialize_agent(toolkit.get_tools(), llm, agent=AgentType.STRUCTURED_CHAT_ZERO_SHOT_REACT_DESCRIPTION, early_stopping_method='generate',
                               verbose=True, memory=memory)
while True:
    text = input("User: ")
    if text == "quit":
        break
    else:
        output = agent_chain.run(input=text)
        print("AI:", output)
This does not have to be the case. You can have the loss decrease by the model being more confident in it's decision. F.e. predicting [0.01, 0.99] instead of [0.3, 0.7] for class 1 and 2. If the actual label is class 2, then the loss decreases, but the accuracy remains the same (argmax is still class 2)
In general when the loss decreases, the model performs better, and the accuracy will thus likely also go up, but it's not a direct correlation.
mild dirge
lone plaza
Hello hope you're all well. I've got a question regarding the loss of neural net...
This does look like a weird loss curve in the context of the accuracy though, so not sure why acc. goes up here whereas loss goes up from the start
Oh, but you have plotted the accuracy wrong I think, the y values are strings, not floats @lone plaza
That is why you have some many ticks, and they are not necesarily ordered
I would need to see some code to understand why the acc. goes up when loss does not go down
lone plaza
Sorry yeah converted them with an f string to a more readable output I'm currently running np.mean(yhat.argmax(axis = 1) == y.argmax(axis = 1))
left tartan
dire violet
did i do something wrong? ```py
categories = {
"Never":1,
"Once a month"...
What I was suggesting was: ```py
input = """Age,Gender,What would best describe your diet:,Choose all that apply: [I skip meals],Choose all that apply: [I cook my own meals],How many times a week do you order-in or go out to eat?,Are you allergic to any of the following? (Tick all that apply),What is your weekly food intake frequency of the following food categories: [Sweet foods],What is your weekly food intake frequency of the following food categories: [Salty foods],What is your weekly food intake frequency of the following food categories: [Fresh fruit],What is your weekly food intake frequency of the following food categories: [Fresh vegetables],"What is your weekly food intake frequency of the following food categories: [Oily, fried foods]",What is your weekly food intake frequency of the following food categories: [Meat],What is your weekly food intake frequency of the following food categories: [Seafood ],How frequently do you consume these beverages [Tea],How frequently do you consume these beverages [Coffee],How frequently do you consume these beverages [Aerated (Soft) Drinks],How frequently do you consume these beverages [Fruit Juices (Fresh/Packaged)],"How frequently do you consume these beverages [Dairy Beverages (Milk, Milkshakes, Smoothies, Buttermilk, etc)]","What is your water consumption like (in a day, 1 cup=250ml approx)",
18-24,Male,Pollotarian (Vegetarian who consumes poultry and white meat but no red meat),Rarely,Sometimes,4,Milk,Less often,Once a day,Less often,Once a day,Less often,Often,Often,Never,Never,Less often,Never,Less often,More than 15 cups,
18-24,Male,Vegetarian (No egg or meat),Rarely,Rarely,1,I do not have any allergies,Often,Often,Less often,Often,Often,Never,Never,Less often,Never,Often,Once a day,Often,11-14 cups,"""
from io import StringIO
import pandas as pd
csv_file = StringIO(input)
df = pd.read_csv(csv_file)
df = df.reset_index().melt(id_vars=["index", "Age", "Gender"])
print(df)
This'll give you index, age, gender, variable, value as columns, and you can regroup this however you want.
(variable being the original question, and value being the response).
lapis sequoia
hello, i'm trying to develop a simple object detection model with a fully connected layer at the end that does bounding box regression. The model is doing really well but it takes too much to converge (>>200epochs). Is there a way to make it converge faster?
cold osprey
Increase learning rate
 civic elm
TIL: chatGPT can make you python scripts that will create synthetic data
try this prompt: "Develop a Python script that generates a synthetic dataset emulating conversations from the '/r/programmerhumor' subreddit as closely as possible to the real data. The dataset should be approximately 1MB in size and cover a timeframe of 3 months from the current date. The generated conversations should resemble the content found on the subreddit while incorporating elements of humor and programming-related topics."
lapis sequoia
cold osprey
Increase learning rate
its already really high. The old version of the model when it was segmentation did it in 8 epochs. I changed to a fully connected head and now it does the performance but after 200 epochs
civic elm
civic elm
try this prompt: "Develop a Python script that generates a synthetic dataset emu...
nvm, the output is kinda garbage
the body of the comments I get are placeholder texts or lorem ipsums. any tips to make those real-like conversations?
 grave summit
guys i'm trying to filter a pandas dataframe as follows
std = pun2022['log_rtn'].std()

for k in range(len(pun2022)):
    if abs(pun2022['log_rtn'][k])>2.5*std:
        pun2022 = pun2022.drop(pun2022.index[k])
but i get this error when running the code
  File "C:\Users\Simone\AppData\Local\Programs\Python\Python311\Lib\site-packages\pandas\core\indexes\base.py", line 3652, in get_loc
    return self._engine.get_loc(casted_key)
           ^^^^^^^^^^^^^^^^^^^^^^^^^^^^^^^^
  File "pandas\_libs\index.pyx", line 147, in pandas._libs.index.IndexEngine.get_loc
  File "pandas\_libs\index.pyx", line 176, in pandas._libs.index.IndexEngine.get_loc
  File "pandas\_libs\hashtable_class_helper.pxi", line 2606, in pandas._libs.hashtable.Int64HashTable.get_item
  File "pandas\_libs\hashtable_class_helper.pxi", line 2630, in pandas._libs.hashtable.Int64HashTable.get_item
KeyError: 6

The above exception was the direct cause of the following exception:

Traceback (most recent call last):
  File "c:\Users\Simone\Desktop\power\forward_curvebuilder\pun22returns.py", line 41, in <module>
    if abs(pun2022['log_rtn'][k])>2.5*std:
           ~~~~~~~~~~~~~~~~~~^^^
  File "C:\Users\Simone\AppData\Local\Programs\Python\Python311\Lib\site-packages\pandas\core\series.py", line 1007, in __getitem__
    return self._get_value(key)
           ^^^^^^^^^^^^^^^^^^^^
  File "C:\Users\Simone\AppData\Local\Programs\Python\Python311\Lib\site-packages\pandas\core\series.py", line 1116, in _get_value
    loc = self.index.get_loc(label)
          ^^^^^^^^^^^^^^^^^^^^^^^^^
  File "C:\Users\Simone\AppData\Local\Programs\Python\Python311\Lib\site-packages\pandas\core\indexes\base.py", line 3654, in get_loc
    raise KeyError(key) from err
KeyError: 6```i have no clue what does this mean
can somebody provide any help
rare socket
Hello, I’m trying to find somebody who has used Meta’s Segment Anything Model (SAM) . I just have a few questions about GPU requirements as I am trying to do a segmentation about every 300ms if that is possible. Thanks
potent sky
rare socket
Hello, I’m trying to find somebody who has used Meta’s Segment Anything Model (S...
Should be possible, I was getting 1s on a 2080 I think, don't rem the numbers for the better GPUs
Btw any recs on reading material for PAC learning?
A good mathematical treatment preferably
rare socket
potent sky
Should be possible, I was getting 1s on a 2080 I think, don't rem the numbers fo...
thank you
 turbid fox
what are some good online courses in machine learning?
potent sky
turbid fox
what are some good online courses in machine learning?
There's Andrew Ng's Machine Learning course and Deep Learning specialization, there's MITs intro to deep learning, there's Oxford's Mathematics for Machine Learning
Why are you seeking only courses tho
turbid fox
potent sky
There's Andrew Ng's Machine Learning course and Deep Learning specialization, th...
Thanks, do you have any recommendations? And .. because i’m a full time computer science student and there aren’t really any machine learning courses offered where i attend
potent sky
turbid fox
Thanks, do you have any recommendations? And .. because i’m a full time compute...
There are a lot of courses, the ones I named are some good ones I've come across
In addition there are some good books too, for example
https://www.statlearning.com/
https://deeplearningbook.org/
https://github.com/mml-book/mml-book.github.io/tree/master/book
(These are the freely available online ones)
An Introduction to Statistical Learning

GitHub
Companion webpage to the book "Mathematics For Machine Learning" - mml-book.github.io/book at master · mml-book/mml-book.github.io
 lapis drum
Has anyone done any graphs/bar charts in Python? Any good libraries to recommend? Looking for something very simple to show bar graphs in CLI output, kind of like https://github.com/mkaz/termgraph (not sure if that is maintained)
GitHub
a python command-line tool which draws basic graphs in the terminal - GitHub - mkaz/termgraph: a python command-line tool which draws basic graphs in the terminal
tidal bough
lapis drum
Has anyone done any graphs/bar charts in Python? Any good libraries to recommend...
https://github.com/piccolomo/plotext seems to have been updated within a year, so might be working still.
GitHub
plotting on terminal. Contribute to piccolomo/plotext development by creating an account on GitHub.
potent sky
potent sky
Btw any recs on reading material for PAC learning?
This prolly got buried under other messages so
void veldt
lapis drum
Has anyone done any graphs/bar charts in Python? Any good libraries to recommend...
I've heard a lot of people use seaborn. I personally prefer matlab just due to increased flexibility
should be noted seaborn uses matlab, they just have a lot of pretty easy/quick to use default
tidal bough
you mean matplotlib?
potent sky
A data scientist's role often involves presentation, seaborn has readily available abstractions that are arguably "neater" or more visually appealing to present
That could be one reason ig
young granite
potent sky
A data scientist's role often involves presentation, seaborn has readily availab...
cause dashboards are also a thing in DS i would suggest checking plotly/dash also
turbid fox
potent sky
There are a lot of courses, the ones I named are some good ones I've come across...
Thanks 🙂
dire violet
warm copper
```python
categories = {
"Never": 1,
"Once a month": 2,
"Less often"...
i see, thanks
 olive bough
civic elm
try this prompt: "Develop a Python script that generates a synthetic dataset emu...
olive bough
civic elm
try this prompt: "Develop a Python script that generates a synthetic dataset emu...
That is impressive tbh
civic elm
agreed. really impressive. you can improve it from there too
maybe ask it to use a transformer
lapis sequoia
Thought I'd share some pretty output that came out of my code today. Got it producing correct-looking output for the first time!

These are a kind of microscopic magnetic structure called spin helices.
tidal bough
i was going to ask if this is a toeplitz matrix, @wooden sail corrupted me
wooden sail
tidal bough
i was going to ask if this is a toeplitz matrix, <@467435887236612106> corrupted...
it is
tidal bough
i mean, sure
warm copper
hi friend @wooden sail
tidal bough
but a wild example rather than a domesticated one :p
in fact, it looks like it's even a circulant matrix
warm copper
@dire violet how is your project going
dire violet
warm copper
<@774352602678558790> how is your project going
little better, i've realized i might not be headed in the right direction in the first place so i wanted to try and find a model to use. i'm looking at microsoft/recommenders right now and a bit confused on how to get it set up. by the way, idk if i mentioned or not but my goal was to build a recipe/restaurant recommender so yeah
just trying to get myself more familiarized with these models in the first place, before actually trying to create/train a model
dire violet
i want it to create recommendations based on the user data. the one i had before isnt exactly my goal for user data but it was something i wanted to get started with. my end goal for a dataset to train a model with is something like:
 warm copper
yeah this may not give you a lot
but you can see the dietery preferences based on gender and age group @dire violet
or even based on gender age group combo
like under 18 and male
under 18 and female
dire violet
yeah that part was pretty good too
also thats why i wanted to convert the "never, often" part into numbers perhaps, so then i could somehow rewrite that into the preferred foods
warm copper
you can also do predictions
dire violet
predictions?
warm copper
random tree prediction
dire violet
i read a little on that, how do i use that though?
warm copper
to see if you can actually predict the dietary choices of male and female
its an algorithm that has a great use in categorical predictions
you wanna know the relationship between male and dietary habits
it may come handy
am i rite @wooden sail
@tidal bough is also good with ML
you may need to tweak your dataset for your goal tho @dire violet
did you collect this dataset by yourself?
dire violet
dire violet
i want it to create recommendations based on the user data. the one i had before...
the original one or this one
dire violet
warm copper
did you collect this dataset by yourself?
no i found it on kraggle
warm copper
kaggle has good datasets
dire violet
yeah but how do i use predictions to create a recommendation system? based on my understanding it sorts "items" into 2 categories right
dire violet
im not following, what are those?
warm copper
well in statistics you have explanatory variables and response variables
An explanatory variable is what you manipulate or observe changes in (e.g., caffeine dose), while a response variable is what changes as a result (e.g., reaction times).
left tartan
In an economic model, an exogenous variable is one whose measure is determined outside the model and is imposed on the model, and an exogenous change is a change in an exogenous variable.: p. 8 : p. 202 : p. 8 In contrast, an endogenous variable is a variable whose measure is determined by the model. An endogenous change is a change in an endoge...
🙂
sick ember
How can I tell my model is overfitting?
Validation increase rapid to 95% at epoch 83 then decrease afterward
warm copper
its more about how two variables interact @left tartan
dire violet
billybobby always popping into the conversation lol, hi again
left tartan
True, I was just making a joke about how many confusingly similar terms there are 🙂
dire violet
warm copper
An explanatory variable is what you manipulate or observe changes in (e.g., caff...
oh so like independant and dependat variables
i see, how does that go back to the recommender though?
sick ember
sick ember
How can I tell my model is overfitting?
can someone please quickly confirm for me ;-;
warm copper
Your model is overfitting your training data when you see that the model performs well on the training data but does not perform well on the evaluation data. @sick ember
you need to compare your training data with your test data
sick ember
warm copper
Your model is overfitting your training data when you see that the model perform...
Validation increase rapid to 95% at epoch 83 then decrease afterward, out of a total of 100 epochs, while training keep increase to 94%, is that overfitting?
warm copper
no
sick ember
okay i was worry lol
 sick ember
warm copper
the difference would much more
sick ember
warm copper
the difference would much more
thank you!
warm copper
look at this one
sick ember
warm copper
look at this one
thats overfitting?
dire violet
dire violet
i see, how does that go back to the recommender though?
@warm copper ?
warm copper
recommender?
dire violet
the food recommender, reicpe restaraunt suggestions
olive bough
dire violet
yeah that part was pretty good too
perhaps add in weight? nationality (to cater for personal/cultural nuances)
warm copper
so what you can do is
you can use all this data
and add another variable
called preference
based on the answers from all the questions this preference variable tells what they would like to have
someone vegeterian he doesnt eat sugar he consumes veggies
what kind of food can you serve them?
dire violet
olive bough
perhaps add in weight? nationality (to cater for personal/cultural nuances)
that was sorta the goal with the liked cuisines part
dire violet
warm copper
what kind of food can you serve them?
uh.. vegetables? what type would the preference variable be? little bit confused on the purpose of it
warm copper
so you want restaurant to use the data to predict what a guest wants?
so they can make recommendations?
civic elm
Is the distilbert-base-uncased model the most recommended model for commercial use?
warm copper
you would need to know the menu of the restaurant I think
dire violet
warm copper
so they can make recommendations?
not exactly, just an app to create suggestions for recipes/restaraunts for what the user would like to cook/eat (each individually, like you could suggest restaraunt or recipe)
based on what the user likes, or his user data
warm copper
I mean do you really need a machine learning algorithm for that?
you can just get user input and filter out restaurants based on the input
lets say the user says they are vegetarian
then you can filter to show vegeterian restaurants only
you would need a database of restaurants and users to do it @dire violet
Like there can be several prompts
What is your dietery preference?
Do you have allergies?
civic elm
Maybe age, weight, height of the customer can be an input
warm copper
I mean does that really matter when you look for a restaurant?
do you enter your age weight and height when you use Yelp?
dire violet
yeah but i dont want it to need user input, like for example based on past dishes/restaraunts the user liked and maybe contextual data (what time it is, lunch, dinner) then suggest a restaraunt to eat at
warm copper
okay
then you wouldnt need any of this info
if the user is vegeterian or not
you could use their likes and suggest based on those likes
the user likes burger bean
a recommendation would be like any restaurant that serves burger bean
that requires a big database tho
do you have an access to such database?
to me this sounds like a big project
dire violet
well could you not use yelp api for example?
left tartan
Perhaps of interest; https://research.netflix.com/research-area/recommendations
Netflix Research - Join Our Team Today
warm copper
is it free?
left tartan
(Collab filtering is one approach here)
warm copper
looks like you can do that way @dire violet
dire violet
i was looking a little bit towards that direction too, i found collab filtering and content-based filtering (perhaps for recipes) and a mix of both using hybrid but not sure on how to get started with either
warm copper

In this tutorial, you'll learn about collaborative filtering, which is one of the most common approaches for building recommender systems. You'll cover the various types of algorithms that fall under this category and see how to implement them in Python.
isnt this what targeted ads are @left tartan
olive bough
left tartan
Perhaps of interest; https://research.netflix.com/research-area/recommendations
fascinating, first time i am stumbling
across this link, thanks 🙂
olive bough
dire violet
that was sorta the goal with the liked cuisines part
makes sense
dire violet
warm copper
https://realpython.com/build-recommendation-engine-collaborative-filtering/#:~:t...
how would i use the user data? if at all
dire violet
warm copper
i guess you would have a dietery matrix
would the goal be to combine something like the collab filtering and movie recommendation system?
 sharp harbor
Any good recomendations on guided data science projects for beginners?
warm copper
yeah @dire violet
left tartan
warm copper
isnt this what targeted ads are <@738234281146712084>
There are many ways of targeting/recommendations. Collab filtering is one strategy, relying on particular knowledge of cohort interests.
crimson summit
with regards to DQN are the experiences which are stored in the memory buffer created in the prediction network and then from those expirences a random batch is taken and fed simultaneoulsy into the target and prediction network and then the loss is calculated ? Does that seem correct ? @wooden sail @iron basalt
 dire violet
warm copper
yeah <@774352602678558790>
dire violet
warm copper
yeah <@774352602678558790>
how would i go at creating that? do movie recommendation systems use content based filtering (read a little on that). If so, would my best bet to be to go with a hybrid
left tartan
I’d suggest first reading a bit on the different strategies for recommendation systems and deciding what’s appropriate for your use case. Such as https://thingsolver.com/introduction-to-recommender-systems/
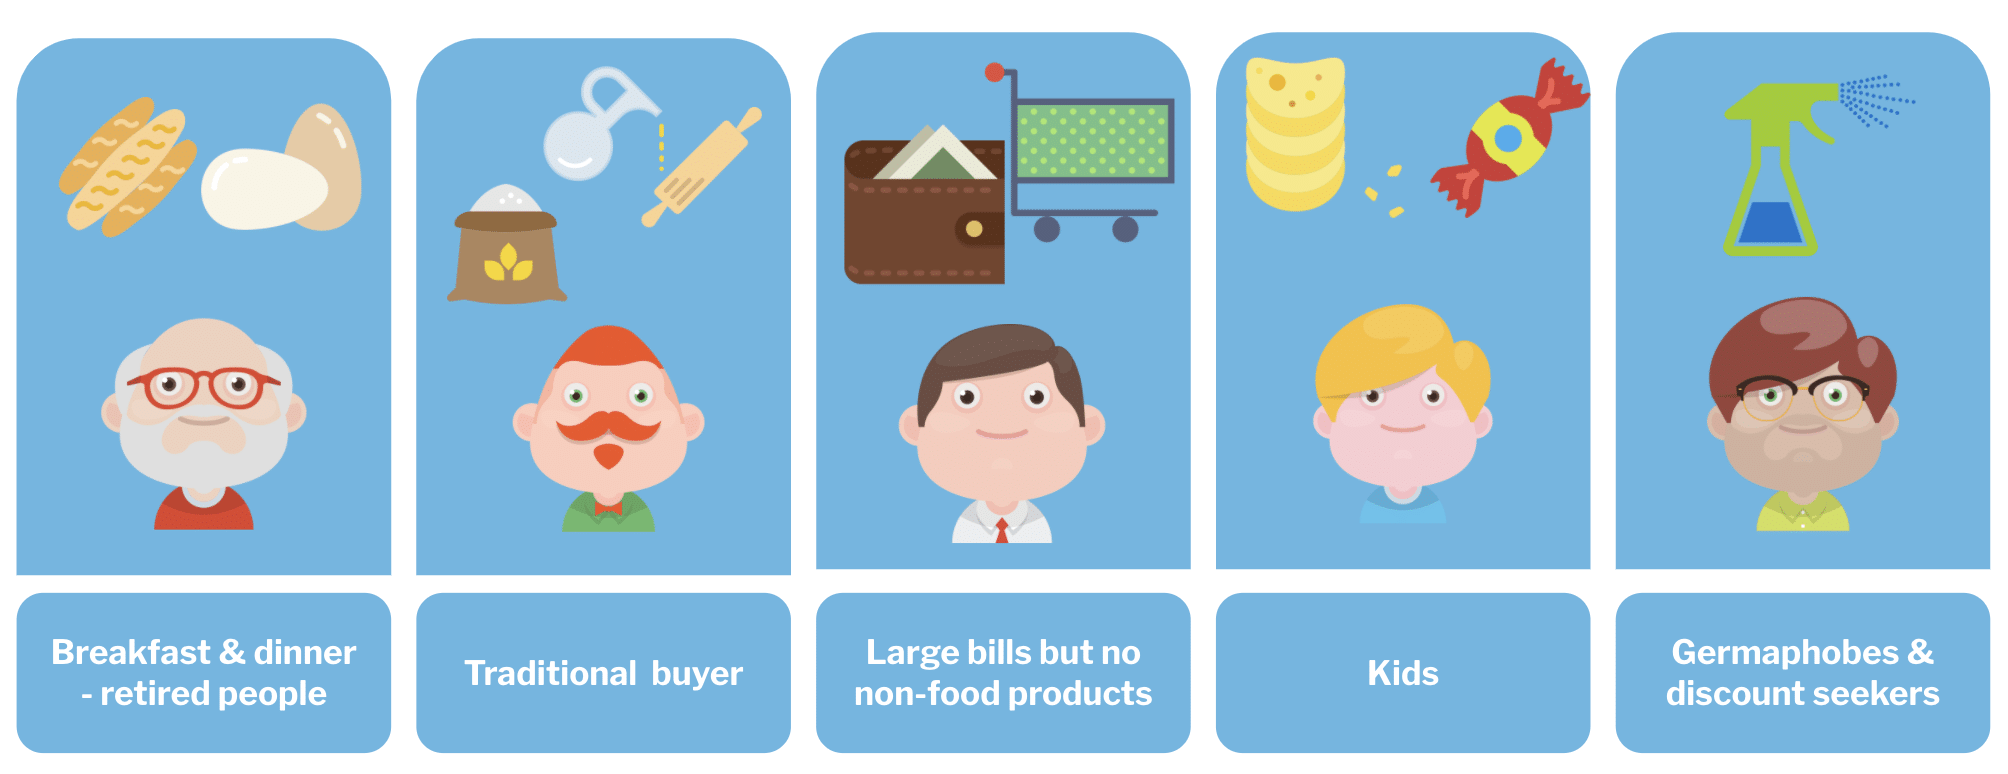
I came up with the idea to write a text that can help beginners to understand the basic ideas of the recommender systems.
Wikipedia is also pretty good here, https://en.m.wikipedia.org/wiki/Recommender_system
A recommender system, or a recommendation system (sometimes replacing 'system' with a synonym such as platform or engine), is a subclass of information filtering system that provide suggestions for items that are most pertinent to a particular user. Typically, the suggestions refer to various decision-making processes, such as what product to pu...
And then end on some Python examples, like https://dantegates.github.io/2020/04/21/a-tutorial-on-collaborative-filtering-in-sklearn.html
Given the vast amount of entertainment consumed on Netflix and amount of shopping done through Amazon it’s a safe bet to claim that collaborative filtering gets more public exposure (wittingly or not) than any other machine learning application.
dire violet
alright thank you so much, i'll look into it
iron basalt
crimson summit
with regards to DQN are the experiences which are stored in the memory buffer c...
Yeah.
The idea is that you keep Q' fixed for a while for stability.
crimson summit
iron basalt
The idea is that you keep Q' fixed for a while for stability.
the expiriences from the buffer are fed into both networks simultaneously then loss calculated correct ?
iron basalt
crimson summit
the expiriences from the buffer are fed into both networks simultaneously then l...
Take a look at this tutorial: https://huggingface.co/blog/deep-rl-dqn

DQNs are popular enough that there are tons of different ways of it being explained.
 crimson summit
iron basalt
DQNs are popular enough that there are tons of different ways of it being explai...
crimson summit
iron basalt
DQNs are popular enough that there are tons of different ways of it being explai...
okay nice
thx man
dire violet
@warm copper hey i was just wondering. im looking into content and collaborative filtering now. i see that th ey both require a little bit of data to begin with however for my app, i dont have that (well not yet until the app is actually finished) would there be a method that collects data as it goes?
 arctic wedgeBOT
:incoming_envelope: :ok_hand: applied warning to @agile island.
 royal crest

 nova pollen

 slender kestrel
ayo can anyone how we use svm for face recognition i mean
svm work when we have multiple objects of same class right
but in face recognition we have one object(photo of 1 person) for 1 class (1 single person
 junior schooner
Hi all, I'm pretty new to the field of DS and AI.
I'm interested in playing with live and historical market data to see if any insight or pattern recognition can be used to execute orders on a paper trading account. The latter is the easy part, but can anyone point me towards any resources where I can get some knowledge or a fundamental framework of what I would need to look at to gain those insights (Basically how to direct the buy/sell orders).
I think an equally big point of failure here is I don't know much about trading or technical analysis at all lol. Maybe its a fools errand but hopefully I'll learn something at the least.
 pseudo spire
@junior schooner Stocks prices can't be predicted (at least without real-time news processing). Technical analysis doesn't work in case of 100% efficient markets -- see efficient market hypothesis.
left tartan
pseudo spire
<@741064625684217916> Stocks prices can't be predicted (at least without real-ti...
I agree with the principle that: it’s tough, there are many ‘dead bodies’ who’ve tried, etc, but there are many funds who are finding alpha. So, I’d say: this is a contentious topic where many people disagree.
(I don’t want to degrade into a debate about the EMH, just don’t want to discourage someone from trying on a paper trading basis)
lapis sequoia
Hello everyone, i'm building a multitask model that does bounding box regression and classification. My model is doing pretty well but i want to improve it a little more. I'm using loss function: BCE + IOU. I was using SGD and i tried to change it to Adam and the values started to go wrong and the value of iou is now negative with really large values (-10000000) and i don't know where the error is. Can someone help me with this?
pseudo spire
left tartan
I agree with the principle that: it’s tough, there are many ‘dead bodies’ who’ve...
Everyone says they found alpha? Well you say it too
left tartan
junior schooner
Hi all, I'm pretty new to the field of DS and AI.
I'm interested in playing wit...
This is a great and interesting question, there are many facets. Check out some of the threads on Reddit /r/algotrading. From an order execution perspective, you’d need to select a broker platform, which will have a proprietary api for order execution. They’ll generally provide a market data feed. you’ll want to learn about backtesting and how to evaluate your backtests. You’ll need to understand risk management (and there’s some great YouTube channels, on the psychology of trading; it’s very much gambling).
left tartan
pseudo spire
Everyone says they found alpha? Well you say it too
Not to be snarky, but are you suggesting that nobody has made money on the market?
pseudo spire
Just say it too and you will be fine. This can't go wrong as long this is not your money
mild dirge
Sure, people make money using AI. But you can also make money with blackjack using AI.
Doesn't mean you found the golden ticket. And the companies that are consistently making money with automated stock trading don't share their secrets.
left tartan
Wait, I agree with the point that it’s highly risky and very close to gambling. But, I don’t agree with the point that there’s -zero- alpha to be made
And OP was asking about learning about the subject/etc, on a paper trading account. No reason for us to go all negative on it. Great learning opportunity
pseudo spire
left tartan
Not to be snarky, but are you suggesting that nobody has made money on the marke...
"nobody has made money on the market?" Business-ess make money. They are also presented on the market. So if you own part of the business, you make money with them. (And stock is a part of a business, I probably shouldn't clarified that). However, if someone says they know how to choose the better / the best business, they are either first class professionals, or insiders, or just too self-confident.
Also, if someone says they know exactly when it's cheap (and will 100% go up, well not even 100%... 51% would be enough to generate profit reliably ) or when it's too expensive (and will 51% go down), they are lying to you, they actually don't know.
So there is no science in speculations / daytrading / short interval trading.
There are lots of books about it
That is #offtopic
left tartan
pseudo spire
"nobody has made money on the market?" Business-ess make money. They are also pr...
—- Sorry that was unfair, since I posed the alternative question: my question should have been: ‘is it a valuable learning opportunity for Op?’
junior schooner
left tartan
This is a great and interesting question, there are many facets. Check out some ...
Thank you, that’s very helpful. I’ve already set up a paper account on Alpaca which has a very well documented API, I’ve not played with it yet as I just did it before work. I’ll definitely check out that sub, looks like it’ll have a wealth of information.
left tartan
Yah, just to be fair to the contrarian points: technical analysis (trying to "read" the market) has a lot of voodoo and pseudo-science. There are plenty of people peddling garbage out there, so read any of that stuff with more than a grain of salt.
junior schooner
Ah maybe I used the wrong terminology? I’ve seen some of that stuff and it really doesn’t interest me at all. Just to clarify, I’m not coming into this thinking I’ll find a hack to infinite money. I’m looking to learn more about DS, analysis, maybe ML and the stock market. This is a project I will enjoy working on and will introduce me to those topics. Of course the goal is success, but I won’t be risking money or think this will change my life financially.