#data-science-and-ml
1 messages · Page 62 of 1
 wooden sail
 serene scaffold
hi
wooden sail
i was gonna say "why is that a problem?" but i know the answer
 cold osprey
slots
wooden sail
slots?
serene scaffold
slots
cold osprey
m.2 slots
wooden sail
what about them?
cold osprey
huh
cold osprey
cold osprey
would dual boot but i use a laptop now
slots
serene scaffold
wooden sail
what about them?
if you have more pigeons than slots, you are fucked.
cold osprey
wut
wooden sail
the pigeonslot theorem
wooden sail
cold osprey
slots
what?
cold osprey
no slot for extra ssd
wooden sail
yeah
wooden sail
well that's on you 😛
wooden sail
they're kinda treated the same way logically after partitioning
i thought you were gonna complain about linux and laptop hardware compatibility
over the last 3 years i've gone through several stages of only windows, only linux, dual booting, dual booting + wsl, and windows + wsl depending on how long it takes me to ruin the previous setup
 night prawn
when I press a key the window disappears
 wooden sail
only linux and windows + wsl tick the most boxes so far
cold osprey
wooden sail
i thought you were gonna complain about linux and laptop hardware compatibility
dont get me started
ok ill start
wooden sail
night prawn
when I press a key the window disappears
google says you should run that as admin
cold osprey
wanted to convert my old laptop to be a torrent box/ media centre of sorts
can get ubuntu/mint etc installed and working but it doesnt boot correctly after a restart
night prawn
it's do the same things
cold osprey
night prawn
when I press a key the window disappears
theres a video i followed for tf-gpu and wsl
sec

Welcome to this tutorial on how to install TensorFlow/Keras for use with a GPU on Windows! In this video, we will guide you through the process of setting up TensorFlow/Keras to utilize the power of your GPU, specifically an NVIDIA RTX 6000 (Ada).
Before we get started, it's important to note that the current versions of TensorFlow can only be ...
night prawn
thank
wooden sail
cold osprey
theres a video i followed for tf-gpu and wsl
the issue is in setting up wsl in the first place though
wooden sail
night prawn
thank
which OS are you on? win 10 or 11?
night prawn
wooden sail
which OS are you on? win 10 or 11?
win 10
cold osprey
oh it doesnt
wooden sail
night prawn
win 10
are you on version 2004 (build 19041) or higher?
night prawn
wooden sail
are you on version 2004 (build 19041) or higher?
yes my version is 19044.2965
wooden sail
if running as admin did not solve your problem, try these steps instead https://learn.microsoft.com/en-us/windows/wsl/install-manual

Step by step instructions to manually install WSL on older versions of Windows, rather than using the wsl install command.
 past meteor
Btw WSL has a major issue surrounding networking or something
It doesn't play well with VPNs, it was an issue setting it up on my work machine
You need to edit some obscure linux files but then you should be good to go.
wooden sail
that's kinda weird to hear, since it nats through windows by default
no config should be needed
past meteor
There was a bunch of people in a bunch of git issue treads with the same issue

Gist
Workaround for WSL2 network broken on VPN. GitHub Gist: instantly share code, notes, and snippets.
wooden sail
was about to ask for the link, thanks!
night prawn
i can go windows 11 if it was more easy
past meteor
I use WSL2 on my old desktop and it works like a charm there
wooden sail
super interesting, i use anyconnect as well but haven't had this issue
past meteor
https://github.com/microsoft/WSL/issues/5068 another one

GitHub
I'm using MS v. 2004 (build 19041) with UBUNTU linux on WSL2. When I don't use VPN on windows , everything is fine - I have internet connection on windows and wsl2 ubuntu. But when establis...
wooden sail
maybe i just haven't used them simultaneously
past meteor
But yeah idk
Maybe it happened because I installed WSL when my VPN was on? Idk, all I know is that it's sorted and I'm happy lol
wooden sail
i did that too on my work laptop, but using a different vpn from these
thanks for the info though, i'll star these in case i run into it in the future
night prawn
i used this command Enable-WindowsOptionalFeature -Online -FeatureName Microsoft-Windows-Subsystem-Linux and it seems to work now
wooden sail
yeah i thought that might be it
 jolly dock
My models_dir is in the correct path but ide still says "The system cannot find the path specified."


Can somebody help me please?
 boreal gale
use \ as opposed to /? looks like windows to me, and i don't think the later works for windows. idk i don't use windows really
 young granite
jolly dock
I asked it to chatgpt and it didnt helped too
young granite
jolly dock
I asked it to chatgpt and it didnt helped too
try r"path"
young granite
jolly dock
wdym
r"C:\..."
jolly dock
 jolly dock
Sistem belirtilen yolu bulamıyor means the system cannot find the path specified in turkish
 arctic wedgeBOT
young granite
arctic wedgeBOT
young granite
snippet should be enough
jolly dock

GitHub
Code for the paper "Language Models are Unsupervised Multitask Learners" - gpt-2/generate_unconditional_samples.py at master · openai/gpt-2
young granite
or can u try to load a diff file for example a txt in that folder
jolly dock
I'm trying to use this on my computer but i cant
young granite
did u check manually if the file is there
 young granite
thats a folder not a file
 bright juniper
In what order do FPR and TPR values supposed to be plotted? I want to plot a ROC curve but I get this if I plot what I calculate per epoch of training in order


 scarlet kite
scores_combined_df['HomeAway'] = scores_combined_df['HomeAway'].replace('@', 'A').replace('NaN', 'H')
Any idea why I get this error: TypeError: string indices must be integers, not 'str'
young granite
jolly dock
<@385750261420916736> do you mean this files?
" :models_dir : path to parent folder containing model subfolders
(i.e. contains the <model_name> folder)"
jolly dock
what does this even means
serene scaffold
scarlet kite
```python
scores_combined_df['HomeAway'] = scores_combined_df['HomeAway'].repla...
if you're doing string operations on a series, you have to use the .str. accessor. Also, NaN isn't a string.
young granite
jolly dock
what does this even means
u got a parent folder->models
where model folders are inside
wooden sail
bright juniper
In what order do FPR and TPR values supposed to be plotted? I want to plot a ROC...
my understanding from a very quick glance is that you produce ROC curves by changing the decision threshold, not by plotting how the FPR and TPR change over the epochs
 mild dirge
 young granite
if even that understanding is missing i would suggest starting with the basics @jolly dock
mild dirge
The image on wiki is pretty good
jolly dock
young granite
where model folders are inside
There is a file named model and a folder named models, the folder is in the gpt-2 folder and the file is in the src folder. Which one are we actually talking about

which file/folder are we talking about?
young granite
jolly dock
one is a file other one is a folder
young granite
young granite
u got a parent folder->models
^
jolly dock
young granite
u got a parent folder->models
so that parent folder is gpt-2
because it has models inside of it
young granite
young granite
if even that understanding is missing i would suggest starting with the basics <...
but as mentioned
jolly dock
no.
young granite
then im not the right person to ask im sorry
jolly dock
😭
serene scaffold
scarlet kite
what would I use to replace an NaN colunm with 'H'?
you'd use .fillna('H')
scarlet kite
serene scaffold
you'd use `.fillna('H')`
I still get this error: TypeError: string indices must be integers, not 'str'
bright juniper
wooden sail
my understanding from a very quick glance is that you produce ROC curves by chan...
What is a decision threshold?
young granite
@serene scaffold u got a recommendation for good scoring metrics for a cloud-shaped dataset?
serene scaffold
young granite
<@253696366952316929> u got a recommendation for good scoring metrics for a clou...
idk what that is
serene scaffold
scarlet kite
I still get this error: TypeError: string indices must be integers, not 'str'
please always show the whole error message, starting from Traceback.
scarlet kite
TypeError Traceback (most recent call last)
Cell In[16], line 1
----> 1 scores_combined_df['HomeAway'] = scores_combined_df['HomeAway'].fillna('H')
2 scores_combined_df.head()
TypeError: string indices must be integers, not 'str'
@serene scaffold
serene scaffold
scarlet kite
---------------------------------------------------------------------------
Type...
lookslike scores_combined_df is a string, and not a dataframe.
try restarting your notebook kernel.
serene scaffold
young granite
<@253696366952316929> u got a recommendation for good scoring metrics for a clou...
idk what a cloud shaped dataset is
young granite
serene scaffold
idk what that is
dataset looking like this and im searching for scoring metrics
 serene scaffold
young granite
dataset looking like this and im searching for scoring metrics
serene scaffold
young granite
dataset looking like this and im searching for scoring metrics
what is that
what do the colors and the dots represent
serene scaffold
that's pretty vague
if you said the dots represented numbers, that would be less vague, but you wouldn't accept that as answer if our roles were reversed.
wooden sail
bright juniper
What is a decision threshold?
well, in your case, you're learning some parameters that make the classification. you can interpret it as your network learning the parameters that make the decision as good as possible. you'd plot it in the order you get the results per epoch then, as you did
but the plot will not look as nice as conventional ones because sgd does not follow a nice pattern in general
young granite
serene scaffold
if you said the dots represented numbers, that would be less vague, but you woul...
x,y coordinates of data colors represent IDs and i got targets assigned to each ID
wooden sail
what you plotted is already "correct"
serene scaffold
young granite
x,y coordinates of data colors represent IDs and i got targets assigned to each ...
if they're (x, y) coordinates, why is it in a circle?
young granite
serene scaffold
if they're (x, y) coordinates, why is it in a circle?
cause its not my data (cause i cant show that here) and im using a google picture but its from a clustering approach so that wouldnt model my data well

 agile cobalt
its not my data (cause i cant show that here)
I strongly recommend asking for help in some place in which you can show your data instead
young granite
agile cobalt
> its not my data (cause i cant show that here)
I strongly recommend asking for ...
but its a general question for sure some ppl here got experience with widespread features and want to compare different models
i dont want to get a deepdive on my usecase just some discussion
generalisation works well but i want better scoring metrics
so i wanted to brainstorm a bit
bright juniper
wooden sail
but the plot will not look as nice as conventional ones because sgd does not fol...
What optimizer should I use then?
wooden sail
bright juniper
What optimizer should I use then?
it'll happen anyway, you kinda can't avoid it. all optimizers used in data-driven methods (like neural networks) are variants of stochastic approximation
lemme see if i can reword what i'm trying to say
bright juniper
I understand, because on some epochs, it gets more falses so it goes back
With Adam it went like this
 wooden sail
you can't make a ROC curve the way you're used to, because those curves are made by changing the decision threshold. instead, you can plot what the current tpr and fpr are given how many epochs you've trained for. this actually represents a single point on the curve, and you track the evolution of this point over epochs. that is why the curve looks so weird.
the only thing you can hope is that the point moves toward the upper left corner over time. whether this happens at all, with which behavior and how fast depends on the optimizer and its hyperparams
wooden sail
this adam one kinda looks like it got worse
i agree. it's better than the other you showed, since the tpr is higher. but it's getting worse
probably an issue with the step size
actually, i'm assuming it started at the left. i don't know that
you could mark the start and end points with something so we can tell them apart
if it started at the right and moved to the left, it got really good
bright juniper
It's weird because the confusion matrix (prediction vs reality labels of the last epoch) tell a different story about this label
 wooden sail
i mean, the behavior in that "ROC" plot you showed is good everywhere
that does match this confusion mat
bright juniper
Doesn't the confusion matrix show true positives on the main diagonal?
wooden sail
yeah
bright juniper
bright juniper
With Adam it went like this
Well how can TPR be so low in the last epoch in this image
wooden sail
0.88 is pretty high
bright juniper
Oh I didn't pay attention to the actual number
wooden sail
that's why i told you, the adam one is great everywhere. much better than the earlier one you showed
but you should really mark the start and end points with some markers
cuz if it started at the right and moved to the left, it got crazy good
if it was backwards, the hyperparams can probably be spiced up a little
could you add some markers and show the plot again?
bright juniper
I don't know how to mark start and end points in matplotlib
I mean I bet I can simply scatter two points
wooden sail
you already did plt.plot, yeah?
bright juniper
Yes
bright juniper
So let me scatter two points of different colors
Red is where it began and green is where it stopped

So ye it learned well
wooden sail
very nice
and so for completeness, what this is doing is tracking a point on a family of ROCs, it's not a ROC itself
(that's me being nitpicky)
bright juniper
Is there a way I can make a ROC out of this or anything
wooden sail
not really
bright juniper
So how does it usually go with decision thresholds
wooden sail
you'd have to modify the parameters of the network by hand to produce different decision thresholds in your case
in the classical way, you'd do something simple. you have data that can be of any of 2 classes (as an example) and you want to pick the threshold at which you say "if x > thresh, it's of class a. otherwise, it's b"
then you vary thresh and plot the tpr vs fpr
vary thresh again, plot tpr vs fpr again.
bright juniper
My classifier is multi class
wooden sail
in your case, this would mean you would modify parameters of the network by hand yourself. and if multiclass, it gets even worse
i only did 2 classes for clarity in the example
bright juniper
I can yoink the class probabilities instead of the classes it predicts by argmaxing though
wooden sail
hmm but that's kinda different
in any case you'd have to modify the parameters to see how the probabilities change
bright juniper
Well if it's 66% sure it's A, can't I say it's 33% sure it's not A?
wooden sail
sure, but how do you then change that %
you do it automatically by training here
this is very much just a nitpick from my side btw
bright juniper
I guess I'll be moving on
jolly dock
fuck it, im gonna play valorant
 merry wadi
Trying access all 2006 players in this API: https://ratings-api.ea.com/v2/entities/m23-ratings but using https://ratings-api.ea.com/v2/entities/m23-ratings?limit=2006 only yields 1000 . Anyone know another way around this?
boreal gale
merry wadi
Trying access all 2006 players in this API: https://ratings-api.ea.com/v2/entiti...
this is not the best place to ask this - but limit is usually paired with offset, offset=1000&limit=1000 give you the next 1000 entries
merry wadi
boreal gale
this is not the best place to ask this - but `limit` is usually paired with `off...
Thank you !
 steel forge
opinion on this assingment for an interview?

 gloomy saddle
steel forge
opinion on this assingment for an interview?
gloomy saddle
steel forge
opinion on this assingment for an interview?
Sounds like it breaks into 2 parts. First is to identify if there is a common pattern to allow navigation or if it needs to be hard coded. Then similar for the actual details. E.g. does one use "contact number" does one use "ph:" and does another use a link
 honest skiff
What is a statistical p-value test?
 queen cradle
honest skiff
What is a statistical p-value test?
queen cradle
honest skiff
What is a statistical p-value test?
The statistical jargon for these is "hypothesis test." The goal of a hypothesis test is to decide between two possibilities. Conventionally, one of these possibilities is called the "null hypothesis" and represents "nothing interesting is happening." The other possibility is called "alternative hypothesis." Usually, the alternative hypothesis is some kind of interesting phenomenon whose existence you'd like to confirm. Most often, the test works as follows: First, decide on a significance level alpha. Usually alpha = 0.05 or alpha = 0.01. Second, collect data. Third, determine how likely the data is under the null hypothesis. In most situations, the alternative hypothesis corresponds to the data being more extreme than we would expect under the null hypothesis. We compute the probability, under the null hypothesis, of observing a result as or more extreme than the actual data. If that probability is less than alpha, we "reject the null hypothesis," meaning we decide that the alternative is likely to be correct.
 steep echo
Hi, I'm relatively new to coding so I'm not familiar with the proper terminology and I don't know exactly what to ask. I am trying to return the value from a pandas dataframe when another function returns true. This has to do with time-series, I need the price from the right column at the time where the other function returns True.
 somber pollen
steep echo
Hi, I'm relatively new to coding so I'm not familiar with the proper terminology...
somber pollen
steep echo
Hi, I'm relatively new to coding so I'm not familiar with the proper terminology...
df["time-series-filtered"] = df["time-series"].map(lambda x: x> some_value)
Is alpha the minimum percentage required for the difference to be considered significant / related to the hypothesis?
queen cradle
honest skiff
Is alpha the minimum percentage required for the difference to be considered sig...
Alpha is the probability under the null hypothesis of getting results as extreme as the actual ones. So if you choose alpha = 0.05, then you're okay with the idea that, with probability 0.05, you will incorrectly reject the null hypothesis (false positive).
steep echo
somber pollen
```python
df["time-series-filtered"] = df["time-series"].map(lambda x: x> some_v...
Ok if I pass in the function directly instead of lambda would that still work? The function runs on multiple assets returning T or F and the Dataframe has these same assets with the price, I need the price from the df at the same time the function returns True. I'm not sure if I'm explaining well enough
serene scaffold
somber pollen
```python
df["time-series-filtered"] = df["time-series"].map(lambda x: x> some_v...
it looks like you're trying to do df['time-series'] > x
somber pollen
serene scaffold
it looks like you're trying to do `df['time-series'] > x`
they specified their function was more complicated, so I was just using that as a placeholder
serene scaffold
if the goal is for df["time-series"].map(lambda x: x> some_value) to reduce the number of rows, they can't add it back as a column of df.
somber pollen
steep echo
Ok if I pass in the function directly instead of lambda would that still work? T...
if you need to apply the map to multiple columns at once I'm pretty sure you could need to modify my example slightly
I don't think that's the goal
It's to have an additional column that communicates the result of some pre-defined computation on the other elements of the row
serene scaffold
the name of the new column has "filtered" in it
somber pollen
serene scaffold
the name of the new column has "filtered" in it
filtered, mapped, i got confused
steep echo
Wait no i'm not trying to add to the dataframe. I want the price information to be pulled from the data frame so I can store it in a separate list.
and then work with that list separately which I can do, its this part that I'm lost on
somber pollen
I mean you could just turn the columns you want into lists, and then use the normal map function
lists of tuples
steep echo
The library I'm working with needs them to be dataframes. Its a paid tool and I'm out of my depth tbh
somber pollen
steep echo
The library I'm working with needs them to be dataframes. Its a paid tool and I'...
ok then you just want to add another column to the dataframe right?
you can use the map function for that as I did earlier, but this time don't name it filtered otherwise sucrelets will come
steep echo
Dataframe has multiple columns (asset names with price descending) with rows (time with price across). I have a function(made in the paid library) that analyzes the columns and returns T or F. I do not know how to grab the price when the function returns True. I don't need to modify the dataframe, I want the value that is in the data frame
honest skiff
queen cradle
Alpha is the probability under the null hypothesis of getting results as extreme...
ahhh okay - so my understanding is this. The p-value is the probability that the results are by chance. Which means we're assuming the rest of the results are by our alternate hypothesis? As in, we're essentially disregarding the p-value% of data?
Sorry - I'm a little confused
somber pollen
steep echo
Dataframe has multiple columns (asset names with price descending) with rows (ti...
I'm pretty sure that you could just use df.where()
and then pass in the lambda function or whatever other function that will be returning true or false
queen cradle
honest skiff
ahhh okay - so my understanding is this. The p-value is the probability that the...
The p-value is the probability of these results if they are by chance. It is not the probability that we got these results by chance. p-values are calculated under the assumption that chance is all there is.
steep echo
somber pollen
I'm pretty sure that you could just use `df.where()`
I've thought this but I don't know what to put. df.where(function, ?, ?)
honest skiff
queen cradle
The p-value is the probability of these results _if_ they are by chance. It is _...
ahh okay - I'm gonna have to watch some videos on this to fully understand. Thank you for your explanations!
queen cradle
honest skiff
ahh okay - I'm gonna have to watch some videos on this to fully understand. Than...
p-values are a very confusing topic. This link might help you: https://www.tandfonline.com/doi/full/10.1080/00031305.2016.1154108.
It starts with an editorial that you can skip. The statement itself is the useful thing.
honest skiff
Gotcha - thank you
steep echo
steep echo
I've thought this but I don't know what to put. ```df.where(function, ?, ?)```
wait if I put df.where(function, df, ?) would that return the entire dataframe or the place where the function is true
 timber flame
Is anyone here interested in learning statistics / math for machine learning with me ?
agile cobalt
steep echo
Dataframe has multiple columns (asset names with price descending) with rows (ti...
can you post a minimum example of what your inputs and desired output look like? if you want to select rows, and that other function returns one boolean per row, you can just use pandas's indexing features like df[bool_series] - I strongly recommend reading the User Guides for getting started & advanced indexing on the official docs if you haven't heard about them
steep echo
agile cobalt
can you post a minimum example of what your inputs and desired output look like?...
i'm not sure where to begin to look on those but I'll try there next. I need the price from the top df when the bottom df crosses a certain threshold (the crossing function is another one taken care of by the vbt library). The function runs on each column so if the 2nd column has T, but the other 2 (or more) are F, I only want the corresponding price

 slow totem
Aight, I want to make a chatbot. I have the basic Intent classification in place, and I am using vector similarities to respond with questions further down the conversation. I want to integrate the two parts, into one nn, which would have context/history recognition. I do not want to use haystack or such libraries :((, would prefer a NN
any help on how would I go about doing it?
somber pollen
slow totem
Aight, I want to make a chatbot. I have the basic Intent classification in place...
if you want context+history, you probably want to use LSTMs or other transformers with attention
past meteor
queen cradle
The statistical jargon for these is "hypothesis test." The goal of a hypothesis ...
The definition is wrong btw. P-values are a nebulous topic. The actual meaning is the probability of getting your test statistic or something more extreme under the null hypothesis. It certainly does not mean your alternative hypothesis is true.
somber pollen
somber pollen
if you want context+history, you probably want to use LSTMs or other transformer...
you can use the embeddings you have as the input the LSTM layer, and then the attention will allow the model to weight different embeddings depending on context
slow totem
somber pollen
if you want context+history, you probably want to use LSTMs or other transformer...
I did try to use a LSTM but ran into some weird issues. I can't show it now as I deleted the code. Could you please give me some resouces for that?
somber pollen
slow totem
I did try to use a LSTM but ran into some weird issues. I can't show it now as I...
yeah no problem one second
somber pollen
slow totem
I did try to use a LSTM but ran into some weird issues. I can't show it now as I...
https://github.com/slaysd/pytorch-sentiment-analysis-classification this repo implements a bunch of different kinds of networks similar to the one I talked about using PyTorch
if you have a specific framework you want to use, I can also find resource for that framework
for almost all of these networks you will want to first tokenize the text, and then embed each token (or word, most of the time, but a small chunk) there are a lot of libraries and resources on how to do this. then you can feed each token into the lstm, it will produce an output that will depend not only on what it was fed, but the order in which the tokens were fed
https://github.com/slaysd/pytorch-sentiment-analysis-classification/blob/b8e8803e86a89b04532777caf4db6712d4c60adf/model.py#L77 this is the actual place where they implement it in that repo
arctic wedgeBOT
model.py line 77
class LSTM_with_Attention(nn.Module):```aaah, gotcha
somber pollen
this is another good tutorial: https://pytorch.org/tutorials/intermediate/seq2seq_translation_tutorial.html
the general term for this type of model is seq2seq because you have lstms on one side that summarize a sequence, and then it's fed into something that kinda does the reverse to produce an output sequence
the last time I actually implemented something like this was a couple of years ago though, and it was really hairy
all of the open source resources are good to learn with, but don't produce amazing results. if you want to get really good results, you kinda have to go down a rabbithole of other techniques to optimize the architecture
if you want a really good resource on how to build a chatgpt style chatbot there's an implementation by Andrej Karpathy: https://github.com/karpathy/minGPT/
slow totem
Thanks a lot!
 dusty bay
import pandas as pd
import matplotlib.pyplot as plt


def plot():
    df = pd.read_csv("RMS Level 2ch.csv", skiprows=[0,1,2])
    x1 = df["Hz"]
    y1 = df["dBSPL"]
    x2 = df["Hz1"]
    y2 = df["dBSPL1"]
    fig, ax = plt.subplots()
    line1 = ax.plot(x1, y1, label="Ch1")
    line2 = ax.plot(x2, y2, label="Ch2")
    leg = ax.legend(fancybox=True)

    lines = [line1,line2]
    lined = {}
    for legline, origline in zip(leg.get_lines(), lines):
        legline.set_picker(True)
        lined[legline] = origline

    def on_pick(event):
        legline = event.artist
        origline = lined[legline]
        visible = not origline.get_visible()
        origline.set_visible(visible)
        legline.set_alpha(1.0 if visible else 0.2)
        fig.canvas.draw()

        #plt.semilogx(self.x, self.y)
    plt.xlabel("Frequency (Hz)")
    plt.ylabel("RMS Level (dBSPL)")

    fig.canvas.mpl_connect('pick_event', on_pick)
    plt.show()

plot()
Why appears Error 'Error tokenizing data. C error: Expected 1 fields in line 5, saw 3' in the code above guys. Anyone can help me 🙂
boreal gale
dusty bay
```
import pandas as pd
import matplotlib.pyplot as plt
def plot():
df = p...
please post your traceback, that's crucial information for debugging
boreal gale
that's my guess too, though i wanted to reinforce the habit of posting traceback upfront hence i held back my guess
 bold timber
I have a question about the decoder block in the Transformers architecture: Is each process of the decoder block only for one token or all of the decoder block is just for one token?

 lapis sequoia
Hello not sure hope this is a good channel to ask my question in. I just got started with python and using jupyter notebookts.
I installed the data science docker container from a github site (dont know the repo atm). But when i connect to the server i do not have autocompletion neither do i get the documentation etc. I have seen some issues being posted on this. So i installed Pylance but checking the LSP did not help. Is there any resource you could point me to that guides me on to how to get this working with a remote jupyter notebook? Using VSCode insiders.
queen cradle
past meteor
The definition is wrong btw. P-values are a nebulous topic. The actual meaning i...
No, the definition is correct, and I did not say "the alternative hypothesis is true." I recommend the ASA statement on p-values that I linked above.
 rich condor
Hi, is anyone familiar with ReLU?
I am trying to understand how ReLu allows a model to recognize complex features whereas a linear model would not.
From chatGPT:
This nonlinearity allows the network to learn complex, nonlinear features such as edges and corners. For example, a filter in the convolutional layer that detects edges might have a negative weight for one side of the edge and a positive weight for the other side. Without the ReLU activation function, the output of this filter would be zero if there is no edge present in the input image, even if there are some positive values in the input image. However, with the ReLU activation function, the positive values in the input image would pass through the filter and produce a non-zero output.
I am having trouble trying to visualize this example that Chatgpt is giving me. Are there any other learning aids I can use to better understand what ReLU actually does in this context?
cold osprey

Tinker with a real neural network right here in your browser.
change activation between linear and any other
change data from one that can be split by a straight line and one that cannot
@rich condor
rich condor
I feel stupid
Idk what i am looking for


What is the significance of the differences here
cold osprey
u gotta run the model
u will that relu will be able to fit this data but linear wont
mild dirge
It's also important to know that a linear combination of a linear combination, will itself just be a linear combination of the initial input.
So if you have 1 linear layer, or 100 linear layers, they can do the exact same.
But that is not the case for non-linear layers
scarlet kite
I've got a pandas df with a list of baseball player stats over the last years. Is there there a way to get a weighted mean of their stats to put more emphasis on recent years?
 plain jungle
DNNs todo Math
agile cobalt
20% accuracy on multiplication and 0% on division?
and telling it which kind of operation to perform?
plain jungle
agile cobalt
20% accuracy on multiplication and 0% on division?
and telling it which kind of ...
Yeah with a test size of 10 it’s a bit challenging to train the DNN. There is the thoerm that given enough nodes you can get 100% but I don’t have the CPU or patience for that lol
serene scaffold
rich condor
Hi, is anyone familiar with ReLU?
I am trying to understand how ReLu allows a m...
don't ask chatgpt for factual information. it might give you correct information most of the time, but it might not, which means you have to check everything that it says against another resource anyway.
if you were to just write out what the ReLU function is, like ReLU(x) = ..., what is it?
I am trying to understand how ReLu allows a model to recognize complex features whereas a linear model would not.
ReLU is an activation function, but here, you're comparing ReLU to a "linear model". It might be that you meant to say "linear activation function", but activation functions are never linear (which is why they're sometimes called "nonlinearities", as in the ChatGPT response).
plain jungle
rich condor
Hi, is anyone familiar with ReLU?
I am trying to understand how ReLu allows a m...
Just a quick tip, try not to use ReLu but instead do LeakyReLu or some other variant. ReLu may result in the dying node problem
agile cobalt
@still moon by "how many times have it gone through each item in the data?" I mean how many batches have it gone through (I'm assuming that you are using 1 epoch = 1 mini batch and that you have a fixed training set?)
 still moon
Oh right uh... batch size is 3200 over 10000 epochs... I'm playing with values though so this is very fluid at the moment lol
cold osprey
3200lel
agile cobalt
uh, "batch size" is how many items you have in each mini batch
I seriously hope that you do not have that many in each?
cold osprey
for 10 samples?
agile cobalt
or you meant 3200 total training examples? (number of rows of the training data)
still moon
I have 37000 records in my database which I'm splitting for training, testing and validation sets
10000 epochs with batch size 3200
I really don't know if this is just a really shit way to train or not but I'm still very new at this stuff so experimenting
batch size 32 over 1000 epochs using the same data doesn't appear to improve accuracy at all
agile cobalt
3200 sounds way too high, try lowering it to like 256 or 320 at most
are you using any regularisation like dropout layers?
still moon
I'm alternating between an L2 layer and a dropout layer to see what differences look like
 fresh tiger
Hey, not sure if this is the right place, but I have a scatter plot that I want to convert to a heatmap showing density of points in areas.
I have been trying to follow a few different posts, in particular I want to achieve the same as this post: https://stackoverflow.com/questions/2369492/generate-a-heatmap-using-a-scatter-data-set.
I first loop through csvs that have the same columns, and extract the 2 columns I base my scatter plot on:
everyMortonValueDf = pd.concat([pd.DataFrame({'morton': data['morton'], 'index': data.index}), everyMortonValueDf.loc[:]]).reset_index(drop=True)
After this loop, I try to plot a heatmap via:
heatmap, xedges, yedges = np.histogram2d(everyMortonValueDf['morton'].values.tolist(), everyMortonValueDf['index'].values.tolist(), bins=(10, 10))


    extent = [xedges[0], xedges[-1], yedges[0], yedges[-1]] # [-1] lets us access the last value of array.
    print(xedges[0])
    print(xedges[-1])
    print(yedges[0])
    print(yedges[-1])

    print(np.count_nonzero(heatmap.T))
    plt.clf()
    #plt.imshow(heatmap.T, extent=extent, origin='lower', cmap="viridis", norm=LogNorm())
   # plt.colorbar()
    plt.imshow(heatmap.T, extent=extent, origin='lower')
    plt.show()
when outputting everyMortonValueDf['morton'].values.tolist() and print(heatmap.T) via a print statement, I do get values, so I know that it doesnt return empty data.
The plot that is output can be seen in the attached screenshot.
I would appreciate any guidance on how to approach this issue.


Stack Overflow
I have a set of X,Y data points (about 10k) that are easy to plot as a scatter plot but that I would like to represent as a heatmap.
I looked through the examples in Matplotlib and they all seem to
As a side note, when plotting contours, I do get an output:
   # Heatmap based on: https://stackoverflow.com/questions/2369492/generate-a-heatmap-using-a-scatter-data-set
    heatmap, xedges, yedges = np.histogram2d(everyMortonValueDf['morton'].values.tolist(), everyMortonValueDf['index'].values.tolist(), bins=(100, 100))


    extent = [xedges[0], xedges[-1], yedges[0], yedges[-1]] # [-1] lets us access the last value of array.
    print(xedges[0])
    print(xedges[-1])

    print(yedges[0])
    print(yedges[-1])

    print(np.count_nonzero(heatmap.T))
    #plt.clf()
    #plt.imshow(heatmap.T, extent=extent, origin='lower', cmap='hot')
    #plt.show()
plt.contour(heatmap.T, extent=extent)``` boreal gale
fresh tiger
Hey, not sure if this is the right place, but I have a scatter plot that I want ...
boreal gale
fresh tiger
Hey, not sure if this is the right place, but I have a scatter plot that I want ...
this is the right place to ask.
if you could post some sample data and a small snippet to make use of that data to reproduce the issue you are seeing, it would really increase the likelihood of you getting the help you require.
still moon
okay 1000 epochs with 32 items per batch gets me higher accuracy with no overfitting
agile cobalt
hard to tell what to try without knowing what your model is like, what your data is like or even which kind of problem you are trying to solve, but you might need to try using a larger model (more layers (deeper) or more features per layers (wider))
 echo vapor
im displaying a 30 fps video with opencv and using a waitkey() parameter of 1000//30 to display each frame with 33 ms delay. I thought this would be right and online sources seem to confirm it, but the video still plays slower than it should be. any idea what might be affecting this? could it be device limitations? im in a 3.8 venv so could it be that?
 hasty mountain
bold timber
I have a question about the decoder block in the Transformers architecture: Is e...
hasty mountain
bold timber
I have a question about the decoder block in the Transformers architecture: Is e...
Each iteration is for each token.
(Batch, d_model) ---> (Batch, vocab_size)
But you can actually use your data in the form of sequences(sequences of words), which will make your Decoder generate a token for each item in the sequence.
(Batch, sequence, d_model) ----> (Batch, sequence, vocab_size)
I've seen a paper where the Batch size were actually the sequence of tokens. In that case, you'd probably have something like (Sequence, d_model) ---> (Sequence, vocab_size)
lapis sequoia
# Get predictions for the test dataset
predictions = model_VGG_2_simple_reg.predict(test_generator)

# Convert predictions to class labels
predicted_labels = np.argmax(predictions, axis=1)

# Get true labels for the test dataset
true_labels = test_generator.labels```Is this the correct way to do it guys?
The accuracy from it and this model_VGG_2_simple_reg.evaluate(test_generator) is vastly different
Like look at this
 agile cobalt
what exactly is model_VGG_2_simple_reg? it should explain what evaluate is doing on the documentation
the loss is a completely different concept from the accuracy though
 broken saffron
I’ve been trying to use OpenAPI’s free tier to generate responses in my program but it says I’ve reached my token limit. I’ve never successfully made a request to the API so I’m not sure how that’s possible. I have max tokens = 50
young granite
someone here know about polarplots?
the r should be the magnitude of my real part and the angle should be related to my imag part, right?
Why when i got a complex val of lets say:
!e
import numpy as np

z = np.array([4e6+4e6j])
r = np.abs(z)
theta = np.angle(z)

print(r, theta)
@young granite :white_check_mark: Your 3.11 eval job has completed with return code 0.
[5656854.24949238] [0.78539816]
what's your question?
young granite
all my frequencies are spread across +3 and -3° and im trying to figure out what a polarplot tells me other then phase information
i guess thats good when im trying to model them with a SVR or LR
wooden sail
depends on what you mean by polar plot
if you just represent the coordinates in a cylindrical system, it will look exactly the same as cartesian ones, it's just a reparametrization
if you plot the polar coords as rectangular, you deform space by the amount specified by the jacobian (should be something like r sin theta)
young granite
im looking at my data x,y (real, imag) and the resulting polar plot for the complex numbers
wooden sail
that would probably look identical to the usual cartesian plot
plain jungle
agile cobalt
20% accuracy on multiplication and 0% on division?
and telling it which kind of ...
Finally got it patched
young granite
yes but im trying to get information out of it and finding the usecase for it 😄
wooden sail
what do you mean by "information" here?
young granite
so its just for visualisation not to determine trends
just to show all info of my complex vals
real vs imag + polarplot sums up pretty much all my complex val got to offer right?
wooden sail
those two are the same thing
young granite
wooden sail
those two are the same thing
but for polar i calc r and theta which are magnitude and phase?
wooden sail
right, but then you wouldn't wanna make a polar plot of that
young granite
can u elaborate
wooden sail
the polar representation is just an alternative parametrization
agile cobalt
broken saffron
I’ve been trying to use OpenAPI’s free tier to generate responses in my program ...
the free tier tokens expire 3 months or so after you register, check your billing page in their website and see if it mentions such
young granite
wooden sail
the polar representation is just an alternative parametrization
but if my data looks like a big circle and in polar its a straight line thats something isnt it?
wooden sail
well, that's if you use polar coordinates and not a polar plot, which is also what i mentioned
wooden sail
i think so. lemme see if i can find the name
eh i can't find it
but you'd wanna find the magnitude and angle, and then do something like plt.plot(magnitudes, angles) without using projection="polar"
young granite
so i can finde correlations in my dataset
wooden sail
here's a MWE of what i mean
the two plots are the same, just using different parameters
1 sec
broken saffron
agile cobalt
the free tier tokens expire 3 months or so after you register, check your billin...
Thank you
wooden sail
idk if this will look good here
!e
import numpy as np
import matplotlib.pyplot as plt

x = np.random.uniform(-1, 1, size=(5,)) + \
    1j*np.random.uniform(-1, 1, size=(5,))
real = np.real(x)
imag = np.imag(x)
r = np.abs(x)
angle = np.angle(x)

plt.subplot(1,3,1)
plt.scatter(real, imag)
plt.title("rectangular")
plt.xlabel("real part")
plt.ylabel("imag part")
plt.subplot(1,3,2, projection="polar")
plt.scatter(angle, r)
plt.title("polar")
plt.subplot(1,3,3)
plt.scatter(angle, r)
plt.title("rect. plot of polar params")
plt.xlabel("angle [rad]")
plt.ylabel("magnitude")
plt.savefig("moderate_oof.png")
@wooden sail :white_check_mark: Your 3.11 eval job has completed with return code 0.
 wooden sail
yuck, some overlap. but the point is. the plot on the left and the one in the middle are identical, just different parametrizations. the one of the right has a different appearance though
young granite
i see
thanks for ur effort what do u say to check for correlation in between my complex values
wooden sail
it will change if you reparametrize, sure
but i would kinda avoid doing it in polar coords
young granite
+1
wooden sail
the issue will be with 2 pi. angles close to 2 pi should be highly correlated with angles close to 0, but you'll have to take care of that as an edge case yourself
you can look for correlation using the rectangular ones though. iirc you said magnitude didn't matter, so you were gonna normalize the vectors
that'd mean you can directly use cauchy-schwarz to measure similarity
young granite
as always thanks edd ❤️
edd what kind of math geek are u to know all that on the fly? (always comes to my mind hahaha)
wooden sail
hmm you just happen to ask questions that land in the small set of things i have either read about or have dealt with in the past
 proud beacon
Hello, I need help please with making a bar graph. Here is my code below and I am trying to set the x-axis as all the states and then the y-axis as the number of shipments. I'm not sure what to inser in the plt.bar() so it outputs just the names of the states and the values corresponding to them. I've been at this for hours ._. I am very beginner.
 young granite
proud beacon
Hello, I need help please with making a bar graph. Here is my code below and I a...
young granite
proud beacon
Hello, I need help please with making a bar graph. Here is my code below and I a...
!code
arctic wedgeBOT
young granite
makes it easier for us to read what u just did
proud beacon
ohh, do i just type "!code" and then past it under?
young granite
no u use the backticks
young granite
3x backtick +py then ur code and then close it with 3 new backticks
proud beacon
import matplotlib.pyplot as plt
import csv
from matplotlib.pyplot import figure

df = pd.read_csv('COVID-19_Vaccine_Distribution_Allocations_by_Jurisdiction_-_Moderna .csv')
print(df.head())

df = df[['Jurisdiction', 'Total Allocation Moderna"Second Dose" Shipments']]

plt.bar()
plt.title(Shipments of Second Dose of COVID Vaccine of Each US State)
plt.xlabel('Jurisdiction')
plt.ylabel('Total Allocation')
plt.show()```well done
proud beacon
omg yay, thank you it worked
young granite
if u edit it and write directly onto the first 3 backticks "py" (without ") u even highlight em
without py
import numpy as np
with py
import numpy as np
There’s a part where you have plt.title(…) that needs to have quotes around it, it is a strong
proud beacon
ohh okok, ill do that
plain jungle
String*
young granite
proud beacon
```py import pandas as pd
import matplotlib.pyplot as plt
import csv
from matplo...
but back to ur question, best also insert the Traceback aswell
proud beacon
so like, in the plt.bar() would how would i include the values for x and y bc i am indexing only those values
ohh hwhat traceback?
young granite
the error
young granite
plt.title(Shipments of Second Dose of COVID Vaccine of Each US State) u wrote it as a "variable" but u have to define it as a string
plt.title("Shipments of Second Dose of COVID Vaccine of Each US State")
also u need to assign data to ur plot or it will be empty with only axis labels and title
for that its always good to check docs:
https://matplotlib.org/stable/api/_as_gen/matplotlib.pyplot.bar.html
x and height are what u want to give into that
if there is "default" mentioned u do not need to define that (but u can do so)
 wide crag
im having a dtype error could i get some help
lapis sequoia
agile cobalt
what exactly is `model_VGG_2_simple_reg`? it should explain what evaluate is doi...
It's just a vgg model
The 2 elements in list are loss and accuracy respectively
Don't know why keras had to make their own syntax and not be sklearn kind
 serene scaffold
wide crag
im having a dtype error could i get some help
serene scaffold
wide crag
im having a dtype error could i get some help
don't ask to ask. if you need help with an error message, show the whole error message and the relevant code, all at once.
 frail sable
Is graph search ontopic here, or should I take it to #algos-and-data-structs ?
serene scaffold
frail sable
Is graph search ontopic here, or should I take it to <#650401909852864553> ?
here is fine
proud beacon
Hello, can you guys let me know if my code is done well? I am trying to use an excel spread sheet for the dad and i want to make a bar graph with the US states on the x axis and the total vaccine distributions for each state. Here is my code. I think there is an error in plt.bar()
import matplotlib.pyplot as plt
import csv
from matplotlib.pyplot import figure

df = pd.read_csv('COVID-19_Vaccine_Distribution_Allocations_by_Jurisdiction_-_Moderna .csv')
print(df.head())

df = df[['Jurisdiction', 'Total Allocation Moderna"Second Dose" Shipments']]

plt.bar()
plt.title(Shipments of Second Dose of COVID Vaccine of Each US State)
plt.xlabel('Jurisdiction')
plt.ylabel('Total Allocation')
plt.show()
I'm not competent to comment, but your code will fail on the title line, because you didn't quote your string.
proud beacon
ohh okay ill change that
frail sable
I'm doing search on a directed graph, to play games, do GOAP, the works, it's very abstract and generalized. As part of that, I said to myself "Let's get rid of these 'two players, moving alternatingly' restriction. Every player moves every turn, and if it's not such a game, the non-moving player makes a null move." So now instead of Minimaxing state/node values on alternating levels of tree (graph) depth, I do a game theory matrix and do minimax on that. That seems to work, but is it formally valid? (This is an intermediate question, the whopper will come next.)
Okay, now I want to implement alpha-beta pruning. Instead of having alpha and beta values, I think I will again only have one value to consider. After expanding a node and giving the successors estimated values, but before enqueueing them for further expansion, I would calculate my optimal action on the parent, and then would only expand the successors than my action can lead to, and of those only those that will minimize the score I can get for that action? I think that would only be alpha or beta though so far?
rich condor
serene scaffold
> I am trying to understand how ReLu allows a model to recognize complex feature...
But a model without an activation function is essentially a linear model
gloomy saddle
@nova pollen seems the above guy has only advertised things since joining
bold timber
hasty mountain
Each iteration is for each token.
`(Batch, d_model)` ---> `(Batch, vocab_size)`...
based on the image above, does it mean every output of the decoder block being as an input for another block?
So does it mean that if I have a task for translating a language that has 10 tokens, the process of positional encoding is only once?
 junior stone
gloomy saddle
<@314334182111182848> seems the above guy has only advertised things since joini...
junior stone
gloomy saddle
<@314334182111182848> seems the above guy has only advertised things since joini...
its relevant no? AI tool and were on the ai channel
hasty mountain
bold timber
based on the image above, does it mean every output of the decoder block being a...
Yes, the positional encoding is done only once, because it's done even before you pass the input to the Encoders. It's like a complementation to the embedding matrix
And yes, the output of an decoder block seems to be the input for the next block
But your generated token, the text generation actually happens outside the Decoder, after the whole forward propagation through the Transformer, in the FCC + Softmax layer
The decoder output is still...let's say... a hidden layer output...I guess one could say that...
rich condor
What type of models are Stable Diffusion and ControlNet respectively? They are definitely neural networks but are they GANs or CNNs?
hasty mountain
rich condor
What type of models are Stable Diffusion and ControlNet respectively? They are d...
Stable Diffusion isn't a GAN, it's a different model for image generation, a Diffusion Model
agile cobalt
rich condor
What type of models are Stable Diffusion and ControlNet respectively? They are d...
neither.
fast.ai did a course that focused on Stable Diffusion if you want a (very) detailed view of it
hasty mountain
I think it's a Latent Diffusion with probabilistic Sampling.
I don't know about the ControlNet.
rich condor
agile cobalt
neither.
fast.ai did a course that focused on Stable Diffusion if you want a (v...
Got a link?
agile cobalt
https://course.fast.ai more specifically 2022 part 2, if you have a background in AI/ML you can skip part 1 but if not you probably won't understand everything
A free course designed for people with some coding experience, who want to learn how to apply deep learning and machine learning to practical problems.
steep echo
steep echo
i'm not sure where to begin to look on those but I'll try there next. I need the...
Anybody have an idea on a solution to this? This links to the conversation I had with all the context
agile cobalt
steep echo
Anybody have an idea on a solution to this? This links to the conversation I had...
I still don't get what exactly your inputs/outputs are
rich condor
agile cobalt
https://course.fast.ai more specifically 2022 part 2, if you have a background i...
I saw all the copywriting and was terrified it was a paid course but the 'get started' link looks to be free access. Will watch this! Thank you so much!
hasty mountain
rich condor
I saw all the copywriting and was terrified it was a paid course but the 'get st...
Oh yes, another recommendation:
https://lilianweng.github.io/posts/2021-07-11-diffusion-models/#nice
[Updated on 2021-09-19: Highly recommend this blog post on score-based generative modeling by Yang Song (author of several key papers in the references)]. [Updated on 2022-08-27: Added classifier-free guidance, GLIDE, unCLIP and Imagen. [Updated on 2022-08-31: Added latent diffusion model.
So far, I’ve written about three types of generative mod...
This blog is from an OpenAI's Research Leader
She even participated in GPT-4.
bold timber
hasty mountain
But your generated token, the text generation actually happens outside the Decod...
as I know, each decoder block is generated for one token, how does the decoder produce a sentence?
steep echo
agile cobalt
I still don't get what exactly your inputs/outputs are
I'm not sure what you're asking for, I'm still new to programming
hasty mountain
bold timber
as I know, each decoder block is generated for one token, how does the decoder p...
If this image is from GPT (which is a Transformer that has only decoders), than the token is actually generated at the FCC+Softmax.
But yeah, I don't know how one could call the output of the Decoder. Maybe just a hidden state...
 nova pollen
junior stone
its relevant no? AI tool and were on the ai channel
nova pollen
junior stone
its relevant no? AI tool and were on the ai channel
!rule 6 The issue is not about if it is on topic, it is about the advertising.
bold timber
hasty mountain
If this image is from GPT (which is a Transformer that has only decoders), than ...
aah i see. but i want to check about this chart process. is that not correct?
 timber flame
agile cobalt
https://course.fast.ai more specifically 2022 part 2, if you have a background i...
timber flame
agile cobalt
https://course.fast.ai more specifically 2022 part 2, if you have a background i...
bro
that's no good tho
hasty mountain
bold timber
aah i see. but i want to check about this chart process. is that not correct?
Oh, ok, it's a normal Transformer.
So yes, each forward propagation generates a token after the FC+Softmax. Then the generated token is passed through the decoder again.
hasty mountain
The text generation in fact happens at Fully Connected layer + Softmax, which is when the model will select the most likely token to be generated.
 bold timber
hasty mountain
Oh, ok, it's a normal Transformer.
So yes, each forward propagation generates a ...
bold timber
hasty mountain
Oh, ok, it's a normal Transformer.
So yes, each forward propagation generates a ...
But that image contain multiple Positional Encoding. is that correct?
hasty mountain
bold timber
But that image contain multiple Positional Encoding. is that correct?
Yes, if you decode your output to get a proper word, a string, then you'll have to apply encoding all over again.
Usually you'll just decode the output once you have a complete sentence, though.
bold timber
hasty mountain
Yes, if you decode your output to get a proper word, a string, then you'll have ...
So how does the encoder process for the next decoder? I think this picture is wrong, because actually at the first input record, the positional encoding is only done once at the beginning.
hasty mountain
Yes, the positional encoding is in fact done at the beginning. And you apply directly the positional encoding to both the input and target sentences
The picture isn't exactly wrong, but it's confusing
It tends to make things look more complicated than they really are
(Which seems to be a pattern when dealing with Transformers, by the way)
bold timber
hasty mountain
The picture isn't exactly wrong, but it's confusing
That's why I'm asking you:
Each decoder block is processed only for one token (word) which mean the whole decoder block will process all tokens of the sentence, or the whole decoder block will process only one token (word)?
hasty mountain
bold timber
That's why I'm asking you:
Each ``decoder block`` is processed only for one toke...
Each decoder block will process a single token. But again, if you use some data manipulation(use sequences), you can make your decoder process a single token per sequence, thus generate multiple tokens in a single forward propagation.
Like it's done in RNNs
But yes, in vanilla configuration, the decoder(which is composed of decoder blocks) will generate a hidden size which, in the FCC + Softmax will generate a single token
A decoder block does not generate a token per se, it generates a hidden size, features, just like a Fully Connected Layer generates, as output, numbers that represents features, or a Convolution Layer.
The process of selecting a token from the vocabulary is done in fact in the FCC + Softmax layer, which comes after the decoder
agile cobalt
timber flame
import fastai n shit
the part 2 literally doesn't uses fast.ai, it recreates things from scratch (then import from pytorch / hugging face since the performance of the from scratch things cannot compare)
agile cobalt
steep echo
I'm not sure what you're asking for, I'm still new to programming
https://stackoverflow.com/help/minimal-reproducible-example an example of all data frames, including the one with what you're calling T/F in
The function runs on each column so if the 2nd column has T, but the other 2 (or more) are F, I only want the corresponding price
the examples you provide should be complete enough that you can adapt a solution which works on that example data to work on your actual problem
 novel remnant
Hello, I've been trying to research methods when it comes to processing semi-big data with high cardinality (up to 1M rows and 4k columns) for simple but explainable machine learning tasks. Are there alternatives to pyspark or dask? I'm experimenting with polars and data.table and although they are really fast, they don't really solve the memory issues.
On a separate note, I noticed that pyspark is quite slow and has memory leaks performing column-wise operations on datasets with high cardinality. Are there general tips to tune pyspark jobs to accommodate for that? I can provide more details if needed
past meteor
novel remnant
Hello, I've been trying to research methods when it comes to processing semi-big...
Just to be sure, are you using Polar's lazy API without any user-defined functions?
Where is your data stored? Are you using scan_<datasource> instead of read_<datasource>?
novel remnant
my data is in parquet format which I'm reading from disk. I have tried the lazy evaluation with scan instead of read and fetching the results back with streaming=True. No UDFs are used.
past meteor
novel remnant
my data is in parquet format which I'm reading from disk. I have tried the lazy ...
And you're running out of memory even when using the LazyAPI exclusively? If that's the case, then you definitely need to use Spark. What you could also do is run the script N times and filter parts of your parquet file. DuckDB is also an option if you can/are willing to express everything in SQL.
lapis sequoia
 wheat snow
is this the right place to ask for matplotlib stuff?
wooden sail
sure thing
lapis sequoia
I am trying to build a treemap from the linux kernel git data set on keggle. I got so far as getting the total number of modifications per commit per file, with summing up the modifications through the directories. But it seems a bit clunky. https://github.com/TreeHappy/Kaggle/blob/main/commit-treemap.ipynb . When i sum up the modifications is there any way to keep the FilePaths also somehow?

GitHub
Contribute to TreeHappy/Kaggle development by creating an account on GitHub.
jolly dock
Ide says system can't found the path but there isn't any problems on the path. Can somebody help me to solve this?


I tried py models_dir = "C:/Users/hmtbr/Desktop/python/gpt-2/models/117M" but it didn't worked.

GitHub
Code for the paper "Language Models are Unsupervised Multitask Learners" - gpt-2/generate_unconditional_samples.py at master · openai/gpt-2
this is the code i use
 fair magnet
I'm planning to train an AI that able to make song covers by a specific singer according to the data trained.
Just wanna ask is it possible to convert the audio datasets into a csv file? 
 flint gazelle
You theoretically can but its not recommended. But there should be other ways to load audio files into your libraries. For instance Tensorflow has a function tf.keras.utils.audio_dataset_from_directory()
fair magnet
flint gazelle
You theoretically can but its not recommended. But there should be other ways to...
Ahh I see. Thanks!
flint gazelle
fair magnet
Ahh I see. Thanks!
Maybe take a look at https://www.tensorflow.org/tutorials/audio/music_generation this might help

TensorFlow
fair magnet
flint gazelle
Maybe take a look at https://www.tensorflow.org/tutorials/audio/music_generation...
Thanks a lot. Appreciated it
just a sec
i dont think i can convert human singing sounds to midi right?
flint gazelle
Yeah but you need some kind of RNN to generate sounddata
This is a complex topic that requires a considerable amount of experience and time. If your new to this i would recommend starting simple with an easier task.
 sullen kernel
I'm doing a machine learning project an AI that recognizes dogs and cats
I did the prediction thing
anyone knows what do I need to do after that?
flint gazelle
sullen kernel
I'm doing a machine learning project an AI that recognizes dogs and cats
I did ...
Can you elaborate a little bit further what you have done and what you want to do
sullen kernel
i created a dataframe with the path, label and the rgb of the cats and dogs pictures (i used only 20 pictures 10 dogs and 10 cats) and after that i split them to train datas and test datas (70% train 30% test) and then i tested it and i think it guessed right
i need to find "best k"?
 dusk aurora
sullen kernel
I'm doing a machine learning project an AI that recognizes dogs and cats
I did ...
dusk aurora
sullen kernel
I'm doing a machine learning project an AI that recognizes dogs and cats
I did ...
You would typically save the model so that it can be used later
You're probably looking for K means clustering here
 thorn swift
 simple tapir
How can i visualise this model? https://pastebin.mozilla.org/LywqDq05
simple tapir
How can i visualise this model? https://pastebin.mozilla.org/LywqDq05
i got you bro


 coral cradle
do you guys think I am overusing the dropout? it has a dropout of 0.5
 hasty mountain
coral cradle
do you guys think I am overusing the dropout? it has a dropout of 0.5
hasty mountain
coral cradle
do you guys think I am overusing the dropout? it has a dropout of 0.5
You're certainly at a risk. But that might work
Except for that Dropout before the softmax. I'd risk to say that one may compromise things
Hm... Variational AutoEncoders are a bit sad... The math around them makes so much sense, the ELBo...the decoder having to find the most likely values for each pixel...
Yet, they seem to be so inefficient... Can only output blurred images unless they receive some help from a feature extractor or from a Discriminator...
thorn swift
does anybody have a project that could use another coder? i just wrapped something up and im looking to jump onto something
simple tapir
thorn swift
i got you bro
man...
 shell zodiac
Hello
CAPUCHIN_FILE = os.path.join('D:\\archive (4)\\Parsed_Capuchinbird_Clips')
file_contents = tf.io.read_file(CAPUCHIN_FILE, name=None)
I am running this in jupyter-lab and I get this error
NewRandomAccessFile failed to Create/Open: D:\archive (4)\Parsed_Capuchinbird_Clips : Access is denied.
the path is to a folder should I change it directly to the wav file?
 foggy kestrel
File "c:\Users\Main\Documents\Testing\server.py", line 11, in <module>
from tensorflow import keras
ImportError: cannot import name 'keras' from 'tensorflow' (unknown location)```
tried upgrading and uninstalling tensorflow, nothing works. what should i do? narrow crane
Could someone review my study plan for datascience? I'd like to know from successful people in the field whether it's holistic or not. I'm going to make a forum so I don't flood this channel. I'd also appreciate any additional advice y'all would have to offer.
 fleet plover
Could anyone help with https://www.reddit.com/r/learnpython/comments/13ga2zo/help_with_dihedral_code/ ?

 unkempt egret
foggy kestrel
```Traceback (most recent call last):
File "c:\Users\Main\Documents\Testing\se...
unkempt egret
foggy kestrel
```Traceback (most recent call last):
File "c:\Users\Main\Documents\Testing\se...
! pip install tensorflow --upgrade try this
night prawn
I continued installing tensorflow gpu with wsl but it gives me this error message
 sullen kernel
what is a hyperparameter?
dusk aurora
shell zodiac
the path is to a folder should I change it directly to the wav file?
read_file seems to suggest passing a file
foggy kestrel
unkempt egret
! pip install tensorflow --upgrade try this
didn't work
 hoary plume
I'm reviewing a code that I need to run but I have a error in this line with Keras engine, the error is basically this:
ValueError: Exception encountered when calling layer "mrcnn_bbox" (type Reshape).
Tried to convert 'shape' to a tensor and failed. Error: None values not supported.
Call arguments received by layer "mrcnn_bbox" (type Reshape):
• inputs=tf. Tensor (shape=(8, None, 8), type=float32)
the line that causes the problem is the image I sent

I understand the error
but I dont understand how to solve it
maybe it's too little context
 quartz ivy

Hi, i'm ML beginner. im training a simple cnn model on colab, i always get this kind of gpu memory spikes, and i can't run the training loop twice, as it will give me cuda out of memory error. is this common?
hasty mountain
quartz ivy
Hi, i'm ML beginner. im training a simple cnn model on colab, i always get this ...
Unfortunately, yes 
quartz ivy
Please advice 🙂
hasty mountain
You'll have to use less GPU memory, like decreasing your batch size or your model parameters
quartz ivy
can i show you my code?
hasty mountain
Or manipulate your code so it has to use/save less variables
Sure, send it here
Ok, I see the problem...
You're using a linear layer with more than 400 million parameters
quartz ivy
nn.Linear(808064, 1024),
nn.ReLU(),
nn.Linear(1024, 512),
nn.ReLU(),
nn.Linear(512, 2)
hasty mountain
nn.Linear(80*80*64, 1024)
You're basically creating a matrix with 409,600 (80x80x64) x 1024 elements
quartz ivy
thanks! do i change the 1024 to something smaller?
hasty mountain
Which will totalize 419,430,400 elements
quartz ivy
oh geez, i copied this part from someone else's code
hasty mountain
quartz ivy
thanks! do i change the 1024 to something smaller?
No. Use convolution + pooling layers to extract features from the image, so you'll be able to decrease the number of features without having to compress your data too much
If you were to stick to the linear layer, you'd have to use something like nn.Linear(80*80*64, 16) in order to not blow up your memory
But this would be a too aggressive bottleneck of information, which may prejudice the model.
quartz ivy
nn.Conv2d(64, 128, 3, 1, 1), # [128, 64, 64]
        # nn.BatchNorm2d(128),
        # nn.ReLU(),
        # nn.MaxPool2d(2, 2, 0),      # [128, 32, 32]

        # nn.Conv2d(128, 256, 3, 1, 1), # [256, 32, 32]
        # nn.BatchNorm2d(256),
        # nn.ReLU(),
        # nn.MaxPool2d(2, 2, 0),      # [256, 16, 16]

        # nn.Conv2d(256, 512, 3, 1, 1), # [512, 16, 16]
        # nn.BatchNorm2d(512),
        # nn.ReLU(),
        # nn.MaxPool2d(2, 2, 0),       # [512, 8, 8]

        # nn.Conv2d(512, 512, 3, 1, 1), # [512, 8, 8]
        # nn.BatchNorm2d(512),
        # nn.ReLU(),
        # nn.MaxPool2d(2, 2, 0),       # [512, 4, 4]
so i guess that is what this commented out code was doing
hasty mountain
Indeed
quartz ivy
having incorrectly defined the NN structure is indeed a cause. But i also notice if i move the model variable declaration outside the training loop it can run without error. i wonder why is this
i'm using a cross validation in the training loop. and according to templates found online, they put the model and optimiser inside the training loop.
like ``` #model = Classifier().to(device)
model.apply(reset_weights) # reset the weights to be sure
#optimizer = torch.optim.Adam(model.parameters(), lr=0.0003, weight_decay=1e-5)
Uh... Those definitions must be outside the training loop, actually... Otherwise you'll just be recreating your model and there'll be no backpropagation
The backpropagation is the part that tends to cause trouble with memory
quartz ivy

Medium
The post is the fifth in a series of guides to build deep learning models with Pytorch. Below, there is the full series:
i copied from this article. it sounds like either there's a mistake in it or i interpreted wrong
it's on line 12-14
quartz ivy
hasty mountain
Uh... Those definitions must be outside the training loop, actually... Otherwise...
i thought we need a new model and reset the weights for each fold
hasty mountain
for fold, (train_idx,val_idx) in enumerate(splits.split(np.arange(len(dataset)))):

    print('Fold {}'.format(fold + 1))

    train_sampler = SubsetRandomSampler(train_idx)
    test_sampler = SubsetRandomSampler(val_idx)
    train_loader = DataLoader(dataset, batch_size=batch_size, sampler=train_sampler)
    test_loader = DataLoader(dataset, batch_size=batch_size, sampler=test_sampler)

    model = ConvNet()
    model.to(device)
    optimizer = optim.Adam(model.parameters(), lr=0.002)

    for epoch in range(num_epochs):
There's a loop for each k-fold, and there's a loop for each epoch
The model is indeed redefined for each fold, but it's kept for each epoch
quartz ivy
it turns out to be so much faster than before. problem solved
 maiden widget
I want to make audio classification model which will identify audios into alphabet and numbers from 0 to 9
I can't find any dataset which will have audio files of alphabets and numbers
I have made dataset on my own having 15 files for each class (36x15 files)
but my model has very low accuracy because of such small dataset
does anyone have any resource or idea for me to work on ?
num_classes = 36

input_shape = (num_mfcc, max_len, 1)

model = Sequential()
model.add(Conv2D(32, kernel_size=(3, 3), activation='relu', input_shape=input_shape))
model.add(MaxPooling2D(pool_size=(2, 2)))

model.add(Conv2D(64, kernel_size=(3, 3), activation='relu'))
model.add(MaxPooling2D(pool_size=(2, 2)))

model.add(Conv2D(128, kernel_size=(3, 3), activation='relu'))
model.add(MaxPooling2D(pool_size=(2, 2)))


model.add(Flatten())

model.add(Dense(128, activation='relu'))

model.add(Dense(num_classes, activation='softmax'))

model.compile(loss=keras.losses.categorical_crossentropy, optimizer=keras.optimizers.Adam(), metrics=['accuracy'])
 dreamy phoenix
Not sure if I should ask about this in one of the python help channels or in here but, so I was training a YOLO model and in the end I get two weights (last.pt and best.pt)
The "best.pt" weights come from the epoch which had the best results or how exactly does it work?
Cause I trained a few YOLO models with different hyper-parameters and I need to compare them and in my results file (which was auto generate during training I have)
epoch    recall    mAP@50  mAP@50-95
0        0.69      0.79    0.56
1        0.67      0.76    0.52
2        0.58      0.67    0.43
....
19       0.66      0.76    0.52
Does that mean that my "best.pt" comes from the first epoch and the rest of the epochs are essentially useless?
Please @ me if any1 has the answer when you see this
 south edge
someone help
can someone tell me why should our input values should be two dimensional when we use the predict function, and numpy makes my head spin when i use concatenation, is there any alternate way to concatenate or reshape my dependent values
print(np.concatenate((y_pred.reshape(len(y_pred),1), y_test.reshape(len(y_test),1)),1))
i cant seem to remember this most of the times is there any alternative way'
serene scaffold
south edge
can someone tell me why should our input values should be two dimensional when w...
What the "predict function" is and what it expects depends on what the model is, and other properties of that model that you haven't shared.
But generally speaking, python ML stuff operates on batches of data. So whatever you're doing, the outermost dimension stores instances of the same kind of information
If your data points are one dimensional arrays with four values, then an array of shape (n, 4) would be n of those.
And if your data points were two dimensional arrays of shape (3, 4), then an array of shape (n, 3, 4) would be n of those.
If you have a list (not an array) of those arrays that you want to predict for at once, you could use np.vstack
Which stands for vertical stack.
dreamy phoenix
A precision-confidence plot tells you at what confidence the model has 100% precision, right?
For example in the first one the precision is 1 when the model has 100% confidence
and in the second one the precision is 1 when the model has 97.7% confidence

 bold timber
Hi, I have a question What is the actual input to the decoder in the first iteration (from input in the word embedding and positional encoding):
<sos> <token1> <token2> <token3> <token4> or just <sos>? @hasty mountain
hasty mountain
bold timber
Hi, I have a question What is the actual input to the decoder in the first itera...
During training, it is <SOS> <Targetoken1> <Targetoken2> and so on
At inference, just <SOS>
Protip: this inference mode is actually rubbish, though. It was meant to be used with powerful hardware that could make it possible for a single model generate multiple sentences at a short time. In the end, it would be selected.the sentence with the best BLEU or Perplexity score.
When you finish building the model, search for Schedule Sampling for Transformer, which is more convenient for mere mortals that don't have dozens of Teslas T4 available.
bold timber
hasty mountain
During training, it is <SOS> <Targetoken1> <Targetoken2> and so on
At inference...
Can you explain to me what is training and inference mean based on this image?
 hasty mountain
bold timber
Can you explain to me what is ``training`` and ``inference`` mean based on this ...
hasty mountain
bold timber
Can you explain to me what is ``training`` and ``inference`` mean based on this ...
They're the same thing. The only difference is the outputs in the image, which are the target sentence.
The Decoder receives the Encoder outputs and the target sentence. So, the Transformer as a whole must receive both the input sentence and the target sentence.
During training, you'll have both the input and the target sentences.
But that's not the case during inference, when you have the input sentence, but not the target (ex: ChatGPT knows what you said to it, but it doesn't know what it must say).
In that case, your target sentence will be just <SOS> and, as the model generates token by token, you'll append the generated token to the target sentence and make another iteration. This will repeat until your model generstes a <EOS> token or simply reaches the maximum length you'll stablish.
bold timber
whether it means that the Encoder will process the original sentence input, while the Decoder input is the target sentence in the form of <sos><token target1><token target2> <token target 3><token target 4> and so on.
Since the Decoder is autoregressive, the Mask Multi-Head Attention will mask other words and only focus on certain tokens so that means the token sequence becomes <sos><0><0><0> ==> the value 0 refers to the result of infinite negative.
For example, in the first iteration of the process the output of the Decoder is the word "I". Well, that means that in the second iteration of the process the input to the Decoder is <sos><I><token target3><token target4> and so on.
Just like before, inside the Mask Multi-Head Attention will also do masking so that the token sequence becomes <sos><I><0><0><0>.
For example, in the second iteration of the process the output of the Decoder is the word "want". Now, that means that in the third iteration of the process the input to the Decoder is <sos><I><want><token target4>.
And this will repeat until it produces <eos>
Is this really the process? please correct me if I'm wrong. @hasty mountain
quartz ivy
If i have a very small dataset of 80, each sample is 160x160x15, essentially an image with 15 channels. an ordinary cnn is way too complex for this and it leads to serious overfitting. What might be a good way to train this? Any suggestions?
cold osprey
dropout?
queen cradle
quartz ivy
If i have a very small dataset of 80, each sample is 160x160x15, essentially an ...
You don't say what you're trying to do, so it's impossible to recommend anything.
still moon
I'm not currently working on my neural network but it's on my mind so I'll ask...
Summary is I have arrays of floats that I'm working on. Each array is a row of data from my database which contains 37000 records.
I'm splitting this data into 3 sets, train_data, test_data, and val_data to train my model which I've structured so that each element of the array is a neuron on the input layer. (I hope my terminology is correct, I'm still learning).
The layers are activated with relu (or tanh - or some combination) and I'm using a single regularization layer with L2.
The model is compiled using Adam on a learning rate of 0.01 and is being fitted in batches of 320 over 10000 epochs.
Best I can manage in this or any other configuration (I've spent the weekend tweaking my hyperparameters) is about 14% accuracy which doesn't change. My loss rate decreases until about the 4000th epoch at which point I think it starts overfitting.
I don't have the foggiest idea how to improve the accuracy of my model so if anyone can make any suggestions, I'll be more than happy to try them out. I'm completely at a loss at this point.
Sorry for wall of text.
 solemn breach
quartz ivy
If i have a very small dataset of 80, each sample is 160x160x15, essentially an ...
solemn breach
quartz ivy
If i have a very small dataset of 80, each sample is 160x160x15, essentially an ...
idk probably expand the size at random interavls when u put them in an array
so you change the order the neural network reads the data without actually randomizing it
and subtitute change the prexisting images so new images are changed and differ by certain attricibutes
agile cobalt
quartz ivy
If i have a very small dataset of 80, each sample is 160x160x15, essentially an ...
I'd guess grab more or data or somehow find a pretrained network you can fine tune
unless the task you are trying to solve is extremely simple, 80 probably is way too little data
solemn breach
still moon
I'm not currently working on my neural network but it's on my mind so I'll ask.....
just change how you set up your neural network
still moon
I mean, changing it is obvious, but I don't know how to change it that would make a meaningful change
solemn breach
are u using RMSProp
and cross entropy
oh you mean how to increase its accuracy without changing relu
still moon
I tried to use categorical cross entropy but it errored... I'm using MeanSquaredError for loss
solemn breach
it seems like relu would a be a bit slow
one sec
why dont u use meansquarred error as inputs for relu?
still moon
Wish I had the project with me at work so I could fiddle with it
But I'll try it when I get home in a few hours... Trying to learn between actually working 🤣
solemn breach
still moon
But I'll try it when I get home in a few hours... Trying to learn between actual...
when do u work?
still moon
Monday to Friday 6-3. It's about 6 hours left plus about an hour drive home
solemn breach
Its quite interesting...you can predict a good amount of it out by using language models as a objective argument to fit to
oh wow
hellas bro
maybe u can play around with the truth statements in linguistics
still moon
Funny you should mention language models because my entire education in this field so far consists of harassing ChatGPT about anything I don't understand
solemn breach
most of the loss functions are to compensate for lack of true or known truth statements
More like a confirmation step after having a rough estimate
based on repetition and closeness of subsequent prompts?
variance gets bigger or smaller
quartz ivy
solemn breach
so you change the order the neural network reads the data without actually rando...
can you elaborate a bit on this? what does it mean to expand the size at random intervals and change preexisting imagees?
still moon
Question: since I seem to be getting to overfitting within 4000 epochs, is it still worth it to run 10000 epochs?
solemn breach
still moon
Question: since I seem to be getting to overfitting within 4000 epochs, is it st...
probably ot
create varianceee or create nodes that predict variance
quartz ivy
queen cradle
You don't say what you're trying to do, so it's impossible to recommend anything...
essentially there are 80 images of oral cells, and some of them are labelled cancerous and some benign, i'm trying to classify the 2 types
solemn breach
quartz ivy
can you elaborate a bit on this? what does it mean to expand the size at random ...
like copy an existing element and move each one to the ith row and jth height and modify it by an attribute, creating more rows and datas in the process
but you have to keep the ith row and jth height as consistent shift value
agile cobalt
quartz ivy
essentially there are 80 images of oral cells, and some of them are labelled can...
how many of each class have you got?
quartz ivy
from what i understand, the 15 features at each pixel value are parameters to fit a radioactive decay, the image was taken using FLIM imaging
agile cobalt
I meant how many are cancerous and how many are benign
quartz ivy
84 samples in total, 61 benign, 23 cancerous
i used cross validation btw, tried 4, 6, 8fold,
agile cobalt
that really does not sounds like enough data to fit a model for me
quartz ivy
yeah ikr
solemn breach
check how many are similiar
and u can bs more images based off how similiar they are and in what range the cancerous types would apepar in
agile cobalt
you can try applying regularisation, using simpler models and/or using ensembles, but comparing the number of features you have (160*160*15 = 384k) to the number of rows (81)... not so sure about it
still moon
solemn breach
create varianceee or create nodes that predict variance
Variance in the data I'm training with?
quartz ivy
solemn breach
and u can bs more images based off how similiar they are and in what range the c...
does this look like overfitting ? sry if its obvious
 quartz ivy
that's basically all there is, acc and loss don't change after this
cold osprey
r u sure its actually 0.91% and not 91% ?
solemn breach
quartz ivy
does this look like overfitting ? sry if its obvious
nope just looks like it knows the data too well, by picking up the wrong data
quartz ivy
agile cobalt
you can try applying regularisation, using simpler models and/or using ensembles...
shallow ML methods might not be able to capture the relationship. Uhh it seems like a deadend
quartz ivy
solemn breach
nope just looks like it knows the data too well, by picking up the wrong data
idk, pretty sure i got the cross validation part correct
agile cobalt
quartz ivy
does this look like overfitting ? sry if its obvious
remember to check the confusion matrix, not just the accuracy
you could get an accuracy of 75%ish if you just guessed benign all of the time?
cold osprey
F1 score
quartz ivy
thanks for the suggestions!
really appreciate if someone could help take a look at the code and output and if there is some major obvious error
h ttps://colab.research.google.com/drive/12uCuDc5s2J2O_BlZKaxZBbr-y2E_yI8f?usp=sharing
quartz ivy
if dataset is too small theers nothing i can do. might just give up on this one lol
cold osprey
more transforms can help with overfitting maybe
quartz ivy
like the number of classes?
currently im putting the high cancer, medium cancer, and mild cancer all under the category "cancer"
quartz ivy
cold osprey
more transforms can help with overfitting maybe
yeah, tho ordinary image transforms don't work on these 15 weird features.. umm maybe tilt, rotating could work
cold osprey
hmm why is that so
solemn breach
to truly increase the attributes, you need to have definitions that go outside their bounds and refer to like reason for severity of cancer
cold osprey
cant run the nb coz the data not in my gdrive
solemn breach
yeah try everything tilting, colors, contrast
quartz ivy

the 15 features define or mimicks this decay curve
they are like parameters for an equation
cold osprey
wavelengths?
quartz ivy
solemn breach
to truly increase the attributes, you need to have definitions that go outside t...
not sure, im only given the labels in these several classes
cold osprey
each channel here is a decay curve?
quartz ivy
each pixel has 15 features, these 15 features define the decay curve itself(at this pixel point)
cold osprey
so each of the 15 is at a certain time stamp
quartz ivy
there were 900 features at each pixel initially, then my supervisor turn them into 15 somehow
900 refer to the value at each timestamps maybe
cold osprey
i think so
from what i know from reading about fluorescence decay and what u mentioned
cold osprey
quartz ivy
yeah, tho ordinary image transforms don't work on these 15 weird features.. umm ...
which ordinary image transforms do u mean?
each channel is an image at time t right, so not sure why u can transform them like normal images
ive a physics background so now imagining ur images is like having a sensor detecting some particle/substance decaying
quartz ivy
cold osprey
which ordinary image transforms do u mean?
can i send my data file to you through drive? but don't want to take too much of ur time
it's like 800 mb
quartz ivy
ok rly appreciated
 potent lynx
guys I had a doubt
how can we plot fourier transforms
graphs with either the extension expanded fourier sequence
or the simple quadratic equations
and can it be done using matlab or plt
lapis sequoia
hiya
wooden sail
potent lynx
graphs with either the extension expanded fourier sequence
how do you mean? i'm not familiar with the terms you're using here for fourier transforms. you can do fast fourier transforms with numpy and scipy, and sympy/symengine have methods to compute symbolic fourier transforms for special functions. you can then plot these with matplotlib.pyplot
 solemn atlas
I want to learn about transformers in NLP but i don't know where to begin
past meteor
solemn atlas
I want to learn about transformers in NLP but i don't know where to begin
dive into deep learning is a great book about neural networks in general. They cover everything you need to understand transformers starting from linear regression to, feed forward nets, recurrent, seq2seq, transformers, ...
gloomy saddle
probably this one
https://d2l.ai/chapter_preface/index.html
solemn atlas
Ty very much
past meteor
solemn atlas
Ty very much
If you haven't done this yet: I recommend you download zotero and add the arxiv version to your library. It's a great place to mark text, take notes, ...
solemn atlas
past meteor
If you haven't done this yet: I recommend you download zotero and add the arxiv ...
Ty i will download it definately and follow it : )
 drowsy timber
is there a spark sedona package for reading netCDF files?
I'm having trouble trying to load multiple large netCDF files into a pyspark dataframe
xarray won't work cause it keeps crashing the kernel and I can't really use any other method since I'm just coding on a school env that I can't edit
 frank blade
Yo, how do you decrease the majority and increase the minority data at the same time? Is it possible with sklearn smote?
I'm trying to balance my data.
potent lynx
I know about SMOTE
Synthetic Minority Oversampling technique
heres the link
might be helpful
frank blade
potent lynx
Synthetic Minority Oversampling technique
i know about that
just finding the right technique
frank blade
alright, maybe I'll just change the parameters of my model
potent lynx
or
you could go with the classic upweighting and downsampling techniques
just for the imbalanced data
frank blade
potent lynx
you could go with the classic upweighting and downsampling techniques
never heard of that before, what is it called?
potent lynx
sampling and splitting
go to developers.google.com
machine learning
data-prep
construct/sampling-splitting/imbalanced data
past meteor
As usual, I'm skeptical about SMOTE, class weights, ...
I prefer just doing it as-is and selecting a cut-off myself through PR-curves / ROC / ...
frank blade
thanks, I'll look up for it!
queen cradle
quartz ivy
if dataset is too small theers nothing i can do. might just give up on this one ...
You don't have enough data for a "big data"-style approach. In order to make any progress, you will need a simpler model. You could try random forests or support vector machines, though they might not work any better.
You might consider feature engineering. This is not fashionable, but it works on small data sets. The idea is that you use your domain-specific knowledge and your understanding of the data to construct, by hand, new features as functions of the old ones. For example, maybe the distribution of decay rates is different between benign and cancerous cells. (E.g., maybe the average decay rate is different, maybe the maximum decay rate is different, etc.) You could construct new features for the distribution of decay rates in the image; maybe these features can distinguish the two cell types. Or maybe it's the case that the height of the peak values is different between the two cell types, or the width of the peak is different, or the time to reach the peak, or lots of other things.
If you have enough data, then a fancy neural network model can discover these relationships. Feature engineering is most useful when you don't have enough data. It requires a lot of time thinking of potential features and evaluating them. It may be worthwhile if the application is valuable enough. However, it can be fragile. If your data set is too small, then it's possible that the relationship you discover is spurious and will disappear in a larger data set. (You can view this is a multiple hypothesis testing problem: For each potential engineered feature, you need to test the hypothesis that it's significant; if you test enough potential features, then by random chance one or more will look good.) Feature engineering tends to work better when the new features have simple conceptual descriptions that make scientific sense. I can't guarantee that it will help you, but it's something to consider.
past meteor
General tip for feature engineering, you can look at the errors on the validation set to figure out what can help. A classic one is realising you need a holiday variable in forecasting
still moon
@solemn breach I learned something embarrassing about my model... rather about the data I'm using to train it. I inadvertently put a limit of 10 records from my 37000 record data set for the training process. So it was only learning on 10 records.
Having corrected that, unfortunately, I notice no real improvement. Loss rate is fluctuating around 1000 and accuracy is fixed on 0.0841... this is without my regularizer layer, however (thought I'd take that out and see how it does without it).
You told me to add variance, but the problem is I'm working with medical data like fasting blood glucose. There's only so many values you can have for such a data point...
hasty mountain
bold timber
whether it means that the Encoder will process the original sentence input, whil...
Yes, that's correct.
steel forge
how can i take the adress only from this format? but from multiple sources as this is just an example

i'm thinking of using a regex but i aint sure
fresh tiger
Hey, I have a question regarding numpy's histogram2d function.
I have code that produces spike plots, and also contours on top of heat maps (screenshot 1 and 2 resepctively)
the plotting code for both screenshots (respectively) is as follows:
    heatmap, xedges, yedges = np.histogram2d(everyMortonValueDf['morton'].values.tolist(), everyMortonValueDf['index'].values.tolist(), bins=50)


    extent = [xedges[0], xedges[-1], yedges[0], yedges[-1]] # [-1] lets us access the last value of array.
    print(xedges[0])
    print(xedges[-1])
    print(yedges[0])
    print(yedges[-1])

    print(np.count_nonzero(heatmap.T))

    fig = plt.figure(figsize=(9,9))

    #sns.heatmap(heatmap.T, cmap="viridis")
    #plt.clf()
    #plt.imshow(heatmap.T, extent=extent, origin='lower', cmap='hot')
    #plt.show()
    plt.clf()
    plt.imshow(heatmap.T, extent=extent, origin='lower', cmap="hot", aspect='auto', interpolation="None")
    plt.colorbar()
    plt.contour(heatmap.T, extent=extent, colors="white", linewidths=0.7)
 heatmap, xedges, yedges = np.histogram2d(everyMortonValueDf['morton'].values.tolist(), everyMortonValueDf['index'].values.tolist(), bins=(31,31))

    X, Y = np.meshgrid(xedges[:-1], yedges[:-1])

    # 3D creation
    fig = plt.figure(figsize=(9,9))
    fig.suptitle('Spike plot of right lane changes')
    ax = fig.add_subplot(projection="3d")
    mappable = ax.plot_surface(X, Y, heatmap.T, cmap="coolwarm")
    ax.set_xlabel('Morton (scaled by 1e10)')
    ax.set_ylabel('index')
    ax.set_zlabel('freq')
    ax.zaxis.set_rotate_label(False)
    ax.view_init(elev=45, azim=-70)
    #ax.set_zlabel('freq')
    #ax.set_zlim(bottom=-30)

    fig.colorbar(mappable=mappable, pad=0.1)
    plt.show()


 dense forge
do someone know a package to train a chat ai for a discord bot?
fresh tiger
I want to kindly confirm my understanding in terms of:
Do the spikes represent a single bin, i.e: would a spike : /\ denote an entire bin, so the highest spike would be a single bin with the highest frequency.
Or, does a spike represent more than one bin. I understand it as the aforementioned scentence. So in that case, the countour plot (screenshot 2) could be viewed as: where we have more close contours = bins that have a much higher frequency of scatter plot point occurances?
queen cradle
fresh tiger
I want to kindly confirm my understanding in terms of:
Do the spikes represent ...
The meaning of a spike depends on its width. If I understand Matplotlib correctly, then the height at the center of the bin will always equal the value assigned to that bin. So if the spike is a single bin wide (e.g., a single 1 surrounded by 0's), then you get a very narrow spike contained in that bin. If you have a square of four 1 values surrounded by 0's, however, then you get a little plateau connecting the centers of the four bins. If you have a chain of spikes in a line, like you do in your picture, then you get a ridge.
 molten hamlet
 sharp bone
I downloaded instaloader using these 3
-m pip install instaloader
pip3 install instaloader
pip install instaloader
But when I run a script that has
import instloader
it returns with "ModuleNotFoundError: No module named 'instaloader'" Why is this and how to fix?
agile cobalt
we will not help with scraping Instagram
sharp bone
I posted in wrong channel?
 fossil scarab
dense forge
do someone know a package to train a chat ai for a discord bot?
fossil scarab
dense forge
do someone know a package to train a chat ai for a discord bot?
One of ChatGPT's older models should work for a bot, but in general you need a natural language AI. and then you need a pre-trained databse
has anyone used an AI to train another AI in coding? I am using a model that is in est. 85% correct but makes numerous syntax errors, I am trying to get the bot im training to be around 90% correct, but I am using the idea of human programming suggestion over direct fixes any tips?
young granite
can one explain to my why when i use MultiOutputRegressor(SVR()) on ~900 Sets of 30 Features and 15 Targets takes only 2min and when i turn around Feature and Target its >10min? (i do use Scaler in both cases)
plain jungle
plain jungle
Finally got it patched

Automate algebra with this this in-depth tutorial on implementing a neural network to solve math questions.
Build from scratch using the numpy library and create a dynamic model for your neural network in Python. Expand your skills even further with another tutorial on automation using the selenium library.
Video Highlights:
- 00:00 Intro
- 0...
 warped wigeon
Anybody know how I can improve my image classification model? I'm mostly following the tutorial, but the validation accuracy is consistently bad. This is my sequential:
model = Sequential([
    # Augmentation
    layers.RandomFlip("horizontal", input_shape=(img_height, img_width, 3)),
    layers.RandomRotation(0.1),
    layers.RandomZoom(0.1),

    # Processing
    layers.Rescaling(1. / 255, input_shape=(img_height, img_width, 3)),
    layers.Conv2D(16, 3, padding='same', activation='relu'),
    layers.MaxPooling2D(),
    layers.Conv2D(32, 3, padding='same', activation='relu'),
    layers.MaxPooling2D(),
    layers.Conv2D(64, 3, padding='same', activation='relu'),
    layers.MaxPooling2D(),
    layers.Dropout(0.2),
    layers.Flatten(),
    layers.Dense(128, activation='relu'),
    layers.Dense(num_classes)
])
My dataset consists of about 16k images, labelled with 86 labels. I tried training this with Transformers/Pytorch as well, and the output was a lot better than I expected, at maybe 0.7 accuracy, though I'm trying to port this to Tensorflow/Keras.

I previously tried using no dropout, a lower number of epochs, and a lower validation split, but that was much worse:

Should I perhaps try to decrease the learning rate?
plain jungle
@warped wigeon have you tried leaky ReLu or some other activation function. ReLu is good but can result in a dying node problem, and that may or may not be why your model is platooning prematurely
Also 86 out (label) may be a lot, try a smaller classification
warped wigeon
I'll try these, what would be a good batch size for this dataset?
Also, about how many labels would be ideal for this model? @plain jungle
plain jungle
warped wigeon
Also, about how many labels would be ideal for this model? <@319199396724211722>
Probably try just getting it to work with 2 of a cat and dog at first and once when you have a model with high accuracy expand the outputs and hidden layer nodes accordingly
warped wigeon
I might just try to train VGG16 with ImageNet weigths on this, even though it'll take like 60x longer
hasty mountain
warped wigeon
Anybody know how I can improve my image classification model? I'm mostly followi...
Your model seems quite small for 86 labels and just 16k images.
Did you use the same model in Pytorch when you got 0.7 accuracy? Or was it with Transformer or another auxiliary model?
hasty mountain
warped wigeon
I might just try to train VGG16 with ImageNet weigths on this, even though it'll...
Maybe you could consider using VGG16 feature extracting layers in evaluation mode to extract features from your images, then add some classification layers that will actually be trained... 
That could make things faster...
warped wigeon
hasty mountain
Your model seems quite small for 86 labels and just 16k images.
Did you use the ...
I used a ViTForImageClassification with google/vit-base-patch16-224-in21k, this is the original training code:
https://paste.pythondiscord.com/avupofazix
I'm still new to ML in general, so I apologize if this code makes no sense
 torpid shadow
hi, can anyone teach me how to work with the chatbot and spacy program?
serene scaffold
torpid shadow
hi, can anyone teach me how to work with the chatbot and spacy program?
you first have to know what you want to do with spacy.
I don't know if there's a specific library called "chatbot" that is widely known, so I can't help you with "the chatbot".
torpid shadow
im trying to make a chatbot
im using the chatterbot and spacy
my program told me to get spacy
can i send u my code on dm/
warped wigeon
hasty mountain
Your model seems quite small for 86 labels and just 16k images.
Did you use the ...
okay I just found out I could be doing all this with transformers still, turns out there's a TF interface as well
dusty bay
How do I change the xtick on the plot. I am using matplotlib
 solemn breach
how does neural networks measure time per pattern?
 earnest widget
Hi guys, I am using MobilenetV3 large model with PyTorch. The dataset I have is a total of 862 images and I cannot get access to more data. But the results are strange, it directly reaches 100% accuracy for training.

I have used a batch size of 16 also with learning rate and weight decay.
I think the training set is getting generalized quickly.
agile cobalt
pretty sure that memorized, not generalized
you're most likely overfitting
past meteor
young granite
can one explain to my why when i use MultiOutputRegressor(SVR()) on ~900 Sets of...
How many samples do you have?
earnest widget
agile cobalt
pretty sure that memorized, not generalized
you're most likely overfitting
Yeah most likely overfitting. But how can that be solved other than adding more data? Which I do not have.
agile cobalt
data augmentation might help
earnest widget
Can't data aug actually make the performance worse at times?
agile cobalt
yes
notice the "might"
probably still worth a try
you could also try lowering the learning rate, though that I'm even less sure about
just wondering, what did your accuracy look like before fine tuning? or were the classes not present in the original outputs
past meteor
young granite
can one explain to my why when i use MultiOutputRegressor(SVR()) on ~900 Sets of...
A quasi important thing to know is that underlying most linear models there's an optimisation problem you can solve in the primal (the unknowns are the amount of features) and in the dual (the unknowns are the amount of data points you have). SVMs that make use of a kernel different than the linear kernel (e.g., SVR in sci-kit) solve in the dual by default so they scale poorly to having more data
Afaik SVMs are not multi-output by default so having 30 targets means you're making 30 models but I'd have to double check.
agile cobalt
agile cobalt
probably still worth a try
addendum on that one: make sure to pick augmentation techniques that make sense for this problem, i.e. the image after augmentation preferably looks like something that could be in your dataset, avoid doing completely random operations
maybe take a look at https://pytorch.org/blog/how-to-train-state-of-the-art-models-using-torchvision-latest-primitives/ if you haven't yet - might be slightly out of date but I would expect for most things to hold up
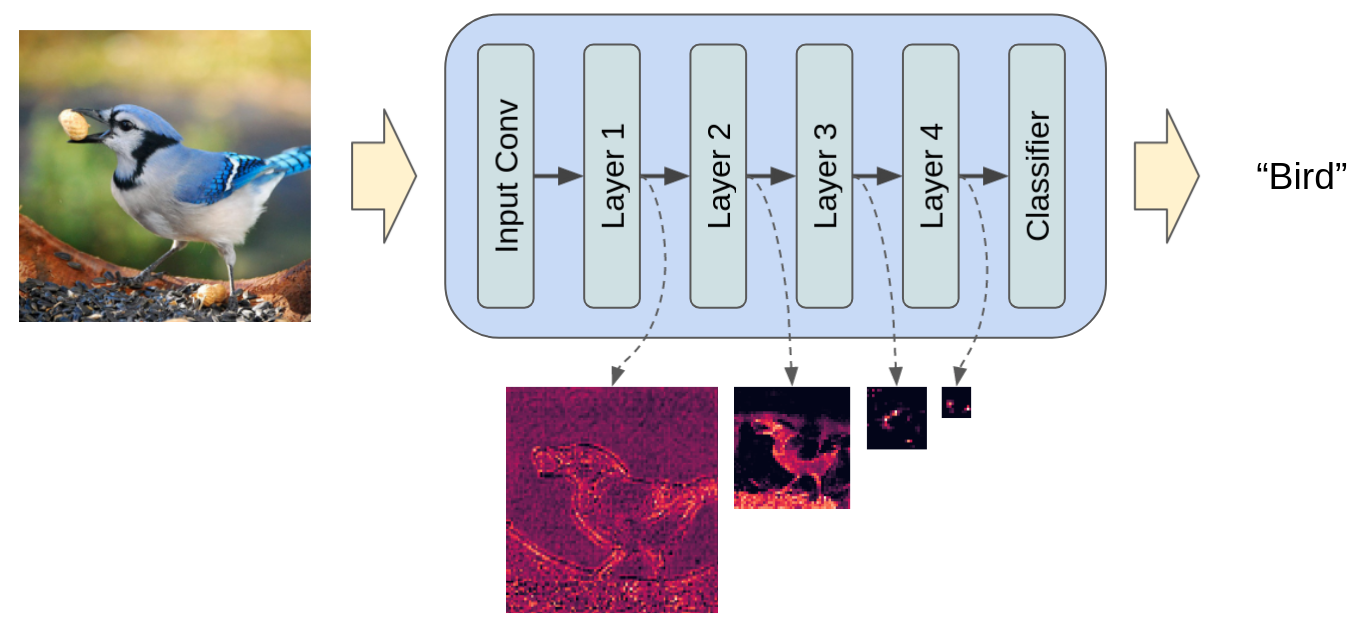 earnest widget
agile cobalt
just wondering, what did your accuracy look like before fine tuning? or were the...
earnest widget
agile cobalt
just wondering, what did your accuracy look like before fine tuning? or were the...
Yeah learning rate is already 0.001, I tried 0.0001 with weight decay also, no major difference. But lowering batch size actually made a difference in the lowering the validation loss. Currently training without any learning rate or weight decay to see what it's like. But the max augmentation I have is just the basic transformation according to the PyTorch docs for MobileNetV3 inference section: https://pytorch.org/vision/main/models/generated/torchvision.models.mobilenet_v3_large.html#torchvision.models.mobilenet_v3_large. This is what it looks with 5 epochs currently going on.

NO fine tuning.
agile cobalt
earnest widget
NO fine tuning.
wait what? seriously?
agile cobalt
...
are you using a pretrained model or not?
because if so, then you are fine tuning?
earnest widget
Yeah pretrained but I did not add any new parameters to it.
agile cobalt
I'm pretty sure that still qualifies as fine tuning
past meteor
What is your setup now @earnest widget you just added fully connected layers but froze the conv?
earnest widget
No freezing of any layers. I am just using it as is:
model.eval()```With the respective weights according to the docs in PyTorch.
And my optimizer as ADAM.
earnest widget
agile cobalt
maybe take a look at https://pytorch.org/blog/how-to-train-state-of-the-art-mode...
Maybe augmentation actually might help. I should go through this entire thing.
past meteor
Read this @earnest widget http://karpathy.github.io/2019/04/25/recipe/
Musings of a Computer Scientist.
earnest widget
Yeah I will check it out. THanks.
I still think MobileNetV3 could be the reason for the low performance.
fresh tiger
queen cradle
The meaning of a spike depends on its width. If I understand Matplotlib correctl...
If I am understanding correctly, does that mean that a spike like the ridges I have above are the product of many bins? So, is it correct to say that: When we have a high amount of countours (where a spike is) at x: 1.6 to 1.7 = a higher occurance of points between x:1.6 to 1.7 from the scatter plot that the histogram2d was based on?
cold osprey
Using a pretrained model and training on another dataset that is not part of the pretrained model's is fine tuning
frank blade
why is my scikit gridsearch always resulting in BSOD:
system_service_exception nvlddmkm.sys
queen cradle
fresh tiger
If I am understanding correctly, does that mean that a spike like the ridges I h...
Yes, I believe that's correct.
solemn atlas
@past meteor can i dm you? Have some few questions, some personal questions
past meteor
Can we keep the chat here? I don't know all the answers, other people can answer (and correct me)
past meteor
I'm probably not comfortable answering anything in DM I wouldn't answer in this chat so just ask here
solemn atlas
Ok
cold osprey
not sure why ppl like to dm LUL
hasty mountain
Can someone help me with a riddle between training and evaluation mode behaviour?
I have a model which is based on a ResNet-18, feature extractor with convolution layers serving as downsampling layers and with dropout layers (20%) after 1 downsampling + 5 residual blocks. There's 2 convolutions per residual block, with 1 batch norm after each one.
I'm fine-tuning my model in a small dataset (1100 images), and using a batch size of 1 to make things easier when I begin self-learning stage(to create my actual dataset).
Thing is...my model is performing quite well in the training stage, and when I check its outputs and compare with the inputs and targets, things are pretty fine.
However, when I switch my model to evaluation mode...it keeps generating just a single output, no matter what the input is.
Any suggestion on what could be causing this?
I suspect that the BatchNormalization may be the issue. For some motive, I didn't get an error for using batch size = 1. In training mode, the Batch Norm keeps track of the running estimates of the computed mean and variance. In evaluation mode, those estimates are used for normalization.
But then...shouldn't, then, my model perform poorly both in training and evaluation mode? Why does it performs poorly exclusively in evaluation?
hasty mountain
I think I get it now.
In training mode, since my batch is 1, the BatchNorm computes the mean and variance of this single batch and uses it to normalize it. A normalization done especially for that sample.
But, since the evaluation uses a moving average of all mean and variances registered through training, this normalization is more generalistic, thus, lower performance
Math is such a strange sorcery
past meteor
Layernorm gives way less headache
hasty mountain
Yes, but I remember it wasn't good for my Unsupervised Learning Pre-training. The model gets too unstable and prone to collapse.
Good thing that I can turn off this moving average behaviour of Pytorch's Batch Norm
past meteor
How are you pretraining? The oldschool stepwise autoencoder approach?
hasty mountain
No, I've used Minimum Entropy
An idea that I got from a recent paper, which is basically using embedding layers after the feature extracting layers and using the argmax of a normalization mode to get the minimum entropy of that data
Also, using data augmentation techniques for the input
past meteor
Hadn't heard of this, I'll look it up 😮
This is another canonical approach: https://arxiv.org/abs/2006.07733

arXiv.org
We introduce Bootstrap Your Own Latent (BYOL), a new approach to
self-supervised image representation learning. BYOL relies on two neural
networks, referred to as online and target networks, that interact and learn
from each other. From an augmented view of an image, we train the online
network to predict the target network representation of the...
hasty mountain
past meteor
Hadn't heard of this, I'll look it up 😮

Self-supervised representation learning is becoming more and more popular due to its superior performance. According to the information entropy theory…
They mentioned that BYOL too
past meteor
But I guess MinEnt is not constrained to images as BYOL is (or was?)
hasty mountain
past meteor
But I guess MinEnt is not constrained to images as BYOL is (or was?)
Well... I've been making some experiments on Graphs for molecular representation, so... Maybe not.
past meteor
Tbh BYOL just needed you to have an augmentation. I think if you have one for your graph (which may be easy if certain permutations result in the same graph) then it would work too? I don't know
I've had a long day but I'll put MinEnt on top of my to-read list 🙂
Do you use GNNs or just regular convnets?
hasty mountain
past meteor
Tbh BYOL just needed you to have an augmentation. I think if you have one for yo...
There's also the MolCLR, which is also around the idea of entropy
hasty mountain
past meteor
Do you use GNNs or just regular convnets?
Convnets, but I've started using a GNN for a research recently.
Since dealing with molecules kinda requires GNNs, since those are more efficient...
past meteor
Haven't used geometric DL myself yet but I've been pushing for a project related to it. Hopefully they'll deliver soon
hasty mountain
hasty mountain
I think I get it now.
In training mode, since my batch is 1, the BatchNorm compu...
It seems I was wrong
And the model performs poorly in unseen data. So I'll just retune-it with a bigger batch size
dusk aurora
hasty mountain
Convnets, but I've started using a GNN for a research recently.
I was looking to get started on neural networks, their architectures and underlying theory.
Could you recommend some book or source that helped you?
hasty mountain
dusk aurora
I was looking to get started on neural networks, their architectures and underly...
Uh, I'm not the best person for recommendations.
There might be some good ones in the pins. What I did was mostly see some online classes in coursera as a listener, try projects by myself, see some pytorch tutorials, test things by myself based on what I've seen on papers...
Maybe someone else here can help
But, for theory, folks here tend to recommend the 3 blue 1 brown
Mathematics with a distinct visual perspective. Linear algebra, calculus, neural networks, topology, and more.
There's also his youtube channel
dusk aurora
hasty mountain
But, for theory, folks here tend to recommend the 3 blue 1 brown
Thank you!
jolly dock

Learn how to use TensorFlow 2.0 in this full tutorial course for beginners. This course is designed for Python programmers looking to enhance their knowledge and skills in machine learning and artificial intelligence.
Throughout the 8 modules in this course you will learn about fundamental concepts and methods in ML & AI like core learning alg...
would this vid help me to learn basics of tensorflow and coding an ai?
would you guys recommend it
will it worth the 7 fucking hours
 spare briar
hasty mountain
I think I get it now.
In training mode, since my batch is 1, the BatchNorm compu...
spare briar
hasty mountain
I think I get it now.
In training mode, since my batch is 1, the BatchNorm compu...
You can't compute batch statistics with batch size of 1...
also would strongly recommend VICReg over BYOL or MinEnt
why are you using such a small batch size
agile cobalt
jolly dock
would you guys recommend it
will it teach the basics? maybe
will you learn it properly? probably not
worth the 7 hours? unlikely
we usually recommend against those ultra large videos - usually just watching without exercising what you learn won't really teach you anything
agile cobalt
there are a few resources we recommend pinned + some more on our website
!resources
arctic wedgeBOT
Resources
The Resources page on our website contains a list of hand-selected learning resources that we regularly recommend to both beginners and experts.
agile cobalt
I personally recommend following a course like Andrew Ng's machine learning specialization on Coursera or Jeremy Howard's on course.fast.ai
agile cobalt
pytorch
jolly dock
why
agile cobalt
it is just more popular than tensorflow now (as far as I can tell)
agile cobalt
either of them work just fine
 sinful valve
Hiii I'm confused help Wich type of ai is used in medical imagery is it embedded ai or standalone ai?
 undone topaz
im working on ocr of devanagri script and i am currently stuck on detecting the horizontal line and removing it.any idea how can i acheive this
 hasty mountain
spare briar
You can't compute batch statistics with batch size of 1...
hasty mountain
spare briar
You can't compute batch statistics with batch size of 1...
That's the thing. I should get an error for that.
Maybe I'm using a Pytorch version that didn't have this assertion.
hasty mountain
spare briar
why are you using such a small batch size
Just to make things convenient.
My dataset is composed of 46,000 images, but just 1,100 are labeled. So, the unlabeled samples have N+1 label that serves as a NaN label.
So, for supervised fine-tuning, every time dataloader batches my dataset, I have to check whether each item in that batch has the NaN label and remove both the label and the image.
Batch size of 1 would allow me to simply skip that batch if that's the case
But it's ok. I've fixed that for a batch bigger than 1.
hasty mountain
spare briar
also would strongly recommend VICReg over BYOL or MinEnt
"This collapse problem is often avoided through implicit biases in the learning architecture, that often lack a clear justification or interpretation. In this paper, we introduce VICReg (Variance-Invariance-Covariance Regularization), a method that explicitly avoids the collapse problem with a simple regularization term on the variance of the embeddings along each dimension individually."
Seems confusing 
But it's good to have an alternative in case batching isn't possible somehow.
I was considering to use MinEnt Loss on NLP with Transformers, but... this usually applies batching in an excentric way(at least in some papers I've seen "batch" = "number of input tokens per iteration")
hasty mountain
Now I wonder... at which point I can say that my model is "few-shot learner"?
spare briar
hasty mountain
Just to make things convenient.
My dataset is composed of 46,000 images, but jus...
this is a very small number of images
But you should do a two step process (1) train self-supervised on the 44900 unlabeled images, (2) finetune supervised on the 1100 images (these should be put into separate datasets so you get good throughput and correct batching in your dataloader)
batch size of 1 is extremely terrible in general, but especially if your model has batchnorm
your model isn't a few shot learner.
another thing I would suggest is to initialize your self-supervised training with a checkpoint trained on imagenet
hasty mountain
Meh. I don't like using pre-trained models in general. I prefer to do things by myself.
But well, the thing is: I don't have the labels for the rest of the images in my dataset. I'm using the model exactly to label them.
So far, I've pre-trained it on unsupervised configuration. Now I'm fine-tuning it on those images, so I can apply self-learning on the unlabeled images and add the most confident outputs, the generated pseudolabels, to my dataset as new labels.
spare briar
(1) it is always better in vision to start with a pretrained model, but is absolutely necessary when you have such a tiny dataset. If you don't do this you are losing a huge amount of performance.
(2) You don't need labels for the selfsupervised step, which is why we use it for the 44900 images
(3) Don't do pseudolabeling based on your 1100 images, just many epochs of selfsupervised learning
hasty mountain
The 1,100 images are indeed for supervised fine-tuning. The self-learning is on the remaining 44,900 unlabeled ones to generate the labels.
spare briar
dont generate labels at all is what im saying
do not use labels at all
use VICReg or BYOL
hasty mountain
Then how can I label my dataset?
spare briar
you dont
hasty mountain
spare briar
you only need labels for the supervised finetuning step
hasty mountain
spare briar
you dont
Not an option
spare briar
it is an option, I just explained how to do it
hasty mountain
VICReg/BYOL/MinEnt is for pretraining, unsupervised learning
spare briar
right
hasty mountain
I've pretrained my model already
spare briar
on what
hasty mountain
On the entire dataset, labeled and unlabeled samples.
spare briar
okay then all you need to do is finetune on the 1100 images
i honestly think you can get the most performance by labeling more images
hasty mountain
Yes...that's...what I'm trying to say that I'm doing already
spare briar
ok so what i suggest is throw away your pretrained model
and redo it starting with an imagenet checkpoint
hasty mountain
spare briar
i honestly think you can get the most performance by labeling more images
I could get an outstanding performance if I were to label all the 46,000 images...but then I'd have to make a storage of ibuprofen and anti-inflamatories to deal with tendonytis
spare briar
time to get tendonytis haha
you could do something clever like use the embeddings from self supervised learning to accelerate your labeling
take embeddings, cluster them and use the clusters to guide labeling
anyways real labels is what you really need if you want this thing to work well
hasty mountain
spare briar
you could do something clever like use the embeddings from self supervised learn...
That's the thing. If the model doesn't know what the classes are, how can it label them?
That's why I'm doing fine-tuning ---> self-learning.
hasty mountain
spare briar
take embeddings, cluster them and use the clusters to guide labeling
Yes, that's one thing I'll consider.
First I'm not using the embedding layers, then I'll use the embedding layers.
hasty mountain
spare briar
the model suggests labels, you clean them up
Why use self-learning, then?
spare briar
so that the embeddings give you better clusters that give you better labels
if you manually label everything i of course agree with you that the ssl step is not necessary and you should go straight to supervised learning
 rich river
any recommendations on tutorials of GBDT?
where do you ususally refer to for resources?
 icy folio
Hi, everyone.. I want to build my career in AI . So, from where should I start learning for AI.?
 thin hull
Hey guys.
I got an idea to make a machine learning model that recognizes images and then recognizes text written in that image and numbers or like a price in it.
What's this concept would be called? Not just imagine recognition right?
earnest widget
thin hull
Hey guys.
I got an idea to make a machine learning model that recognizes images ...
You mean object detection?
thin hull
earnest widget
You mean object detection?
I think so.. my idea is that i want user to upload a picture and i want to verify if it's correct picture by it's looks let's say and the name i want to see it to save the name of that user and the price that's written on the picture
earnest widget
thin hull
I think so.. my idea is that i want user to upload a picture and i want to verif...
Yeah so you basically want to detect within the image, that is object detection. You would have to label your images which have the objects you want with bounding boxes first.
thin hull
earnest widget
Yeah so you basically want to detect within the image, that is object detection....
Oh yes that's it
So i need to look up for object detection right?
earnest widget
Yes.
thin hull
Is it open CV
Would it be possible if i do the model and add it into a form using react Django for production or that's impossible
earnest widget
Yeah should be possible. You want to implement into a web app/GUI?
earnest widget
Yeah it is possible.
thin hull
For data sets i would use kaggle for fake dataset? Or so i need to get real data set images
earnest widget
You can use Kaggle but if you want a specific use case, better to collect your own data.
cold osprey
there should also be pretrained models already which u can leverage from
thin hull
On kaggle or do i need to buy them
thin hull
earnest widget
You can use Kaggle but if you want a specific use case, better to collect your o...
How much images idéally would i need
 spark nimbus
I find myself using this pattern quite frequently, and was wondering if there was a better/more efficient way to do it:
# Columns: a,b,c,d
# a,b,c are key columns

df['d_count'] = df.groupby([a,c], as_index=False).agg({b: list, d: 'count'}).explode(b)
```the main issues with this approach:
- you need to create a list for each entry of b, which is slow and uses a lot of memory
- you can't guarantee the indexes of the results match the indexes of the dataframeI would say over 5k is good, more the merrier. But quality is important over quantity. I think for object detection model, you need a good size if you want to use YOLO.
thin hull
earnest widget
I would say over 5k is good, more the merrier. But quality is important over qua...
YOLY is website right?
earnest widget
thin hull
YOLY is website right?
YOLO is a popular object detection model.
thin hull
Oh okay
So the source code is already written? I just need to download it?
Quantity like the pictures must be clear right?
earnest widget
Yes better to get some pictures with good lighting and less distortions.
earnest widget
thin hull
So the source code is already written? I just need to download it?
Yes.
thin hull
Oh okay i understand
Thanks a lot!
If the model comes pretrained
How many images then do i need
Also 5k?
 tall tulip
I'm working on AWS sagemaker and here I want to train a model using tensorflow, But I'm facing this error
ClientError: An error occurred (AccessDenied) when calling the CreateBucket operation: Access Denied
I know It's says AccessDenied to create a bucket but I don't want to create any bucket, I already have bucket which I want to use but It's creating a new bucket I think. below is my code:
                        role=role,
                        instance_count=1,
                        instance_type=instance_type,
#                         image_uri=image_uri,
                        model_dir='s3://your_bucket_name/models-lstm/',
                        framework_version="2.12.0",
                        py_version="py310",
                        hyperparameters={
                          'epochs': epochs
                        },
                        script_mode=False
                      )
## Fit the model
estimator.fit('s3://your_bucket_name/Datasets/',
              wait=False)

## this is the function in LSTM.py to load data from S3
def _load_data(base_dir):
    """Load training and testing data"""

    X_train = np.load(os.path.join(base_dir, 'X_train.npy'), allow_pickle=True)
    y_train = np.load(os.path.join(base_dir, 'y_train.npy'), allow_pickle=True)
    X_test = np.load(os.path.join(base_dir, 'X_test.npy'), allow_pickle=True)
    y_test = np.load(os.path.join(base_dir, 'y_test.npy'), allow_pickle=True)

    return X_train, y_train, X_test, y_test

## this is the function in LSTM.py to take/handle arguments
def _parse_args():
    parser = argparse.ArgumentParser()

    # Data, model, and output directories
    # model_dir is always passed in from SageMaker. By default this is a S3 path under the default bucket.
    parser.add_argument('--model_dir', type=str)
    parser.add_argument('--sm-model-dir', type=str, default=os.environ.get('SM_MODEL_DIR'))
    parser.add_argument('--train', type=str, default=os.environ.get('SM_CHANNEL_TRAINING'))
    parser.add_argument('--hosts', type=list, default=json.loads(os.environ.get('SM_HOSTS')))
    parser.add_argument('--current-host', type=str, default=os.environ.get('SM_CURRENT_HOST'))
    parser.add_argument('--epochs', type=int, default=1)

return parser.parse_known_args()```How can I resolve this I don't know what I'm doing wrong in this but it seems good but still arise error
 weary parcel
i m doing a machine learning project
this is the code i want to run
df.groupby('parental level of education').agg('mean').plot(kind='barh',figsize=(10,10))
plt.legend(bbox_to_anchor=(1.05, 1), loc=2, borderaxespad=0.)
plt.show()
this is my data
gender race/ethnicity parental level of education lunch
0 female group B bachelor's degree standard
1 female group C some college standard
2 female group B master's degree standard
3 male group A associate's degree free/reduced
4 male group C some college standard
.. ... ... ... ...
995 female group E master's degree standard
996 male group C high school free/reduced
997 female group C high school free/reduced
998 female group D some college standard
999 female group D some college free/reduced
I want to see the insights in 'parental level of education' but in the error it is saying could not convert 'malefemale' why did this code jump to 'gender' column
cold osprey
!code
arctic wedgeBOT
 unreal crescent
hey, I have a dataset that contains post data of different profiles. There is a row for each post. The columns are profile_id, descriptions, number of likes, comments etc.
I want to combine all the post descriptions of a single profile together. Right now I am doing it this way:
tall tulip
@unreal crescent have you tried groupby?
unreal crescent
def combineDesc():
    x = df1.loc[df1['profile_id'] == profileId]
    y = df2.loc[df2['profile_id'] == profileId]
    desc = x.iloc[0]['description'] + ' ' + y.iloc[0]['description']
    return desc
Is there a faster way to do this?
unreal crescent
tall tulip
<@672464720082632710> have you tried groupby?
nope
would it work for combining strings?
tall tulip
unreal crescent
would it work for combining strings?
You can groupby, .join() and regex which ever work for you use that one
 fickle peak
Which is best? AutoGPT, Vicuna, GPT4All, ColossalChat, ShareGPT, and everything else...
I have GhatGPT Plus, and of course that works great, but our tokens are limited even on a paid account, also its severely censored, even if you do not want to do morally evil deeds lol.
I've installed stable-diffusion-webui and I can download and change models, it works great. I then installed Vicuna\oobabooga 13B, and it seems slow, even though I have a decent computer (AMD Ryzon 5600X 6 core 12 threads, GTX 1070 8GB, and 64GB of system ram). CPU runs ok, faster than GPU mode (which only writes one word, then I have to press continue).
I've also seen that there has been a complete explosion of self-hosted ai and the models one can get: Open Assistant, Dolly, Koala, Baize, Flan-T5-XXL, OpenChatKit, Raven RWKV, GPT4ALL, Vicuna Alpaca-LoRA, ColossalChat, GPT4ALL, AutoGPT, I've heard that buzzwords langchain and AutoGPT are the best. And that the Vicuna 13B uncensored dataset is the best to use.
Is there something I can install that is the fastest, with long memory, as I often have to write books, papers, and research for our non-profit organization?
Which ones can be trained and access the internet to be trained or do research?
Is there a 'front-end' I can install to change data models like stable diffusion?
Should I only stick to one, and which one should that be?
Unfortunately, time is severely limited, so I cannot install and test all, even though I would really have liked that.
earnest widget
I have images which are cropped, if I resize them to a specific size, will it stretch or mess up the aspect ratio of my images for the model?
mild dirge
It will strech the images yeah, how else would the size change
And it will change the aspect ratio if the aspect ratio of the cropped image is not the same to ratio of the new size
As long as you train your model on these types of images it shouldn't be too much of a problem
earnest widget
mild dirge
As long as you train your model on these types of images it shouldn't be too muc...
Yeah it should be fine, thanks.
mild dirge
There are also models that take any size image
earnest widget
Well I am using MobileNetV3 since it needs to be on a camera and the model was originally trained on 224x224 so I am sticking with that.
Seems like the appropriate way.
night prawn
I continued installing tensorflow gpu with wsl but it gives me this error message
Image.

 vital widget
Hello, I'm having trouble with an item in my homework "Feature engineering: show effect of each feature on clusters. Try to explain effects." I'm trying to infer Kmeans outlier. For this item, I drew the scatters of all 19 columns and colored the outliers, but this method did not seem very useful to me and I think it would be insufficient in the explanation. Anyone have a better suggestion?
 umbral charm
I would like to create a python script to detect a certain sound and re-act of it
But im not too sure how it would 'detect' the sound, my guess would be its frequency
so i would i get python to listen to a file, wait for a certain frequency and than react to it
audio with python is new to me so i dont even know what libraries to have
any ideas?
fresh tiger
Hey! Not sure if this is the right place, but I currently have a dataset from which I want to extract data that, when graphically plotted against time, follows a specific semantic profile.
In this case, I would like to extract data points that when plotted, look like a smooth 3rd order polynomial plot.
So the idea is to plot all possible sequences of the data and then, based on an algorithm see if a spline can be constructed on top of that plot.
The output of this should be: smooth plots that follow a peak above 0 and below 0.
I am mainly wondering if what I am trying to do is already something common, I just can’t seem to find the right words to describe it in google and would appreciate any insights 🙂
umbral charm
fresh tiger
Hey! Not sure if this is the right place, but I currently have a dataset from wh...
if the order is close to a 3rd degree polynomial you can use np.polyfit