#data-science-and-ml
1 messages · Page 58 of 1
 boreal gale
 fallow frost
btw do you know if there is something like Dask's bag in pyarrow? (a structure of nested JSONs)
boreal gale
if that's a question for me, i haven't even heard of bag before today 😂 so no
fallow frost
the D-bag API 😂
https://youtu.be/-qIiJ1XtSv0

In this video, Matt Rocklin gives a brief introduction to Dask Bags.
Dask is a free and open-source library for parallel computing in Python. Dask is a community project maintained by developers and organizations.
Dask Bag implements operations like map, filter, fold, and groupby on collections of generic Python objects. It does this in parall...
 loud needle
Please help me to slove this error

 serene scaffold
loud needle
Please help me to slove this error
serene scaffold
loud needle
Please help me to slove this error
please show more of the code as text (not as a screenshot). we need to see where model1, x_train, and y_train are defined
!code
 arctic wedgeBOT
 plucky meadow
anyone able to help me solve what appears to be an error with a simple solution, but I can't figure it out.
TypeError Traceback (most recent call last)
Input In [21], in <cell line: 1>()
----> 1 temp = train.groupby(['sentiment'].count('text')['text'].sort_values(by='count',ascending=False))
TypeError: 'int' object is not subscriptable
temp = train.groupby(['sentiment'].count('text')['text'].sort_values(by='count',ascending=False))
any helpers ghreatly appreciated
serene scaffold
plucky meadow
anyone able to help me solve what appears to be an error with a simple solution,...
train.groupby(['sentiment'].count('text') must return an int.
to get more help, please do print(train.head().to_dict('list')) and put the text (no screenshots) in the chat @plucky meadow
 floral karma
why are my plotly graph options so squeezed at the end ?
 loud needle
serene scaffold
please show more of the code as text (not as a screenshot). we need to see where...
loud needle
serene scaffold
please show more of the code as text (not as a screenshot). we need to see where...
from sklearn import datasets
import pandas as pd
import numpy as np
housing = datasets.fetch_california_housing()
x=housing.data
y=housing.target
here we have concluded the feature names
df = pd.DataFrame(x)
print(housing.feature_names)
df.columns = housing.feature_names
df.describe()
USING THE DESCR WE CAN GET THE DESCRIPTION OF THE DATA
housing.DESCR
firstly split data into two parts for the training and the testing purpose randomly
from sklearn import model_selection
x_train,x_test,y_train,y_test = model_selection.train_test_split(x,y)
from sklearn.linear_model import LinearRegression
model1 = LinearRegression
model1.fit(x_train , y_train)
serene scaffold
loud needle
from sklearn import datasets
import pandas as pd
import numpy as np
housing = d...
model1 = LinearRegression -- you have to make an instance of LinearRegression
model1 = LinearRegression is the same as doing housing = datasets.fetch_california_housing
can you think of what the solution is?
loud needle
I don't have much idea
serene scaffold
do you know what classes and instances are?
loud needle
No
serene scaffold
loud needle
No
you should plan to learn more about classes and instances before you keep chugging along with data science and ML stuff. it's very important for writing Python code.
The solution to your problem is to write model1 = LinearRegression(), so that you create an instance of the LinearRegression class.
serene scaffold
you can also write model1 = LinearRegression(n_jobs=3), if you have 3 CPU cores on your computer and want to use parallelization.
you can pick a different number than 3, as long as you have that many cores.
 gilded hawk

Stack Overflow
import matplotlib.pyplot as plt
import numpy as np
def plot_archimedean_spiral(a, b, n):
theta = np.linspace(0, n * np.pi, 1000)
r = a + b * theta
x = r * np.cos(theta)
y = r * np....
 mint palm
when I need sequential embedding from BERT, should I do add_special_tokens=False.
by sequential embedding I mean for input sentence output shape is (batch_size, token_dim, embedding_size). compared to NON-sequential output whose shape is (batch_size, embedding_size)
serene scaffold
mint palm
when I need sequential embedding from BERT, should I do ``add_special_tokens=Fal...
I think that refers to tokens like [SEP] or [UNK]. whether or not you need them depends on what you're trying to do.
what are you trying to do? NER? sentence classification?
 strong granite
# Load train and test data
train_data = pd.read_csv('dataset/train.csv')
test_data = pd.read_csv('dataset/test.csv')
I am getting ParserError: Error tokenizing data. C error: EOF inside string starting at row 74037
when I am running on google colab but no error when I run in dataspell
any idea whats wrong?
serene scaffold
strong granite
```py
# Load train and test data
train_data = pd.read_csv('dataset/train.csv')
t...
did you upload it colab? I wonder if the upload wasn't complete.
in either case, look at row 74037 and see if that illuminates anything.
strong granite
serene scaffold
in either case, look at row 74037 and see if that illuminates anything.
i dont see a problem with that
the row is fine
mint palm
serene scaffold
I think that refers to tokens like `[SEP]` or `[UNK]`. whether or not you need t...
i trying to learn video-text similarity.
yes it refers to [CLS] and [SEP] for BERT-base-uncased.
So should i turn them off if i want sequential?
serene scaffold
mint palm
i trying to learn video-text similarity.
yes it refers to [CLS] and [SEP] for BE...
can you explain what the inputs to the model represent (not what they literally are), and what the output represents? "video-text similarity" doesn't quite tell me what the model is for.
 naive peak
im processing json output from gpt4 and it seems to sometimes give me weird characters in the output for some reason. It put an invalid line break in there for instance. i can't seem to figure out what the character even is if i copy it its just a line break. are there a library that could clean it up?
serene scaffold
naive peak
im processing json output from gpt4 and it seems to sometimes give me weird char...
I think this will find a nearest ASCII equivalent for non-ASCII unicode characters: https://pypi.org/project/Unidecode/

I use it in one of my projects to remove diacritical markings from latin-alphabet letters. but I think it can solve your problem as well.
naive peak
Cool thanks
 lapis sequoia
Im relatively new. I've heard watching some vids how you can never really know what the true objective of a model or optimizer is, do you guys think that is a big problem?
serene scaffold
lapis sequoia
Im relatively new. I've heard watching some vids how you can never really know w...
you can get by for a while without knowing what the optimizer is for, but if you don't know what a model is, then you don't even understand what you are trying to do.
or maybe I'm misreading your question
do you guys think that is a big problem
it's not a problem in the sense that the AIs are secretly evil and have secret motives (they are not and do not). they're probably talking about a certain aspect of model explainability
lapis sequoia
serene scaffold
you can get by for a while without knowing what the optimizer is for, but if you...
I know what the optimizer and what a model is, and I don't believe they're evil. I personally just have worked on 1 AI project before, but haven't really done anything that complex, so I wanted to hear feedback from people more experienced than me on the inner disalignment problem
 hasty mountain
Can someone give me some tips on dealing with exposure bias?
I finally discovered that this was the root of all evil within my Transformer 
I'm currently trying scheduled sampling, but I still don't trust this method that much...specially since I've just learned about it.
ChatGPT told me that there's this method and there's also Reinforcement Learning(which I know it was the method OpenAI used for it). The goal is to use RL, but I'm also interested into knowing more about alternatives...or more about how to implement those(if there's any "trick" that should be done).
 violet gull
when i do softmax its soft(x) * (1 - soft(x)) * DLds
when i multiply by DLds is it element wise or matrix multiplication
violet gull
cause idk how im suppose to multiply a 2x1 and a 2x1 and get a 2x1
mint palm
serene scaffold
can you explain what the inputs to the model represent (not what they literally ...
input is an video embedding (fed to video transformer), and text embedding (fed to text transformer)
 modest mulch
Could someone explain what predictive distribution is? When does a model have a "predictive distribution"? That is one of the constraint in the MICE method for imputing missing values. The model that you use for regressing each column with missing values using the other columns must have "predictive distribution"
 past meteor
modest mulch
Could someone explain what predictive distribution is? When does a model have a...
past meteor
modest mulch
Could someone explain what predictive distribution is? When does a model have a...
Imagine you generate 75 numbers from 1 to 100 uniformly. You've not observed all numbers but based on those that you have you can form a distribution that you can sample from to potentially get values that you didn't directly observe
The difficulty is in picking the right distribution. The default is often a normal distribution but you data was generated from a uniform one. Either way, once you pick the distribution of choice, for example a normal distribution, you can estimate its parameters and sample to impute. This works in the univariate case, however MICE approaches it differently by indeed saying that other variables should tell you something about the one you're trying to impute
modest mulch
past meteor
The difficulty is in picking the right distribution. The default is often a norm...
But how does linear regressing have predictive distribution? Doesnt it model the expected value of the dependent variable conditioned on the in dependent variables? So its more of a point estimate, yet it was used in the original paper of MICE
Oh yea i get that at the end you're modelling the distribution, then my question becomes what examples of model don't model that?
They all do, no?
Even a neural network
But it is only modelling the expected value, it has no idea about the std
past meteor
modest mulch
But how does linear regressing have predictive distribution? Doesnt it model the...
You can get distributions instead of point estimates trivially by using Bayesian variants
With neural nets you can also estimate the parameters of a distribution and sample from that
modest mulch
True. Then I can't use the standard neural network or linear regressing in MICE? I would have to use Bayesian vairants as you have said
past meteor
Let me actually skim the paper
modest mulch
past meteor
Let me actually skim the paper
I am not actually sure whether the papers expilicity states that the model must have predictive distribution, but I saw someone on stats exchange say that, let me get the link
modest mulch
past meteor
It's a bayesian method

Cross Validated
Multiple Imputation by Chained Equations (MICE) - Can we also use non-regression methods while inferring missing values?
From the MICE theory I have come across, linear/logistic regression methods ...
past meteor
In general θ is a parameter vector, for example for the normal distribution with 0 mean it would just be [stdev], for a gamma distribution it would be [shape, scale] etc...
modest mulch
Yea so then as you have said we must use Bayesian vairants to model other paramters and not just the expected value?
modest mulch
modest mulch
https://stats.stackexchange.com/questions/553560/multiple-imputation-by-chained-...
The first answer here states that, i am just surprised in the paper they just mentioned using linear regressing, which in its standard form models the expected value
past meteor
modest mulch
Yea so then as you have said we must use Bayesian vairants to model other paramt...
I haven't seen the full details of the algorithm in all honesty. This is mostly from intuition and my intuition seems to be correct based on me skimming the paper. Maybe there are some simplifications of the algorithm
modest mulch
past meteor
I haven't seen the full details of the algorithm in all honesty. This is mostly ...
Sounds good, i think that makes sense
Thank you for your help mate!
past meteor
modest mulch
Sounds good, i think that makes sense
Thank you for your help mate!
Also have a look at the Expectation-Maximization algorithm for imputation, it's quite similar to this algorithm but not bayesian
modest mulch
Yea that sounds more Interesting to be honest, bloody hate Bayesian things, will defo check it out
serene scaffold
mint palm
input is an video embedding (fed to video transformer), and text embedding (fed ...
you probably don't need special tokens, then
 teal mortar
hello, anyone know any good articles on text-to-speech models, want to try to train a network that takes two inputs, audio and text, and produces an output and audio file where the input text is read by voice in the input recording, not fully sure how to approach this, so any suggestions will be welcome, I already did preprocess the data, aligned text with voice recordings, interested more at this point at different model architectures and how the inputs should be
serene scaffold
teal mortar
hello, anyone know any good articles on text-to-speech models, want to try to tr...
tacotron is a great architecture for that
(that really is the name of it. they also considered calling it sushitron, but the taco people won out.)
teal mortar
serene scaffold
tacotron is a great architecture for that
thanks, I'll look into it
 grand warren
i was wondering if there is some kind of dense layer with characteristics more similar to a convolutional layer? instead of each neuron in the layer working with the entire image each neuron gets a small portion of the image for classification. would it be effective? if not why?
 mild dirge
There is 1d convolution
 undone spruce
hey guys, im looking for a python library that would help me with gpu processing
do you guys know any?
mild dirge
tensorflow or pytorch
 earnest widget
Is it necessary to scale image features once extracted?
past meteor
Is that a 1D conv though? It sounds like a conv layer without parameter sharing
If not it'd just be a full fledged convolution
undone spruce
mild dirge
tensorflow or pytorch
tq
past meteor
Not sure if it makes sense because somewhat specialise anyway or you force it through regularization. Only seeing part of the input is very specific to images amongst things.
grand warren
whats 1d convolution?
i didnt mean a layer that extracts features, but a layer that classifies the data
past meteor
grand warren
whats 1d convolution?
1D convolutions go over 1 axis so for example smoothing a time series is a 1D convolution
grand warren
earnest widget
Is it necessary to scale image features once extracted?
do you mean scaling the feature extracted image?
earnest widget
grand warren
do you mean scaling the feature extracted image?
Yes.
grand warren
i uh- why would you do that?
mild dirge
You could separate it into multiple cells and calssify each cell
But the content of the image that is relevant may be split over the images, so the separate cells might not reveal the class, but only the whole
earnest widget
grand warren
i uh- why would you do that?
Some features can contain extreme values right?
grand warren
earnest widget
Some features can contain extreme values right?
well yeah some parts might be your area of interest but how is resizing your image going to do any change?
also resizing your image might result in inaccuracy
grand warren
mild dirge
But the content of the image that is relevant may be split over the images, so t...
i didnt really understand
earnest widget
grand warren
well yeah some parts might be your area of interest but how is resizing your ima...
Not about resizing, already extracted the features but was thinking of using something like MinMaxScaler() to normalize the features. If it would help in any model performance boost.
grand warren
i just asked chat gpt what it is
n TensorFlow, MinMaxScaler is a preprocessing module that performs min-max scaling on the input data. It is part of the tf.keras.preprocessing module and can be used to preprocess the data before training a deep learning model.
Min-max scaling, also known as normalization, rescales the input data so that it falls within a specific range, typically [0, 1] or [-1, 1]. This is achieved by subtracting the minimum value of the input data and dividing by the range of the data (i.e., the difference between the maximum and minimum values).
is it what you mean?
if so normalization is not something you do after feature extracting your data
earnest widget
I have done it before as well on the images before extracting the features, just want to know if I have to do after extraction as well.
grand warren
nah.
past meteor
earnest widget
I have done it before as well on the images before extracting the features, just...
You mean normalization inside of your network?
Layernorm and Batchnorm are common
earnest widget
grand warren
nah.
Okay thanks.
past meteor
They've empirically been shown to improve performance / convergence of networks
earnest widget
past meteor
You mean normalization inside of your network?
I am actually not using NN. I am trying to use XGBoost.
past meteor
And your question is that you want to know if you should normalize the output of the pretrained network?
grand warren
past meteor
And your question is that you want to know if you should normalize the output of...
he asked if he should normalize his data again after feature extraction
past meteor
grand warren
he asked if he should normalize his data again after feature extraction
Yes but I get the sense that their feature extraction is with something like Resnet
grand warren
if so i guess no need for feature extraction at all
past meteor
Tree based algorithms are invariant to monotonic transformations (which all scaling procedures are)
grand warren
welp i dont know about tree based algorithms
past meteor
However if they use other algorithms such as SVMs they'd have to scale the features yes
grand warren
past meteor
However if they use other algorithms such as SVMs they'd have to scale the featu...
you mean twice?
past meteor
If their procedure is this: images ---> rescaling ---> CNN without head ---> concat/GlobalAvgPooling ---> Xgboost
earnest widget
past meteor
However if they use other algorithms such as SVMs they'd have to scale the featu...
Yes I used RESNET for feature extraction and I am not using SVM so I don't think it would require any further rescaling after extraction right?
past meteor
They could get away without a standardscaler inbetween concat/GlobalAvgPooling and Xgboost
past meteor
earnest widget
Yes I used RESNET for feature extraction and I am not using SVM so I don't think...
Most models that use L2 regularization OR gradient descent require normalization, Xgboost doesn't
past meteor
grand warren
sorry i meant efficientnetb01
I'm not so sure that the output of the conv layer after a concat/GlobalAvgPooling is unit variance in any model
It's trivial to compute this however, you can just take a bunch of images, shove it through efficientnet, do a concat or GlobalAvgPool and calculate the mean and stdev of all the "features"
earnest widget
past meteor
Most models that use L2 regularization OR gradient descent require normalization...
Oh okay alright.
past meteor
If they are not respectively 0 and 1 you'd have to rescale before giving it to many downstream ML algorithms
grand warren
grand warren
i was wondering if there is some kind of dense layer with characteristics more s...
btw im still uhh not really enlightened about this
past meteor
Why would you want such a dense layer?
grand warren
idk it sounds like it would be more accurate
at least for more complex images?
maybe
past meteor
I'm pretty sure there's no spacial relationship after you leave the conv layers so it doesn't make sense
grand warren
i
i meant like a dense layer which each neurons work with a small part of the image
instead of the whole image
past meteor
I think you're misunderstanding what the dense layers do. They don't operate on the image, they operate on the features found in an image
grand warren
yea
past meteor
Human/Dog ---> Conv layers ---> Features: [nose, paws, eyes, hands, legs, ...] ---> Dense ---> classification (I'm widly oversimplifying)
past meteor
It doesn't make sense to take a few of these features, you just take all of them
grand warren
hmm
tho i asked chat gpt the same question and i got this answer
Yes, there is a type of dense layer with characteristics similar to a convolutional layer called a "patch-based dense layer" or "local connectivity layer". In this layer, instead of each neuron connecting to all the neurons in the previous layer, each neuron only connects to a small patch of neurons in the previous layer, similar to a convolutional layer. This can help reduce the number of parameters in the layer and can be more computationally efficient.
This type of layer can be effective in certain cases, especially when dealing with images or other data with spatial structure. By taking advantage of local connectivity, the layer can learn to recognize patterns and features in different parts of the image more efficiently. However, it may not always be effective for all types of data, and it may require some experimentation to determine if it is a good fit for a particular problem.
It's also worth noting that there are other types of layers designed specifically for handling spatial data, such as convolutional layers, pooling layers, and spatial transformers, which may be more effective in certain situations.
something called patch based dense layer?
past meteor
This makes sense if you have a spatial relationship
grand warren
what does it mean exactly?
past meteor
past meteor
I'm pretty sure there's no spacial relationship after you leave the conv layers ...
I mentioned it here to. Spatial relationships are that features are related to each other in say the X or the Y direction, as is the case with images
past meteor
past meteor
Human/Dog ---> Conv layers ---> Features: [nose, paws, eyes, hands, legs, ...] ...
These features are not spatially related
grand warren
oh like size and stuff?
past meteor
Ask chatGPT what a spatial relationship is, they'll explain it better than I can haha
grand warren
yea i got something like size distance shape etc
is it correct?
im sorry if im asking too much questions
past meteor
grand warren
yea i got something like size distance shape etc
The easiest spatial relationship to understand is time series. The stock price is heavily related to the previous stock price
Like, CNNs treat images as something structured rather than an unordered set of pixels
The features that come out of your CNN likely have a way smaller spatial relationship hence why you'd just feed it all to Dense layers. If you'd have the dense layers only look at a subset of those features you're implying that there is a spatial relationship there as well.
grand warren
hmm
mint palm
serene scaffold
you probably don't need special tokens, then
Considering i need both sequential and also non-sequential embedding.
I have two options, could you tell me both of following have same effect or if one is more preferable:
Should I have 2 tokenizer? one WITH [CLS] &[SEP]tokens, and another WITHOUT them. Then using first tokenizer use last_hidden_state[:, 0, :] as non sequential representation and use second tokenizer for complete last_hidden_state for sequential embedding?
Should I have 1 single tokenizer? WITH [CLS], [SEP] token, and use Then use last_hidden_state[:, 0, :] as non sequential representation and use rest i.e. last_hidden_state[:, 1:, :] for sequential embedding?
 raw compass
I don't get something:
if I have an input as an array [2.0, 3.0, 4.0] -> and have weights [-1.0, 3.4, 2.3](note that this is only one neuron the first input is an array), if I'm just doing the matrix operations not every input is gonna be multiply be every weights. If I have a number as an input like "2" -> then we used to multiply this with every weights. Like:
inputs = [1, 2, 3, 2.5]
weights = [
  [0.2, 0.8, -0.5, 1]
]
so like 1 * 0.2 + 1 * 0.8 + 1 * -0.5 + 1* 1 + biases
so the question is If I have an array as an input should I just follow the "dot-product" or do the same as with scalars.
raw compass
past meteor
I don't get your question?
if the input is 2 and this is a full-connected network.
2 * weights[0] + 2 * weights[1] 2 * weights[2] + 2 * weights[3]
so then if the input is an array [1, 2, 3, 4]
then I have to just use a dot product
past meteor
raw compass
if the input is `2` and this is a full-connected network.
```py
2 * weights[0] ...
The number of weights you have depends on the the size of your input
raw compass
input[0] * weights[0] + input[1] * weights[1] or one item in the list should be multiply by every weights?
past meteor
raw compass
input[0] * weights[0] + input[1] * weights[1] or one item in the list should be ...
the former
X_0* W_0 + X_1 * W_1 + ... X_N * W_N
raw compass
so every neuron has weights, but the weights are depends on the number of inputs?
past meteor
Frequently a 1 is placed in the front and the bias is multiplied with that, hence why N+1 parameters per neuron
raw compass
if I have 5 input and I want this to be a full connected network then every neuron should have 5 weights.
past meteor
raw compass
if I have 5 input and I want this to be a full connected network then every neur...
6 per neuron in that layer yes
 past meteor
For deep learning it's important to think in terms of matrix/tensor shapes. Your input is 2x4(+1), your weights are 4(+1)x3 so your output will be 2x3
You have 3 neurons with each 5 weights, 4 regular ones and a bias
Each of these is neurons is multiplied pairwise (i, i) with each input (== dot product)
past meteor
raw compass
So it's clear that the size (i, i) needs to match. It's also clear that if you have 2 input and 3 neurons you'll have 3 values for your 2 inputs so 2x3
raw compass
past meteor
So it's clear that the size (i, i) needs to match. It's also clear that if you h...
but why do I have to use matrix multiplication?
past meteor
raw compass
but why do I have to use matrix multiplication?
I don't fully understand your question. Why do you need to use matrix multiplication instead of looping or why matrix multiplication is a thing?
 meager crater
Hey anyone knows a repo with a sample of hyper params for sklearn's, xgboost's and etc models?
 next valley
maybe im losing my mind, but if a neural network uses a logistic function like sigmoid for its activation function and is only 1 layer deep, is it considered a linear model? I though since it uses a non-linear activation function it is not considered a linear model, or is my definition of what is a linear model wrong
past meteor
next valley
maybe im losing my mind, but if a neural network uses a logistic function like s...
Input ---> Layer ---> OutputLayer == neural network whereas Input ---> OutputLayer == linear model
next valley
why would input -> output layer be considered a linear model if the model's activation function isn't linear? what does the definition of "linear model" mean then
past meteor
next valley
maybe im losing my mind, but if a neural network uses a logistic function like s...
Input ---> Layer without non-linear activation ---> Layer without non-linear activation ---> ... --> Layer without non-linear activation ---> OutputLayer == linear model
past meteor
next valley
why would input -> output layer be considered a linear model if the model's acti...
Fantastic question! A model is linear in the quantity that it is trying to estimate
raw compass
past meteor
I don't fully understand your question. Why do you need to use matrix multiplica...
lets say I have this network how would you calculate the values of the neurons?
 past meteor
next valley
why would input -> output layer be considered a linear model if the model's acti...
past meteor
next valley
why would input -> output layer be considered a linear model if the model's acti...
A logistic regression is linear in the log odds
raw compass
the first column represents the inputs the second represents the weights
past meteor
raw compass
lets say I have this network how would you calculate the values of the neurons?
dot_product([[1, 2, 3, 4], [1, 6, 8, 9, 1]], [[bias1, 3, 4, 5 , 6], [bias2, 2, 3, 4, 5]])
 wooden sail
i would suggest you try and do this on paper yourself at least once so that you get the intuition for it. the idea is that matrix multiplication behaves exactly the same way as you would compute the output of this kind of network
you can compute the outputs one at a time, but matrix multiplication allows you to treat all inputs as a single vector, and all outputs as a single vector. then they are related to each other via a matrix multiplication
 near oyster
has anyone here already used segment-anything from meta? I have a use case and I try to figure if it is the approach I should follow
past meteor
You need to just do it by hand indeed
raw compass
wooden sail
i would suggest you try and do this on paper yourself at least once so that you ...
the matrix multiplication of one row and a column vector is equal to the dot product of 2 vector, right?
past meteor
Pick up any mathbook and work through a few basic problem sets of linear algebra
wooden sail
that is one way of looking at it, sure
past meteor
Because it'll make you go a lot faster down the line tbh
raw compass
wooden sail
that is one way of looking at it, sure
then the only point of doing matrix multiplication is....?
next valley
past meteor
Fantastic question! A model is linear in the quantity that it is trying to estim...
what would be an example of a model that is non linear in the quantity that it is trying to estimate
wooden sail
there are several points to it
past meteor
next valley
what would be an example of a model that is non linear in the quantity that it i...
A neural network 😄
wooden sail
1.) you can save yourself all the summations that arise and succinctly write the math as one algebraic operation
2.) linear algebra gives you very powerful tools to analyze the behavior of each layer of a network
3.) processors (cpus , gpus, tpus) are built to exploit operations that can be parallelized. using matrices allows you to explicitly exploit this parallelism both when doing the math on paper, and also when doing the math on a computer. writing stuff as matrices allows you to use powerful parallelization techniques, which is why using gpus speeds up neural networks
for example, as an alternative to your dot product interpretation of a dense layer, you can instead consider linear combinations of the columns of the matrix. this immediately tells you something about the "image" of the transformation (which values it can take), as well as about identifiability of the outputs (size of the null space)
so you can immediately tell which operations are easy or even possible to invert in the first place
past meteor
raw compass
then the only point of doing matrix multiplication is....?
Also, a dot product expresses the similarity or dissimilarity of 2 vectors btw
past meteor
next valley
what would be an example of a model that is non linear in the quantity that it i...
Logistic regression can be seen as logits = dot(data, coeff) and then logistic_function(logits). You're linear in the logits, does that make sense?
next valley
past meteor
Logistic regression can be seen as logits = dot(data, coeff) and then logistic_f...
so, the output layer doesn't count towards the definition of linearity in regards to the network?
wooden sail
you can think of it as a reparametrization that is actually linear
as an example, consider y = a * exp(b), and we want to find a and b. this is nonlinear. however, log(y) = log(a) + b. if we let w = log(y) and z = log(a), we now have w = z + b. this is linear
in logistic regression, something similar happens (albeit with more parameters)
raw compass
too much information for me, 😄
wooden sail
so you solve a linear problem, and then use that result to compute other stuff for an overall nonlinear relationship (that is linearizable)
raw compass
inputs = np.array([[1.0, 2.0, 3.0, 2.5]])
array1 = np.array([3, 4, 5, 6]).T
output = np.dot(inputs, array1)  # 41.
same as
inputs = np.array([1.0, 2.0, 3.0, 2.5])
array1 = np.array([3, 4, 5, 6])


output = np.dot(inputs, array1)  # 41.
this is because numpy lies to you
1d arrays in numpy are not actually like vectors in math 😛
past meteor
next valley
so, the output layer doesn't count towards the definition of linearity in regard...
Worth looking at generalized linear models if you're very stuck here
wooden sail
transposing a 1d numpy array does nothing
something like matlab would give you an error, but not numpy
wooden sail
this can be troublesome when working with square matrices, cuz you can multiply vectors from the left and right and you will never know if you did it wrong until your results are wrong in the end. it really should just error out
you can make it explicit by adding an extra dimention, i.e. x[:, np.newaxis] explicitly turns your vector into a column vector
but now you need to index it as x[i, 0] and it becomes annoying
raw compass
wooden sail
1d arrays in numpy are not actually like vectors in math 😛
so then what are they?
wooden sail
raw compass
so then what are they?
made up stuff
raw compass
I really need to check out the numpy source code.
wooden sail
!e
import numpy as np
M = np.random.normal(size=(3,3))
print(f"the matrix: {M}")
x = np.array([1,2,3])
print(f"multiply the matrix from the left: {M@x}")
print(f"multiply the matrix from the right: {x@M}")
print("send help plz")
@wooden sail :white_check_mark: Your 3.11 eval job has completed with return code 0.
001 | the matrix: [[ 0.82191675 -1.09721571  0.3804799 ]
002 |  [ 1.15016128 -0.15166124  0.03848761]
003 |  [ 1.64109927  1.60015622 -0.0995155 ]]
004 | multiply the matrix from the left: [-0.23107495  0.96230164  4.54286521]
005 | multiply the matrix from the right: [8.04553713 3.3999305  0.15890861]
006 | send help plz
see, numpy doesn't care. it will treat your 1d array as a row or column vector as it sees fit. this means stuff that would be mathematically undefined will actually just give you wrong results in some cases, and this makes things difficult to debug
past meteor
I still transpose for clarity tbh
past meteor
I just looked at the simulator I made for my thesis and I had something like self.coefficients = self.coefficients * periods.T
Also a reminder to myself not to look at code I wrote in the past because it looks painfully bad no matter how proud I was when I wrote it 💀
raw compass
another question after all:
inputs = [[1,2,3,4],
          [2,4,5,6]
]
weights = [[6,7,8,9]
           [2,3,4,5]
]
is it gonna be like: inputs[0] * weights[0] + inputs[1] * weights[1] or inputs[0] * weights[0] + inputs[0] * weights[1]`
or it depends on the network?
wooden sail
you kinda also have to specify what size output you want
as it is, you cannot multiply the weights and inputs because the sizes don't match
raw compass
wooden sail
you kinda also have to specify what size output you want
what do you mean?
raw compass
wooden sail
as it is, you cannot multiply the weights and inputs because the sizes don't mat...
same 4 isnt it?
wooden sail
that's not how it works
if you have 2 matrices, with sizes (m x n) and (a x b), you can only multiply them if n = a
you have (2 x 4) and (2 x 4), and 2 != 4
and also 4 != 2. you cannot multiply these two matrices no matter how you try
raw compass
I mean sorry they supposed to be vectors like "plain list".
past meteor
Yeah but he could multiply 2x4 and 4x2 I think that was the question
wooden sail
what one does is, take the size of the input as a flattened vector. take the size of the output as a flattened vector. then the matrix would be of size input x size output
what size of output are you expecting to get in your example?
raw compass
wooden sail
what size of output are you expecting to get in your example?
I dont know i was just wondering if that is correct
past meteor
I mean, the computations of an entire layer are often written like samples x features * Weights.T with weights being neurons x features
wooden sail
past meteor
I mean, the computations of an entire layer are often written like samples x fea...
this is so cursed lol
past meteor
Mhmm but I got used to it.
wooden sail
ok, if you wanna use transposes here, it can work
next valley
if a [input layer] -> [output layer] model uses a activation function in the output layer that is non-linear in log odds would it still be considered a linear model?
wooden sail
but i think it makes more sense and is easier to digest if we just look at the multiplication of a matrix and a vector without having to transpose stuff as well
raw compass
!e
import numpy as np
inputs = [1.0, 2.0, 3.0, 2.5]
weights = [[0.2, 0.8, -0.5, 1],
           [0.5, -0.91, 0.26, -0.5],
           [-0.26, -0.27, 0.17, 0.87]]

biases = [2, 3, 0.5]
layer_output = np.dot(weights, inputs) + biases
print(layer_output)


arXiv.org
This open-source book represents our attempt to make deep learning
approachable, teaching readers the concepts, the context, and the code. The
entire book is drafted in Jupyter notebooks, seamlessly integrating exposition
figures, math, and interactive examples with self-contained code. Our goal is
to offer a resource that could (i) be freely av...
wooden sail
multiplication from the right 😩 disgusting
only machine learning people could sleep at night doing this
past meteor
Machine learning is the killer of convention
My thesis was essentially re-solving a problem because ML folk renamed it and went on and on while stats had this down forever
wooden sail
that's usually the case. same in signal processing too
there's this thing called "kruskal rank" which is equivalent to the "spark of a matrix" which is the same as the girth of a matroid
the core concept in compressed sensing, a thing that someone rediscovers and renames every 5 or 10 years
past meteor
Hence why every paper needs to start by defining their problem mathematically and explaining how other people call it + how semi-related fields use the same word for a different meaning (robust means something else in ecometrics, statistics, ML, ...) but I digress
wooden sail
raw compass
!e
```py
import numpy as np
inputs = [1.0, 2.0, 3.0, 2.5]
weights = [[0.2, 0.8, ...
this'll work. the output of weights@inputs is a vector of the form
weights[0,0]* input[0] + weights[0,1]* input[1] + weights[0,2]* input[2] + ... in the first entry
weights[1,0]* input[0] + weights[1,1]* input[1] + weights[1,2]* input[2] + ... in the second entry
weights[2,0]* input[0] + weights[2,1]* input[1] + weights[2,2]* input[2] + ... in the third entry
and then you add the biases
raw compass
wooden sail
you kinda also have to specify what size output you want
but how would that work, I mean you just use the dot product? and that is it?
wooden sail
raw compass
but how would that work, I mean you just use the dot product? and that is it?
yes
if you have a dense layer with a bias, this is the same as just Wx + b with a matrix of weights W, input vector x, bias vector b
very nice and succinct, and with geometric and algebraic interpretability
raw compass
!e
import numpy as np
inputs = [1.0, 2.0, 3.0, 2.5]
weights = [[0.2, 0.8, -0.5, 1],
           [0.5, -0.91, 0.26, -0.5],
           [-0.26, -0.27, 0.17, 0.87]]

biases = [2, 3, 0.5]
layer_output = np.dot(weights, inputs) + biases
print(layer_output)
@raw compass :white_check_mark: Your 3.11 eval job has completed with return code 0.
[4.8 1.21 2.385]
You can stick a 1 in front of your vectors and add the bias in front of your weights
Then there's no more + biases
raw compass
in that example I had 3 neurons and 4 inputs, right?
past meteor
You had 1 input and 3 neurons
wooden sail
i'll be honest, thinking about it as neurons is kinda useless
thinking about it as function composition is more useful
either the application of an affine transformation, or if you like homogeneous coordinates like zestar, a shear in n+1 dimensional space
raw compass
wooden sail
thinking about it as function composition is more useful
how can I think about it as a function composition?
raw compass
past meteor
You had 1 input and 3 neurons
so then every neuron is gonna get those inputs but with different weights so the output is gonna be different?
wooden sail
we have a function f that maps x to g(Wx + b), with some activation function g applied elementwise to (Wx + b). then each layer is one function. no talk about neurons
past meteor
raw compass
so then every neuron is gonna get those inputs but with different weights so the...
that's a way to think of it
The neurons are a good form of abstraction for people that aren't deep into math?
wooden sail
hmm i guess so. it's also kinda misleading though, but i guess you're right
then yeah, 3 neurons, if you will. one neuron per output
next valley
apologies for posting this again, if a [input layer] -> [output layer] model uses a activation function in the output layer that is non-linear in log odds would it still be considered a linear model?
past meteor
raw compass
so then every neuron is gonna get those inputs but with different weights so the...
This is a good one to understand
 past meteor
next valley
apologies for posting this again, if a `[input layer] -> [output layer]` model u...
past meteor
next valley
apologies for posting this again, if a `[input layer] -> [output layer]` model u...
It would be linear in something else
wooden sail
it "may" be linear in something else. not all expressions are linearizable in more than one way (or at all)
past meteor
It would be linear in whatever quantity you receive before applying the non-linear activation function right?
wooden sail
how do you mean? (and with which definition of linear)
raw compass
wooden sail
we have a function f that maps x to g(Wx + b), with some activation function g a...
so how would you represent that function? its like y and x asis. (as I said earlier 2nd year maths is not that "powerful")
wooden sail
raw compass
so how would you represent that function? its like y and x asis. (as I said earl...
yeah, some function y = g(x) applied to each value in the vector
for example y = log(x)
y = relu(x), as is commonly done
raw compass
but like the graph
wooden sail
what about it?
raw compass
wooden sail
what about it?
how would you make the graph
 raw compass
wooden sail
we have a function f that maps x to g(Wx + b), with some activation function g a...
raw compass
wooden sail
we have a function f that maps x to g(Wx + b), with some activation function g a...
I mean this one
wooden sail
that's what a relu does. we apply this to each of the values in the output vector
ah, so in that one, x is a vector
you cannot graph it in general
x may have arbitrarily many dimensions
we can plot stuff up to 3 dimensions only
vectors routinely have several hundreds, thousands, etc dimensions
raw compass
but is there a very basic network that you can represent on a graph?
wooden sail
only very small ones
raw compass
wooden sail
only very small ones
would you show me an example?
wooden sail
like 2 inputs 1 output, 1 input 2 outputs, or 1 input 1 output
past meteor
I think it'd be valuable for you to work through the very basics of lin alg was it'll make you feel less lost
wooden sail
for example, we have an input x that is scalar. we set w to some other scalar, and b as well, also a scalar. then one layer is y = wx + b, which you will recognize is a straight line
and then we apply a function g to this
this we can plot
raw compass
past meteor
I think it'd be valuable for you to work through the very basics of lin alg was ...
I mean its like I'm really shit at this field. No matter if you built a library or contributed to frameworks. it is totally different.
raw compass
wooden sail
for example, we have an input x that is scalar. we set w to some other scalar, a...
okay I see
wooden sail
!e
import numpy as np
import matplotlib.pyplot as plt
x = np.arange(100)
w = 10
b = -1.4

y = np.log(w*x + b) #we use log as activation function

plt.plot(x,y)
plt.xlabel("input")
plt.ylabel("output")
plt.title("scalar, single layer network")
plt.savefig("biggest_of_oofs.png")
@wooden sail :white_check_mark: Your 3.11 eval job has completed with return code 0.
001 | /home/main.py:7: RuntimeWarning: invalid value encountered in log
002 |   y = np.log(w*x + b) #we use log as activation function
 wooden sail
i put in some negative values into the log by accident, but you get the idea
raw compass
wooden sail
i put in some negative values into the log by accident, but you get the idea
yes thank you
wooden sail
in this case it is clear that the network is really just a function in one variable
log(wx + b) is something we can plot if x is a scalar
raw compass
wooden sail
log(wx + b) is something we can plot if x is a scalar
log is use the constant e right?
next valley
this is considered a linear model right?
 raw compass
 past meteor
next valley
this is considered a linear model right?
past meteor
next valley
this is considered a linear model right?
Look at the decision boundaries of a logistic regression
next valley
past meteor
Look at the decision boundaries of a logistic regression
Yeah,i understand that it's a linear line but isnt this the equivalent of 3 linear lines on the same graph?
past meteor
next valley
Yeah,i understand that it's a linear line but isnt this the equivalent of 3 line...
Yes, one for each class
 tacit crown
I have a super newbie question. How do I make this chart wider? I've tried a bunch of things.

Example:
plt.figure(figsize=(15,4))
sns.set(font_scale=.8)
sns.catplot(x = 'disc_year', y = 'disc_facility', data = exoplanet_data.head(50), kind = 'swarm', s = 2)
I just want to have the generated image be much wider.
I've also tried this:
sns.set(rc={'figure.figsize':(11.7,8.27)})
past meteor
tacit crown
Example:
plt.figure(figsize=(15,4))
sns.set(font_scale=.8)
sns.catplot(x = 'dis...
Increase the 4 to something larger. I also use ax = plt.subplots(figsize=(15,12) and then pass ax=ax in my plot
tacit crown
past meteor
Increase the 4 to something larger. I also use ax = plt.subplots(figsize=(15,12...
Thanks. Trying now.
@past meteor Still a bit stuck unfortuntaely.
This is what I have:
exoplanet_data.head()
plt.figure(figsize=(15,15))
sns.set(font_scale=.8)
ax = plt.subplots(figsize=(15,12))
sns.catplot(x = 'disc_year', y = 'disc_facility', data = exoplanet_data.head(200), ax=ax, kind = 'swarm', s = 2)
Somehow I'm getting two charts now. One is a dummy chart.

Did I mess up with the ax=ax?
past meteor
Yeah you have to remove the plt.figure(figsize=(15,15))
tacit crown
Arrgh, I'm still struggling.
I've simplified to just this again:
sns.catplot(x = 'disc_year', y = 'disc_facility', data = exoplanet_data.head(200), kind = 'swarm', s=.5)

When I add what you suggested, I still get this.

This is the code for the previous image:
ax = plt.subplots(figsize=(15,12))
sns.catplot(x = 'disc_year', y = 'disc_facility', data = exoplanet_data.head(200), kind = 'swarm', s=.5,ax=ax)
Why is it displaying two graphs? The bottom graph is what I care about but the width is still not as wide as I'd like.
past meteor
Can you make a help channel and ping me there?
next valley
past meteor
Yes, one for each class
Nevermind i am dumb I get it now, I forgot that single layer network is essentially h(xᵢ) =σ(wᵢxᵢ + b) which is linear in its decision regardless of what kind of activation function is used
 mental hinge
Hey! Has anyone ever ran into ValueError: The model did not return a loss from the inputs, only the following keys: logits,past_key_values. For reference, the inputs it received are input_ids,attention_mask. while attempting to fine tune a AutoModelForCausalLM model in transformers? Im experiencing this error and struggling to fix it.
My code can be found here https://paste.gg/p/anonymous/a98c51e255e8496f8254d14e364cbe33
lapis sequoia
Hey does anyone know a way to cut multiple images at the same time?
lapis sequoia
Yes
mild dirge
If you have them in a single array with shape (nr_images, height, width, nr_channels) then:
images = images[:, y_min:y_max, x_min:x_max, :]
Thank you i will try this out
 pseudo moon
I want to train a neural network for classification of letters in words. I’m considering to use attention mechanism to locate each letter but I’m not sure how the classification would work. Suppose for the word “spam”, it would have to classify 4 letters: “s”, “p”, “a”, “m”.
How can I approach this?
serene scaffold
pseudo moon
I want to train a neural network for classification of letters in words. I’m con...
classify the four letters how?
pseudo moon
It’s like OCR
serene scaffold
what are the classes?
pseudo moon
a-z
serene scaffold
I see. so you're actually classifying parts of images. not characters as far as the computer is concerned.
pseudo moon
Right
Do you know how I can approach this? Like whether I should separate each characters for the classification or something else?
serene scaffold
pseudo moon
Do you know how I can approach this? Like whether I should separate each charact...
I haven't worked on OCR, sorry.
mostly text classification
mild dirge
OCR can also involve a language model
You want to use object detection to find all letters, and you can use a language model to make better predictions, as some letters are more common after a specific order of other characters
The first thing you want to do is probably locate the text, and go from there
pseudo moon
Yes, but my datasets do not contain the location of the text or letters so I was thinking if I could use some help with attention mechanism
serene scaffold
pseudo moon
Yes, but my datasets do not contain the location of the text or letters so I was...
attention is about the significance of relationships between elements in a sequence. it won't help you with the image itself.
pseudo moon
Don’t they need to stress some weight (give attention) to certain parts (on the image)? I was thinking that from this we can use those parts for classification
serene scaffold
pseudo moon
Don’t they need to stress some weight (give attention) to certain parts (on the ...
only if the parts of the image are already extracted and arranged into a sequence, and the image parts are identical to image parts from other images.
(and by identical, I mean the array/tensor representation is exactly the same.)
pseudo moon
I’m sorry but I don’t quite understand. What do you mean by “arranged into a sequence”? And by extracted part of the image do you mean this is the part of the image which contains the letters to be classified?
serene scaffold
looks like "attention mechanisms in computer vision" is a thing, so it might be that you can leverage attention in OCR in ways that I wouldn't expect.
hasty mountain
pseudo moon
Do you know how I can approach this? Like whether I should separate each charact...
Use an architecture for object detection or image segmentation, use that to extract the letters in an image, and then make the model classify each object(each letter).
For each letter classified(for each iteration, I suppose), you could create a sequence, a word, and with that, you could use a language model...or make some tricky tricks on it
(I've tried something like an OCR model to extract scores from a game for a Reinforcement Learning algorithm)
Since you'll be dealing with words, not with numbers, things may be slightly more complicated, as you'll need words, not just characters.
pseudo moon
I see, I’ll check them out, thank you
earnest widget
I am having a hard time trying to figure out why my loss for the test set won't go down, I am training with xgboost and I am not sure what exactly to change or add onto it. Any suggestions?
 mild dirge
What is the x axis @earnest widget
earnest widget
mild dirge
What is the x axis <@98122414608633856>
Given it as the iterations.
hasty mountain
Have you checked if it's overfitting? Maybe trying to use more samples for the test set?
earnest widget
hasty mountain
Have you checked if it's overfitting? Maybe trying to use more samples for the t...
I guess it is, I mean I am using the same number of features as per the training set obviously of different images. But I suspect class imbalance can also cause the issue, which I resolved earlier.
lapis sequoia
So I was just messing around pandas docs, and found out that pd.eval can be pretty fast on big datasets, so like question is, why are they faster? And if they are faster, why not just do what it does internally in normal operations?
 mild dirge
Because each + is a separate operation in regular python. When pandas knows you want to add all 5 together, then you can make some optimizations.
@lapis sequoia
lapis sequoia
mild dirge
<@456226577798135808>
ohh so basically
df1 + df2 + df3 + df4 + s
is more like below?
(((df1 + df2) + df3) + df4) + s
while putting it in eval, they kinda do it similar to in one shot? not strictly, but I think thats what you are saying?
mild dirge
Yeah, I think that's the idea
Also, if you do the top one, you need to make a new data structure for each addition, whereas for the pandas eval you only make 1, and fill in the values by looking at all dataframes in one go
lapis sequoia
mild dirge
Also, if you do the top one, you need to make a new data structure for each addi...
ahh makes sense!!
just ran on some simple big data, this is quite significant.
 mild dirge
Looks like it jup. Good to know
lapis sequoia
mild dirge
Looks like it jup. Good to know
great great, thanks for your help!
I'll dig more into this!
boreal gale
https://github.com/pydata/numexpr#how-numexpr-achieves-high-performance this might also be of interest.
lapis sequoia
boreal gale
https://github.com/pydata/numexpr#how-numexpr-achieves-high-performance this mig...
oh yes I was watching it, but that is when we explicitly give engine as numexpr, but yes I'll check this out as well. Thanks!!
next valley
pseudo moon
I’m sorry but I don’t quite understand. What do you mean by “arranged into a seq...
A attention mechanism for images does exist called spatial temporal attention but i fail to see how this will be of use to you if you don't have labels on where the text is
lapis sequoia
mild dirge
Looks like it jup. Good to know
this makes me think, does this also hold true for python eval as well? Like it would make things faster as well?
mild dirge
No, doesn't work for that I don't think @lapis sequoia
 tough falcon
simple sci kit learn question.
I want to use KNN to classify based on 8 points(x,y)
I tried reading scikit learn docs, but its too complicated.
can someone tell me just what to do?
tough falcon
yup 8 points.
and 8 classes.
tough falcon
k = 1
tough falcon
mild dirge
You wouldn't need scikit for that
ik, but I dont know how its going to scale that why im using sci kit learn
I should just find the dist from all the 8 points and classify according to that
mild dirge
train_points = np.array([(x1, y1), (x2, y2), ...])
train_labels = np.array(['class 1', 'class 2', ...])

test_point = np.array((x, y))

distances = np.sum((train_points - test_point) ** 2, axis=1) ** 0.5
prediction = train_labels[np.argmin(distances)]
 mild dirge
```py
train_points = np.array([(x1, y1), (x2, y2), ...])
train_labels = np.array...
mild dirge
mild dirge
```py
train_points = np.array([(x1, y1), (x2, y2), ...])
train_labels = np.array...
And you could always do argsort to get the indices of the lowest k distances
tough falcon
tough falcon
instead of training it on all the million points, I'm just just going with the center of the circles.
so I get 8 points.
tough falcon
mild dirge
```py
train_points = np.array([(x1, y1), (x2, y2), ...])
train_labels = np.array...
thanks very much
 hot blade
i'm designing an lstm model right now with tensorflow keras, and the walkthrough i've followed has given me this:
model = Sequential()
model.add(LSTM(200, activation='relu', kernel_initializer='he_normal', input_shape=(n_timesteps, n_features)))
model.add(Dense(100, activation='relu', kernel_initializer='he_normal'))
model.add(Dense(100, activation='relu', kernel_initializer='he_normal'))
model.add(Dense(n_outputs, activation='linear'))```
why do i need these dense layers? isn't lstm itself a neural network composed of an input layer, hidden layers, and an output layer? fringe anvil
hello, would this channel be the right place for questions about openai's gym-retro and stable-baselines3's PPO ?
hasty mountain
Guys, about GPT...actually about its Pretraining.
I know that the Pretraining used for Transformer in GPT was in order to make the model predict the next word in a given context. However, since the Transformer already tries to predict each word within a given context(sequence) by itself(since the model output has dimensions (batch, sequence, d_model), wouldn't pretraining be simply training the model to output a sentence that is equal to the input sentence?

 hasty mountain
Hm...I think I get it now... It's just basically trying to predict the next word in a sentence...
Then...I guess making it predict the next sentence given an input sentence would also count as pretraining? 
I really can't see the difference between this """Unsupervised""" Pre-training and a common, straightforward supervised training task.
One Important Fact about the OpenAI’s GPT model is that by empirical studies, the authors have observed, that before fine-tuning the model, unsupervised pre-training again on the labeled dataset yield the best results
unsupervised pre-training on labeled dataset

 inland chasm
hey, is anyone good at machine learning i can talk too, because i need some help
serene scaffold
inland chasm
hey, is anyone good at machine learning i can talk too, because i need some help
Be sure to always ask your actual question, so that people can read it and start answering it.
inland chasm
okay, i have this machine learning chat bot i created, and i need someone to help me determine if i overfit or underfit, and to make sure it is activaly learning off the user
should i paste my code
serene scaffold
inland chasm
okay, i have this machine learning chat bot i created, and i need someone to hel...
you'll know if you underfit, because it won't even perform well on the test data. overfitting is harder to catch.
serene scaffold
inland chasm
should i paste my code
yes. make sure that you don't show code as screenshots.
inland chasm
import tensorflow as tf
import numpy as np
import random
class WASP:
TEST_DATA = {
"intents": [
{
"tag": "greeting",
"inputs": ["hello", "hi", "hey"],
"responses": ["hello", "hi", "hey"],
},
{
"tag": "question",
"inputs": ["how are you", "whats up"],
"responses": ["good", "nothing much", "nothing much, what about you?", "yes", "no"],
},
{
"tag": "response",
"inputs": ["im good", "bad", "not good", "im bad", "okay", "cool", "thats good", "i dont know"],
"responses": ["thats good", "im sorry to hear that", "how come", "okay", "cool", "thank you", "ok"],
},
{
"tag": "farewell",
"inputs": ["bye", "goodbye", "cya", "see you later", "im leaving"],
"responses": ["see you later", "goodbye", "bye", "cya"],
},
{
"tag": "confused",
"inputs": ["what", "confused", "?"],
"responses": ["sorry, i am very new and my training set it small, so i may not make sense","nevermind"],
},
]
}
thats the first part
serene scaffold
okay. you probably don't need a class for that.
inland chasm
the entire model is a class
serene scaffold
go on.
inland chasm
def init(self):
self.tokenizer = None
self.max_len = None
self.model = None
def process(self):
self.load_data()
self.preprocess_data()
self.build_model()
self.summarize()
def load_data(self):
self.input_texts = []
self.output_texts = []
for intent in self.TEST_DATA['intents']:
for question in intent['inputs']:
self.input_texts.append(question.lower())
self.output_texts.append(random.choice(intent['responses']))
serene scaffold
!paste
arctic wedgeBOT
Pasting large amounts of code
If your code is too long to fit in a codeblock in Discord, you can paste your code here:
https://paste.pythondiscord.com/
After pasting your code, save it by clicking the floppy disk icon in the top right, or by typing ctrl + S. After doing that, the URL should change. Copy the URL and post it here so others can see it.
serene scaffold
just put the whole thing in one pastebin.
serene scaffold
@inland chasm can you explain the difference between train and test data?
serene scaffold
train and test are the same thing?
serene scaffold
and that is all the training data that you have?
inland chasm
yeah so afar
serene scaffold
then your model is definitely underfit.
inland chasm
okay, but is it learning off the user too?
and also should i add more epochs or neurons
serene scaffold
it's too early to say. at the moment, you don't have nearly enough data to worry about architecture changes.
serene scaffold
inland chasm
okay, do you have any suggestions for the traindata
you'll want to look online for things like "conversation transcript data set"
inland chasm
hey guys, so i have this chatbot i am creating, and sometimes the answers it gives are like cut out, or incomplete, should i add more epochs or lower them
!paste
arctic wedgeBOT
Pasting large amounts of code
If your code is too long to fit in a codeblock in Discord, you can paste your code here:
https://paste.pythondiscord.com/
After pasting your code, save it by clicking the floppy disk icon in the top right, or by typing ctrl + S. After doing that, the URL should change. Copy the URL and post it here so others can see it.
inland chasm
https://paste.pythondiscord.com/evuvupokuw here is my code
lapis sequoia
hasty mountain
`One Important Fact about the OpenAI’s GPT model is that by empirical studies, t...
i guess it helps to verify the ground truth. like some labels maybe incorrect?
 peak torrent
Can someone please help me out with the code for generating pmml file after tf-idf
Thanks in advance 🙂
 unique arch
hi folks! I'm hosting an open workshop next Thursday (May 4th) on how to refactor your Jupyter notebooks into maintainable data science code using Kedro, an open source Python library. hope it's interesting for you! https://events.quantumblack.com/kedro-intro-23-05
 sleek harbor
Is there any point in tuning the max_iter parameter of sklearn.linear_model.LogisticRegression?
The way I understand it - there shouldn't be. More is better, and the only reason someone would use a lower number would be to save time.. however I see people tuning it all the time in guides and such (tho I also see people tuning the number of trees in a random forest, which is something u shouldn't do.. cus more is always better). So I tried playing around a bit, and I actually got better results with a grid search and super low max_iter, like 2-30 instead of the default 100 🤔 I don't see how that makes sense tho.. unless it's just random chance that low max_iter (so low that a warning is thrown) gives better results. Is that the case, or what? Should you tune the max_iter parameter, or just set it as high as possible (and let the algorithm determine how many iterations are needed)?
wooden sail
sleek harbor
Is there any point in tuning the `max_iter` parameter of `sklearn.linear_model.L...
what this function does is use quasi newton methods to find the solution to a problem. this is a numerical method that takes small steps toward the solution using information of the gradient and the hessian of the function. for very simple problems, it can converge in one iteration. the more parameters you have and the worse the hessian behaves, the more iterations are needed
it's an interplay between the tolerance and the max number of iters. whichever is hit first causes the algorithm to exit. if the tolerance is very high, even if you set the max iters to a large number, the program will exit once the tolerance is satisfied. if the tolerance is tight, you'll likely hit the max iters first
sleek harbor
wooden sail
it's an interplay between the tolerance and the max number of iters. whichever i...
Yeah, that's what I thought.. but doesn't that mean that there's absolutely no point in seeing the max iters low...?
wooden sail
that depends on the problem
in some cases setting it to 1 is fine
but in general that's not the case. it's a hyperparameter
sleek harbor
wooden sail
in some cases setting it to 1 is fine
So.. there are cases when setting it to 1 will be better than seeing it to, say, 1 million?
mild dirge
Can it be overfitting?
wooden sail
iterative algorithms take small steps toward the solution
if you stop early, you don't reach the solution
mild dirge
But the "solution" is the best fit for the training data right?
wooden sail
yes
whether early stopping makes sense depends on how your cost function incorporates the available data
the interesting thing is that these cost functions are formulated to be optimal in expectation, but that can mean that each individual time you do the optimization, you get bad results 😛
sleek harbor
so I'm guessing the simple answer to my question is just: yes, set max_iter to the biggest number ur willing to wait for and let it do it's thing, do not 'tune' it. This is pretty much what's been bugging me: the peaks on the first image. But I'm guessing that's just due to chance, because if I run a bunch of measurements and average them I get the second image, which makes a lot more sense, imo. Now to understand why ppl who write guides on Medium/towardsdatascience tune max_iter with grid searches...

 wooden sail
it's because the time you're willing to wait and the time it takes to converge are in general not the same 😛
also my 2 cents are that towardsdatascience has very poor quality control
some articles are really great, but others are not
 dire wren
Is the any discord servers specialized on discussing open source AIs models (chatgpt alternatives) to use in home?
 timid kiln
I'm know there's a gazillion tutorials out there on this topic but I thought I'd ask y'all for what you'd recommend. I have a bunch of Excel workbooks to process, each with separate sheet tabs. They're all consistently formatted, as far as I can tell. The one tutorial I saw showed me to go row-by-row through each sheet tab. Someone here suggested I pull the worksheet into a dataframe and go from there. What are you guys' thoughts? Do you have an opinion on what the "best" methodology is?
The end goal is to get all the data (these are lab samples) into one worksheet or database.
edit: Please tag me if you reply so I'll know, thanks.
sleek harbor
wooden sail
also my 2 cents are that towardsdatascience has very poor quality control
Any recommendations on where to read articles? Cus I mostly just Google when I don't know something, and at least 50% of the time the answer is on Medium/towardsDS.. and yeah, I've been confused by some bad article from there several times already :/ but some really are good and helpful
dire wren
timid kiln
I'm know there's a gazillion tutorials out there on this topic but I thought I'd...
AFAIK pip Pandas can read excel files. You can use it to gather all cells in all documents in folder with simple loop
or may use openpyxl py lib for same purpose
wooden sail
sleek harbor
Any recommendations on where to read articles? Cus I mostly just Google when I d...
reading books on optimization. this particular task is a quasi-newton method, so it falls under convex optimization
i like stephen boyd's material on convex opt
books on numerical methods would also do
hasty mountain
Can anyone recommend an article or tutorial on how to deal with Out-Of-Vocabulary tokens in a model with embedding layers?
Currently, I have a function to preprocess an input and the target for my Transformer model. This function detects words that are out of vocabulary and creates a list with them.
Thing is, when my model generates the outputs, I want to have something to predict which of those words would be the best one to replace each OOV token during decoding.
The list of OOV words is just a temporary variable, so I don't want to make a parallel vocabulary of OOV words. I know what Word2Vec assigns a vector based on a mean of the words most similar to this OOV word, but though this helps in the model prediction, it doesn't help in the decoding(when I already have a tensor with indices to my vocabulary list)
 keen dew
I'm having some issues with pyspark, I'm getting this error:
I'm learning pyspark, Can someone help me?
I'm trying to analyze the dataset for the prediction of customer retention.

 charred light
keen dew
I'm having some issues with pyspark, I'm getting this error:
I'm learning pyspa...
charred light
keen dew
I'm having some issues with pyspark, I'm getting this error:
I'm learning pyspa...
Show the entire error.
 cloud marsh
can TFLite absolutely not do RNN, GRU, LSTM?
i'm just surprised i haven't seen any results on people hacking it to do that?
 thin karma
hello all
I am attempting to make a model which will take a user's input of a game, and recommend a set of games. How can I accomplish this here? This is my code
# Remove the 'name' column from the dataset
X_training_dataset = X_training_dataset.drop(['name'], axis=1)

# Define the input features and target variable
X = X_training_dataset.drop(['target'], axis=1)
y = X_training_dataset['target']

# Split the data into training and testing sets
X_train, X_test, y_train, y_test = train_test_split(X, y, test_size=0.2, random_state=42)

# Create a linear regression model object
model = LinearRegression()

# Train the model using the training set
model.fit(X_train, y_train)

# Evaluate the model's performance on the testing set
y_pred = model.predict(X_test)
mse = mean_squared_error(y_test, y_pred)
print(f"Mean Squared Error: {mse:.4f}")

# Get the user input game
user_input_game = "DayZ"

# Find the row corresponding to the user input game
input_game_row = X_training_dataset.loc[data["name"] == user_input_game]

# Extract the input features from the input game row
X_user = input_game_row.drop(['target'], axis=1)

# Use the trained model to make recommendations based on the input game
recommendations = model.predict(X_user)

# Print the recommended games
print("Recommended games:")
for game in recommendations:
    print(game)
The model is supposed to use categorical linear regression, and take an input of a game, get its genres, and predict a set of games similar to the user's inputted game
 agile cobalt
cloud marsh
i'm just surprised i haven't seen any results on people hacking it to do that?
agile cobalt
cloud marsh
i'm just surprised i haven't seen any results on people hacking it to do that?
if it were that simple, Google themselves would support them. Plus, TFLite is not all that popular as far as I can tell - most developers don't seem to care that much about making things run on the edge, and from a business standpoint keeping your model locked behind your cloud can be more beneficial than letting users access it offline, not to mention the (even if small) performance loss caused by downsizing the model
you can see what they support or don't support in https://www.tensorflow.org/lite/guide/ops_compatibility
agile cobalt
thin karma
I am attempting to make a model which will take a user's input of a game, and re...
yeahhh that is very much not a case in which you would use linear regression, at least not the way you're doing it here
look up collaborative filtering
cloud marsh
thanks. i'm working on the Kaggle for ASL, so i need time-series based stuff or path signatures
i'll look around the discussions to see what others are doing
i know that the edge-based operators are restricted from the competition
past meteor
agile cobalt
if it were that simple, Google themselves would support them. Plus, TFLite is no...
We used TFlite + jetson nanos for some distributed on edge stuff. Remains a good way to get vision stuff on mobile/edge easily I guess
Moved over to YOLO though
 fallow river
Projects can be based on
Sentiment140 dataset with 1.6 million tweets dataset in kaggle
After doing machine learning algorithms and make prediction for positive and negative sentiment
 maiden geyser
Hello, I am using Ray tune package for multiprocessing hyperparameter tuning and I am experiencing OOM. I asked for a num-samples = 10000 but it never ends before OOM crash
Any help would be appreciated I'm desperate
 flat hollow
@mild dirge is the book you shared still relevant to how the AI is being used today? My uni has it in their library so I thought I would give it a read, but I assume it would be missing transformers and latest stable diffusion MLs?
mild dirge
Oh yeah, absolutely none of that stuff in that book. I read it a year ago (maybe 2) and I mainly read it for pytorch, not so much the deep learning part
The modern stuff is just not in the book, but it does explain some of the basics of machine learning, and the gradient graph
flat hollow
the book is by the creators of pytorch right?
mild dirge
Yes
flat hollow
cool, I'll give it a read, wanted to get back into ai a bit since chatgpt is now all the craze, perhaps it will give me extra points on my cv 😄
mild dirge
Pytorch is pretty low level, lower level than scikit f.e., so it is just generally nice to understand the more rudimental stuff
flat hollow
ye I've heard pytorch is very much not beginner stuff compared to what's available
mild dirge
Haven't used tf since I read the book, I personally really like it
Especially because everything comes with it, including cuda
flat hollow
I did a small course on cuda programming, wish I had a use for it 😄
 last ivy
Hello everyone
maiden geyser
Hello, has anyone used Ray tune package?
last ivy
Is anyone willing to help me? 😩
serene scaffold
last ivy
Is anyone willing to help me? 😩
if you need help, be sure to ask about the thing you need help with, not if someone will help with the thing you haven't asked about yet.
lapis sequoia
you guys are so smart
agile cobalt
flat hollow
<@309775277720993792> is the book you shared still relevant to how the AI is bei...
if you want a deep-ish dive into Stable Diffusion, fast.ai covered it pretty detailed in video form (from October 2022, not sure when was the latest update), though part of it is probably already outdated by now
flat hollow
agile cobalt
if you want a deep-ish dive into Stable Diffusion, fast.ai covered it pretty det...
ai is moving too fast and I'm not even part of the ride 😦 but I'll check out the video 🙂 ty
agile cobalt
uh, it was half of a dozens of hours long course, not just one video 
flat hollow
is it the one by Jeremy Howard?
agile cobalt
yes
flat hollow
found it, the whole module is available on his youtube channel which is nice 🙂
 bright pasture
Chisa (1).pit.npy has 542.2000122070312
Chisa (1).pit.npy has 235.1999969482422
Chisa (10).pit.npy has 182.0
Chisa (100).pit.npy has 600.7999877929688
Chisa (102).pit.npy has 608.0
Chisa (104).pit.npy has 615.0
Chisa (104).pit.npy has 98.80000305175781
Chisa (105).pit.npy has 79.4000015258789
Chisa (106).pit.npy has 644.0
svc_preprocess_speaker_lora.py:37: RuntimeWarning: Mean of empty slice.
  speaker_ave = speaker_ave + pitch.mean()
C:\Users\phill\miniconda3\envs\lora-svc\lib\site-packages\numpy\core\_methods.py:190: RuntimeWarning: invalid value encountered in divide
  ret = ret.dtype.type(ret / rcount)
Traceback (most recent call last):
  File "svc_preprocess_speaker_lora.py", line 39, in <module>
    if (speaker_max < pitch.max()):
  File "C:\Users\phill\miniconda3\envs\lora-svc\lib\site-packages\numpy\core\_methods.py", line 40, in _amax
    return umr_maximum(a, axis, None, out, keepdims, initial, where)
ValueError: zero-size array to reduction operation maximum which has no identity```I'm having trouble here.
The dataset in question is an audio dataset.
Hastebin is a free web-based pastebin service for storing and sharing text and code snippets with anyone. Get started now.
Here is the code for the py I used.
 grave sundial
Hello everyone !! I'm trying to create LSTM model using embedding layer from Pytorch but I get the following error : did you have an idea how to fix it ?

 sharp crypt
Why are weight subscripts not 1, 2, etc
 serene scaffold
sharp crypt
Why are weight subscripts not 1, 2, etc
serene scaffold
sharp crypt
Why are weight subscripts not 1, 2, etc
That's just the notation they've chosen to use. But w_11 means "row one column one", not eleven.
I don't like it, personally.
 thorn swift
My attention span is so low YouTube thinks im web scraping
thorn swift
grave sundial
Hello everyone !! I'm trying to create LSTM model using embedding layer from Pyt...
It’s “input” where “indicies” should be. You’re either putting in the wrong values or you need to convert the values to integers before putting them in
thorn swift
thin karma
I am attempting to make a model which will take a user's input of a game, and re...
this code would regress a set of game features linearly to a single value, which isnt really useful in a reccomendation system: https://www.nvidia.com/en-us/glossary/data-science/recommendation-system/
look up things like collaborative filtering, or after you get more familiar with models and really want to use a NN you could try embeddings

NVIDIA Data Science Glossary
Learn all about Recommendation System and more.
thin karma
thorn swift
this code would regress a set of game features linearly to a single value, which...
I decided to make a list of random 50 game and rate it, and use the ratings as a target
thorn swift
cloud marsh
can TFLite absolutely not do RNN, GRU, LSTM?
it does all those things, just very efficiently in very small packages for specific uses
thorn swift
thin karma
I decided to make a list of random 50 game and rate it, and use the ratings as a...
ohhh, then you might want to train the model with X=user features + game features and y=user rating of game
whatever features you train it on have to be the same features you use for prediction
thin karma
thorn swift
ohhh, then you might want to train the model with X=user features + game feature...
That’s what we did
thin karma
thorn swift
whatever features you train it on have to be the same features you use for predi...
You going to be up tonight?
 jade sinew
can anyone help with a simple game code?
thorn swift
sleek harbor
so I'm guessing the simple answer to my question is just: yes, set max_iter to t...
partially, having max_iters too high could overfit the model, you can see that happening by using validation data: https://www.v7labs.com/blog/overfitting

Overfitting occurs when a model starts to memorize the training data instead of generalizing it to new data. Learn how to avoid it.
thorn swift
timid kiln
I'm know there's a gazillion tutorials out there on this topic but I thought I'd...
pandas can read excel sheets: https://pandas.pydata.org/docs/reference/api/pandas.read_excel.html you can cycle through "sheet name" and then concatenate the dataframes in python
 left timber
Hey guys I've been stuck for a few days on code that should work but doesn't and I don't get any error messages. Any insight would be much appreciated. I couldn't fit the code here - https://pastebin.com/4VssstmH
I am trying to create a python script that will upload a pdf then parse it. When I upload the file nothing happens and in the CLI I see the following message. WebSocket connection closed: code=None, reason=None
Pastebin
Pastebin.com is the number one paste tool since 2002. Pastebin is a website where you can store text online for a set period of time.
thorn swift
hot blade
i'm designing an lstm model right now with tensorflow keras, and the walkthrough...
its common practice to throw whatever embedding a special layer gets you through a couple of dense layers as a "readout"
it also helps with treating the embedded information as a whole instead of as a bunch of small parts like an lstm usually does
thorn swift
inland chasm
okay, i have this machine learning chat bot i created, and i need someone to hel...
you can determine overfitting and underfitting with validation data: https://galaxyinferno.com/what-is-validation-data-used-for-machine-learning-basics/#:~:text=Quick definition,parameters within the model class.

You have probably heard of the train-test-split in the context of machine learning, which is fairly intuitive. Show some examples to your model, let it learn and then test it on other examples. But there is one more data split that is used and that is the train-validation-test split or sometimes achieved by using cross-validation.… Continue read...
 noble breach
Hello everyone, recently I am doing a deep learning project, and I face some issues in that project, im trying to build convnext xlarge pretrained model that can do one-shot image classification I have added some additional layers to it and while training I am facing an issue, if you are free I will share my code immediately

 thorn swift
left timber
Hey guys I've been stuck for a few days on code that should work but doesn't and...
thorn swift
left timber
Hey guys I've been stuck for a few days on code that should work but doesn't and...
have you tried smaller files or something that isnt a pdf?
left timber
thorn swift
have you tried smaller files or something that isnt a pdf?
The loader is specifically for pdf. I have also tried very small pdfs.
thorn swift
noble breach
Hello everyone, recently I am doing a deep learning project, and I face some iss...
all data in a batch needs to be the same shape for it to be used in tensorflow, theres complex methods to fix it in the architecture but id recommend just separating the training data into different sets based on shape and training them seperately
noble breach
alright @thorn swift i will try to implement it with your permission can we have conversation in private so that I can share my code with you!
thorn swift
earnest widget
I am having a hard time trying to figure out why my loss for the test set won't ...
your models overfitting at lightspeed
heres a few steps:
- how much data do you have? too little data and overfitting is easy
- have you tried other models?
- Check training parameters like learning rate if thats part of the model
noble breach
around 400mb image data, image size is 105x105x3
thorn swift
noble breach
around 400mb image data, image size is 105x105x3
that was for a different question, i answered you in dms
thorn swift
tacit crown
This is the code for the previous image:
ax = plt.subplots(figsize=(15,12))
sn...
plt.figure(figsize=(15,12), layout='constrained')
sns.catplot(x = 'disc_year', y = 'disc_facility', data = exoplanet_data.head(200), kind = 'swarm', s=.5)
plt.show()
thorn swift
next valley
this is considered a linear model right?
absolutely not
edit:
misread the question but still, a linear model essentially fits a line through space, any curve you add to that line between input and output makes it nonlinear
 thorn swift
grand warren
hmm
thorn swift
grand warren
hmm
theres different feature selection methods: https://machinelearningmastery.com/feature-selection-with-real-and-categorical-data/, you can also add an attention layer after an embedding at some point
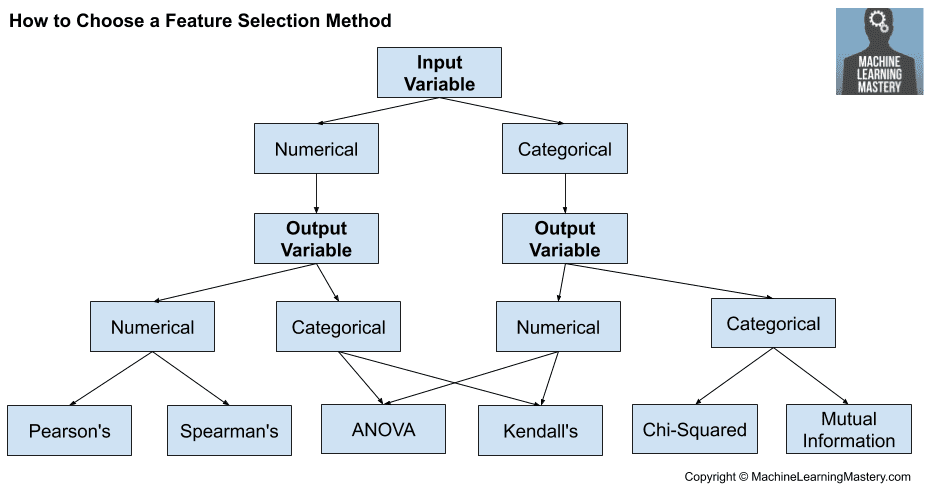
Feature selection is the process of reducing the number of input variables when developing a predictive model. It is desirable to reduce the number of input variables to both reduce the computational cost of modeling and, in some cases, to improve the performance of the model. Statistical-based feature selection methods involve evaluating the re...
thorn swift
grand warren
i was wondering if there is some kind of dense layer with characteristics more s...
i think you might be looking for an attention layer, im not sure what you mean by a "small portion for classification" you might be wanting to mix object detection with classification too
peak torrent
I am getting the below error when I am trying to execute my code, will someone please help me out with the same


Tf-idf vectorizer is not converting it into pmml file
cloud marsh
thorn swift
it does all those things, just very efficiently in very small packages for speci...
do you have any links you can share?
earnest widget
I have a class imbalance in my dataset and I am trying to figure out what resampling does exactly?

scikit-learn
 cold osprey
earnest widget
I am using this: https://scikit-learn.org/stable/modules/generated/sklearn.utils...
earnest widget
cold osprey
https://towardsdatascience.com/heres-what-i-ve-learnt-about-sklearn-resample-ab7...
cold osprey
earnest widget
I am using this: https://scikit-learn.org/stable/modules/generated/sklearn.utils...
earnest widget
cold osprey
https://towardsdatascience.com/heres-what-i-ve-learnt-about-sklearn-resample-ab7...
Yeah I just went through this but does resampling create new images itself or is it just doing something else?
 wooden sail
it shows overfitting
the training error got down almost to zero, while testing it on different data gives worse results
 naive coral
can anyone send me a project link for some readily downloadable and executable project in this domain?
mild dirge
Check kaggle @naive coral
earnest widget
I am using Pytorch for the first time and I am getting this error: FileNotFoundError: [Errno 2] No such file or directory: '/full_data/container/'
Trying to load my images:
dataset = datasets.ImageFolder(root="/full_data/container/", transform=transform)
So the sub-folder 'container' contains all the images for the class.
cold osprey
remove the last /?
earnest widget
Tried that, no difference.
PyTorch has some way of arranging the file structure, I seem to have done that though.
mild dirge
Make sure you are in the correct working directory
earnest widget
Yeah I am, I put the full path instead of the relative path but still does not come through.
My structure is full_data > container > all container images.
mild dirge
Did you try just full_data/ ?
earnest widget
Oh right, that worked, I guess it just needs the root directory only. Thanks a lot.
mild dirge
Yeah, it expects each class to have their own folder of images
earnest widget
mild dirge
Yeah, it expects each class to have their own folder of images
Oh okay, so it just loads all the images in then. But can I still add the labels according to each class since all the images are put into one tensor?
mild dirge
Are the images of different classes?
earnest widget
Yeah I have two classes. Container and non-container.
mild dirge
So the labels will be 0 and 1 then probably
Just check a single image and see which is which
thorn swift
cloud marsh
do you have any links you can share?
RNN/LSTM: https://www.tensorflow.org/lite/models/convert/rnn only thing is that youd have to hardcode a GRU: https://www.tensorflow.org/lite/guide/ops_custom

TensorFlow
TensorFlow
earnest widget
mild dirge
So the labels will be 0 and 1 then probably
Yeah it is 0 and 1, I just need to display it now. I will have to convert it into a numpy array and then display it right?
earnest widget
Yeah it can take it but I have to add permute function to it, not sure why that is exactly needed though:
plt.imshow(train_Container_Images[3487].permute(1, 2, 0))
mild dirge
Because it expects (height, width, channels) and not (channels, height, width)
earnest widget
On its own, it does not take.
 spare mulch
i just watched neural networks from scratch series in YT but it isn't finished and could you give me some ideas of what i could do to complete my knowledge of neural networks?
earnest widget
mild dirge
Because it expects `(height, width, channels)` and not `(channels, height, width...
Oh okay. Yeah the image looks a bit weird too.
mild dirge
maybe bgr instead of rgb
Shouldn't matter for the model
If you have applied a transform to change the mean and std that could be it too
earnest widget
Yes I have transform to resize and normalize the images but I think I can still view it as a normal RGB:
# Define the data transformation
transform = transforms.Compose(
    [
        transforms.Resize((224, 224)),  # Resize the images to (224, 224)
        transforms.ToTensor(),  # Convert the images to PyTorch tensors
        transforms.Normalize(
            mean=[0.485, 0.456, 0.406], std=[0.229, 0.224, 0.225]
        ),  # Normalize the images
        transforms.Lambda(lambda x: x * 255),  # Scale the pixel values to [0, 255]
    ]
)

# Load the dataset
dataset = datasets.ImageFolder(root="full_data/", transform=transform)

# Define the dataloader
dataloader = torch.utils.data.DataLoader(dataset, batch_size=32, shuffle=False)

train_Container_Images = []
train_Container_Labels = []

# Loop through the dataloader
for images, labels in dataloader:
    # Add the images and labels to the lists
    train_Container_Images.append(images)
    train_Container_Labels.append(labels)

# Concatenate the lists into a single tensor

train_Container_Images = torch.cat(train_Container_Images, dim=0)
train_Container_Labels = torch.cat(train_Container_Labels, dim=0)

print(train_Container_Images.shape)
print(train_Container_Labels.shape)
transforms.Lambda(lambda x: x * 255), # Scale the pixel values to [0, 255] this is false
The pixels aren't normalized to 0-1, so multiplying by 255 doesn't make it 0-255
earnest widget
Oh yeah it needs to be divided by 255 right?
mild dirge
no
spare mulch
guys could you please recommend where to learn neural networks...
mild dirge
You should really look at what the normalize function does before using it 😛
earnest widget
mild dirge
You should really look at what the normalize function does before using it 😛
I mean I have just been dividing it by 255.0 when I was using TF, also through a lot of tutorials.
mild dirge
That would be one way to do it yeah, but that is not what you are doing now
        transforms.Normalize(
            mean=[0.485, 0.456, 0.406], std=[0.229, 0.224, 0.225]
        )
I have to calculate the mean and std of my images?
mild dirge
No the values are fine, they are probably from ImageNet dataset
But look up what the function does
It should clarify the "weird" colors
earnest widget
mild dirge
No the values are fine, they are probably from ImageNet dataset
Yeah it's imagenet dataset values.
spare mulch
spare mulch
guys could you please recommend where to learn neural networks...
guys just give me any link to a resource pls
earnest widget
mild dirge
But look up what the function does
The Pytorch docs are fine for this right?
mild dirge
Yes
I'm not saying the transform is wrong btw, but it explains why they look weird when plotted
earnest widget
mild dirge
I'm not saying the transform is wrong btw, but it explains why they look weird w...
Oh okay. Alright. Also, just an unrelated question, is it hard to convert TF models into Pytorch way?
mild dirge
If they have layers that are available in pytorch no
Maybe there is already a pre-made model available
earnest widget
Oh okay, alright. Thanks.
So I removed the lambda function and now it looks less weird.

But it's fine, still better than last time.
 teal wren
Hi! im trying to use train_test_split(), however im getting this error ValueError: Found input variables with inconsistent numbers of samples: [251, 3], even though both my arrays have the same rows
I cant figure out the problem
cloud marsh
thorn swift
RNN/LSTM: https://www.tensorflow.org/lite/models/convert/rnn only thing is that ...
awesome, thanks!
i was worried that it would take something like that.
i should really be looking ahead at these docs I guess, but I'm stuck working on spark queries.
 magic dune
thorn swift
RNN/LSTM: https://www.tensorflow.org/lite/models/convert/rnn only thing is that ...
magic dune
thorn swift
RNN/LSTM: https://www.tensorflow.org/lite/models/convert/rnn only thing is that ...
what is tf(tensor flow) lite?
thorn swift
magic dune
what is tf(tensor flow) lite?
It’s a package that packs a tf model as into as tight of a binary as possible, for the purpose of making it cheap enough to run on small hardware like a phone or an ardiuno
thin karma
What does this learning curve mean?
 mild dirge
thin karma
mild dirge
thin karma
^
Don't ask the same question twice without even bothering to look at the answers pls :/
thorn swift
thin karma
What does this learning curve mean?
Your models learning but not very well in the general case, look at just the training error for debugging. Probably need more data
thin karma
mild dirge
^
Ah sorry I didn’t see
My MSE is getting lower on the testing data as I add more data points @thorn swift
So the model is overfitting, and I need to add more data points?
thorn swift
The models not overfitting as much as it just doesn’t know enough
 tidal bough
thin karma
My MSE is getting lower on the testing data as I add more data points <@24606090...
tidal bough
thin karma
My MSE is getting lower on the testing data as I add more data points <@24606090...
The concerning part is that your training error is exactly zero.
thorn swift
Plot the training error by itself it’s not 0
Edit: might be wrong I thought the x axis was epochs
tidal bough
If that's not a mistake or something, that means your model perfectly memorized the training set, and hence of course it won't learn any more from it. That's overfitting.
why is the x-axis "training set size", by the way?
thin karma
tidal bough
If that's not a mistake or something, that means your model perfectly memorized ...
Ah alright. What should I do about that? And should I include this in mypresentation?
thin karma
tidal bough
why is the x-axis "training set size", by the way?
Was testing to see how the MSE would react as I add more data points
thorn swift
Bruh I thought it was epochs
tidal bough
How many data points do you have in total?
thin karma
In my set, 40
tidal bough
and what kind of model is it, for that matter?
thin karma
Ridge regression
thorn swift
That’s not enough data, More data= better model
thin karma
Should I even include the graph in my presentation? I could say that the model was overfitting and the MSE went down as I added more data points
tidal bough
I'm pretty concerned about the training error. What does the plot of only it look like? Because I'm worried you have a situation where you literally have more parameters in your model than you have data points, and so the model manages to perfectly represent the data.
thin karma
tidal bough
I'm pretty concerned about the training error. What does the plot of only it loo...
That’s exactly it
I have 440 parameters, about 40 samples of data
tidal bough
Since ridge has regularization, it should be somewhat able to handle such situations, I think, but seems not to this degree. Does the training error go above zero when you use all of your training points?
thin karma
tidal bough
Since ridge has regularization, it should be *somewhat* able to handle such situ...
It’s at like 0.005, how do I use all my training points? Test on 2% of the training data?
tidal bough
Ah, I meant all 40, but I guess you meant you have 40 total and 10 of them is the training set, which makes sense. Not sure what you can do; that's very few points for such a high-dimensional problem. Try increasing regularization, I guess? not sure it (or anything) would help
thin karma
thin karma
What does this learning curve mean?
Would this be something I can present to the class? I could say the graph showed that we had a relatively small sample size which resulted in overfitting
And in the future we would use more data points
I’m just trying to see what we can present this as
tidal bough
Fitting a linear model to 40 points in a 440-dimensional space is like... imagine if you had 2 points in a 3-dimensional space, and these points are from a plane, and you wanted to find that plane. There's infinity possible planes passing through these two points, so the only way you could meaningfully choose one is if you had strong priors about how that plane can be placed. If you do, you can guess a specific place based on these two points and the prior, but you have no way of knowing how close that is to reality.
Ridge has regularization, which is kind of like having a prior that the plane should be placed some "simple" way. That'd help in some cases, but not in a case where you have 400 dimensions worth of freedom.
thin karma
I know I see
This is a starter linear regression model
Could I just use the chart to show that the data was overfitting, and that adding more data points helped in reducing the MSE from it?
@tidal bough
tidal bough
I guess you could, though strictly speaking, the confidence intervals of the orange curve at the ends overlap here, so the downward trend might not even be statistically significant.
past meteor
thin karma
I have 440 parameters, about 40 samples of data
Kernel based approaches /w solving in the dual should be your go-to for cases where d >>> n
Assuming you're using sci-kit learn I'd try LinearSVR and SVR (kernel=rbf) you should definitely tune the hyperparameters (C, gamma) though
lapis sequoia
 restive path
hello, advice for those who are learning about data science?
serene scaffold
restive path
hello, advice for those who are learning about data science?
even though data science involves programming, don't learn it in terms of programming. don't try to "learn scikit-learn" (because there's too much to memorize anyway), and definitely don't try to "learn pytorch" in an effort to learn about neural networks.
magic dune
thorn swift
It’s a package that packs a tf model as into as tight of a binary as possible, f...
intresting
 topaz sorrel
Hi everyone! I accessed the sovits EN training colab 4.0.ipynb template to create a voice model, and ran all cells but there are some errors that I dont understand after I mounted my Google Drive (which included audio files I want to clone)

I think there must be something wrong with how I named something in my drive? Or maybe I’m completely missing something. Appreciate any help 🙏🏽
serene scaffold
topaz sorrel
Hi everyone! I accessed the sovits EN training colab 4.0.ipynb template to creat...
People aren't going to want to watch a video to see an error message. Try copying and pasting the relevant text into the chat as text.
topaz sorrel
oh okay one second 😄
I mounted the "dataset" folder in the Google Drive that has the zip file in it.
Code: !python preprocess_flist_config.py
Output: Traceback (most recent call last):
File "/content/so-vits-svc/preprocess_flist_config.py", line 38, in <module>
for speaker in tqdm(os.listdir(args.source_dir)):
FileNotFoundError: [Errno 2] No such file or directory: './dataset/44k'
Code: !python preprocess_hubert_f0.py
Output: Traceback (most recent call last):
File "/content/so-vits-svc/preprocess_hubert_f0.py", line 60, in <module>
chunks = [filenames[i:i + chunk_size] for i in range(0, len(filenames), chunk_size)]
ValueError: range() arg 3 must not be zero
serene scaffold
topaz sorrel
I mounted the "dataset" folder in the Google Drive that has the zip file in it. ...
I'm going to sleep, but you need to make sure that the dataset directory is a subdirectory of the current working directory, and that it contains 44k, whatever that is.
You can use os.getcwd() to find out what python thinks the current working directory is.
topaz sorrel
Thank you!!! Where do I insert os.getcwd()?
serene scaffold
You just run it somewhere and see what the output is. You don't actually need it to be part of the solution
You just need to know if the current working directory isn't what you expect.
topaz sorrel
okay thank you, i appreciate it
 rugged comet
"The lasso regression introduces sparsity into the model, which is what we’re looking for to work with high dimensional space data."
https://medium.com/working-with-high-dimensional-data/working-with-high-dimensional-data-9e556b07cf99
If I understand correctly, it sounds like you want your data to be sparse if it's in high dimensions. I have about 2500000 samples and ~25000 dimensions for this dataset.
I was originally thinking about doing PCA to reduce the dimensionality but I'm not really sure what algorithms to try after that.
One sample row would be a sparse matrix of zeroes and ones. The label would be a 0 or a 1. I think my data is already sparse.
This is kind of a mishmash of information about the problem. If you want to know more, please ask. If you have any advice or insight, please tell.
Medium
Nowadays it is extremely easy to find interesting data to get started into the machine learning world. The problem is not finding the data…
Perhaps it's wrong to call my data high dimensional because I have more samples than features.
 queen cradle
rugged comet
"The lasso regression introduces sparsity into the model, which is what we’re lo...
queen cradle
rugged comet
"The lasso regression introduces sparsity into the model, which is what we’re lo...
25,000 dimensions is high-dimensional no matter how many samples you have. But what you should do about it depends on your ultimate goal. What scientific question are you trying to answer?
rugged comet
queen cradle
25,000 dimensions is high-dimensional no matter how many samples you have. But w...
25,000 dimensions is high-dimensional no matter how many samples you have.
From what I've read tonight, it seems like high dimensional data is classified as "data in which the number of features, p, are close to or larger than the number of observations, n". It sounds like you'd disagree with this.
But what you should do about it depends on your ultimate goal. What scientific question are you trying to answer?
Right now, we're in the stage of exploring algorithms that could be applied to our dataset. We don't really know what questions we're trying to answer yet.
queen cradle
rugged comet
> 25,000 dimensions is high-dimensional no matter how many samples you have.
Fr...
Yes, I would greatly disagree with that statement. One reason why is that there are statistical tasks you cannot do in high dimensions such as 25,000. For example, you cannot reliably do density estimation (there is not enough information in the universe). Another is that you will always be able to reduce the dimension to something reasonable without distorting the data much (this is a consequence of the Johnson–Lindenstrauss lemma); there is not enough information in the universe for anything to actually require 25,000 dimensions.
That does not mean it's bad to have 25,000-dimensional data. There may be useful information in all of those features. It just means that some features are dependent on some others, possibly in a complicated way.
rugged comet
Are you suggesting I do something?
queen cradle
No.
You've said you don't really know what questions you're trying to answer. That's a totally reasonable place to be. But without knowing something about what you're trying to do or what the data is, I can't recommend anything.
I can tell you that you can certainly reduce the dimensionality of your data. But reducing dimension generally makes it much harder to figure out what's going on, so if you're exploring, I wouldn't recommend doing that yet.
rugged comet
queen cradle
You've said you don't really know what questions you're trying to answer. That's...
I can tell you more about the data if you'd like.
queen cradle
Please do.
rugged comet
So there's a card game called Magic: The Gathering. I'm going to generalize about it. You have a deck of exactly 100 unique cards. There about 25000 different cards in the game that you can include in your deck. I have about 2500000 deck lists of cards that people have put together. Some of these deck lists are labeled with a tag. This tag describes the general strategy of a deck.
queen cradle
Is this a question about deck optimization?
rugged comet
It could be.
It could also be about classifying unlabeled decks into their tags.
Like I said, we don't really know what we want to do with the data, we just want to do something.
queen cradle
Deck optimization requires knowledge of the game mechanics. Even the worst deck can win if your opponent doesn't know how to play. Deck classification, on the other hand, sounds like a clustering problem. There are lots of clustering algorithms out there, and it sounds like you have some labels.
rugged comet
Okay. Now we're getting somewhere.
Yeah, we have some labels. Can you think of any clustering algorithms that would work with high-dimensional, sparse data? I say sparse because a deck will likely be encoded as a matrix of zeroes and ones. Where a one in a position indicates that that deck uses the card in that position.
queen cradle
The hdbscan package might do what you want. Look at https://hdbscan.readthedocs.io/en/latest/index.html.
It doesn't take labels as input, but it might work on data of your scale.
Here's a trick you might find useful: Cluster the data, use umap to reduce to something two-dimensional, plot it, and see if you can observe any structures.
rugged comet
queen cradle
It doesn't take labels as input, but it might work on data of your scale.
We're not set on using the labels. So clustering using this package could be interesting.
Can you talk about umap as a dimensionality reduction tool compared to others?
queen cradle
Well, see https://umap-learn.readthedocs.io/en/latest/ for the full story.
And read the paper if you want some really sophisticated math.
There's kind of a hierarchy of dimensionality reduction methods. The Johnson–Lindenstrauss lemma that I mentioned earlier is a data-independent linear dimension reduction technique. PCA is a data-dependent linear dimension reduction technique. T-SNE and UMAP are data-dependent non-linear dimension reduction techniques. Broadly, JL is fast compared to T-SNE and UMAP, while T-SNE or UMAP decrease the dimension more than JL, and PCA is in the middle of both.
rugged comet
It looks like in order to use UMAP, we need to make some assumptions about the data.
"1. The data is uniformly distributed on Riemannian manifold;
-
The Riemannian metric is locally constant (or can be approximated as such);
-
The manifold is locally connected."
I haven't of any of these terms. Can you recommend any resources to learn about them? Or if you know about them, please tell me what you know about them.
queen cradle
Believe me when I say that understanding where UMAP comes from is quite difficult. The math gets much more intense than even the part you quoted.
However, you don't need to understand the details in order to apply UMAP experimentally! If your goal is simply to make a useful visualization, you can use it as a black box.
If you really want to understand the assumptions, then you'll need a few years of math courses.
(PhD-level math courses.)
rugged comet
What would happen if I blindly applied UMAP and one or more of the assumptions about the data were false?
That's why I'm hesitant to try to apply something I don't understand.
queen cradle
You might get an incorrect picture of the data.
But seeing as there are no truly accurate pictures of high-dimensional data, that's basically inevitable.
The goal of UMAP (and t-SNE) is to try to give you a reasonably good picture of the data. UMAP works in a provably good way under some assumptions. Without those assumptions, well, it does the best it can. It'll work to the extent that its assumptions are fulfilled.
rugged comet
That's fair.
So it sounds like I could use hdbscan to cluster the data and UMAP to reduce the dimensionality to a plottable state.
What could doing that tell us?
 iron basalt
rugged comet
It looks like in order to use UMAP, we need to make some assumptions about the d...
iron basalt
rugged comet
It looks like in order to use UMAP, we need to make some assumptions about the d...
https://www.youtube.com/watch?v=nq6iPZVUxZU What it's actually doing is pretty intuitive with some visuals.

This talk will present a new approach to dimension reduction called UMAP. UMAP is grounded in manifold learning and topology, making an effort to preserve the topological structure of the data. The resulting algorithm can provide both 2D visualisations of data of comparable quality to t-SNE, and general purpose dimension reduction. UMAP has been...
(e.g. why it needs to be uniformly distributed becomes visually apparent)
(It's the math approach of "assume X is true" (so that the idea works) -> mess around with the input to make it true or "close to true" (as good as possible, different methods can be applied at this step))
(An example of something like that that you probably already do is shuffling your data (because it's an assumption later on for things to work (note how simple shuffling does not always work with unbalanced data)))
past meteor
serene scaffold
even though data science involves programming, don't learn it in terms of progra...
What do you specifically mean with this btw?
I did a pretty theoretical masters and tbh the stuff really clicked when I actually started using it in Sci-Kit, Pytorch, etc.
thorn swift
I completely disagree, from my experience pseudo code and theory mean nothing if you can’t implement it. If you don’t know how to work with tensors you’ll be dead weight on any meaningful project.
mild dirge
I think it is similar to "if you can explain it to a 5yo, you understand it", but you can explain it to a computer instead. Theory comes before practice.
serene scaffold
thorn swift
I completely disagree, from my experience pseudo code and theory mean nothing if...
this statement isn't mutually exclusive with what I said. I can elaborate in a bit.
past meteor
For me concepts are only meaningful if I've both read the theory AND implemented it. My math skills are not good enough to always understand concepts by just reading them so I frequently just write stuff from scratch in Numpy / Jax / Torch because when I'm doing so I'm forcing myself to "understand" whatever Algo I'm writing. It is very time consuming though 🤷♂️ this is for example how I learnt RL, I implemented most of what I read in papers and books.
agile cobalt
in theory yes
in practice depends on which input features you have
 boreal cape
hey guys my tfidif is performing better than bert model on generating word embeddings for classification
why is that happening
agile cobalt
whenever or not it might work out depends on what those features are and what that event is
if it is possible to predict that event based on those features, it might work
if the features and the event are not correlated at all, then you'll just get a model that looks overfit and does not works at all for the test/validation data
at this point it feels like less of a data science problem and more of a domain specific problem
boreal cape
like the tidif model is generating 500 length vector most values in that are zero
and because of that i think the classifier is easily generating sparse values
agile cobalt
as far as data science is concerned, it can create a function that'll work for that
whenever or not that function will generalise well depends on if your input features make sense for predicting that event, which concerns more whichever field those inputs and events come from than data science itself
(there are some things you can do to test statistical significance and what not though)
how many years of data do you have?
assuming at least 10 or so (though preferably you would really want at least 50 or 100), I'd recommend just doing a normal train-test split on the last 30% without shuffling
agile cobalt
boreal cape
lets say tfdif
personally no clue
the event is 1 on how many of those?
might be possible, but 17 data points is really low
maybe try a simple LogisticRegression first
past meteor
Hot take but if you have that little data you might as well just look at it and write if/thens
I mean, I'd do the basic EDA stuff first like calculating simple correlations
boreal cape
@past meteor do you known anything about generating word embeddings
wooden sail
what do you wanna know about word embeddings
boreal cape
my tidif model is performing better than bert
in generating word embeddings for calssification
I am just trying to figure out why
wooden sail
performing better at what?
boreal cape
like the vectors generated by tidif are getting classified to higher accuracy
than bert
which shouldn't happen as bert takes in the semantic context
past meteor
How big is your embedding vs tfidf vector?
boreal cape
768 vs 500
wooden sail
how diverse is the data you're testing with afterwards
boreal cape
I have used 4 fold cv split
 dense pollen
I don't know where else to ask, as I'm only embedded programmer and have no insight on statistics whatsoever, figured you guys here would be smarter helping my gf than I am
My GF has a thesis on medical topic and has given some papers to collect data from people in the industry. She collected them and analysed them to gather some data for her thesis, but there is 1 question she don't know how to tackle statistically
It's an checkbox for like 8 questions and the respondents have to mark them 1-2-3-4 based on the sequence how they do that work. For example if I make a soup, there would be these questions:
[] Carrot
[] Oil
[] Water
and I'd mark them like this appropiately
[2] Carrot
[1] Oil
[3] Water
Other respondents would mark it like 1-2-3 or 3-2-1 and now I have different answers. How would you "graph" this problem? Do you have any ideas?
If this question doesn't belong here, pardon me and you can delete my message, or you can tell me where to ask this question. Thank you kindly! 🙂
boreal cape
@wooden sail you there
wooden sail
mhm
my impression would be that bert is trained on larger data sets and complex texts, so that on average it'll outperform your model on all text, but your model is trained only with this specific data set, so it can perform well on it
have you tested with completely different data?
boreal cape
like i have used cross validation and stuff
wooden sail
dense pollen
I don't know where else to ask, as I'm only embedded programmer and have no insi...
off the top of my head, some things you can do are: for each item (e.g. carrot), you can make a frequency plot where you say how many people chose 1,2,3, etc. additionally, you can show a couple of the most popular sequences
boreal cape
but i don't think thats what you are talking about
wooden sail
indeed. i mean like grabbing completely different text now
boreal cape
but I have specific data I want it to perform on
wooden sail
then it's fine and it's not surprising you can outperform bert
boreal cape
I just wanna reduce number of zeroes in tidif
vectors
@wooden sail is it possible to reduce zeros in the vectors and reduce sparness in the data
wooden sail
you can embed in a lower dimensional vector space
there's a thing called "embedding layer" that can do this for you
boreal cape
how
wooden sail
how in math or how in code
past meteor
What is your model?
boreal cape
simple basic vetorize tfidif modelvectorizer = TfidfVectorizer(stop_words=stop_words,max_features=500,min_df=10)
past meteor
Yeah but your classifier or whatever that uses these features?
past meteor
How does Bert deal with out-of-vocabulary items again edd?
wooden sail
oof, that idk. i dunno how many tokens it uses for that
past meteor
Does it use the hashing trick?
Because if their vocab is super specific and they all get mapped to (nearly) the same bucket then yes it makes perfect sense
boreal cape
guys what about the embedding layer thing
past meteor
It's just a DxK matrix with D>>>K that you multiply with a sparse vector to get a dense one
It can be learnt together with your model
wooden sail
that's pretty much it. tf and pytorch have layers for it, but also you can in general use a random matrix and it'll work with high probability
https://scikit-learn.org/stable/modules/generated/sklearn.random_projection.johnson_lindenstrauss_min_dim.html scikitlearn has this one for it
scikit-learn
Examples using sklearn.random_projection.johnson_lindenstrauss_min_dim: The Johnson-Lindenstrauss bound for embedding with random projections The Johnson-Lindenstrauss bound for embedding with rand...
but you can use any matrix with i.i.d. gaussian or bernoulli-gaussian entries
past meteor
I found it so funny when I realised random projections worked well for many problems
wooden sail
yep. for sparse enough vectors, this yields almost orthonormal bases very easily
cold osprey
ure using only 1 feature?
dense pollen
wooden sail
off the top of my head, some things you can do are: for each item (e.g. carrot),...
would most popular sequences only be approved in a thesis?
 tawdry flint
Where to start learning how to code machine learning?
serene scaffold
tawdry flint
Where to start learning how to code machine learning?
there are two parts to this: learning about machine learning itself, and learning how to code things that apply what you've learned. this is the book I recommend to beginners: https://www.oreilly.com/library/view/data-science-from/9781492041122/
O’Reilly Online Learning
queen cradle
dense pollen
I don't know where else to ask, as I'm only embedded programmer and have no insi...
You don't say what your GF is trying to learn from this question, but I'm guessing it's something to do with determining popular orderings? If the goal is to determine whether the ordering depends on other data she's collected, then it sounds like an https://en.wikipedia.org/wiki/Ordinal_regression problem. If the goal is to determine what the most popular ordering is, that sounds like preference data, as in https://www.jstor.org/stable/2986359, for example.
 honest skiff
What is the difference between PySpark and Pandas?
 long zephyr
quick question:
I have a neural network that takes as input a series of features computed by applying the fourier transform over a waveform and then extracting some aggregated attributes from the result, such as:
Mean
Median absolute deviation (MEDIAN_AD)
Number of peaks
Energy (sum of squares)
Skewness
Kurtosis
Mean acceleration
Signal magnitude, etc
The issue is that after 80 epochs, the accuracy is 0.08% and I think my model doesn't learn anything.
This is the summary for it:
Model: "sequential"
Layer (type) Output Shape Param #
dense (Dense) (None, 528) 10032
dropout (Dropout) (None, 528) 0
dense_1 (Dense) (None, 264) 139656
dropout_1 (Dropout) (None, 264) 0
dense_2 (Dense) (None, 264) 69960
What should the issue be, here?
past meteor
honest skiff
What is the difference between PySpark and Pandas?
The main similarity is that they're both dataframe libraries but Spark was built from the ground up for distributed computation (over many machines)
It also has a bunch of features that make sense if you're working with large datasets (that may not even fit in memory)
honest skiff
Ahh okay gotcha. So I would assume PySpark is preferred for larger-scale systems?
past meteor
You can use PySpark on a single machine as well and some people do
But yes it's one of the options you have for working with very large datasets
honest skiff
I see
past meteor
long zephyr
quick question:
I have a neural network that takes as input a series of features...
A rule of thumb I sometimes do is sanity checking my architecture by trying to overfit on a few samples. You should be able to get pretty much exactly 0 loss on 1 sample which shows you're in principle learning something and you do not have weird bugs.
hasty mountain
long zephyr
quick question:
I have a neural network that takes as input a series of features...
What is the task? You might be using too many attributes that not necessarily are correlated.
long zephyr
Birdclef-2023, or bird classification based on sound.
I am using a total of 18 attributes, computed as follows
result = np.append(result, X.mean(axis=2), axis=1)
            result = np.append(result, X.std(axis=2), axis=1)
            result = np.append(result, np.mean(np.absolute(X - np.mean(X, axis=2)[:,:,None]), axis=2), axis=1) #MAD
            result = np.append(result, X.min(axis=2), axis=1)
            result = np.append(result, X.max(axis=2), axis=1)
            result = np.append(result, X.max(axis=2) - X.min(axis=2), axis=1)
            result = np.append(result, np.percentile(X, 50, axis=2), axis=1) # MEDIAN
            result = np.append(result, np.mean(np.absolute(X - np.percentile(X, 50, axis=2)[:,:,None]), axis=2), axis=1) #MEDIAN_AD
            result = np.append(result, iqr(X, interpolation = 'midpoint', axis=2), axis=1)
            result = np.append(result, np.sum(X >= 0, axis=2), axis=1) # count positive
            result = np.append(result, np.sum(X < 0, axis=2), axis=1) # count negative
            result = np.append(result, np.sum(X > np.mean(X, axis=2)[:,:,None], axis=2), axis=1) # count above mean
            result = np.append(result, np.array([[find_peaks(X[k][i], height=0)[0].shape[0] for i in range(X.shape[1])] for k in range(X.shape[0])]), axis=1) #NO. OF PEAKS
            result = np.append(result, (sp.sum(X*X, 2)/X.shape[-1]), axis=1)
            result = np.append(result, skew(X, axis=2), axis=1)
            result = np.append(result, kurtosis(X, axis=2), axis=1)
            result = np.append(result, np.mean(sp.sum(X**2, 1), axis=1)[:, None], axis=1) # mean accel
            result = np.append(result, sp.sum(np.mean(np.absolute(X), axis=2), 1)[:, None], axis=1) # signal magnitude
Where X is np.fft.fft(wavedata)
wavedata is actually segmented in chunks with the duration of 5 seconds and no overlap
past meteor
long zephyr
I am using a total of 18 attributes, computed as follows
```
result = np.append(...
Check out TSfresh to get a ton of these features out for free by the way
hasty mountain
Perhaps the issue is with your architecture.
If I remember correctly, waveforms, audio data in general tend to be treated as sequential data
past meteor
Not if they extract features from the full signal tbh but even so I'd try overfitting on just 1-2 samples to see if your architecture is remotely sound
hasty mountain
Yeah...overfitting seems a strategy to check if the model can learn something...
long zephyr
To be honest, I do have my doubts with the current architecture too.
This is what I am using at the moment
# Train a CNN model
from tensorflow.keras.models import Sequential
from tensorflow.keras.layers import Dense, Dropout
from tensorflow.keras.utils import to_categorical

# Define the number of input features, classes, and a dropout rate
input_features = 18
num_classes = len(competition_classes)
dropout_rate = 0.5

# Create a sequential model
model = Sequential()

# Add the first dense layer with ReLU activation
model.add(Dense(2*num_classes, activation='relu', input_shape=(input_features,)))

# Add dropout to prevent overfitting
model.add(Dropout(dropout_rate))

# Add the second dense layer with ReLU activation
model.add(Dense(num_classes, activation='relu'))

# Add dropout to prevent overfitting
model.add(Dropout(dropout_rate))

# Add the output layer with softmax activation for multi-class classification
model.add(Dense(num_classes, activation='softmax'))

# Compile the model with categorical crossentropy loss and an optimizer
model.compile(loss='categorical_crossentropy', optimizer='adam', metrics=['accuracy'])
If you can featurize a time series correctly (and that's the big if) you don't need to use a recurrent / conv / ... model on it but you could argue that this stuff is more timeconsuming than making RNN go brrrr
long zephyr
past meteor
Not if they extract features from the full signal tbh but even so I'd try overfi...
So like only using 1-2 samples for training?
past meteor
long zephyr
So like only using 1-2 samples for training?
Yes and just looking at the training loss, it should hit 0 at some point
 past meteor
With 1-2 samples?
long zephyr
ah, no, let me try like that
hasty mountain
It seems your model reached its limits 
past meteor
Honestly this is why I dislike neural networks sometimes, too many degrees of freedom
You might as well debug by throwing everything into Xgboost, Random forest, rbf-SVM, logistic regression, ... because it takes a lot less time and you get baselines
Like if any of those gets above random chance and your neural net is between random chance and any of those you know something is specifically up with your network
long zephyr
ok so with 2 samples and 5 epochs:
I modified the model.fit like this
history = model.fit(train_set[:900], train_labels_set_categorical[:900], batch_size=64, epochs=5)```
accuracy looks a bit better
past meteor
Train it for more epochs, go till 0
long zephyr
100 epochs

ill try with 1000 now
it fluctuates a lot tho
ok yeah, i had to train it for more epochs
now it settled around 0.92

So does this mean there is actually a chance for my model? 😭
past meteor
I mean, there's a bunch of things that you can try but it's late and I can't type them all out rn. You have dropout so that may be affecting your metrics
I think you're fine in principal but you could also play with removing the dropout for now and making your model larger
long zephyr
Will do that, thank you so much for the tips.
Btw, one last thing, you have mentioned TSfresh?
past meteor
Also you should really get a few benchmarks with sci-kit learn
TSFresh generates ~ hundreds of features from time series similar to the ones you have but also more advanced ones
long zephyr
oh wow, that sounds amazing.
should i use it both on the fourier spectrogram and the raw waveform?
Hmm, I will try that and check for the results, anyway thank you a lot!
mint palm
def sim_matrix_inference(text_embeds_per_video_id, vid_embeds_pooled_per_video_id, pooling_type):
    """
    Computes the similarity matrix using pooled video frames using all texts per video
    Output
        sims: num_vids x max_text_per_vid x num_vids
    """
    text_embeds_per_video_id = text_embeds_per_video_id / text_embeds_per_video_id.norm(dim=-1, keepdim=True)
    vid_embeds_pooled_per_video_id = vid_embeds_pooled_per_video_id / vid_embeds_pooled_per_video_id.norm(dim=-1, keepdim=True)

    if pooling_type == 'avg':
        # text_embeds_per_video_id -> num_vids x max_text_per_vid x embed_dim
        # vid_embeds_pooled_per_video_id -> num_vids x embed_dim

        sims = text_embeds_per_video_id @ vid_embeds_pooled_per_video_id.t()

    else:
        # text_embeds_per_video_id -> num_vids x max_text_per_vid x embed_dim
        # vid_embeds_pooled_per_video_id -> num_vids x num_vids x max_text_per_vid x embed_dim
        num_vids, max_text_per_vid, embed_dim = text_embeds_per_video_id.shape

        # num_vids x max_text_per_vid x embed_dim x num_vids
        vid_embeds_pooled_per_video_id = vid_embeds_pooled_per_video_id.permute(1,2,3,0)
        vid_embeds_pooled_per_video_id = vid_embeds_pooled_per_video_id.view(num_vids*max_text_per_vid, embed_dim, num_vids)
        # num_vids x max_text_per_vid x 1 x embed_dim
        text_embeds_per_video_id = text_embeds_per_video_id.unsqueeze(2)
        text_embeds_per_video_id = text_embeds_per_video_id.view(num_vids*max_text_per_vid, 1, embed_dim)

        sims = torch.bmm(text_embeds_per_video_id, vid_embeds_pooled_per_video_id)
        sims = sims.view(num_vids, max_text_per_vid, 1, num_vids).squeeze(2)

    return sims
any time efficient way to visualise these view, permute, reshape?? i use notebook so far
 mossy atlas
@mint palm please sand a ticket system. I'm very stuck
mint palm
mint palm
```py
def sim_matrix_inference(text_embeds_per_video_id, vid_embeds_pooled_per_...
i understand everything, but how would experienced folks save time understanding it?
 bold timber
Hello guys I have a question about the seq2seq algorithm:
Is the context vector passed for each decoder when the decoder produces one token or just only once?
What I mean by that is whether or not each output from decoder will use the context vector again to get output in another decoder?
As I know, the context vector is used attention weight which is sum of weight for every token. And then use softmax activation to get which token that importance.
I'm confused about whether context vector will be used for each decoder one by one or just once?
past meteor
bold timber
Hello guys I have a question about the ``seq2seq`` algorithm:
Is the context vec...
Some seq2seq architectures go through the entire input to create a latent vector and then decode it until <EOS> or some other stop token is predicted.
 prisma citrus
I wonder if there is any software or ai that lets you sort images according to faces it detects. Kinda like how google photos does.
Anyone know what i should look into to make a similar AI?
or if there already is one can anyone link it to me
 signal robin
hello anyone who worked with Wav2Vec model for speech recognition
i have a few questions
 patent scaffold
signal robin
hello anyone who worked with Wav2Vec model for speech recognition
patent scaffold
signal robin
hello anyone who worked with Wav2Vec model for speech recognition
Yes
signal robin
I want to fine tune the wav2Vec model for my own dataset
Basically the inputs would be the vector column and the labels would be the transcribed column. I want my model to fit to these. I am having difficulty in working with wav2Vec

the vector column is created after loading each audio using the librosa library
 hushed wave
hi
this might be the wrong category to ask in
and if it is, id appreciate it if you could point me to the right chat
but my uni course is ai so ill ask here
working on a ml project
and part of it requires me to use deepface for emotion detection
i have 7000 frames from a vid
and i have code to detect emotion
but it does it one frame at a time
is there a way to loop it to run through all frames?
serene scaffold
hushed wave
is there a way to loop it to run through all frames?
I would assume so? loops are part of Python, so the default assumption is that you can use them. if there's some reason why you wouldn't be able to, you haven't shared enough information to establish that (like what you're using to predict the emotion for each frame, or how the frames are represented in your code).
serene scaffold
hushed wave
am i okay to send an image of the code?
Be sure to never show images of code. Copy and paste it as text.
!code
arctic wedgeBOT
hushed wave
# Emotion Detection
name="frame-202.jpg"
frame = cv2.imread(f'/content/gdrive/MyDrive/video_frames3/{name}')

try:
      res = DeepFace.analyze(frame, actions=['emotion'])
      print(res[0]['dominant_emotion'])
     # print(res['dominant_emotion'])
        # Draw rectangles around faces
      print(res)

      x = int(res[0]['region']['x'])
      y = int(res[0]['region']['y'])
      w = int(res[0]['region']['w'] + x)
      h = int(res[0]['region']['h'] + y)
      cv2.rectangle(frame, (x,y), (w,h), (0, 255, 0), 2)

      text = res[0]['dominant_emotion']
      startY = y
      startX = x
      y = startY - 10 if startY - 10 > 10 else startY + 10
      cv2.putText(frame, text, (startX, y),
        cv2.FONT_HERSHEY_SIMPLEX, 0.45, (0, 0, 255), 2)

      cv2_imshow(frame)

except Exception as e: print(e)
delete the try-except stuff. it's not doing anything for you
so each frame is a separate image?
serene scaffold
from pathlib import Path

frame_directory = Path('/content/gdrive/MyDrive/video_frames3/')

for path in frame_directory.iterdir():
    frame = cv2.imread(str(path))
    # etc.
remember to use try-except if you actually have a plan to handle that exception. not just to "make it go away"
 slim lance
So I have a project where I have to search through an array of product prices represented as nested disctionaries with arbitrary keys. In my initial work with this data source I did gross brute force iteration through the whole thing looking for the data I wanted, but I have to revisit. (It's AWS RDS pricing.)
I knew there had to be a better way, and discovered all the competing JSON/dictionary search modules. It was a little overwhelming.
Do folks have any thoughts on these libraries? e.g.:
- JMESPath
- ObjectPath
- JSONPath
- JSONiq
- pyjq
- Jaql
- MQL
- JSONQuery
... ?
tidal bough
What do you mean by arbitrary keys here?
slim lance
Let me give you an example.
This is an array of 1 example. Note the "Terms" sections, expecially the offers in "Reserved".. e.g. for a product I want to grab certain reservation types based on some criteria nested deep in those "Offers". Specifically "termAttributes".
Pastebin
Pastebin.com is the number one paste tool since 2002. Pastebin is a website where you can store text online for a set period of time.
past meteor
I always just use the json from stdlib
slim lance
Problem with stdlib, is there is a dictionary in there called reserved where the keys are completely arbitrary product codes. I can flatten and search that way but it seemed like I was fighting my way through the problem.
tidal bough
I see, this is interesting. My first impulse would be to flatten this array of dicts into a pandas dataframe but that'd be somewhat complicated. Maybe you could dump it into some document-kind database, and get fast searches that way...
slim lance
When you have a hammer, right? (Pandas is great, and I'm using it for this project, but mostly to prep a dataframe for uploading into gsheets. (I'm parsing this data to make a gsheets LOOKUP table, which I'll be referencing from a pivot table.)
past meteor
Are the "arbitrary keys" at least in the same place positionally?
slim lance
I can't rely on that. I just need to kind of ignore them.. and match on the values in the termAttributes dict. (I need to snag 1-year no-upfront price and 3-year partial-upfront pricing.)
These JSON query libraries seem perfect for it, but they all have esoteric syntaxes so I want to invest my learning into the "correct" one.
Maybe this is the wrong channel for asking about those libraries?
 cedar verge
does anyone know how i can tell jupyter notebook to utilize my gpu in base python?
serene scaffold
cedar verge
does anyone know how i can tell jupyter notebook to utilize my gpu in base pytho...
this isn't a jupyter notebook question (the answer is the same whether you're using a notebook or a regular py file)
but no, base python doesn't have CUDA. you have to use pytorch, or something like that.
cedar verge
does that mean I have to rewrite my entire code using pytorch?
serene scaffold
cedar verge
does that mean I have to rewrite my entire code using pytorch?
what does the code do?
cedar verge
implementation of a simple linear regression model for the MNIST dataset
serene scaffold
did you use numpy?
cedar verge
no
serene scaffold
how did you do it
cedar verge
it's in base python
serene scaffold
well, yes. you'd need to rewrite it with a library that has CUDA. Jax is an alternative to pytorch that's more lightweight.
lapis sequoia
Hello Masters,In matplotlib how can i pass figure to a function that prints a docx without saving it. So without using fig.savefig
wooden sail
i'm not sure that's possible
serene scaffold
lapis sequoia
Hello Masters,In matplotlib how can i pass figure to a function that prints a do...
why does it need to be a docx file, if you're going to print it?
in order for matplotlib to save something as a docx, Microsoft has to publish what the specification for docx files are, and that specification has to be able to represent matplotlib figures by itself (ie, not by loading an external file).
and I'm not sure if either of those are true.
 mighty patio
lapis sequoia
Hello Masters,In matplotlib how can i pass figure to a function that prints a do...
mighty patio
lapis sequoia
Hello Masters,In matplotlib how can i pass figure to a function that prints a do...
In this case you may get better help if you tell us what problem you are trying to solve, rather than how to implement the solution you have envisioned.
slim lance
FYI: I've ruled it down to 4 libraries:
glom        https://github.com/mahmoud/glom            N    Y    Y    Y    1684
jmespath    https://github.com/jmespath/jmespath.py        Y    Y    Y    Y    1793
jq (pyjq)   https://github.com/doloopwhile/pyjq        N    Y    Y    Y    184
JSONPath    https://github.com/h2non/jsonpath-ng        Y    X    Y    Y    406```

I think I'm going to try Glom first since it seems like a new shiny.Decision paralysis, just go with stdlib's json
slim lance
past meteor
Decision paralysis, just go with stdlib's json
I am using stdlib json to load structure. Need a good search tool and don’t want to have to write it.
“Searching JSON” is a little deceptive. I’m really looking for a way to search nested dictionaries based on deeply nested keys beneath unknown keys.
hushed wave
serene scaffold
```py
from pathlib import Path
frame_directory = Path('/content/gdrive/MyDrive/...
i cant seem to get colab to run this block of code
 odd meteor
cedar verge
does anyone know how i can tell jupyter notebook to utilize my gpu in base pytho...
odd meteor
cedar verge
does anyone know how i can tell jupyter notebook to utilize my gpu in base pytho...
If you're working with Colab just change the runtime type from CPU to GPU in order to utilize CUDA.
Runtime → Change runtime type and selecting GPU from the Hardware Accelerator dropdown list. Once you have done this your runtime will restart and you will need to rerun the first setup cell to reimport PyTorch. Then proceed with your code.
Alternatively, if you're working on your local machine, and you have pytorch installed you can switch from CPU to GPU as well.
import torch
x = torch.randn(10)
print(x.device) #<--- to know where your code execution is happening.
print(torch.cuda.is_available()) #<--- running this on a pc w/o Nvidia GPU will  return False

def set_device():
  """
  Set the device. CUDA if available, CPU otherwise

  Args:
    None

  Returns:
    Nothing
  """
  device = "cuda" if torch.cuda.is_available() else "cpu"
  if device != "cuda":
    print("GPU is not enabled in this notebook. \n"
          "If you want to enable it, in the menu under `Runtime` -> \n"
          "`Hardware accelerator.` and select `GPU` from the dropdown menu")
  else:
    print("GPU is enabled in this notebook. \n"
          "If you want to disable it, in the menu under `Runtime` -> \n"
          "`Hardware accelerator.` and select `None` from the dropdown menu")

  return device

#Let's make some CUDA tensors now

# common device agnostic way of writing code that can run on cpu OR gpu
# that we provide for you in each of the tutorials
DEVICE = set_device()

# we can specify a device when we first create our tensor
x = torch.randn(2, 2, device=DEVICE)
print(x.dtype)
print(x.device)

# we can also use the .to() method to change the device a tensor lives on
y = torch.randn(2, 2)
print(f"y before calling to() | device: {y.device} | dtype: {y.type()}")

y = y.to(DEVICE)
print(f"y after calling to() | device: {y.device} | dtype: {y.type()}")
if something doesn't work, be sure to always say how you know that it didn't work.
hushed wave
mb lemme check rq
i reran the library imports and its executing atm
theres like 7k frames so i think its going to take a while
im ok to check back in once it finishes right?
serene scaffold
I guess
hushed wave
how would i go about making deepface move onto the next image if a face cant be detected?
so far im thinking along the lines of
if(len(faces)>0):
    cv2.imwrite(folder path goes here/frame-{str(i)}.jpg, frame)
elif(len(faces)<0):
    (idk what to put here yet)
don't put parentheses around if statements.
you can use the continue keyword to make a loop go to the next one.
hushed wave
cap = cv2.VideoCapture(f'/content/gdrive/MyDrive/{video_file_name}')
i = 0

while(cap.isOpened()):
    ret, frame = cap.read()

    # This condition prevents from infinite looping
    # incase video ends.
    if ret == False:
        break

    # # Detect face in the frame using OpenCV
    res = DeepFace.analyze(frame, actions=['emotion'])
    print(res[0]['dominant_emotion'])
    # print(res['dominant_emotion'])
    # Draw rectangles around faces
    print(res)

    x = int(res[0]['region']['x'])
    y = int(res[0]['region']['y'])
    w = int(res[0]['region']['w'] + x)
    h = int(res[0]['region']['h'] + y)
    cv2.rectangle(frame, (x,y), (w,h), (0, 255, 0), 2)

    text = res[0]['dominant_emotion']
    startY = y
    startX = x
    y = startY - 10 if startY - 10 > 10 else startY + 10
    cv2.putText(frame, text, (startX, y),
    cv2.FONT_HERSHEY_SIMPLEX, 0.45, (0, 0, 255), 2)

    # Detect face using Retina-Face
    # Temporarily save the video frame
    cv2.imwrite(f'frame.jpg', frame)
    faces = RetinaFace.extract_faces(img_path = "frame.jpg", align = True)


    if len(faces)>0:
      # Save Frame by Frame into disk using imwrite method
      cv2.imwrite(f'/content/gdrive/MyDrive/video_frames3/video_frames3emo/emo_frame-{str(i)}.jpg', frame)
      print(i)
      i += 1
    elif len(faces)<0:
      continue

print(f'Total frames saved: {i}')
cap.release()
cv2.destroyAllWindows()
this is what ive got so far
serene scaffold
hushed wave
```py
cap = cv2.VideoCapture(f'/content/gdrive/MyDrive/{video_file_name}')
i = 0...
while loops should not have parentheses around the conditions, either.
if ret == False: should be rewritten as if not ret:
which part is the loop to get each frame file?
hushed wave
i decided to try getting it to detect face frames aswell as detect emotion before saving it as a frame because it seemed like a good idea
idk if thats a worse idea considering i already have all the base frames in another folder
serene scaffold
I'm at work currently, so I can't do a deep dive into the structure of your code.
hushed wave
oh
mb man
thanks for the help
much appreciated
ive made a copy of the notebook so ill just experiment a bit for now
thorn swift
for stock data you can always get new test data by just waiting, predict now and youll know how the model performs eventually
 serene scaffold
lapis sequoia
serene scaffold
lapis sequoia
please show code as text, and explain how you know it isn't working. what is it supposed to do, and what is it doing that's different from that?
!code