#data-science-and-ml
1 messages · Page 56 of 1
 fallow venture
 untold cliff
fallow venture
Yes. I inserted the encoding='ISO-8859-1' in the line
untold cliff
fallow venture
Yes. I inserted the encoding='ISO-8859-1' in the line
Thanks man.
 sleek harbor
For some reason every course I've taken so far didn't divide data into train/validation/test data, but just train/test, or just CV, treating the validation data as test data. Anyhow, I don't see how that changes anything with my idea of using some logic instead of exhaustive or random parameter selections for CV
untold cliff
sleek harbor
For some reason every course I've taken so far didn't divide data into train/val...
If i understood you correctly, you would be tuning your parameters to minimize the test error which is wrong
sleek harbor
untold cliff
If i understood you correctly, you would be tuning your parameters to minimize t...
Or to minimize the validation error, or to get the highest (best) CV score (depending on what metric we use). Point being, can't we use some sort of logic to determine the best parameters, instead of doing an exhaustive grid or entirely random search of parameters? Purpose being - to minimize computation and still get the best set of hyperparameters that would be obtained with a GridSearchCV, but without testing all possible parameter combinations
untold cliff
sleek harbor
Or to minimize the validation error, or to get the highest (best) CV score (depe...
The way i know is that you would try a random search in a specific range based on your data analysis and experience i guess, and then for the best parameters you get, you would do a grid search for a more parameters in the neighborhood. If there are better ways then i dont know them.
 mild dirge
sleek harbor
Or to minimize the validation error, or to get the highest (best) CV score (depe...
mild dirge
sleek harbor
Or to minimize the validation error, or to get the highest (best) CV score (depe...
There are other parameter search algorithms than just a grid search on all data. One example is halving grid search:
https://scikit-learn.org/stable/modules/generated/sklearn.model_selection.HalvingGridSearchCV.html
There is also stuff like random search (which is like gridsearch, but less exhaustive) and early stopping when you have some specific performance that you think is satisfactory.
scikit-learn
Examples using sklearn.model_selection.HalvingGridSearchCV: Release Highlights for scikit-learn 0.24 Release Highlights for scikit-learn 0.24 Comparison between grid search and successive halving C...
And that curve is not always present, it could be that you have a lot of data, and that the training data is quite representative of real data, similar to validation data, in which case the performance will stay good on the validation data.
Also not 100% what you mean with, "3 random points, create a curve, bottom point, adjust the curve, bottom point, etc."
sleek harbor
mild dirge
Also not 100% what you mean with, "3 random points, create a curve, bottom point...
I just meant that if such a curve was always present (with score on y axis and parameter value on x axis), then it'd be possible to fit a curve to the results of 3 randomly chosen parameters (cus 3 points is enough to create a curve), and then instead of randomly choosing a 4th - the 4th parameter to test would be equal to the extreme of the curve (which would supposedly be our desired best parameters), then we refit the curve (if needed), and repeat the process until refitting is no longer needed. But since, as you say, such a curve isn't always present for all hyperparameters.. the whole idea is pointless 🥲
mild dirge
I was actually misreading the graph, I thought it was training time on x-axis, not complexity
I think in general there will often be a curve that is somewhat similar to this, but this is obviously a very exaggerated graph, and it will not always look like this.
sleek harbor
mild dirge
I was actually misreading the graph, I thought it was training time on x-axis, n...
It's the order (degree) of the polynomial, in other words - just a parameter that needs tweaking
mild dirge
Yes I understand, I think you may be able to sample some complexities, then see where the performance is good, then sample them in that region, up to the precision that you want.
sleek harbor
Does no parameter search algorithm like that already exist?
sleek harbor
Hmm. Gotta do some digging. Thanks
mild dirge
But that is just for polynomials, when trying to do a search for a neural network, it's hard to say when a model is more complex than another, the number of parameters is not 100% accurate estimate of complexity.
So that kind of method would not work as well.
untold cliff
Isn't that graph just a visualization of the variance-bias tradeoff?
 fiery jungle
hi ,
is the delta between Test loss and Training loss = (Test loss + Training loss )/2
Delta = Training Loss - Test Loss <<< nvm
 quartz thicket
When doing scipy's curve fit. In addition to feeding it data and a function, is it possible to ensure the slope at one of (or both) of the endpoints?
 red moon
hey uhhh i built a nneural network and im having trouble w something so if ur good w it would u mind going to dm?
i dont feel comfortable showing everyody my neural net...
red moon
u can change data type of 'x' to torch.float32 using float() method before passing it to the 'Linear' layer. change the 'forward' method of 'GNNEncoder' to include that...
`class GNNEncoder(torch.nn.Module):
def init(self, hidden_channels, out_channels):
super().init()
self.conv1 = SAGEConv((-1, -1), hidden_channels)
self.conv2 = SAGEConv((-1, -1), out_channels)
def forward(self, x, edge_index):
    x = x.float()  # convert to float
    x = self.conv1(x, edge_index).relu()
    x = self.conv2(x, edge_index)
    return x`
now could someone dm me to help w my neral net? 😭
red moon
wdym... is it not working?
 violet gull
Edd
 sharp jewel
Thanks
sleek harbor
Thanks! That was a fun read, even tho I didn't understand everything. This is also an interesting article, if anyone's interested: http://neupy.com/2016/12/17/hyperparameter_optimization_for_neural_networks.html#hyperparameter-optimization-for-neural-networks
Isn't it great when u come up with something, but it's already been invented, but better? U don't have to reinvent the wheel, but at the same time.. I bet inventing the wheel was a lot of fun, and someone else has already done it.. 🥲
Now I'm just left wondering, why doesn't sklearn have a BayesSearchCV function, and why isn't it more popular? Scikit-Optimize has skopt.BayesSearchCV, so it's all good, but would be more convenient if everything was in the same place, so to say
NeuPy is a Python library for Artificial Neural Networks. NeuPy supports many different types of Neural Networks from a simple perceptron to deep learning models.
 quaint loom
Can someone take a look at this and see what I`ve missed :
 late monolith
for i in range(totalxSteps):

        tsheet[i, :] = OU_time_realization(totalTime, timeStep, tgamma)
        for j in range(totaltSteps):

            sheet[i,j] = x0 * np.exp(-xgamma * x[i]) + xStep * np.exp(-xgamma* x[i]) * np.sum(tsheet[0:i+1, j] * np.exp(xgamma * x[0:i+1]))
Would it be possible to do use cumsum here?
I need to go over every array element (i, j) which complicates things
 clever summit
Hello! I need help.
So this is the code: https://paste.pythondiscord.com/recucineqa
This code was supposed to count vehicles drawn in bounding box with a centroid in it, using a line as the counter.
But when a centroid hits the counter line, the vehicle count scores 1 point and then returns to zero once the centroid leaves the counter line, which is the case i don't expect.
What's wrong with this code?
If you want the full code: https://paste.pythondiscord.com/ipofibuqer
untold cliff
quaint loom
Can someone take a look at this and see what I`ve missed :
https://paste.python...
What does your dataframe look like? These seem to be years and not temperatures
untold cliff
late monolith
Would it be possible to do use cumsum here?
What it is that you want to do exactly? Replace the equation for sheet[i, j] with a cumulative sum ?
untold cliff
clever summit
Hello! I need help.
So this is the code: https://paste.pythondiscord.com/recuci...
Can you show us a sample output ?
clever summit
Can i send videos here?
Wait a minute
I'm sorry it lags a lot because i'm using yolov3-320 instead of tiny
@untold cliff
untold cliff
clever summit
<@964482481149603870>
I meant the output. print("vehicle is detected.....
clever summit
It's gonna be long
untold cliff
clever summit
It's gonna be long
Just a few lines
clever summit
0
[2, 2, 2, 2, 2, 2, 2]
1
[2, 2, 2, 2, 2, 2, 2]
3
[2, 2, 2, 2, 2, 7, 2]
2
[2, 2, 2, 2, 2, 7, 2]
5
[2, 2, 2, 2, 2, 7, 2]
6
[2, 2, 2, 2, 2, 7, 2]
vehicle is detected : 1
3
[2, 2, 2, 2, 2, 2]
4
[2, 2, 2, 2, 2, 2]
0
[2, 2, 2, 2, 2, 2]
5
[2, 2, 2, 2, 2, 2]
vehicle is detected : 1
2
[2, 2, 2, 2, 2, 2]
3
[2, 2, 2, 2, 2, 2]
0
[2, 2, 2, 2, 2, 2]
vehicle is detected : 1
4
[2, 2, 2, 2, 2, 2]
5
[2, 2, 2, 2, 2, 2]
1
[2, 2, 2, 2, 2]
2
[2, 2, 2, 2, 2]
Is this enough?
untold cliff
Yeah thanks
@clever summit can you add a line to print the centroid list just below the print vehicle line
Because you're deleting elements from your lists while oterating over it which is bad. You're changing the length of the list as you're still going through it
clever summit
untold cliff
<@1052823565193453568> can you add a line to print the centroid list just below ...
untold cliff
clever summit
https://paste.pythondiscord.com/ugakavacif
Why are you removing the centers from the list?
 obtuse lotus
hai guys
i facing an error for my homework
import discord
import os
import random
import json
from dotenv import load_dotenv

# Load environment variables from .env file
load_dotenv()

# Load Discord bot token from environment variable
TOKEN = os.getenv('!')

# Load intents and responses from egg.json file
with open('egg.json', 'r') as f:
    intents_json = json.load(f)

# Create Discord client instance
intents = discord.Intents.default()
intents.members = True
client = discord.Client(intents=intents)

# Event that triggers when the bot is ready
@client.event
async def on_ready():
    print(f'{client.user} has connected to Discord!')

# Event that triggers when a message is sent in a channel the bot can see
@client.event
async def on_message(message):
    # Ignore messages sent by the bot itself
    if message.author == client.user:
        return

    # Find the best matching intent for the user message
    best_intent = None
    best_score = -1
    message_tokens = set(word.lower() for word in message.content.split())
    for intent in intents_json['intents']:
        for pattern in intent['patterns']:
            pattern_tokens = set(word.lower() for word in pattern.split())
            score = len(message_tokens.intersection(pattern_tokens))
            if score > best_score:
                best_intent = intent
                best_score = score

    # Send a response based on the best matching intent
    if best_intent is not None and best_score > 0:
        response = random.choice(best_intent['response'])
        await message.channel.send(response)
    else:
        await message.channel.send("Sorry, I don't understand.")

# Run the Discord client with the loaded bot token
client.run('Token')
{
    "intents": [
        {
            "tag": "greeting",
            "patterns": [
                "hello",
                "hi",
                "hey"
            ],
            "response": [
                "Hello!",
                "Hi there!",
                "Hey!"
            ]
        },
        {
            "tag": "goodbye",
            "patterns": [
                "bye",
                "goodbye",
                "see you"
            ],
            "response": [
                "Goodbye!",
                "See you later!",
                "Bye!"
            ]
        },
        {
            "tag": "thanks",
            "patterns": [
                "thanks",
                "thank you"
            ],
            "response": [
                "You're welcome!",
                "No problem!",
                "Glad I could help!"
            ]
        }
    ]
  }
i keep getting sry i dont understand
what should i do to solve this
clever summit
untold cliff
Why are you removing the centers from the list?
That is- actually, idek how it rlly works, i just copied the code from somewhere else and then modified it. If it works, leave it be.
untold cliff
clever summit
That is- actually, idek how it rlly works, i just copied the code from somewhere...
But you do understand that changing the length of a list while iterating over it is wrong right? Besides even though your removing the current center it doesnt seem to be happening, did you notice that?
 strong sedge
https://twitter.com/DivGarg9/status/1624525825067610112?t=OMLyXmzpSQOHFIGuUJzMZg&s=19
Can someone just point out/give me a direction to implementing something like this (high level, concepts I would need to know etc, ps not asking for code, I can understand it's irritating)


Still feel mind-blown that MULTI·ON can find anyone on Linkedin 🔍 & even use tools like Sales Navigator all Zero-Shot !!
Will soon be adding custom messaging too 💬.
Can be a game-changer for sales & recruiting 😃
Sign up and reach out: https://t.co/Zmrhej5dWa
#MULTION #AI
 Twitter
·
clever summit
untold cliff
But you do understand that changing the length of a list while iterating over it...
Twitter
·
clever summit
untold cliff
But you do understand that changing the length of a list while iterating over it...
Yes?
quaint loom
untold cliff
What does your dataframe look like? These seem to be years and not temperatures
 sleek dock
what is the most common cause of this error - Expect data.index as DatetimeIndex
untold cliff
quaint loom
https://paste.pythondiscord.com/nomubijeze
Is countries = data.columns? Because it seems like you think that year is the index but its actually the 1st column. If you read the data from a csv file, you add index_col = 0 inside read_csv
quaint loom
untold cliff
Is countries = data.columns? Because it seems like you think that year is the in...
update the path and file name
data = pd.read_csv('C:\Users\Secret\OneDrive\Dokumenter\WE2023\Module_3\Submodel_4_Global_change\Exercises\Exercise_1\Ex_1_data_version_2.csv index_col = 0') like this?
untold cliff
quaint loom
# update the path and file name
data = pd.read_csv('C:\\Users\\Secret\\OneDrive\...
Yeah
Check if your data.columns is correct now
untold cliff
quaint loom
# update the path and file name
data = pd.read_csv('C:\\Users\\Secret\\OneDrive\...
update the path and file name
data = pd.read_csv('C:\Users\Secret\OneDrive\Dokumenter\WE2023\Module_3\Submodel_4_Global_change\Exercises\Exercise_1\Ex_1_data_version_2.csv', index_col = 0). Like this. Index_col is a function parameter, it shouldnt be included in the path
quaint loom
untold cliff
# update the path and file name
data = pd.read_csv('C:\\Users\\Secret\\OneDrive\...
Now it run smoothly. xiexie
untold cliff
quaint loom
Now it run smoothly. xiexie
But you're still getting wrong results no?
quaint loom
untold cliff
But you're still getting wrong results no?
No, it seems like it understood the change now ^^
untold cliff
quaint loom
No, it seems like it understood the change now ^^
Weird. Try printing data_period inside the loop, cause what you're doing in this line is actually selecting columns not rows: data_period = data[(data.index >= period[0]) & (data.index <= period[1])][country]
quaint loom
untold cliff
Weird. Try printing data_period inside the loop, cause what you're doing in this...
It worked. : )
 raw compass
how is that possible to get an output back like this, after multinomial
- corresponding tensor -> tensor([0.2180, 0.3008, 0.4812])
- after multinomial -> tensor([1, 2, 1])
quaint loom
raw compass
how is that possible to get an output back like this, after multinomial
- corres...
When you apply the multinomial function to this tensor, it randomly selects one of the outcomes based on their probabilities and returns the index of that outcome. In this case, the function returned a tensor containing the indices of the randomly selected outcomes
late monolith
untold cliff
What it is that you want to do exactly? Replace the equation for sheet[i, j] wit...
yeah if possible
raw compass
quaint loom
When you apply the multinomial function to this tensor, it randomly selects one ...
so like if the index is 2 -> [0.4812]?
so actually it selected the [0.3008(twice), and 0.4812]?
quaint loom
raw compass
so actually it selected the [0.3008(twice), and 0.4812]?
Yes, that's correct! The output tensor you provided shows the probabilities of three possible outcomes. In this case, the multinomial function randomly selected one outcome based on their probabilities.
clever summit
untold cliff
But you do understand that changing the length of a list while iterating over it...
Ok, what should i do then?
raw compass
quaint loom
Yes, that's correct! The output tensor you provided shows the probabilities of t...
so based on this knowledge:
  p = N[ix].float()
  p = p / p.sum()
  ix = torch.multinomial(p, 1, generator=g).item()
if p is a multi dimensional tensor, the ix is gonna return an index number(of the row) based on the probabilities(one number)?
untold cliff
clever summit
Ok, what should i do then?
Sorry i dont really know. Try removing centroid.remove((x,y)) and see what happens.
quaint loom
raw compass
so based on this knowledge:
```
p = N[ix].float()
p = p / p.sum()
ix = tor...
If 'p' is a multidimensional tensor, then 'torch.multinomial(p, 1)' will return a tensor of shape '(p.shape[0], 1)', where each element is an index of the randomly selected outcome for the corresponding row in 'p'.
If you then call '.item()' on this tensor, you'll get a single index number corresponding to the randomly selected outcome for the first row in 'p'. So, in your example code, 'ix' will be an index number of the randomly selected outcome for the first row of 'N'.
 cunning agate
hello guys i want to ask if there is anyone who is intrested in hackathons and competitions in ai and data science
to make a team maybe and go kick some
raw compass
quaint loom
If 'p' is a multidimensional tensor, then 'torch.multinomial(p, 1)' will return ...
thank you
clever summit
untold cliff
Sorry i dont really know. Try removing centroid.remove((x,y)) and see what happe...
Uh oh. It gets messed up
Wtf how can there be 30 cars on the counter when the line only detects 2?
quaint loom
clever summit
Uh oh. It gets messed up
Would you provide the codes? I can try to have a look. Or describe the issue again
clever summit
clever summit
Hello! I need help.
So this is the code: https://paste.pythondiscord.com/recuci...
@quaint loom
quaint loom
clever summit
<@950847230422712420>
Give me some more time and I can show you some improvement that I think could work
clever summit
quaint loom
Give me some more time and I can show you some improvement that I think could wo...
Ok, thank you for the commitment
 upbeat stone
Is there a library called "word_with_nlp" in python. Found this in a script from kaggle:
#################################################################################################################################
#               Is the registered domain created with random characters (Sahingoz2019)
#################################################################################################################################

from word_with_nlp import nlp_class

def random_domain(domain):
        nlp_manager = nlp_class()
        return nlp_manager.check_word_random(domain)
To track the movement of the detected vehicles, you could use a tracking algorithm such as the Kalman filter or the Centroid tracker. The tracking algorithm will predict the position of the vehicle in the next frame, and associate the predicted position with the detected bounding box in the current frame. You could also then calculate the speed of the vehicle by measuring the distance traveled between frames.
clever summit
I'm sorry, but
---------------------------------------------------------------------------
AttributeError                            Traceback (most recent call last)
~\AppData\Local\Temp\ipykernel_5200\3009782155.py in <module>
     19
     20 # Initialize tracker
---> 21 tracker = cv2.MultiTracker_create()
     22
     23 # Loop over frames

AttributeError: module 'cv2' has no attribute 'MultiTracker_create'
it seems like your OpenCV version might be older than
untold cliff
late monolith
```python
for i in range(totalxSteps):
tsheet[i, :] = OU_time_r...
Maybe this? ```py
sheet = x0 * np.exp(-xgammax) * xStep * np.exp(-xgammax) * np.cumsum(tsheet * np.exp(xgamma*x), axis=0)
Damn
late monolith
untold cliff
Maybe this? ```py
sheet = x0 * np.exp(-xgamma*x) * xStep * np.exp(-xgamma*x) * n...
you're my hero
clever summit
quaint loom
https://paste.pythondiscord.com/cahogibino
Same error, i guess i must update my opencv
quaint loom
clever summit
Damn
You can check the OpenCV version installed by:
import cv2
print(cv2.version)
untold cliff
late monolith
you're my hero
I'm not sure if it works. Probably not to be honest. Try it out.
late monolith
it works
I cannot describe how happy I am
I only have to generate a single tsheet now
the speedup is insane
oh my god man you saved my ass lmao
quaint loom
@untold cliff is such a nerd 😁
clever summit
Requirement already satisfied: opencv-python in c:\users\user\anaconda3\lib\site-packages (4.6.0.66) Requirement already satisfied: numpy>=1.19.3 in c:\users\user\anaconda3\lib\site-packages (from opencv-python) (1.21.5) Note: you may need to restart the kernel to use updated packages.
untold cliff
late monolith
I cannot describe how happy I am
Well i'm happy too 😁
clever summit
clever summit
``Requirement already satisfied: opencv-python in c:\users\user\anaconda3\lib\si...
But the error still occurs @quaint loom
late monolith
naughty constrictor, i was wondering for quite a while, but if I have some array of (x, y), can I fill it for each index x, from 0 to y with a certain process without a for loop?
its not a real issue, but I was wondering if it was possible
quaint loom
clever summit
But the error still occurs <@950847230422712420>
Try:
pip install opencv-python --upgrade
quaint loom
clever summit
But the error still occurs <@950847230422712420>
I use OpenCV version 3.3, so it might not be available in earlier versions of OpenCV.
clever summit
Upgraded to 4.7
untold cliff
late monolith
naughty constrictor, i was wondering for quite a while, but if I have some array...
The array shape is (x, y)? And you want to fill it with what? It would be better if you gave me an example
quaint loom
clever summit
Upgraded to 4.7
After upgrading, make sure to restart the kernel to use the updated packages.
late monolith
then I have some process that creates a 1d array with length Y
I was wondering if I could then fill the X by Y array with those processes without a for loop
untold cliff
late monolith
I was wondering if I could then fill the X by Y array with those processes witho...
Is it a single 1d array of length Y or a different one for each row X?
late monolith
different one yeah sorry
clever summit
quaint loom
After upgrading, make sure to restart the kernel to use the updated packages.
I- I don't get it! I did every instruction you gave, and still, same error!
What am i doing wrong here?
untold cliff
late monolith
different one yeah sorry
Like this? ```py
import numpy as np
x = np.zeros((3, 3))
y = np.arange(1, 4)
z = np.arange(1, 4)
x = y ** z[:, None]
I have a 3*3 array or zeros and i'm filling each row with [1,2,3] raised to the power 1 for the 1st row, 2 for 2nd row ...Bro, i appreciate your help, but the same code won't fix the problem
late monolith
untold cliff
Like this? ```py
import numpy as np
x = np.zeros((3, 3))
y = np.arange(1, 4)
z...
somewhat like that but I generate those arrays seperately
quaint loom
clever summit
Bro, i appreciate your help, but the same code won't fix the problem
😂
Sorry, I send you the wrong paste page.
clever summit
Damn, i wish i could just leave this for tomorrow, but...
untold cliff
late monolith
somewhat like that but I generate those arrays seperately
Oh you mean there's no relation between those arrays? If they're completely unrelated then i'm afraid you have to use a for loop but it would be better if you could give me a short example with some numbers just to be sure.
 quaint loom
OpenCV 4.7, you should be able to use cv2.MultiTracker_create() instead of cv2.MultiTracker() to create the multi-object tracker 😵💫
late monolith
untold cliff
Oh you mean there's no relation between those arrays? If they're completely unre...
yeah they're completely unrelated, thanks
quaint loom
clever summit
https://tenor.com/view/sheldon-cooper-bbt-sleep-i-dont-need-sleep-gif-5115394
I am sorry buddy.
@clever summit
You could try uninstalling OpenCV and reinstalling it using the following command:
!pip uninstall opencv-python-headless -y
!pip install opencv-python-headless==4.5.3.56
I just talked to my friend and she said version 4.5.3.56 is known to work with the MultiTracker API.
 stone glacier
hey, all anybody recently switched from pandas to polars?
want to ask if adding polars to the kit is worth the while
clever summit
Well, multitracker package is nowhere to be found.
 quaint loom
You can install it via pip by:
pip install opencv-contrib-python
Once installed, you can try importing the 'cv2' module and initializing the 'MultiTracker' object again
@clever summit
clever summit
Still nothing.
You did your best. Thank you very much. Unfortunately, i have to sleep now. Well i'll just leave this for tomorrow.
@quaint loom
 sterile wyvern
@boreal gale Does a Bayesian spacial clustering exist?
 boreal gale
never heard of it personally. and please don't ping random people unless they already have engaged in a conversation with you recently 🙂
 next valley
There may be a library out there does has that algorithm as a function, or make it urself
sterile wyvern
boreal gale
never heard of it personally. and please don't ping random people unless they al...
"dont random people" ?
boreal gale
whoops, ping random people* 🙂
sterile wyvern
boreal gale
whoops, ping random people* 🙂
You think you are "random" to me?
 serene scaffold
sterile wyvern
You think you are "random" to me?
serene scaffold
sterile wyvern
You think you are "random" to me?
the point is that you shouldn't be pinging people to summon them to your question. if they decide to engage with your question, then you can ping them to let them know when you've responded to something that they've said.
sterile wyvern
serene scaffold
the point is that you shouldn't be pinging people to summon them to your questio...
We spoke on Bayesian optimisation before. Less than 2 weeks ago.
serene scaffold
sterile wyvern
We spoke on Bayesian optimisation before. Less than 2 weeks ago.
that doesn't mean that you can try to summon them to your related question less than two weeks later. each question is a new conversation.
if they're in a position to answer questions, they'll keep an eye on this channel. otherwise, it's important to respect their personal time.
sterile wyvern
serene scaffold
that doesn't mean that you can try to summon them to your related question less ...
tbh the first time i commented in this channel i was pinged and it was @r y who did it.
So i thought it was normal to ping people you want to talk to.
serene scaffold
sterile wyvern
So i thought it was normal to ping people you want to talk to.
not if it's to ask someone to answer a question that other people could potentially answer.
sterile wyvern
Using Bayes is there a way to test for robustness similar to plotting insample and outsample data to get points to check for consistently positive correlations?
 analog kestrel
hi
analog kestrel
i want to learn what is data science... who can train me!
serene scaffold
analog kestrel
i want to learn what is data science... who can train me!
only you can train yourself.
"data science" has come to refer to scientific computing in general. but the thing that was originally called "data science" is basically just stats plus programming.
 nocturne eagle
who named it 'data science" anyway?
 stone marlin
Looks like the first "modern" definition would have been: In 1998, Hayashi Chikio argued for data science as a new, interdisciplinary concept, with three aspects: data design, collection, and analysis. (From wiki.)
Big Data on the other hand...
My previous two gigs had legit definitions for small, medium, and big data which I kind of liked. We had a notion of "mean memory/disk" for our systems and defined them as follows:
Small data can fit in memory on the system.
Medium data can't fit in memory, but can fit on disk.
Big data can't fit in memory or on disk.
Obv this was totally dependent on what we considered our "memory/disk" amount, and it fluctuated as we got better systems, but it was a kind of nice "ehhh maybe we should start using dask" kind of rule.
serene scaffold
stone marlin
My previous two gigs had legit definitions for `small, medium, and big` data whi...
just need 2TB RAM and then your small data is other peoples big data.
stone marlin
serene scaffold
just need 2TB RAM and then your small data is other peoples big data.
Ha, that's honestly something we would discuss! Like, "Okay, well... if it's big, we're gonna need spark, but how much would it cost to get more memory so we can efficiently do it with, like... Dask?"
It wasn't a perfect system, but it did get people talking about the cost of AWS stuff vs. how fast we needed things to train vs. how much effort we need to put in to make pipelines, which was a nice byproduct of the definitions.
 rustic trout
Hey there. I'm trying to deploy a model as a FastAPI, but I got this error when I try to import the model: ```python
xgboost = pickle.load(pickle_model)
AttributeError: Can't get attribute 'Imputer' on <module 'main' from '/home/gabriel/Documents/tecgeo_mol-main/app.py'>
How can I solve this?
 sharp crypt
For backpropogation, each output neuron wants change the activations of the previous layer such that the activation of itself increases. In order to do that, for each training example, the activations of the previous layer are changed relative to the weights in order to decrease the cost function. All these changes for all training examples are then averaged for each output neuron, and the averages of these changes are then applied to the weights of each layer to improve accuracy of the neural network. Since this takes a long time computationally, we use stochastic gradient descent, where training data is randomly split into mini-batches, and then you compute the gradient descent step(learning rate?) of each mini batch and apply it to the neural network to reach the local minimum of the cost function?
 flint shoal
noo
 grizzled barn
How "hard" is it to self teach artificial intelligence concepts? I don't really want to have to wait until college to start learning, however, it seems like something that would require a lot of structure to correctly learn about it
 wooden sail
it takes some time to cover all the topics, but you can start with calculus and linear algebra. then you can use those when you learn stats
 patent lynx
I want to use siamese network for my model
My data uses product title, image phash and images of the product, how do I exactly preprocess it ?.
 full furnace
 magic dune
hi
 manic tangle
not a python specific question ig but pythons my main language so. I want to start gaining some experience in AI as I plan to have some concentration or focus in it later as i’m graduating, but i’m not sure the best way to start learning if anyone has suggestions
magic dune
manic tangle
not a python specific question ig but pythons my main language so. I want to sta...
if you want to starts hands on use sckit learn but if you actually wanna learn the algorithims and understand them that's something else
which do u want to do
manic tangle
i mean i guess i want an actual foundational knowledge so closer to the 2nd one
i feel like it’s much easier to go from foundational knowledge to hands on rather than the other way around right?
magic dune
manic tangle
i feel like it’s much easier to go from foundational knowledge to hands on rathe...
Ya I agree
I am currently doing that
first of all can I recommend you 2 libs you will need to know and a book?
@manic tangle
 queen cradle
manic tangle
i mean i guess i want an actual foundational knowledge so closer to the 2nd one
queen cradle
manic tangle
i mean i guess i want an actual foundational knowledge so closer to the 2nd one
The foundational knowledge you need is calculus and linear algebra. With those you can understand probability and statistics, and if you know those, then you know the theoretical foundations of machine learning.
 lavish kraken
testing the new pandas version
 sleek harbor
question about kNN: it is recommended to have an odd number for k to avoid ties in classification, and k must not be a multiple of the number of classes, right? Do these rules apply when weights are set to 'distance' instead of 'uniform'?
mild dirge
nah not really
And the odd number of k is also mostly for when there are two classes to avoid ties
If you have 3 classes and k=3, you still get ties
And once you have more than 2 classes, it doen't matter what k is, you can always get ties. But if you use distance for weights (inverse distance I hope), then you will not really get ties.
@sleek harbor
sleek harbor
mild dirge
<@367038574937243649>
Thanks!
untold cliff
rustic trout
Hey there. I'm trying to deploy a model as a FastAPI, but I got this error when ...
Yeah you need to import all the stuff you need(all the stuff you imported when creating the model).
quaint loom
Can someone have a look at this?::
I am using the:
import pandas as pd
import matplotlib.pyplot as plt
import numpy as np
untold cliff
quaint loom
Can someone have a look at this?::
https://paste.pythondiscord.com/vodopetuta
Can you show me your df.head()
 bleak dew
One can select a subset of columns with df[list_of_columns]. Is there an easy way to easily select all columns except a specified list of columns?
serene scaffold
bleak dew
One can select a subset of columns with `df[list_of_columns]`. Is there an easy ...
it's a bit ugly, but there's df.loc[:, ~df.columns.isin(list_of_columns)]
bleak dew
Thank you
untold cliff
serene scaffold
it's a bit ugly, but there's `df.loc[:, ~df.columns.isin(list_of_columns)]`
@bleak dew df.drop might be more convenient
serene scaffold
yeah, I guess you could do df.drop(columns=list_of_columns)
(if you use columns=, you don't have to specify the index 😄 )
bleak dew
When merging, fields that is missing from the other is filled with np.nan. I've more than once done the mistake to assume that these missing fields are falsey, but they're not and I have to explicity test for it. Is there a particular reason why numpy chose np.nan not to be falsey?
(and yes, I do use fillna())
Second question: When doing outer merge with different left and right keys, two columns from each of the keys are produced. Is there a simple way to combine these two columns into one (where a value always exists)?
serene scaffold
bleak dew
When merging, fields that is missing from the other is filled with `np.nan`. I'v...
bool(float('nan')) is truthy in vanilla python.
and then all comparisons to nan are false. including to itself.
serene scaffold
bleak dew
Second question: When doing outer merge with different left and right keys, two ...
I think I'd need to see the two dataframes and the merge call to understand this.
quaint loom
untold cliff
Can you show me your df.head()
Give me a moment. I will try to adjust something
quaint loom
untold cliff
Can you show me your df.head()
quaint loom
quaint loom
https://paste.pythondiscord.com/citopavuxe
It`s kinda like it get confused with other excel files that I have uploaded
bleak dew
serene scaffold
I think I'd need to see the two dataframes and the merge call to understand this...
I can provide an example, but let me rephrase first: Given a column with some nan's. How can I fill those nans with with values from another column (from the same row)?
serene scaffold
bleak dew
I can provide an example, but let me rephrase first: Given a column with some na...
df['col_with_nans'].fillna(df['col_wo_nans'])
bleak dew
ah, fillna also takes column input. Perfect. Thanks.
That answers my merge question too 👌
untold cliff
quaint loom
It`s kinda like it get confused with other excel files that I have uploaded
Problem fixed?
quaint loom
untold cliff
Problem fixed?
No
untold cliff
What's the problem now?
untold cliff
quaint loom
https://paste.pythondiscord.com/citopavuxe same
The name of the first line wont show up? What do you mean by this?
quaint loom
It has been changed the first line from this:
but the calculation I have done previous is showing right when I refer to that file
untold cliff
quaint loom
It has been changed the first line from this:
https://paste.pythondiscord.com/y...
Sorry the dataframes still seem to be moxed up for me. I think its better if you show what you expected (or wanted) to have as output
bleak dew
How can I select the entries that contains an empty list? df[df["a"] == []] doesn't work
untold cliff
bleak dew
How can I select the entries that contains an empty list? `df[df["a"] == []]` do...

Stack Overflow
I have a dataframe that looks like this:
parte_passiva name
0 [] Charles
1 [
quaint loom
untold cliff
Sorry the dataframes still seem to be moxed up for me. I think its better if you...
 lapis sequoia
bleak dew
How can I select the entries that contains an empty list? `df[df["a"] == []]` do...
lapis sequoia
bleak dew
How can I select the entries that contains an empty list? `df[df["a"] == []]` do...
Hey mate. One way is
df[df['a'].astype(str)=='[]']
 rancid sorrel
hey guys how do your multipe pre learned models in parrllel?
serene scaffold
rancid sorrel
hey guys how do your multipe pre learned models in parrllel?
not sure I follow. you're wanting to fine-tune two pre-trained models at the same time?
rancid sorrel
i am doing ddos identification via netflow collectors
due ot the nature of the traffic, i am seperating out the dataset by cateogry, then running the training model against. after having the models trained
i need advice on how best to have say 100 of those models running in parrell on a live steam of traffic (no learning at this point) to trigger alerts
serene scaffold
why do you need 100 instances of the model at once?
rancid sorrel
ever seen netflow traffic?
its a hose of everything that comes out of a computer, your cateogires are largly defined by standards for you so its best to throw that traffic in bins else traffic X has no relation to traffic Y
https://pastebin.com/52QWzaad looks like this
Pastebin
Pastebin.com is the number one paste tool since 2002. Pastebin is a website where you can store text online for a set period of time.
untold cliff
quaint loom
https://paste.pythondiscord.com/rujaraforu
Its a key error, so its the wrong data frame probably. Are you sure the maze dataframe has a column named 'Yield (...)'? You havent used the national_data path so far, maybe thats the one?
quaint loom
untold cliff
Its a key error, so its the wrong data frame probably. Are you sure the maze dat...
Yes, I am positive. the National_data is for later use
This is the datahttps://paste.pythondiscord.com/izotiterix
rancid sorrel
yeah ive run into that problem myself having type object really throws a rench in sklearn
so your data has some format it dosnt like, so usally fix this at import
missing_values = ["NA","N/a",np.nan,"?"]
l1 = pd.read_csv("../../DataSets/Breast cancer dataset/breast-cancer-wisconsin.data",header=None,na_values=missing_values, names=['id','clump_thickness','uniformity_of_cell_size','uniformity_of_cell_shape','marginal_adhesion','single_epithelial_cell_size','bare_nuclei','bland_chromatin','normal_nucleoli','mitoses','diagnosis'])

##convert the bare_nuclei colmn to a number and drop the rows
#l1['bare_nuclei'] = pd.to_numeric(l1['bare_nuclei'],errors='coerce')

#check data is clean
l1.isnull().sum()
l1.head()

print(l1.dtypes)```

as an example l1 is the line you have a look atyou might need to mess around with header and changing =some other calls like `lineterminator='//' and delim_whitespace
untold cliff
quaint loom
Yes, I am positive. the National_data is for later use
This is the datahttps://p...
Maize_data? Cause when you did maize_data.head() you got completely different columns and values?
quaint loom
Could it be that the excel file itself have this color?
 rancid sorrel
Change it to CSV to be sure
Make your life easier
If it works as CSV you can always try import xls after
quaint loom
rancid sorrel
If it works as CSV you can always try import xls after
Life and small adjustment. How wonderful.
rancid sorrel
did it work?
quaint loom
Well, my ignorance and blindness had overseen that the excel file that I used for maize had several sheets 😵💫
rancid sorrel
yeah that would do it you have to specify what sheet you want 😦
untold cliff
quaint loom
Well, my ignorance and blindness had overseen that the excel file that I used fo...
Shit happens!
rancid sorrel
is this at enterpirse lvl or just training data?
quaint loom
I am sorry guys for making you both confused for my ignorance.
quaint loom
rancid sorrel
is this at enterpirse lvl or just training data?
Training data.
untold cliff
quaint loom
I am sorry guys for making you both confused for my ignorance.
It happens to the best of us. Its good though, you would qtart paying attention to these kind of stuff from now on
rancid sorrel
cool cause i was gonna say at scale o365 is actually super good about giving you a daily dump to pandas via power automate(part of o365 enterpise)
you run this in reverse basicaly
https://plumsail.com/docs/documents/v1.x/flow/how-tos/documents/convert-csv-to-excel-in-power-automate-flow.html
Automatically convert CSV files to Excel using Power Automate (Microsoft Flow), Azure Logic Apps, and PowerApps
quaint loom
rancid sorrel
cool cause i was gonna say at scale o365 is actually super good about giving you...
Thank you for the information about o365 and Power Automate. The data I am working with is provided by my professor and is not at the enterprise level.
rancid sorrel
no problem but when you get into the work place know its there for your Data mining# needs
quaint loom
rancid sorrel
no problem but when you get into the work place know its there for your Data min...
I will definitely keep that in mind for future projects in the workplace. I still have a long way to go tho. I am just a 1st year master student :
rancid sorrel
its also included in your edu licences
 quaint loom
rancid sorrel
er du dansk?
quaint loom
rancid sorrel
er du dansk?
Jeg er norsk. Studerer på en dansk og kinesisk universitet.
rancid sorrel
i am legit thinking seriosuly about taking a masters at arhus or dtu this/next year
my GF is danish
any tips?
quaint loom
DM me instead
rancid sorrel
ah ok
 rugged comet
I have a pandas dataframe column with dict-like data. The column is mainboard. I need to create a new column where the data is whether a key is present in the mainboard dict. I've tried
df["new_column"] = "key" in df["mainboard"]
among other things but they don't have the right values in the new column. The new column should look like False, True, False but it shows False, False, False instead. Any suggestions how to do this?
 rugged comet
I also tried creating a mask
mask = "key" in df["mainboard"]
type(mask)
bool
but it output a bool instead of a boolean series like I expected.
Is it possible to create a mask for a dict column like this?
untold cliff
@rugged comet ```py
mask = df['mainboard'].apply(lambda row: key in row)
Thanks!
untold cliff
No, she wants to check if a key is in a dictionary (the rows contain dictionaries)
 prisma mountain
I just started learning about supervised and unsupervised machine learning in my class but I'm honestly so lost. If i have some questions, is anyone here open to DM's?
 thorn swift
just ask them here
mild dirge
What are you confused about? @prisma mountain
prisma mountain
I'm not too sure how to specify the question but for instance with this
" Demo 1: Recognizing hand-written digits in images
Importing the libraries
Importing the MNIST dataset
Training the k-nearest neighbors model on the dataset with k=1
Assessing the prediction performance using the test data "
I'm not really understanding what my purpose is or what I'm trying to actually do with the dataset
thorn swift
so the MNIST dataset is a bunch of pictures of handwritten letters, usually a picture and a label of what the letter is.
the k-nearest neighbors model is a model that is used for categorization or labeling things.
your trying to train k-nearest neighbors on MNIST
prisma mountain
Hmm, what does training actually entail?
thorn swift
https://scikit-learn.org/stable/modules/neighbors.html#classification < this is a pretty good guide, but essentially, you turn the picture into a vector in a space, then learn where the group bounds are in that space
scikit-learn
sklearn.neighbors provides functionality for unsupervised and supervised neighbors-based learning methods. Unsupervised nearest neighbors is the foundation of many other learning methods, notably m...
prisma mountain
oh ok thank you!
Would it explain the components of smth liek this?

Because when i look at that code, i totally get lost and don't even know where to start lol...
untold cliff
prisma mountain
Because when i look at that code, i totally get lost and don't even know where t...
Do you know what cross validation is?
rugged comet
I'm trying to calculate the percentage of the occurrences of one column relative to the total occurrences of another column.
Here's an example
col1,col2
foo,1
foo,0
bar,0
bar,0
...
Create a column 3 that shows the percentage of col1 values that contain a 1 in col2
The resulting df should look like
foo,1,0.5
foo,0,0.5
bar,0,0
bar,0,0
Notice how col3 represents the percentage of col1 values that have a 1 in col2If you need more details or you need me to explain it in a different way, let me know.
I've tried doing
df["col3"] = df["col2"] / df["col1"].value_counts()
but that just places all NaNs in col3.
thorn swift
rugged comet
I'm trying to calculate the percentage of the occurrences of one column relative...
whats the forward slash for?
rugged comet
thorn swift
whats the forward slash for?
Division
thorn swift
rugged comet
Division
nevermind discord messed up
value counts should return a smaller list
than col2
rugged comet
thorn swift
value counts should return a smaller list
I don't know how else to count the occurrences of unique values in col1.
prisma mountain
untold cliff
Do you know what cross validation is?
Thats the method that we're currently being taught. THe problem is that it has not been explained at all :c
tldr i have no clue how it works nor how to code it
serene scaffold
rugged comet
I'm trying to calculate the percentage of the occurrences of one column relative...
!remind 2h try to answer
 arctic wedgeBOT
I got you.
Your reminder will arrive on <t:1681086024:F>!
ID: 5830
thorn swift
prisma mountain
Would it explain the components of smth liek this?
this is basically trying to find the best k (a parameter of the model) for k-means clustering to use, it does it by training it 10 times on different k's.
k fold is just a way to split the data for training and testing: https://scikit-learn.org/stable/modules/cross_validation.html#k-fold and is an unrelated k to the rest of the code
(classifier = )is spawning the fresh classifier every k
(classifier.fit) is training the classifier
errors is a calculation of how the model is doing
the code ends by saying what the lowest error was and the k that had it
scikit-learn
Learning the parameters of a prediction function and testing it on the same data is a methodological mistake: a model that would just repeat the labels of the samples that it has just seen would ha...
prisma mountain
Hmmm alright, I'll take a look at that guide!
Additionally, my upcoming project requires us to explore datasets and answer a research question that we come up with. I'm using the following dataset:

I'm scared of putting myself into a hole with the question by asking something too complicated, any suggestions?
thorn swift
prisma mountain
I'm scared of putting myself into a hole with the question by asking something t...
dont try a superhard or seemingly breakthrough question then spend the semester trying to answer it.
Start with some exploration, visualizations and a small question, one you can answer quick, then using that answer, see what new questions come up.
prisma mountain
thorn swift
dont try a superhard or seemingly breakthrough question then spend the semester ...
right yea, we have about a week to do it
we were thinking of trying to answer the question of "what would be the best region to recommend to someone trying to take their driver's test"
smth like that
untold cliff
rugged comet
I'm trying to calculate the percentage of the occurrences of one column relative...
Is this what you're looking for? ```py
import pandas as pd
import numpy as np
df = pd.DataFrame(np.array([[0,1], [2,3], [0,1], [0,0]]), columns=["a", "b"])
group = df.groupby("a")
counts = group.apply(lambda row: row["b"] == 1)
percentages = counts.unstack().sum(axis=1) / group.count()["b"]
df["c"] = percentages[df["a"]].reset_index(drop=True)
print(df)
Did it in a different way, but I'm not really experienced with pandas at all
!e
import pandas as pd

data = {'col1': ['foo', 'foo', 'bar', 'bar', 'hello'], 'col2': [0, 1, 0, 0, 1]}
df = pd.DataFrame(data)

# Get the proportions of 1's and only take the names and the proportion column
x = df.groupby(['col1'], as_index=False).value_counts(normalize=True)
x = x[x['col2'] == 1][['col1', 'proportion']]

# Set the index to the names column so we can join dataframes on index
df = df.set_index('col1')
x = x.set_index('col1')

# Join dataframes, reset the index (they were set to the names) and fill NAs with 0.
df = df.join(x)
df = df.reset_index()
df = df.fillna(0)

print(df)
@mild dirge :white_check_mark: Your 3.11 eval job has completed with return code 0.
001 |     col1  col2  proportion
002 | 0    bar     0         0.0
003 | 1    bar     0         0.0
004 | 2    foo     0         0.5
005 | 3    foo     1         0.5
006 | 4  hello     1         1.0
It does however not use apply, which might make it a bit more time efficient (not sure)
@rugged comet
Chatgpt seems to have figured it out as well (and a lot shorter, but slower as well I think..)
!e
import pandas as pd

data = {'col1': ['foo', 'foo', 'bar', 'bar', 'hello'], 'col2': [0, 1, 0, 0, 1]}
df = pd.DataFrame(data)

df['proportion'] = df.groupby('col1')['col2'].transform(lambda x: x.mean())

print(df)
@mild dirge :white_check_mark: Your 3.11 eval job has completed with return code 0.
001 |     col1  col2  proportion
002 | 0    foo     0         0.5
003 | 1    foo     1         0.5
004 | 2    bar     0         0.0
005 | 3    bar     0         0.0
006 | 4  hello     1         1.0
Groupby is so powerful hh. But this solution seems to work only because we have 0s and 1s only no ?
mild dirge
Yep
It's pretty clever though, because I just asked for proportion, and it proposes to use the mean. But I think it calculates the mean every row, which would make it very slow.
Actually scrap that, I think it actually does not, because it happens after groupby.
untold cliff
Would be interesting to see what solution it would come up with if it werent 1s and 0s only
mild dirge
You can change the lambda in that case to lambda x: sum(x == 1) / len(x)
Which makes sense
rugged comet
Thank you guys.
prisma mountain
What would be the best way for me to receive help in this channel if I have a specific question that I want to answer for a given dataset?
Should I just ask the question, and hope someone can help me break down the steps to get there and provide some example code?
serene scaffold
prisma mountain
Should I just ask the question, and hope someone can help me break down the step...
Yes
prisma mountain
Oh wait i can upload files in here? does the file have to be a certain size?
serene scaffold
prisma mountain
Oh wait i can upload files in here? does the file have to be a certain size?
!paste
arctic wedgeBOT
Pasting large amounts of code
If your code is too long to fit in a codeblock in Discord, you can paste your code here:
https://paste.pythondiscord.com/
After pasting your code, save it by clicking the floppy disk icon in the top right, or by typing ctrl + S. After doing that, the URL should change. Copy the URL and post it here so others can see it.
arctic wedgeBOT
serene scaffold
!remind 2h try to answer
 It has arrived!
Here's your reminder: try to answer
[Jump back to when you created the reminder](#data-science-and-ml message)
serene scaffold
 hidden patrol
does any1 here do sound a.i
hidden patrol
does any1 here do sound a.i
most language-related AI deals with text; areas that involve audio are often concerned with transcribing audio so that it can then be processed as text, or rendering text as audio. that aside, why do you ask?
hidden patrol
serene scaffold
most language-related AI deals with text; areas that involve audio are often con...
because im intrested in word regocnition ... i was into text like 2 years ago and learned ...natural language processing ... and it was intresting forgot everything now .. but am intrested in audio alot now ..i want friends to talk to about audio
serene scaffold
hidden patrol
because im intrested in word regocnition ... i was into text like 2 years ago an...
you only want to recognize individual words, or you want to be able to transcribe whole streams of speech?
hidden patrol
serene scaffold
you only want to recognize individual words, or you want to be able to transcrib...
begin easy by sing e words ...so imguessing ..that you record a snippet and then sample ... that brief snipet and then ... based ona data set pre made you get a output word
single
serene scaffold
hidden patrol
begin easy by sing e words ...so imguessing ..that you record a snippet and then...
transcribing individual words would actually be more difficult, because you can't use context to distinguish between similar or identical-sounding words.
hidden patrol
yeah it is more difficult... natural language processing and text is easy in comparission you just look for key letter periods ... and uppercases ... but with audio you have to run fourier analyiss and libraries i dont know ..i know almost nothing about machine learnung but am oj with math so thats another problem
serene scaffold
hidden patrol
yeah it is more difficult... natural language processing and text is easy in com...
what does it mean to be "oj"?
clever summit
Hello! I need help.
So this is the code: https://paste.pythondiscord.com/recucineqa
This code was supposed to count vehicles drawn in bounding box with a centroid in it, using a line as the counter.
But when a centroid hits the counter line, the vehicle count scores 1 point and then returns to zero once the centroid leaves the counter line, which is the case i don't expect.
What's wrong with this code?
If you want the full code: https://paste.pythondiscord.com/ipofibuqer
violet gull
assuming everything is implemented correctly
would this structure of cnn be able to classify images?

lr = 0.001
60 images per class 2 classes
image size 60x60
grey scaled
i wanna make sure my model isnt the issue before i continue fixing implementations
cause ive already verified pretty much everything outputs the same as pytorch
 tacit basin
violet gull
i wanna make sure my model isnt the issue before i continue fixing implementatio...
tacit basin
violet gull
i wanna make sure my model isnt the issue before i continue fixing implementatio...
You can check some existing architecture say using fastsi tutorial to see if it works on your images. https://docs.fast.ai/tutorial.vision.html
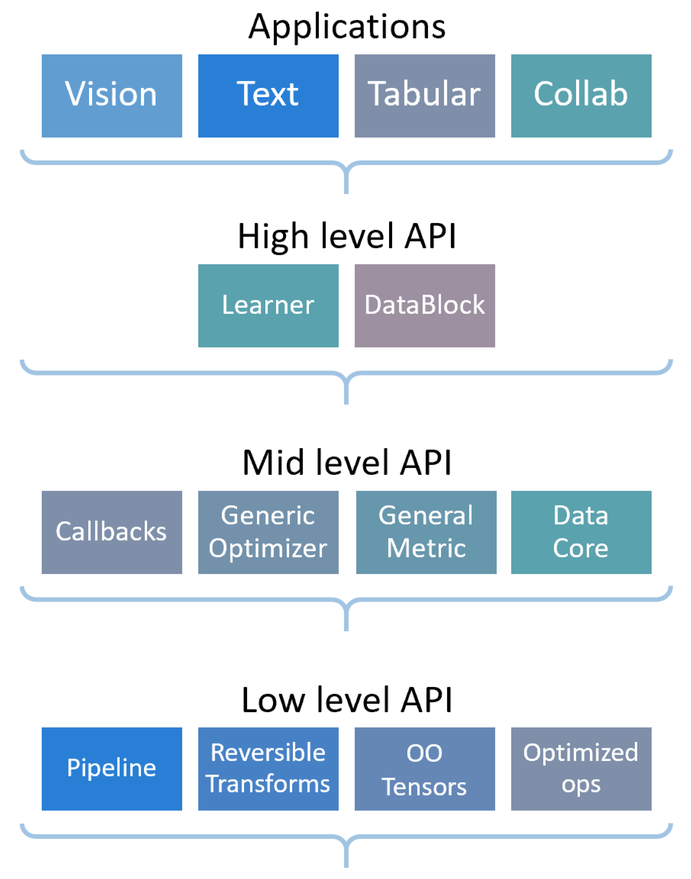
Using the fastai library in computer vision.
violet gull
i just need to know if the architecture should work if it was implemented in pytorch
 stuck latch
violet gull
i wanna make sure my model isnt the issue before i continue fixing implementatio...
stuck latch
violet gull
i wanna make sure my model isnt the issue before i continue fixing implementatio...
Have u tested this model before?
violet gull
stuck latch
Have u tested this model before?
wym
stuck latch
Have u run this model for image classification in a previous model
Something you worked on earlier?
violet gull
stuck latch
Something you worked on earlier?
no
but it looks to me like a pretty strong model
it is stronger then the lenet which did 10 classes
on even smaller images
stuck latch
Ok we gotta wait for a pro to check this
violet gull
this shows atleast some of the gradients are doing something right

still very bad on testing data
manic tangle
magic dune
first of all can I recommend you 2 libs you will need to know and a book?
sorry i know this is way back but yes please
 blazing garnet
Does anyone here uses pytorch ?
lapis sequoia
I do, but I suck at it
I'm trying to find a way to replace ITOS, beacuse it's not available in the newer version
 zenith kraken
hello can anyone here help me with pandas
 thin lodge
zenith kraken
hello can anyone here help me with pandas
thin lodge
zenith kraken
hello can anyone here help me with pandas
check on yt , i learnt from there
zenith kraken
thin lodge
check on yt , i learnt from there
i dont have time checking youtube tutorials
its an emergency
cant we save xls file in using pandas
?
wooden sail
there's the dataframe.to_excel() method https://pandas.pydata.org/docs/reference/api/pandas.DataFrame.to_excel.html#pandas-dataframe-to-excel
though you can also export as CSV, which can also be read from excel
 low musk
wooden sail
there's the dataframe.to_excel() method https://pandas.pydata.org/docs/reference...
low musk
wooden sail
there's the dataframe.to_excel() method https://pandas.pydata.org/docs/reference...
spotify?
🤔
why
low musk
wooden sail
oh lmao sorry
can you help me with numpy later this day?
 cold osprey
zenith kraken
i dont have time checking youtube tutorials
cold osprey
zenith kraken
i dont have time checking youtube tutorials
Lmao
zenith kraken
wooden sail
there's the dataframe.to_excel() method https://pandas.pydata.org/docs/reference...
dosenot support xls
only xlsx
wooden sail
i would suggest to use csv instead, then
wooden sail
how come?
wooden sail
which again has you use to_excel, but you can pass an excelwriter object pointing to an xls
that makes me think you can just call the file "filename.xls" with to_excel() and it'll work
wooden sail
zenith kraken
nope dossenot work for xls
wdym it doesn't work? what error do you get?
sleek harbor
Are there any reasons to ever use accuracy over balanced accuracy for assessing a model, considering that balanced accuracy is equal to accuracy for balanced datasets?
zenith kraken
wooden sail
wdym it doesn't work? what error do you get?
i get ValueError: No engine for filetype: 'xls'
    async def delete_out_of_stock(self, filtered_data, stocks_data):
        for _, row in self.df[8:].iterrows():
            skin_info = self.row_get_values(row, filtered_data, stocks_data)
            if skin_info == "ANY SKIN":
                continue
            if not skin_info:
                print(row)
                print(
                    "skin not in stock",
                    row["Unnamed: 4"],
                    row["Unnamed: 1"],
                    row["Unnamed: 3"],
                )
                row["Unnamed: 15"] = "Deleted"
                print(row)
                break
        writer = pd.ExcelWriter("something.xls")
        self.df.to_excel(writer, sheet_name="Sheet1")

it does work, but it warns you that it will stop working in the near future
it wrote this

csv is compatible with xls though
 wary mortar
Hello! I'm having some huge overfit problems and i dont understand why! 😦
I'm trying to make a model for daily time series data from 2017-01-01 to 2019-12-31
I have a sum of 3 predictors :
One for trend (always linear regressor just because i'm planning to use XGBoost and it's a classification algorithm)
One for seasonality using fourrier coefs
One for cycles using lag that i determine by autocorrelation analysis
Right now if i use 3 linear regressions i get bad RMSE for both training & testing data but at least similar values
but if i try to use a better model than linear train improves but not test
mild dirge
Don't trust chatgpt...
 untold cliff
mild dirge
Don't trust chatgpt...
untold cliff
mild dirge
Don't trust chatgpt...
Why? I think chatgpt is correct
mild dirge
Yeah but it said the exact same thing when I just gave the same sentence twice.
untold cliff
mild dirge
Yeah but it said the exact same thing when I just gave the same sentence twice.
Yeah i was joking actually
queen cradle
wary mortar
I'm trying to make a model for daily time series data from 2017-01-01 to 2019-12...
This is an unusual model. Do the pieces work one-at-a-time? That is, if you try to fit the trend part to artificial data which has only a trend and nothing else (maybe a little noise), does the linear regression work, and are the coefficients on the other two parts of the model zero (to within some small error)? Similarly, if you try giving your algorithm something that has only seasonal periodicity, etc., does it work?
Also, are you trying to fit the three predictors one-at-a-time? I would guess that that won't work (except under unusual circumstances); I think you need to fit all three of them at once.
wary mortar
queen cradle
This is an unusual model. Do the pieces work one-at-a-time? That is, if you try ...
it does seem to work prety well
why should i fit all 3 at once?
1 sec i have some visualisation of my models one by one actually if u interested if each work individually
 whole cloud
Hi Guys, does anyone have an experience with Databricks? I am stuck on an SQL statement and I have why Databricks is having issues with my Aliases.
 drifting summit
how do u start and get good at ai/ml?
wary mortar
queen cradle
This is an unusual model. Do the pieces work one-at-a-time? That is, if you try ...
This is my trend fitting linearly

result of seasonality fit model (after regularisation so the results are not as good as they used to)


and finaly result of Cycle fitting model on partial autocorrelation :


but right now the error is huge because i tuned it
before tuning it would just overfit like crazy but which is also proof that the models do what they are asked to do
cold osprey
whole cloud
Hi Guys, does anyone have an experience with Databricks? I am stuck on an SQL st...
Try '2019'
Basically make it a string
 cold osprey
Maybe []
queen cradle
wary mortar
why should i fit all 3 at once?
Because parts of the data that one model sees as noise will be fit by the other models. For example, the seasonal parts can't fit trends. As far as they're concerned, the trend looks like error. They want to minimize their error, so they're going to try to compensate for the trend. But that's not what those parts of the model are supposed to do, so the result is going to be worse than if the trend is removed. One option is to fit one model, subtract it from the data, fit the next part, etc., until you have a complete model. Then pick one model that you want to re-fit, subtract the other models, and fit. Repeat this many times until everything seems to have converged. Another option (which requires more upfront work but should require less computation time) is to just fit everything at once using a big optimization.
The easiest solution to overfitting is to decrease the number of parameters. You could try fewer Fourier coefficients or a shorter lag.
wooden sail
from this last point, notice that your fit looks like it has a jagged high frequency component. that definitely indicates you fit a high frequency component to the noise
queen cradle
It looks like you might have a ton of Fourier coefficients, actually? That might be your problem.
wooden sail
you can discard frequency components above the "fundamental frequency", the largest spike. but as kyle points out, you should subtract the trend first
alternating between a set of estimators that add up to the prediction is commonly known as expectation maximization when the estimators are independent, btw. but yeah, you're taking too many frequency bins
wary mortar
wooden sail
from this last point, notice that your fit looks like it has a jagged high frequ...
yea weekly component
wary mortar
queen cradle
It looks like you might have a ton of Fourier coefficients, actually? That might...
i dont
1 sec sending a pic of the seasonal features
queen cradle
wary mortar
yea weekly component
It looks to me like anything shorter than the weekly component should be considered noise.
wooden sail
maybe even the weekly
you can use something like akaike to do a model order estimation. it enforces a tradeoff between model complexity and prediction error
 queen cradle
The weekly frequency component is strong, and a lot of things have weekly components, so I wouldn't be surprised if it's real. But I don't believe in the peak at the semiweekly component.
Okay, I have to go. Good luck!
wary mortar
ok ty anyway have a nice day
boreal gale
whole cloud
have you tried wrapping 2019 in double quotes or backticks?
if i have to guess, it's probably double quotes that works.
single quote is mostly for making a string literal in databases, double quotes are for column reference (particularly useful if the column begins with a number), and on line 1 and also the last line, the query parser is expecting a column reference, not a string literal
and backticks was just a shot in the dark tbh, but bigquery does use it in its SQL variant.
violet gull
 whole cloud
boreal gale
have you tried wrapping 2019 in double quotes or backticks?
if i have to guess, ...
whole cloud
boreal gale
have you tried wrapping 2019 in double quotes or backticks?
if i have to guess, ...
Tried, both " " and backticks and neither worked, I just gave up and used the strings 'year_2019' and 'year_2020' which seem to fix the issue. My issue is now that the query keeps running endlessly never giving me results
boreal gale
whole cloud
Tried, both " " and backticks and neither worked, I just gave up and used the s...
okay that's good. must be some databrick/spark quirk then.
and what are you trying to determine?
your current query has a cartesian join, which is a little odd. as they are almost never used without a good reason.
whole cloud
boreal gale
okay that's good. must be some databrick/spark quirk then.
and what are you try...
I'm basically trying to get the frequency for both years 2019 and 2020.

I need to replicate this:
 cold osprey
Join on type ig
boreal gale
does it have to be with sql?
whole cloud
Yes, I need to do one example in SQL, one Example in RDD and one example in using DataFrames
boreal gale
do you know what is a common table expression (CTE) or subquery?
whole cloud
I do not, are they similar to functions or stored procedures in SQL?
boreal gale
not really, they are rather different concepts.
so thus far you have managed to replicate the 2019 column which is great.
with a small change to the FROM clause you can obtain the 2020 column as well.
the question now becomes "how do i join the result i have from 2019 to the 2020 one, such that i can show the full table as required?"
here is where CTE/subquery comes in, in a nutshell they are both ways to make a temporary result set that you can reference within other statment e.g. SELECT, INSERT, UPDATE, or DELETE
whole cloud
Ahhh okay, that is very interesting, just having a read of this and seems like something that would help - https://chartio.com/resources/tutorials/using-common-table-expressions/
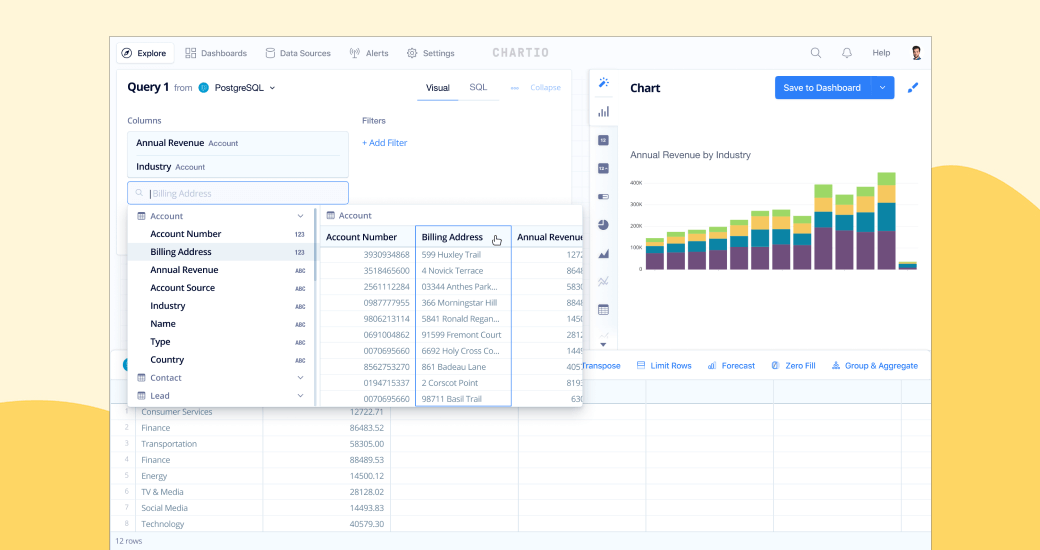
Chartio
A Common Table Expression (CTE) is the result set of a query which exists temporarily and for use only within a larger query. Learn use cases for CTEs and ho…
boreal gale
whole cloud
Ahhh okay, that is very interesting, just having a read of this and seems like s...
the article seems to provide some decent examples 👍
 true palm
Hey guys, does anyone know whats a .features file for?
Opened one using notepad and it looks like this

Basically these files came along the kvasir dataset but I am not really sure whats the use of these files
wary mortar
queen cradle
Because parts of the data that one model sees as noise will be fit by the other ...
ty for this btw i'll definitely give it a try
mild dirge
 dapper gate
Does pytorch work on amd gpus?
dapper gate
Does pytorch work on amd gpus?

PyTorch Forums
I usually run my models on Nvidia GPU and I had no problem with torch detecting it. Now I have this GPU: lspci | grep VGA 75eb:00:00.0 VGA compatible controller: Advanced Micro Devices, Inc. [AMD/ATI] Vega 10 [Radeon Instinct MI25 MxGPU] and I’m trying to understand how to make it visible for torch? import torch torch.cuda.is_available() Fal...
quaint loom
Can someone have a look at this?
https://paste.pythondiscord.com/iseciqaxos
I have been trying several ways but I cannot catch the column that I want.
untold cliff
quaint loom
Can someone have a look at this?
https://paste.pythondiscord.com/iseciqaxos
I ...
You get the error before or after set_index
quaint loom
untold cliff
You get the error before or after set_index
After
untold cliff
quaint loom
After
Never mind, its before. If you look at line 36 you'll see that the error happens when you try to convert to datetime. Do a df.head before you convert to datetime
 tall tulip
I have plot this LinePlot using seaborn, but didn't understand what does It mean by the light blue color I've search about it but didn't find anything about it. can anyone tell me about that what does it mean?
 whole cloud
tall tulip
I have plot this LinePlot using seaborn, but didn't understand what does It mean...
whole cloud
tall tulip
I have plot this LinePlot using seaborn, but didn't understand what does It mean...
Is this not your standard deviation / confidence interval?
 tidal bough
that's how seaborn plots show the confidence interval, yeah.
although tbh I don't know enough statistics to know what the CI means for relationships as opposed to distributions
wooden sail
tall tulip
I have plot this LinePlot using seaborn, but didn't understand what does It mean...
do you have several samples of air temperature per thermal comfort value?
wooden sail
tidal bough
although tbh I don't know enough statistics to know what the CI means for relati...
pretty much the same, except there's a probability distribution for every point on the graph. or if you prefer, there's a probability distribution whose mean is a function f(x). so for an input value x, the mean becomes f(x). the variance in general is also a function of x
tall tulip
wooden sail
do you have several samples of air temperature per thermal comfort value?
by samples means group? I have just plot the temperature column and thermal comfort I don't have any group of temperatures.
wooden sail
tall tulip
by samples means group? I have just plot the temperature column and thermal comf...
can you show a few entries of the data? just to make sure. but as the others pointed out, it's something like a confidence interval, or possibly the standard deviation, depending on how you plotted it
tall tulip
wooden sail
can you show a few entries of the data? just to make sure. but as the others poi...
sns.lineplot(temp_age_df[(temp_age_df['Thermal preference'] == 'no change') & (temp_age_df['age_group'] == '6-20')], x='Thermal comfort', y='Air temperature (C)')
here is my code
that's the sample
 tall tulip
wooden sail
can you show a few entries of the data? just to make sure. but as the others poi...
tall tulip
wooden sail
can you show a few entries of the data? just to make sure. but as the others poi...
This light blue color show the confidence interval, but now I'm searching about what's confidence interval
wooden sail
so, the idea is that you have a lot of data with random variations. the dark blue line is an average value, but this average value is itself a random variable, so if you were to measure new data, that value would change
the confidence interval gives you a range where you expect the true mean is located, given the data you observed
some books call this "standard error"
tidal bough
wooden sail
pretty much the same, except there's a probability distribution for every point ...
yeah, but like... how the hell can one estimate a probability distribution at every point of a curve while knowing only some points on the curve?
wooden sail
tidal bough
yeah, but like... how the hell can one estimate a probability distribution at ev...
you can't, it interpolates in between 😛 if the curve is smooth enough and you sample at the nyquist rate, you can exactly recover it via sinc interpolation. that's regarding the gaps on the x axis. regarding the CI and standard deviation, these scale as sqrt(N), where N is the number of samples for one value of x. you really need a bunch. otherwise the standard error tells you exactly what you expect: the interval is huge and your estimate is useless
tidal bough
fair enough, from a bit of googling I think another answer to that is "CI is a pretty shitty measure of the distribution in general"
wooden sail
tall tulip
This light blue color show the confidence interval, but now I'm searching about ...
the seaborn docs confirm it, it's the 95% CI. it tells you that with high probability, we think the mean is somewhere in that light blue region
 wooden sail
tidal bough
fair enough, from a bit of googling I think another answer to that is "CI is a p...
wooden sail
tidal bough
fair enough, from a bit of googling I think another answer to that is "CI is a p...
it's actually pretty good, i would say. but it doesn't tell the whole story if you don't know the true underlying distribution of the data unless you enter the central limit theorem regime. people use it and similar metrics as "goodness of an estimator"
quartz thicket
I'm still looking for a way to define the slope at the endpoint(s) of a curve even using curve-fit. I considered adding an extra point with nextafter() and plotting it with the slope I want. But that seems imprecise. Gotta be a better way to do it.
violet gull

 somber panther
Just picked up a ds ml course, figured i'd pop down here to say hello
serene scaffold
violet gull
is 60 images per 2 classes sufficient
You can't just direct all your questions to Edd.
Depends on the model, the task, and properties of those 120 images. Try it and see.
violet gull
i lub Edd
serene scaffold
violet gull
model
I will not read screenshots of text.
How do you know that the model has failed?
serene scaffold
What are these images that your test data contains only nine images?
violet gull
what
serene scaffold
You only have nine images in your test set, right?
violet gull
yes
queen cradle
Unless the problem is equivalent to something extremely simple (like "lightness detector"), you don't have enough data.
violet gull
how is 60 images per class not enough when there is only 2 classes
serene scaffold
Only for exceptionally simple problems.
violet gull
dog or cat seems pretty simple
queen cradle
It's not.
serene scaffold
For humans 
queen cradle
Trust me, I've looked at dozens if not hundreds of scribbles of dogs and cats by my kids! It's hard to know if it's a dog, a cat, a unicorn, or even a human!
queen cradle
Yes. Think about how you distinguish the two: Shape of the muzzle, of the ears, the presence of whiskers, and so on. These are complicated to describe.
violet gull
convolution layers are suppose to do that
serene scaffold
Also, my friend's dog thinks that cats are puppies
He tries to give them kisses. And then the cats get scared.
queen cradle
With 60 images, you can only pick up on the grossest, most obvious features. So you can train a lightness detector, or a "line art vs. photograph" detector, or other easy things. But dogs and cats are both furry four-legged mammals. They're not actually easy to distinguish.
violet gull
im trying it with bigger data set rn
 iron basalt
violet gull
dog or cat seems pretty simple
iron basalt
violet gull
dog or cat seems pretty simple
Humans make many things look easy, like grabbing objects.
violet gull
humans are also a giant neural network
iron basalt
And walking upright.
serene scaffold
There are a lot of humans who I wonder how they don't die, tbh
A past roommate of mine--I'm pretty sure three days without adult supervision would have been fatal.
queen cradle
When my first kid learned to roll from her back to her stomach, she did it at every opportunity. I was holding her down on the changing table, trying to change her diaper while stopping her from rolling off, when I suddenly realized: Of course she's not scared of falling off! She hasn't learned about gravity!
violet gull
what else can i do with my cnn?
serene scaffold
queen cradle
When my first kid learned to roll from her back to her stomach, she did it at ev...
I broke my skull twice as a kid. She'll be fine.
violet gull
am i able to see the convolution filters that it is applying so i can see a doggy nose?
serene scaffold
violet gull
what else can i do with my cnn?
Throw some more training data into it
See if you can get hundreds per class.
iron basalt
violet gull
am i able to see the convolution filters that it is applying so i can see a dogg...

With some visualizers.
This is pretty neat visualization in a shader.
violet gull
i have access to the filters
if i turn them into an image will it look like a doggy nose
serene scaffold
violet gull
i have 4000 dog images and 1.5 thousand elefante images
Sure, do dog vs elephant
Personally I want elephant to win.
violet gull
how are kernals useful to nn if they are only a few pixels wide
if i saw a doggo nose at 11x11 pixels i wouldnt know its a doggo nose
violet gull
serene scaffold
Sure, do dog vs elephant
how many batches
serene scaffold
violet gull
how many batches
The number of training instances divided by the batch size
violet gull
how big of batches
serene scaffold
It depends on how many you want to take into account between each step
violet gull
serene scaffold
It depends on how many you want to take into account between each step
how many do I want to take into account between each step?
iron basalt
violet gull
how many do I want to take into account between each step?
Try a couple.
Neat thing about computers is that you can just run it and see.
serene scaffold
violet gull
how many do I want to take into account between each step?
When it comes to hyperparameters, you can't always know what's going to work best
iron basalt
violet gull
but its better than blind guessing numbers
In ML we are in the business of guessing.
serene scaffold
I give you permission to blindly guess numbers.
serene scaffold
I do. I'm starting with 7.
iron basalt
Binary search it, pick a high and a low number to start.
violet gull
im doing 20 batches of 60
violet gull
it is taking much longer to train both time/epoch and loss delta
serene scaffold
violet gull
it is taking much longer to train both time/epoch and loss delta
as compared to when?
serene scaffold
aren't you doing larger batches?
and when you say loss delta, you mean that the loss is decreasing more slowly than it was before?
violet gull
yes
serene scaffold
you could try increasing the learning rate, I guess. but model training usually isn't fast.
serene scaffold
If there are two classes that are equally probable, then 50% is the worst possible score
And 0% would be the same as perfect. You'd just flip the results.
violet gull
serene scaffold
If there are two classes that are equally probable, then 50% is the worst possib...
no 50% is the average score
sharp crypt
This may be a dumb question, but what would the math look like using a sequential neural network with dense layers on a dataset with only continuous variables for binary classification
Like the Wisconsin Breast Cancer Dataset… what would the activations of the neurons look like?
serene scaffold
sharp crypt
This may be a dumb question, but what would the math look like using a sequentia...
the dataset doesn't determine what the activations of the neurons looks like. the network architecture does.
a feed-forward neural network would involve matrix multiplication and partial derivatives.
violet gull
is there any reason why the equation kernal weights = sqrt(2/(kernalsize * kernalsize * inputChannels)) with a mean of 0 would frick of my neural net so much that the loss sits at 0.631 almost continuously
according to this paper the equation is suppose to work
dapper gate
whats the best setup for machine learning?
i know cause cuda NVIDIA is the go to, but i dont have one of those cards
but ingeneral any resources on parallelism for machine learning would be nice
if my computer isnt good enough my school has cluster with nvidia gpu's i think, but i have no idea how to do remote jupter notebooks
dapper gate
after researching for 20 minutes i cant figure out how to use the rocm version of pytorch either
any tips to make this take rocm devices would be amazing
device = torch.device("cuda" if torch.cuda.is_available() else "cpu")
model.to(device)
hi ,
im learning ai , I just dont understand , how adding deep layer and increasing the number of nodes (*without actually telling each node what to do *) , helps ??
 versed gulch
after splitting the dataset into training and validation, does it make sense to apply data augmentation to the validation dataset or only to the training dataset?
versed gulch
mild dirge
Validation should be representative of real world data
ok as well as test data?
mild dirge
Yes, same reason
versed gulch
ok thanks
 brittle idol
When building a pre-game win probability model, does it make sense to only input one team into the model itself and then subtracts the win% difference from 1 to return the other team’s WP?
When I include two observations for each game (one row for each team playing), XGBoost doesn’t understand that each separate game should have WP% that add up to 1. It might return a 30% chance for one team to lose and a 55% chance for the other team to lose (85%) in a binary-outcome sport (win or loss).
For ref., each team has off + def stats AND their opponents off. + def. stats as predictors.
So would just inputting one team and subtracting the WP difference from 1 make sense?
mild dirge
Maybe you should use a model that takes both teams as input, and returns then win chance of both teams. And make sure the loss function of the final layer makes it sum up to 1?
If your model for 1 team was perfect, then obviously you could just subtract the probability from 1, but as you said, it seems to give wrong results.
Could as a quick and dirty solution maybe use the model on both teams, and then normalize the outputs to sum up to 1
Also, I assume the win percentage is based on stats of both teams, so the first suggestion is probably best.
fiery jungle
fiery jungle
hi ,
im learning ai , I just dont understand , how adding deep layer and increa...
i thought everyone knows this , no body knows how it works ?
brittle idol
mild dirge
Maybe you should use a model that takes both teams as input, and returns then wi...
Yeah, I think this is the best way to go. Would it make the most sense to set it up like in terms of response column? Maybe I could keep it to a binary response? And then subtracting WP% from 1 would give the loss percentage for a given team?
team1_win | team2_win
0 | 1
Or would a multi-class prediction still be the ideal route here? Like team1_win, team1_loss, team2_win, team2_loss. Trying to think what would keep this model the simplest.
mild dirge
Didn't think that through, you indeed only have win or loss as output, you don't have the true percentage. I'm not sure how to handle that.
 hasty mountain
fiery jungle
hi ,
im learning ai , I just dont understand , how adding deep layer and increa...
hasty mountain
fiery jungle
hi ,
im learning ai , I just dont understand , how adding deep layer and increa...
If I'm not mistaken, the idea is basically that more layers mean that the model will be able to capture more details about your model.
Think like this: if you have just 1 linear layer, your model will be basically:
input x layer1 = output. So, if your inputs are 1, 2 and 5, and your targets are 0.5, 0.75 and 1.2, your model will have some issues trying to reach a value for its weights that can better suit your outputs
(1 x 0.5 = 0.5, but 2 x 0.375 = 0.75 and yet 5 x 0.24 = 1.2)
When you add more layers, you're allowing your model to have something like "corretion factors", in a nutshell
But just be mindful that more layers = better performance is not always true. Sometimes you also need to use wider layers(Inception), or alternative operations(Transformer)
But I admit that I prefer adding more layers...wider layers are too tough to deal with
 cinder garden
Helloo
I want to learn machine learning
where should i start and what are the best recourses ?
serene scaffold
cinder garden
I want to learn machine learning
where should i start and what are the best reco...
you need to understand at the very least some basic linear algebra and derivative calculus. are those topics with which you are familiar?
serene scaffold
cinder garden
where can I learn those?
3blue1brown on youtube
serene scaffold
cinder garden
after those, what should i do next?
try manipulating some data sets from kaggle with pandas, to learn about what data is in the context of data science and AI.
cinder garden
tnx
 sharp crypt
serene scaffold
the dataset doesn't determine what the activations of the neurons looks like. th...
sharp crypt
serene scaffold
the dataset doesn't determine what the activations of the neurons looks like. th...
I meant like if a dataset had multiple quantitative features, how would each record flow through a network? Would each feature get its own neuron? And how would you then determine weights and biases? If anyone could explain in detail that would be great
sharp crypt
sharp crypt
I meant like if a dataset had multiple quantitative features, how would each rec...
Specifically with dense layers in a sequential network
fiery jungle
thanks for the explanation but you didn't ask the layer or its nodes to behave in a certain way to result in the output we expected
does it just do something like output/input = layer1 then it figures that what it needs to do? is this is how it trains itself?
if input = 1 and the output is supposed to be 5 then layer1 = 0.24
and it keeps on doing that for different values 10,000 times to form some complex equation?
if yes then how about pics? how it defines things that arent floats?
and how about nodes? what do they do?? I know the more (sometimes only!) the better but why ? what do they really do ?
how does it recognize the face of a human being or a dog ?
rustic trout
I am trying to create a FastAPI for a model, but it says that "can't get Imputer attribute". python model = pickle.load(pickle_model) AttributeError: Can't get attribute 'Imputer' on <module '__mp_main__' from '/home/gabriel/.local/share/virtualenvs/tecgeo_mol-main-giAwIOdK/bin/uvicorn'> This is the error message: python model = pickle.load(pickle_model) AttributeError: Can't get attribute 'Imputer' on <module '__mp_main__' from '/home/gabriel/.local/share/virtualenvs/tecgeo_mol-main-giAwIOdK/bin/uvicorn'> It only happens when I use the commandpython uvicorn main:app --reload I imported this Imputer class in the python script, but does not work. It only works when I run the script with ```python
python main.py
Can someone help me?
tidal bough
fiery jungle
thanks for the explanation but you didn't ask the layer or its nodes to behave i...
You're asking how neural networks are trained. The answer is, naively, gradient descent - you calculate the derivative of the loss function (which specifies how bad the output is, usually by comparing the NN's predictions on the training dataset to the supposedly correct answers on it) with respect to every single weight of the system*, and then slightly modify each weight in the direction of reducing the loss, and do it again and again until the algorithm converges. Hence the name, "gradient descent" - you descend down the highest-gradient direction until you hit a local minimum.
Less naively, there are different existing optimizers, with the fanciest ones being e.g. ADAM. They are all modified versions of gradient descent to moderate its many issues, most notably its tendency to get stuck in local minima.
- It turns out it's more efficient not to do so directly, but via, essentially, applying chain rule to first calculate the derivatives for the last layer, and then calculate the ones of the second-to-last layer, and so on - that's called "backpropagation".
fiery jungle
tidal bough
You're asking how neural networks are trained. The answer is, naively, gradient ...
that helped a lot , thank you so much!!
 cloud marsh
is it possible to use an AMD gpu for compute on linux via docker if the GPU is being used for graphics?
i'm running rocm/tensorflow image. my rocminfo output in the container shows two devices: 5950x (no integrated GPU....) and 6700xt ... but nothing shows with tf.config.list_physical_devices('GPU')
when i run rocminfo and clinfo it shows up. when I run the tf_cnn_benchmarks, the device also isn't used.
i'm getting a warning about This TF binary is optimized with oneAPI DNN to use CPU instructions: SSE3, AVX, etc but so far, i've only run into issues with that if trying to compute with the wrong types (i guess on the GPU)
serene scaffold
 junior sun
if data science isn't the science of data
junior sun
if data science isn't the science of data
it's statistics and programming.
statistics already is the science of data. a new discipline wasn't created when someone decided to start calling it "data science" when you use code to do it.
 thorny canyon
Guys anybody know how make MCC metric in PySpark?
serene scaffold
thorny canyon
Guys anybody know how make MCC metric in PySpark?
always ask your actual, complete question. don't hold on to details until you get a commitment--you won't get one if you do that.
cloud marsh
does pandas have cursors?
joking, but seriously, pandas has group by, does it have something like having? also, how is the data sorted?
can you post the query?
clever summit
Hello! I need help.
So this is the code: https://paste.pythondiscord.com/uxopuneman
This code is designed to detect specific moving objects, especially vehicles, draw bounding box and centroid within them, and finally count their centroids using a counter line.
So far the code works well, but i have encountered a minor problem within the code.
Whenever a centroid is within the counter line, it will continuously add into the vehicle count in an endless iteration, until there's literally no centroid in the counter line. This, which is the case i never expected.
I expect the counter line to stop iterating the addition of vehicle count after it detects a new centroid once.
If you want the full code: https://paste.pythondiscord.com/xeqitomado
sharp crypt
can someone please help me
cold osprey
Hi, I have a table of RentIndex by Quarter. I would like to break this down into months using interpolation. Can interpolation provide values for end/start values? The issue i have now is that interpolation is not giving me the Nov and Dec values
df_rent_index = (
    df_rent_index.set_index("date").resample("M", convention="end").interpolate("linear")
)
df_rent_index = df_rent_index.reset_index()
date column is of format e.g. 2022-Q4
obtuse lotus
why i keep having this error guys
ImportError: cannot import name 'json_normalize' from 'pandas.io.json
thorn swift
obtuse lotus
ImportError: cannot import name 'json_normalize' from 'pandas.io.json
what was the code?
thorn swift
sharp crypt
can someone please help me
just ask the question
does anybody know any good tensorflow servers? im having trouble with batches
clever summit
So this is the code: https://paste.pythondiscord.com/uxopuneman
This code is designed to detect specific moving objects, especially vehicles, draw bounding box and centroid within them, and finally count their centroids using a counter line.
So far the code works well, but i have encountered a minor problem within the code.
Whenever a centroid is within the counter line, it will continuously add into the vehicle count in an endless iteration, until there's literally no centroid in the counter line. This, which is the case i never expected.
I expect the counter line to stop iterating the addition of vehicle count after it detects a new centroid once.
If you want the full code: https://paste.pythondiscord.com/xeqitomado
Video: (look at 'mobil:')
thorn swift
clever summit
Hello! I need help.
So this is the code: https://paste.pythondiscord.com/uxopun...
centroid tracking seems promising - https://pyimagesearch.com/2018/07/23/simple-object-tracking-with-opencv/
You will learn how to perform simple object tracking using OpenCV, Python, and the centroid tracking algorithm used to track objects in real-time.
thorn swift
junior sun
what is it
graphs
clever summit
thorn swift
centroid tracking seems promising - https://pyimagesearch.com/2018/07/23/simple-...
I know, i'm using his code as well
 wraith escarp
If I want to find the z-score or IQR on a dataset for detecting an outlier, it is necessary to normalize the data first?
I think IQR might be fine but it seems like z-score works best on standard normal distribution.
And I don't think I should normalize my data because it is a natural scale 
 dense oar
does anyone have any good beginner book recommendations for someone who wants to learn about how python can be used in AI?
 ivory fractal
Can anyone help with a way to write a parquet file with custom file name ex: 'myFile.parquet' instead of 'part-xxxx-xx.parquet' in Pyspark. I know how to rename the existing 'part-' file, but want to know a way to change name while writing
untold cliff
wraith escarp
I think IQR might be fine but it seems like z-score works best on standard norma...
Z-score is calculated by subtracting the mean and dividing by the standard deviation, which is normalization, so ...
 steady bronze
clever summit
So this is the code: https://paste.pythondiscord.com/uxopuneman
This code is des...
steady bronze
clever summit
So this is the code: https://paste.pythondiscord.com/uxopuneman
This code is des...
Cool project but why is it lagging so much
I also came across this problem when I was doing real time object detection
clever summit
steady bronze
Cool project but why is it lagging so much
yolov3-320 was too much for my laptop to handle
sleek harbor
How common are regression trees, and are they actually ever used in practice?
 forest pollen
hey was just wondering as i am trying to implement cosine similarity between 2 images. i was just wondering if i changed the images to 1-D array and they were of different length, but had to be same length for 1-cosine(image1,image2) to work, would adding additional values of 0 so the lenght was the same change the similarity outcome??
for reference this was my code, i know it's not good but i'm just trying to create a basic cosine similarity function:
from scipy.spatial.distance import cosine
import numpy as np
from PIL import Image

def computemeasure(image1,image2):
    value = 1 - cosine(image1,image2)
    return value

def flatten_list(image):
    flattened_list = np.array(image).flatten().tolist()
    return flattened_list

def padding_out(image1,image2):
    len_img1 = len(image1)
    len_img2 = len(image2)
    if len_img1 > len_img2:
        image2 += [0] * (len_img1-len_img2)
    else:
        image1 += [0] * (len_img2-len_img1)
    return image1, image2


image1 = Image.open("sample1.jpg")
image2 = Image.open("sample2.jpg")
image1 = flatten_list(image1)
image2 = flatten_list(image2)
image1,image2 = padding_out(image1,image2)
print(computemeasure(image1,image2)) ```.... wait it wouldn't because its using the dot product across all the values. I think thats right??
mild dirge
cosine similairty to compare images isn't great to begin with, but padding would definitely make it worse.
At least with cosine similarity you compare the images pixelwise, but because one is smaller than the other, you are just comparing "some pixel" with "some pixel" of the other image.
tidal bough
you can't do cosine similarity on arrays of different sizes. perhaps resize the images to be of the same size - it's not a very good solution, but there's no good one.
mild dirge
Use an embedding, or extract some features yourself
Like average hue, brightness etc.
Or use a convolution with some hand-made kernel, and take the average after convolution
forest pollen
my lecturer doesn't mind if its not effecient as long as it gets the job done. but yeah we had to essentially choose 3 types of similarity measures, jaccard, cosine and MSE are the ones i essentially chose.
oh wait i also realised what u just meant
mild dirge
It's not about the distance measure, it's about what you compare
tidal bough
All three of these measures require equal sizes, though, so you'll have this problem either way.
mild dirge
If you want to compare the raw images, resize them like reptile said, but it will give bad results probably.
forest pollen
tidal bough
All three of these measures require equal sizes, though, so you'll have this pro...
yeah was gonna pad them out, as well. but now that pcCamel brought that up i see
mild dirge

Like these two for example, 100% different pixel-wise
But they are very similar to us
forest pollen
yeah i see. I only need to use three similarity measures to build an image classifier using the K-nn approach whcih i think would fix the problem no?
mild dirge
knn would not solve this problem, as these images would have a maximum distance from each other
So knn will treat them as very different
wooden sail
you could do knn, with a different distance metric
mild dirge
But if that is your assignment, maybe you should just resize, and flatten, and check the outcome with the given distance measures
forest pollen
alright i'll try that. I appreciate the clarification!
 viscid oar
i'm not new to python but new to data science - i'm part of a small customer-facing team with dismally poor data analysis on our customers. i've made plenty of panda scripts for us internally as well as for customers to help them with understanding their own data. i'm hoping to take this learning to the next level - i've completed some of FCC's data science courses but am looking for a course/channel/tutorials or anything that focuses on python & data science specifically for customer data or business analysis. comparing ARR and usage, etc. every time I google different combinations I just get a TON of ads for vendors we're not going to use...
 agile cobalt
maybe consider looking for BI courses, not python/data science resources
 coral kindle
Do you think building a dashboard with JS might be more flexible than using dashboarding libraries like plotly/dash? I'd like for the frontend to be responsive in case of changes so maybe using async in JS might be faster? Idk.
The second issue is the time elapsed between the moment where the user makes a short request (ie. deleting a column from the view) and the moment they see it. I need to take account of the authenticating issue as well and I only know JWT as a means of authentication.
queen cradle
wraith escarp
And I don't think I should normalize my data because it is a natural scale <:gru...
Z-scores require normalizing the data first. They usually don't tell you anything interesting unless your data is approximately normally distributed. IQR requires not normalizing the data first. It makes no assumptions on the distribution of the data.
Neither of these can detect outliers on their own. Being able to classify something as an outlier depends on understanding the data set. For example, suppose I give you some data which I generated to be normal with zero mean and unit variance. It's well-known that about 95% of the data will be within two standard deviations of the mean, i.e., will be between -2 and 2. Which means that if I give you 100 data points, you expect about five of them to be more than two standard deviations away from the mean. Some people would call those five data points outliers. Usually people want to detect outliers so that they can discard them. But those five data points are from the same population as the rest of the data, and you shouldn't discard real data from members of your population.
It's fine to discard outliers that arise from data corruption (e.g., if someone typed "10.1" when they meant to type "1.01"). Some people, however, discard extreme population values because of their effect on statistics like the mean and variance. However, it's better to switch to robust statistics such as the median and IQR.
obtuse lotus
with open('intents.json', 'r') as f:
  intents = json.load(f)
FileNotFoundError: [Errno 2] No such file or directory: 'intents.json'
anyone know that why i cant read my json file?
it keep filenotfound
mild dirge
Because it can't find the file? @obtuse lotus 😛
Did you put it in the working directory?
 mild dirge
Print the current working directory in the code, and check if it is what you expect
print(os.gcwd())
and import os ofc
Is it what you thought it was?
mild dirge
obtuse lotus
I also do not see intents.json in there
 viscid oar
agile cobalt
maybe consider looking for BI courses, not python/data science resources
viscid oar
agile cobalt
maybe consider looking for BI courses, not python/data science resources
I guess that's true. Then applying what's in those courses to the tools I'm using. I guess since I'm new to it, I'm almost hoping to follow along with a BI analyst working in python and what they do with new datasets, what they look for, etc. There is one video from that guy Rob Mulla which was helpful. Thanks for your response.
 stone pine
Anyone interested in participating in a challenge for synthetic data generation?
It’s a US Government initiative and we’re putting together a workgroup to apply as a team.
DM me if interested (this is not a job offer)
 ocean kestrel
Question, so I been playing a little, by using ChatGPT as a mentor, and I managed to create a basic NER, without the extraction of the entity part, but I just now want to realize the extraction part, but I'm not sure how I would I this is an example of the training data I hava collected so far:
{
        "text": "Open Spotify",
        "labels": [
            {"entity": "app", "start": 5, "end": 12},
        ]
    }
My question here is, does one only model should be also able to predict the "start" and "end", or should I use another model to predict them?
violet gull
convolution layer weight = random.nextGaussian(sqrt(2/(kernalSize x kernalSize x numInputChannels)
Why is that equation wrong for me but it works for them
mild dirge
Wrong?
violet gull
Wat
mild dirge
It is "wrong" for you
mild dirge
Is it for initializing the weights?
violet gull
Yes
mild dirge
What did you do before?
violet gull
It’s supposedly what PyTorch uses
violet gull
mild dirge
What did you do before?
Just random.nextGaussian()
mild dirge
Yeah makes sense, divide it by the number of weights of a kernel
violet gull
Wait no
I used random numbers -1:1
But when I tried that method from the paper
The loss started at 1.8, went down to 0.731 in 2 iterations then just wouldn’t go down any more
mild dirge
Maybe just unlucky starting point?
violet gull
Mmm no
lapis sequoia
Is anyone here? I have a dataset that contains some information about surgeries performed monthly. Which method should I use to predict amount of surgeries for 8 months in the future?
mild dirge
violet gull
It’s supposedly what PyTorch uses
Pytorch samples uniformly between -sqrt(k):sqrt(k) where k is the number of weights (in_channel * height * width)
lapis sequoia
Please help me I am desperate
violet gull
mild dirge
Pytorch samples uniformly between -sqrt(k):sqrt(k) where `k` is the number of we...
Wouldn’t it be output channels * kernalsize * kernalSize
mild dirge
The kernel depth* is determined by the depth of the input
The number of kernels is determined by nr of output channels
violet gull
How do I make a uniform distribution
mild dirge
np.random.uniform(start, stop, shape) I think
violet gull
How do I do it without numpy
mild dirge
With for loop??
 violet gull
mild dirge
Pytorch samples uniformly between -sqrt(k):sqrt(k) where `k` is the number of we...
violet gull
mild dirge
Pytorch samples uniformly between -sqrt(k):sqrt(k) where `k` is the number of we...
Using this, is there a reason the loss starts at 7 which is really high every time and then goes down to 0.7 on the next epoch
 boreal pebble
cool
 tidal garnet
Hey so guys I have to make a project of emotion, gender and age detector android app. My friend will be handling all the android part.
About the DL part, I was thinking about making an API to take the image captured by app and then it would process it and send the info to the app which would display it. And if possible store it too? (please suggest best method to do so- I only know Relational Databases as of prev. exp.)
What framework should be better if I dont have much exp- flask or FastAPI?
Also, it would be better if the app could display emotions in real time What techstack would you recommend using?
I have like 2 weeks to make it. Unless any technology suggested is too complicated, I will manage it.
DeepLearning part is sorted. Just need to make it practical.
stone marlin
tidal garnet
Hey so guys I have to make a project of emotion, gender and age detector android...
There's a lot here, so I'll note how I would do specifically the API part. For real-time stuff and anything else, this can probably be done as a "nice to have" once you have a basic app.
-
I'd pick FastAPI and check out both the tutorial so you know what's happening (https://fastapi.tiangolo.com/tutorial/) as well as the File Upload portion (https://fastapi.tiangolo.com/tutorial/request-files/).
-
Once you do this, I would recommend you have a way to test uploading a picture (possibly following something like https://stackoverflow.com/a/73264904).
I would save image storage, real-time stuff, and whatever other "fancy" stuff for after the basic API is complete. Once you get the API working, consider where it will be hosted (locally? digital ocean or something? aws?) and consider if you want to containerize the app (eg, with docker like this https://fastapi.tiangolo.com/deployment/docker/ ?).
violet gull
what determines how long it takes something to train?
obviously amount of data, batch size, learning rate, parameter initialization etc
but is there a way to estimate or baseline
i need to see if my results are reasonable?
Average time per epoch: 2110 ms```stop condition was average loss < 0.01
learning rate 0.0001

Percentage Correct: 0.98333335
Total Correct: 590 out of: 600
on the training data
 high hull
here's some different versions of some code for a ai chatbot i was working on a while ago 😅 just posting them here in case someone can get some use out of them or something
high hull
ocean kestrel
How do I make this NER model, better?
I have tried augmenting the dataset size, adding extra layers, but it's still pretty bad, is there something I'm missing?
This is the output one_hot encoded and only the one's who are 1 are recognized as entities
tf.Tensor(
[[0. 0. 0.]
 [0. 0. 0.]
 [0. 0. 0.]
 [0. 0. 0.]
 [0. 0. 0.]
 [0. 0. 1.]
 [0. 0. 1.]
 [0. 0. 1.]
 [0. 0. 1.]
 [0. 0. 1.]
 [0. 0. 1.]
 [...]]
And this the model
model = tf.keras.models.Sequential([
   tf.keras.layers.Embedding(input_dim=max_words, output_dim=64, input_length=max_len),
    tf.keras.layers.Bidirectional(tf.keras.layers.LSTM(64,return_sequences=True)),
    tf.keras.layers.LSTM(64,return_sequences=True),
    tf.keras.layers.Dense(len(label2id), activation="softmax")
])
But not matter what I try the it's seems the loss doesn't lowers sometimes even goes up, and sometimes it doesn't change
hasty mountain
Hey guys, can someone recommend me some databases and datasets correlating disease symptoms and probability of certain diagnostic?
I have one here, but I'd like to have a collection. The more data, the better.
The idea is to make a model that will receive as inputs the symptoms, predict the possible diagnostics and show all those which have a probability higher than 1%
 grand mason
ocean kestrel
How do I make this NER model, better?
I have tried augmenting the dataset size, ...
grand mason
ocean kestrel
How do I make this NER model, better?
I have tried augmenting the dataset size, ...
It's hard to say. Sometimes its an issue with the dataset. Have you had any luck on this?
How is the data prepared?
ocean kestrel
It's like this:
    {
        "text": "Time in Baton Rouge",
        "labels": [
            {
                "entity": "location",
                "start": 8,
                "end": 19
            }
        ]
    },
    {
        "text": "Open Xcode",
        "labels": [
            {
                "entity": "app",
                "start": 5,
                "end": 10
            }
        ]
    },
then it's one hot encoded every char with the three labels like this [0. 0. 0.]
 dire nacelle
i have the implementation of the APRIORI ALGORITHM and i need to optimize it to the CLOSE_APRIORI i have the steps of the algorithm but i can’t implement it to the first implementation
 weary iron
hasty mountain
Hey guys, can someone recommend me some databases and datasets correlating disea...
weary iron
hasty mountain
Hey guys, can someone recommend me some databases and datasets correlating disea...
interesting 😮
 turbid oriole
Hello I'm a university student majoring in data science and I dont know what to do to enforce and increase my knowledge any suggestions?
raw compass
I don't get something, I just followed a tutorial, and don't understand how am I able to calculate the output, based on the inputs but ignore the targets(ys)?
xs = torch.tensor(xs)  # inputs
ys = torch.tensor(ys)  # targets
g = torch.Generator().manual_seed(2147483647)
w = torch.randn((27, 27), generator=g)  # following norman distribution generate the weights
# NEURAL NETWORK
xenc = F.one_hot(xs, num_classes=27).float()  # input to the network: one-hot encoding based on the xs number(represents an index) shape=(xs, num_classes)
logits = torch.matmul(xenc, w).exp()  # matrix multiplication source:https://pytorch.org/docs/stable/generated/torch.matmul.html predict log-counts (5 ,27) * (27, 27) = (5, 27)
counts = logits.exp()  # counts equivalent to N exponential function MAKE IT NON NEGATIVE
probs = counts / counts.sum(dim=1, keepdim=True)  # probs for next character
bigram model(so like pairs)
 silent stump
Hi Guys im performing word2vec on a airline reviews dataset, am i able to use it to see what people are saying about certin aspects of the flight? for example seats, a similar word may be uncomfortable, is this a good way to get insight from the text? or am i misinterpreting how you use word2vec. many thanks
 young narwhal
Hello there.
I need to upload a custom layer of AWS Lambda with the polars package (done it before with other packages like SQLAlchemy, xlrd, xlsxwriter, and some custom functions). The thing is that I receive an error when trying to read parquet files:
NameError: name 'PyDataFrame' is not defined
...
File "/opt/python/polars/io/parquet/functions.py", line 124, in read_parquet
return pli.DataFrame._read_parquet(
File "/opt/python/polars/dataframe/frame.py", line 861, in _read_parquet
self._df = PyDataFrame.read_parquet(
Do I need a custom package specifically for AWS Lambda? Like SQLAlchemy, that requires a version with some binaries in GitHub instead of just pip install in your machine, zip and uploading it.
untold cliff
I'm trying to find coordinates of some cities so i could plot them on a map. I'm using Nominatim of geopy.geocoders but it couldnt find some of them. Is there a way to go about the rest of the cities without having to look them up manually? (especially since most of them are just typos: a missing letter, a wrong letter etc ...)
lapis sequoia
Is it not okay to pass a string column in decision trees?
I thought it handles it by itself by considering it a categorical column
 upper charm
anyone interested in joining my team for AMAZON ML CHALLENGE?
tidal garnet
stone marlin
There's a lot here, so I'll note how I would do specifically the API part. For ...
Thanx a lot for your help!
I will look into that
forest pollen
hi looked at the documentation and i think i understood where i was going wrong with jaccard similarity wrong score. However, now i am getting this error
Traceback (most recent call last):
  File "C:\Users\shine\Desktop\Testing function\Jaccard Similarity.py", line 43, in <module>
    print(jaccard_score(image1, image2, average='micro'))
          ^^^^^^^^^^^^^^^^^^^^^^^^^^^^^^^^^^^^^^^^^^^^^^
  File "C:\Program Files\Python311\Lib\site-packages\sklearn\metrics\_classification.py", line 809, in jaccard_score
    labels = _check_set_wise_labels(y_true, y_pred, average, labels, pos_label)
             ^^^^^^^^^^^^^^^^^^^^^^^^^^^^^^^^^^^^^^^^^^^^^^^^^^^^^^^^^^^^^^^^^^
  File "C:\Program Files\Python311\Lib\site-packages\sklearn\metrics\_classification.py", line 1374, in _check_set_wise_labels
    y_type, y_true, y_pred = _check_targets(y_true, y_pred)
                             ^^^^^^^^^^^^^^^^^^^^^^^^^^^^^^
  File "C:\Program Files\Python311\Lib\site-packages\sklearn\metrics\_classification.py", line 106, in _check_targets
    raise ValueError("{0} is not supported".format(y_type))
ValueError: unknown is not supported```i think these means that the array format is wrong
said code```python
def flatten_list(image):
flattened_list = np.array(image).flatten().tolist()
return flattened_list
def readAndResize(image_path, width=60, height=30):
# reading the image
image = Image.open(image_path)
# resizing the image
image = image.resize((width, height), resample=Image.Resampling.BILINEAR)
return image
image1 = readAndResize("sample1.jpg")
image2 = readAndResize("sample2.jpg")
image1 = np.array(image1)
image2 = np.array(image2)
print(jaccard_score(image1, image2, average='micro'))```
I am not sure what to do?? using the flatten_list function makes it output a wrong answer
 shut bear
Hello all,
This question is aimed towards experts in the ML field.
Dataset:
Camera images showing 3D printer nozzle (not from nozzle POV) and the 3D object being printed.
Key things about the dataset:
- Varied printers, not a single one, they all look different.
- Varied colors of materials used for 3D printing.
- Images labeled as "Under Extrusion" (1) or "Good" (0)
Task:
Given another dataset, without the labels and a completely different set of printers, classify the images in this new dataset appropriately. Basically a binary classification problem.
What I've done so far?
I've decided to take the Resnet18 model and retrain that on the dataset. I was hoping that the fact that the weights are somewhat already correct, it would take little configuration to adapt it to this task.
However, while I'm able to hit 99% accuracy on my training data (80% of original data shuffled) and 99.6% accuracy on my testing data (20% of original dataset shuffled), I'm only able to achieve an accuracy of 72% on the completely new dataset.
I believe the problem is overfitting but I'm hoping someone here can guide me better?
serene scaffold
shut bear
Hello all,
This question is aimed towards experts in the ML field.
**Dataset:*...
how many epochs are you doing?
shut bear
serene scaffold
how many epochs are you doing?
3-4
the accuracy in training already gets above 99%
same with the testing dataset
but new dataset isn 72%
serene scaffold
I know that. but getting 99% for whatever metric you're using during testing is bad if you had to overfit to get there.
shut bear
well I mentioned above, the testing metric is just 20% of the training data.
cold osprey
any noticable difference between the new data and ur train/test?
serene scaffold
shut bear
well I mentioned above, the testing metric is just 20% of the training data.
"metric" is the type of calculation you're doing to measure the performance. it does not mean "partition".
shut bear
I shuffle my training data, split it in a 80%-20% ratio, using 20% for testing (never given to network, and 80% for training).. the metric here would be how many it correctly identifies out of the 20%.
shut bear
cold osprey
any noticable difference between the new data and ur train/test?
yeah as in my original message, different printers
cold osprey
any class imbalance things?
cold osprey
i mean, it could be just the fact that the printers are quite different
serene scaffold
shut bear
could you explain what you mean by class imbalance?
is the data evenly split between the 1 and 0 classes?
or are there more instances of 1 than there are of 0?
cold osprey
in ur training set
shut bear
yeah I haven't checked.
serene scaffold
shut bear
I haven't exactly checked. I can check this for you?
yes, try checking that, and make sure that the ratio is the same in both the training and testing partitions.
shut bear
from a quick human (non-computerized), they seemed equal.
serene scaffold
and in the "other dataset"
shut bear
serene scaffold
and in the "other dataset"
that I can't check
since the other dataset has no labels.
serene scaffold
it has to have labels, or you can't know that you're only acheiving 73%
cold osprey
wait then how did u get ur 70% thing then
shut bear
no, it gets checked by a software which has the labeled other dataset, and compares my calculated version with that version.
shut bear
technically, I could submit a fully one categorized dataset and check that way
shut bear
cold osprey
so like a competition evaluation set
yes kinda
cold osprey
not sure how the images actually look but will some rotation/translation of the images help it generalize better?
or some noise
shut bear
I'm already rotating
cold osprey
hmm
shut bear
cropping isn't viable since it may remove the features it should be detecting.
and I've tried grayscaling but it leads to worse results
shut bear
It's mainly a case of overfitting I think where it gets too good at one dataset and then just evaluate the other one?
I've furthermore tried stuff like lower learning rate
shut bear
Resnet is a CNN iirc? Regardless, I'm also considering adding in Dropout Layers after the activation functions in the network to see if that helps with overfitting.
Might help it become more generalized rather than rigid.
shut bear
I'm no expert though which is why I'm seeking advice.
cold osprey
neither am i 
shut bear
Just a 2nd year Bachelor's student learning as I go by reading papers and researching.
this is for an internship btw (they're holding an competition between 50 candidates out of 2000 I think?). whoever out of those 50 win gets the internship.
so not really a competition but winning matters.
@serene scaffold if you have any advice, please do let me know. I'll check the datasets for you ASAP.
Okay I checked the training dataset...
There are 36718 good images, and 44342 images showing under extrusion.
so 36718x 0s and 44342x 1s.
cold osprey
seems fairly balanced
shut bear
45% - 55% ratio
cold osprey
like 50%+ 1s?
high hull
high hull
https://paste.pythondiscord.com/wazusihora
refound some more/ different vers I made... so i also put those into the pastebin as well https://paste.pythondiscord.com/uzevutohus / https://paste.pythondiscord.com/oqogukunoq
 pallid flax
are neural networks more powerful than random forest reggressor?
cold osprey
pallid flax
are neural networks more powerful than random forest reggressor?
depends on ur usecase
thorn swift
pallid flax
are neural networks more powerful than random forest reggressor?
as models neural networks are a lot more flexible, so alot more potential
pallid flax
what sort of use cases would have random forest regressors as stronger
pallid flax
thorn swift
as models neural networks are a lot more flexible, so alot more potential
ooo okay
cold osprey
maybe not random forests per say, but boosting algos beat neural networks consistently when it comes to tabular data iirc
thorn swift
its not "stronger" as much as more limited but still easier to implement
cold osprey
yeah theres training time, inference time etc to consider as well
pallid flax
i am a bit confused since i am new to this stuff. Can you recommend me some resource which also teaches when to use what model?
pallid flax
thorn swift
its not "stronger" as much as more limited but still easier to implement
oh alright
 sturdy canyon
Has anybody had much success in using a GAN for generating additional support data to be used in few shot learning? I don't have access to samples from each class to take additional images, so I'm trying to think of ways to get around that
 abstract wasp
Do you guys think watching those YT tutorials on pandas, etc. are helpful to learn decent data science?
tall tulip
what can I do with type of data? can i leave this as it is? or can I do some preprocessing?
 high hull
agile cobalt
tall tulip
what can I do with type of data? can i leave this as it is? or can I do some pre...
high hull
agile cobalt
tall tulip
what can I do with type of data? can i leave this as it is? or can I do some pre...
depends on which model you plan to use, I don't think that there are any special methods for that though (if anything, just the usual scaling methods you can apply to just about everything ever)
tall tulip
agile cobalt
depends on which model you plan to use, I don't think that there are any special...
for now I want to handle this for analysis I think this kind of data don't give me correct results for analysis
agile cobalt
try to find out why is it like that 🤷
depending on the reason it might be fine to just drop it
 hard timber
Can someone help me understand why you shouldn't initialize a network with zeros?
serene scaffold
hard timber
Can someone help me understand why you shouldn't initialize a network with zeros...
What's zero times something
hard timber
its zero lol
serene scaffold
Hard to get that off the ground with multiplication
stone marlin
IIRC, backprop will cause the weights to all move in the same direction if your starting values are all the same.
EDIT: Wait, I think I'm confusing something, all my gradients become zero. Hm.
EDIT EDIT: Yeah, I think in this case if you start at 0 then you're not gonna go anywhere, because your gradients get multiplied by zero. But if you start with all the same non-zero value, everything moves the same way.
cold osprey
start at zero, forever zero
tidal bough
hard timber
but wouldn't backprop change it after first interation?
if it's literally everything zeroed, then since the inputs to all neurons are zeros, the derivative of loss with regards to that input is zero too
only the biases would move, I think, at least at first iteration.
stone marlin
I've been workin' on MLOps stuff, and I want to note: I hate working with Kubernetes, haha. There's so much to figure out with the networking.
All the pieces work individually, and the stack is almost entirely python stuff, but to combine them? Yeesh.
 plush jungle
has anyone worked with actor critic RL? I'm doing a project trying to land a rocket in kerbal space program and I got a very simple version of the problem to converge in vanilla DQN, but now I'm trying actor critic and it seems to be falling into a local minimum

given only 2 actions (throttle up, throttle down), it only learns to do one and then never experiments
whereas the vanilla DQN one learned to vary the action based on the state
the papers suggest that actor critic has built in exploration, but I'm not sure I understand how
 soft badge
Guys for make a aplicattion with stable diffusion is better i use api or download model in project?
To cloud?
tall tulip
agile cobalt
try to find out why is it like that 🤷
**depending on the reason** it might be ...
This column is very important for us
This column create spike due to nan values it have 60% of nan values I've tried mean, median and mode, but it create a big spike like 60% of data have same value, then I fill nan values by randomly selected from the same age column, But I think There is one value which have more frequency that's why It selected that value again again to fill nan values. @agile cobalt what's your opinion on that?
agile cobalt
tall tulip
This column create spike due to nan values it have 60% of nan values I've tried ...
depends on what you plan to do with these values
you could drop the nan values instead of filling or literally leave them as "unknown" when presenting your findings
the considerations you have to care the most about are different if you are planning to use it for a ML model or if you are planning to analyse and present the result to humans
 hybrid jay
Any suggestions for AI ML projects that can take upto a month for a college project? I'm lost for ideas.
lapis sequoia
hybrid jay
Any suggestions for AI ML projects that can take upto a month for a college proj...
You can build a recommendation system to suggest products or services to users based on their preferences and past behavior. You can use techniques such as collaborative filtering and matrix factorization to build your model.
high hull
high hull
https://paste.pythondiscord.com/uyeyamakec
this is a Python code script snippet that defines a chatbot for the Twitch platform. uses these resources as you will.... https://paste.pythondiscord.com/ugevidodib https://paste.pythondiscord.com/irucetasuj ////// these are some different versions of some code for a ai chatbot i was working on a while ago 😅 just posting them here in case someone can get some use out of hem or something https://paste.pythondiscord.com/wazusihora https://paste.pythondiscord.com/uzevutohus / https://paste.pythondiscord.com/oqogukunoq
 latent rover
stone marlin
All the pieces work individually, and the stack is almost entirely python stuff,...
latent rover
stone marlin
All the pieces work individually, and the stack is almost entirely python stuff,...
K8s is one of those things that sucks to get working for a new project the first time, but once it's setup it is so nice to operate. We setup a bare metal k8s cluster at my old job in late ~2018 that is still running production workloads without any major issues.
 hexed kestrel
I trained a binary classification model on an imbalanced dataset, where most of the records are negative. I score on test dataset, and it's labeling all of test data negative
what's a fix? did i not train enough?
serene scaffold
hexed kestrel
what's a fix? did i not train enough?
there aren't one-size-fits-all answers to these questions, so we need to know things like what type of model it is, what the two classes are, and how you trained the model.
hexed kestrel
it's an inbalanced data set, roughly 7% of the data is positive. I tried xgb as well as lgbm
both vannila as well searched hyperparameter tuned version
serene scaffold
right. thank you for saying that the data set is imbalanced. but what are the two classes? cats and dogs?
hexed kestrel
positive and negative, can think of as churn and no churn
serene scaffold
positive and negative what?
serene scaffold
idk what that is.
hexed kestrel
customer churn
serene scaffold
did you have to do feature engineering?
serene scaffold
I won't be able to help, unfortunately.
latent rover
@hexed kestrel try getting the probabilities instead of the class predictions and working with those (with that kind of class imbalance it is entirely possible the model is never confident enough to predict the positive class). Other than that, consider playing around with over/under sampling or sample weighting (some libraries support weighting).
hexed kestrel
I outputted the prob
Still gotta show recall/precision results though
I can hand draw a line on Auc roc graph but it doesn't change the model though
latent rover
Recall precision chart is a good place to go, sklearn PR curve is only a few lines of code
IMO auc is good for comparing model performance, but not that useful for choosing diagnostics or choosing thresholds
 slim wigeon
im a little confused about the details in convolutional network
lets say i have a random rgb image generated using torch.random((1, 3, 28, 28)) where 1 is the batch size and 28s are the width and height of the image
and i will apply a cnn with 3x3 kernel size and 10 output channels to this random rgb image like this:
>>> rand_img = torch.rand((1,3,28,28))
>>> nn.Conv2d(3, 10, 3)(rand_img).shape
torch.Size([1, 10, 26, 26])
when i was learning about cnn, i have only seen examples where theres only 1 input channel and 1 filter, but now that i think about it, when there are more than 1 input channel how are filters applied to each input channel that will result 10 output channel?
queen cradle
<@&831776746206265384>
hasty mountain
slim wigeon
im a little confused about the details in convolutional network
lets say i have ...
You just use 10 filters, apply each filter once, and you'll have 10 channels(10 feature maps)
It's the "10 channels to 1 channel" that makes things complicated. Each API seems to do it in a different way...but it seems to involve summation.
slim wigeon
hasty mountain
You just use 10 filters, apply each filter once, and you'll have 10 channels(10 ...
yea i can use 10 filters and apply each filter once until i have 10 channels but is this still true for having multiple input channels?
e.g "3 channels to 10 channels"
hasty mountain
slim wigeon
yea i can use 10 filters and apply each filter once until i have 10 channels but...
Yes, it's the same. But then you apply each filter to each one of the 3 channels and then sum the result
I think that's the groups=1 parameter in Pytorch. Don't know about tensorflow
slim wigeon
are the 10 filters going to be the same filters used for all channels?
hasty mountain
Yes
slim wigeon
wouldnt that produce the same output channels
hasty mountain
They're going to be initialized with random values, so they should produce different outputs
slim wigeon
hmm ic
next valley
can someone tell me how this works?
this is for tensorflows feature_cloumn
import tensorflow.feature_cloumn as fc
def get_scal(feature):
    def minmax(x):
        mini = train[feature].min()
        maxi = train[feature].max()
        return (x - mini)/(maxi-mini)
        return(minmax)
fc.numeric_column(["col1", "col2"], normalizer_fn=scal_input_fn)
that last return feels like its suppose to be unindented but the program bricks itself if i do
hasty mountain
slim wigeon
hmm ic
∑parameters = input_channels * output_channels * (kerneli * kernelj)```and yes, ik, feature_column is depreciated
hasty mountain
 slim wigeon
hasty mountain
It's the "10 channels to 1 channel" that makes things complicated. Each API seem...
slim wigeon
hasty mountain
It's the "10 channels to 1 channel" that makes things complicated. Each API seem...
yea now i see the problem with "10 to 1 channel"
can you also provide some more information about this?
hasty mountain
It's in Pytorch's Conv2d docs
https://pytorch.org/docs/stable/generated/torch.nn.Conv2d.html#torch.nn.Conv2d
hasty mountain
hasty mountain
Regular ---> groups = 1
Group ----> groups = n_channels
slim wigeon
i will take a look
sleek harbor
Questions regarding sklearn.compose.ColumnTransformer:
- does it apply transformations sequentially? So if I need to first use an imputer, then onehotencoder, will it apply in that order, or do I need a Pipeline for that?
- somewhere I read that it is not recommended to use column names (like from a DataFrame), but that one should always use numeric indices.. why? Names would be a lot more intuitive, imo. What am I missing?
untold cliff
sleek harbor
Questions regarding `sklearn.compose.ColumnTransformer`:
1) does it apply transf...
- it applies transformation independently for each column, so if you want to apply multiple transformations in some order to the same column, you would have to make a pipeline and pass it to the columnTransfomer. 2) I dont really know about this, i also think that column names are better.
Is there a better way to perform the following operations: py data["latitude"] = data["city_name"].map(lambda city: coordinates[city][0]) data["longitude"] = data["city_name"].map(lambda city: coordinates[city][1]) I would have loved to do it like this: ```py
data[["latitude", "longitude"]] = data[["city_name"]].apply(coordinates.get, result_type="expand")
Guys anyone know a AI better chatgpt or equals opensource?
untold cliff
cold osprey
hows the function ure applying look like?
Oh sorry, its just a dict where the keys are the city names and the values are tuples of latitude and longitude.
boreal gale
untold cliff
Is there a better way to perform the following operations: ```py
data["latitude"...
!e the trick is to realise there is pd.Series.map
import pandas as pd
df_obs = pd.DataFrame({"city": ["Hong Kong"] * 2})
coordinates = {"Hong Kong": (22.3,114.1)}
print(df_obs)
df_obs[['lat', 'lng']] = df_obs['city'].map(coordinates)
print(df_obs)
@boreal gale :white_check_mark: Your 3.11 eval job has completed with return code 0.
001 |         city
002 | 0  Hong Kong
003 | 1  Hong Kong
004 |         city    lat    lng
005 | 0  Hong Kong   22.3   22.3
006 | 1  Hong Kong  114.1  114.1
Oh! I thought map wouldnt work because it didnt take a result_type argument, my bad. Thanks!
cold osprey
Epoch 1/200
2/2 [==============================] - 111s 56s/step - loss: 1.2471 - accuracy: 0.4531 - val_loss: 1.2937 - val_accuracy: 0.3077
Epoch 2/200
2/2 [==============================] - 117s 59s/step - loss: 0.4370 - accuracy: 0.9570 - val_loss: 1.3208 - val_accuracy: 0.3077
Epoch 3/200
2/2 [==============================] - 97s 51s/step - loss: 0.1619 - accuracy: 0.9883 - val_loss: 1.3044 - val_accuracy: 0.3077
Epoch 4/200
2/2 [==============================] - 95s 50s/step - loss: 0.0561 - accuracy: 1.0000 - val_loss: 1.3135 - val_accuracy: 0.3077
Epoch 5/200
2/2 [==============================] - 98s 48s/step - loss: 0.0256 - accuracy: 1.0000 - val_loss: 1.3552 - val_accuracy: 0.3077
Epoch 6/200
2/2 [==============================] - 87s 45s/step - loss: 0.0090 - accuracy: 1.0000 - val_loss: 1.4103 - val_accuracy: 0.3077
Epoch 7/200
2/2 [==============================] - 101s 56s/step - loss: 0.0050 - accuracy: 1.0000 - val_loss: 1.4703 - val_accuracy: 0.3077
currently running a resnet50 model for dog breed prediction. noticing something weird with the training vs test loss and accuracy
base_model = ResNet50(include_top=False, weights="imagenet", input_shape = (224,224,3))

model = Sequential()
model.add(base_model)
model.add(GlobalAveragePooling2D())
model.add(Dropout(0.3))
model.add(Dense(512, activation="relu"))
model.add(Dense(512, activation="relu"))
model.add(Dense(len(class_names), activation="softmax"))
val loss increasing and val accuracy remaining the same is quite funny
im only using the 3 breeds with the most data for this model
 fallow frost
if I have a very big Dataframe with 600k records and I'm often filtering it, should I use something like a Pyarrow table for faster queries? (I'm basically using it as a offline copy of my SQL table)
agile cobalt
you mean a pandas dataframe (as in, living in memory) or something like a csv / parquet file?
depending on what exactly you are doing with it, SQLite might work alright-ish for it
serene scaffold
@agile cobalt fyi, I already told them in pygen to use a set instead of isin
 stone oriole
I want to make a recommendation system using knn how I do it
 raven field
stone oriole
I want to make a recommendation system using knn how I do it
raven field
stone oriole
I want to make a recommendation system using knn how I do it
What's the problem? You can find blogs on it. Although its better to use cosine similarity Algorithm for recommendation engines.
You can learn about it. Its quite famous.
 frozen marten
Can anyone help me resolve pspnet Val accuracy Nan error??
tidal bough
fallow frost
if I have a very big Dataframe with 600k records and I'm often filtering it, sho...
well, polars is generally faster than pandas, pretty similar to it, and uses pyarrow under the hood, so you could try that
boreal gale
fallow frost
if I have a very big Dataframe with 600k records and I'm often filtering it, sho...
i would go one step further back and asses if the filtering is required at that frequency as well
what are your ultimate goal / what are you currently trying to do?
raw compass
does someone can help me explain the gradient in the context of "back-propagation"-chain rule, and why is that so important so with that we are able to decrease the loss. I mean I know its represent the "change" and etc, but exactly what it does?
wooden sail
the gradient vector points in the direction of maximum increase of a function
the negative gradient, instead, points in the direction in which the function decreases, which is exactly what you want
raw compass
wooden sail
the gradient vector points in the direction of maximum increase of a function
so if I have gradient with the value of "-2.1", it means that if I increase that data its gonna decrease the loss because it is negative?
wooden sail
wdym by "increase the data"? the gradient is related to model parameters. the data is constant
if we have an expression like (y - ax)^2, where y are labels and x are inputs, both x and y are "data". but the gradient is the derivative with respect to a, which is a parameter
the data is not something you change, it is fixed. the parameters of the model are what you change
raw compass
wooden sail
wdym by "increase the data"? the gradient is related to model parameters. the da...
Isn't every neuron has a data and in this case a gradient which is a vector.
wooden sail
no
the neurons are/have parameters
the data are the input-label pairs given to the network
raw compass
wooden sail
the data are the input-label pairs given to the network
But in the backpropagation, every neuron is connected with a gradient right?
wooden sail
wdym by "connected with a gradient"?
raw compass
wooden sail
wdym by "connected with a gradient"?
Like p.data p.grad
P is a parameter
wooden sail
you mean the gradient can be computed for each parameter? yeah