#data-science-and-ml
1 messages · Page 54 of 1
 wooden sail
you have to make the layers yourself
it doesn't really bring any functionality for that. that's in other modules built on top of it
stuff like haiku and flax essentially give you an API to jax that looks like tf or pytorch, but jax itself is just numpy (and some scipy) running on XLA
you could just change the pytorch backend to xla and see if that gets you any speed gains
 mild dirge
This is cursed..
 wooden sail
what are we looking at
mild dirge
Reshaped images instead of transposed/permuted
 hasty mountain
Looks like the images my generative models create 
 coral bloom
so can anyone eli5 how gpt-4 is able to describe virtually all input images?
easily at that
mild dirge
wth is going wrong here? My model guesses Potato on literally EVERYTHING but a potato ...
 coral bloom
mild dirge
wth is going wrong here? My model guesses Potato on literally EVERYTHING but a ...
coral bloom
mild dirge
wth is going wrong here? My model guesses Potato on literally EVERYTHING but a ...
you solved half the porblem!
mild dirge
(left of ... is actual label, right of ... is prediction)
coral bloom
now put a not at the end
wooden sail
did you maybe mangle the labels?

 arctic wedgeBOT
Pasting large amounts of code
If your code is too long to fit in a codeblock in Discord, you can paste your code here:
https://paste.pythondiscord.com/
After pasting your code, save it by clicking the floppy disk icon in the top right, or by typing ctrl + S. After doing that, the URL should change. Copy the URL and post it here so others can see it.
mild dirge
This is my current model, copied the training loop from pytorch doc tutorial
https://paste.pythondiscord.com/fajaforotu
wooden sail
how about putting a sigmoid or softmax as final activation function?
that way we can interpret the output of the network more clearly
mild dirge
Pretty sure this is uncecessary with pytorch if you used the cross entropy loss function, as it does that for you
I tried with softmax explicitly too, same result
wooden sail
i see
 misty flint
 wooden sail
i'm not sure how pytorch handles this, it's not immediately apparent to me how the loss.backward() and the optimizer step are related here
i would expect the optimizer to require the gradients. but as i said, idk pytorch
mild dirge
Well the optimizer has access to all the model parameters because of optimizer = optim.SGD(self.parameters(), lr=0.001)
Thus also all the gradients
wooden sail
icic
how about making the learning rate smaller?
also what's happening to the loss, can you print it out over the epochs?
mild dirge
It basically stays the same, it changes a little bit
8.129185914993286
8.124769449234009
8.1436448097229
8.139072895050049
8.135381698608398
8.127331972122192
8.125777959823608
8.119115829467773
8.126407861709595
8.120127439498901
hmmm yeah
mild dirge
I might try to load in a pretrained model and see if that works, then I at least know it's the model
It may have been the optimizer/+ nr of epochs
It seems to converge after more epochs

I kept looking at the first 10 epochs, but the curve looks like this most of the time lol
Pretty deceiving
hasty mountain
mild dirge
Pretty deceiving
What is the size of your dataset? How many images?
mild dirge
15 classes * 1000 images, but I'm using only 100 per class
hasty mountain
Ouch... I'm using 45,000 images for my model...and the classes are unbalanced 
I hope I don't have to use like 50 epochs...
mild dirge
I have perfectly balanced dataset, my project isn't much about the model/data, but more about combining results of multiple models. So if it is better than random guessing, it's good enough for me.
After 1000 epochs the loss just flatlines to 0 (training loss, but still pretty cool)
 hasty mountain
The loss jumps to 0.9 and then just dive into 0? 
wooden sail
welcome to stochastic gradients
 edgy falcon
Hi!, how can i solve this error:
Dimension value must be integer or None or have an index method, got value 'TensorShape([])' with type '<class 'tensorflow.python.framework.tensor_shape.TensorShape'>'
On this: relative_position_encoding=(None, 300, None)
is how im passing the argument to a Transformer XL layer on tensorflow:
    vocab_size=140,
    num_layers=6,
    hidden_size=256,
    num_attention_heads=30,
    head_size=5,
    inner_size=30,
    dropout_rate=0.2,
    attention_dropout_rate=0.2,
    initializer="glorot_uniform",
    two_stream=True,
    tie_attention_biases=True,
    memory_length=30,
    reuse_length=30,
    inner_activation='relu'
)(embedding_1, relative_position_encoding=(None, 300, None), segment_matrix=False, segment_embedding=(None, 30, 256))```Any good way to speed up the cpu part of the training process? When looking at my cuda activity on task manager I can see it takes pretty long between active gpu usages, so it probably takes pretty long to load the image data?
Actually, I'm not sure what the downtime is...
My training loop looks like this
    for e in range(80):
        loss = model.train_one_epoch(train_dataloader, device, criterion, optimizer)
        if e % 5 == 0:
            acc_test = model.test_model(validation_dataloader, device)
            accs_test.append(acc_test)
            acc_train = model.test_model(train_dataloader, device)
            accs_train.append(acc_train)
            print(e, acc_train, acc_test)
And my training for 1 epoch looks like this:
    def train_one_epoch(self, dataloader, device, criterion, optimizer):
        running_loss = 0.0
        samples = 0
        for images, labels in dataloader:
            images, labels = images.to(device), labels.to(device)

            # Zero the parameter gradients
            optimizer.zero_grad()

            # Forward and backwards pass
            out = self(images)
            loss = criterion(out, labels)
            loss.backward()
            optimizer.step()

            # Statistics
            samples += len(labels)
            running_loss += loss.item()

        return running_loss / samples
 neat hedge
Hi
mild dirge
mild dirge
And my training for 1 epoch looks like this:
```py
def train_one_epoch(self,...
I would expect the activity to be somewhat consistent, since it loads the images in batches, and thus the gpu is active for the entire epoch. But then, why is it inactive between epochs

 bright pasture
Hello. So, I'm trying to preprocess audio files, and it seems like I run into this error. the audio files are 44100 hz for reference.
ValueError: Input signal length=0 is too small to resample from 44100->16000```
If it helps, I have Librosa 0.9.1 queen cradle
mild dirge
I would expect the activity to be somewhat consistent, since it loads the images...
queen cradle
mild dirge
I would expect the activity to be somewhat consistent, since it loads the images...
Try profiling your code. Maybe there's a weird hotspot somewhere.
arctic wedgeBOT
Hey @bright pasture!
You either uploaded a .txt file or entered a message that was too long. Please use our paste bin instead.
bright pasture
hasty mountain
wooden sail
welcome to stochastic gradients
Really? This is normal for stochastic gradients?
If my model showed this behavior, I think I'd jump to the conclusion that there's something in my dataset that is causing some trouble
wooden sail
hasty mountain
Really? This is normal for stochastic gradients?
this is how all stochastic gradients behave. by using batches, you essentially compute the gradient wrong at every single iteration
(the presence of noise too)
hasty mountain
wooden sail
this is how all stochastic gradients behave. by using batches, you essentially c...
Then, whould it be better if I only optimize my model after an entire epoch, rather than after iterating through a batch?
wooden sail
hasty mountain
Then, whould it be better if I only optimize my model after an entire epoch, rat...
no, for many reasons
one of them being your training would be super slow. another being you'd get stuck at local optima more easily
hasty mountain

wooden sail
part of the reason sgd is good is that the stochastic gradients are cheap to compute, since they use less data. and because they're noisy, you have a probability of 0 of getting stuck on a saddle point and it's less likely to get stuck at shallow local minima
wooden sail
hasty mountain
Then, whould it be better if I only optimize my model after an entire epoch, rat...
this is equivalent to not using batches, but the full data
you'd take 1 step per epoch, and would therefore need a lot more epochs
hasty mountain
So, the error that I get for optimizing per batch is somehow desirable?
 verbal venture
does anyone know what this bit of code does? ```py
class CNN(nn.Module):
def init(self):
super(CNN, self).init()```
hasty mountain
verbal venture
does anyone know what this bit of code does? ```py
class CNN(nn.Module):
def ...
It initializes everything in the __init__() function when you call the CNN class with CNN()
and the () in the CNN will be passed as arguments for __init__()
verbal venture
my question is what is super inheriting
wooden sail
hasty mountain
So, the error that I get for optimizing per batch is somehow desirable?
it has nice statistical properties
verbal venture
is it inheriting the code from nn.Module?
okay, what does nn.Module typically contain
code to init a CNN?
so bascially code for a multitude of ML algos yeah?
okay dope
mild dirge
I am planning on storing every output for every image in a testset for about 100 models, what would be the cleanest way to store them?
There's 3000 images, I assume 3000 csv files is not the way to go...
wooden sail
what about 100 csv files, with all image outputs per model?
or 100 npy files that you can just load up as numpy arrays
mild dirge
I have to compare the outputs of all models on the same image
If I can load them all at once, it might be okay to do that though
wooden sail
right, so you if you have one per model, and you assign each row to one image in the same order
the ith index of all csvs/arrays is the output
mild dirge
Yeah I'll have to double check that it does the same order
wooden sail
if it's for the test after the training, you can remove the shuffling from the dataloader
in that way, you could alternatively make a single CSV
one row per image, one col per model (or backwards if you like)
then you can simply print or plot by row (or column)
mild dirge
I'll just go with 100 csvs, and making sure they're ordered the same
Kinda just want to get this done so it can run while I sleep
wooden sail
understandable
hasty mountain
wooden sail
it has nice statistical properties
Curious
 cinder rain
Hello. I love AI technology but I am new in AI/DataScience and python. I am software developer. What should I learn first and focus to grow as a AI engineer? Thanks 😊
 iron basalt
cinder rain
Hello. I love AI technology but I am new in AI/DataScience and python. I am soft...
iron basalt
cinder rain
Hello. I love AI technology but I am new in AI/DataScience and python. I am soft...
Mathematics. Statistics, (multivariate) calculus, and linear algebra. There is more math to learn, but those will take you far.
(If I were to add a fourth, then mathematical optimization)
hasty mountain
50 shades of math
cinder rain
iron basalt
Mathematics. Statistics, (multivariate) calculus, and linear algebra. There is m...
I have some project ideas. I love NLP. What math is good for NLP or it doesn’t matter? Algebra and statistics are must-haves.
Thank you
I saw on the internet article about math for beginners in data science. It is a lot of math. 👀I need to focus on one topic at a time to be more productive. So which math do you recommend guys for NLP projects? sorry if my English is not perfect 💯
iron basalt
cinder rain
I have some project ideas. I love NLP. What math is good for NLP or it doesn’t m...
NLP is not exactly one thing, it depends on your goals. But the mentioned mathematics will get you far in any branch of AI. It will also give you a solid enough foundation to pick up more math as you go and read papers.
cinder rain
iron basalt
NLP is not exactly one thing, it depends on your goals. But the mentioned mathem...
I got your point. Thank you
iron basalt
cinder rain
I got your point. Thank you
The listed mathematics is already stripped down, there is an endless amount of mathematics to learn. It's impossible for any one person to know it all at this point. But those 3/4 will show up all the time.
cinder rain
I always thought that math is not necessary for programming 😄 So I was wrong. AI is cool. I feel like I am in a cave when this AI REVOLUTION is happening.
Everyone is talking about NLP chatbots, image generation etc
I like the idea of neural networks
 visual sleet
Most ML projects are just calculus practice
cinder rain
but math is a problem for me so as I understand I should focus on math rather than some language or technology. Thank you
iron basalt
cinder rain
but math is a problem for me so as I understand I should focus on math rather th...
Yes, especially since you are already a software developer, otherwise I would have included learning the basics of programming / a programming language (probably Python).
*Also a nitpick, but math is a technology.
cinder rain
I was not bad at math in school but this math is hard for me cos I didn't study it in a college 😌
iron basalt
cinder rain
I was not bad at math in school but this math is hard for me cos I didn't study ...
Math is way more fun when you get to pick the topics, the books, etc.
And school does not do it any justice.
cinder rain
Do you know some good resources for math to have fun like Codecademy for programming?
iron basalt
Please do not assume that because you struggled with math in school that it implies that you are not capable or good at math.
cinder rain
Thank you I appreciate your answer
iron basalt
cinder rain
Do you know some good resources for math to have fun like Codecademy for program...
I would say that math still requires text books / it fits that form well, but I would also say that Khan Academy and Brilliant.org are good too.
I would try receiving the same information in as many different forms as possible.
cinder rain
Ok. Thank you
iron basalt
cinder rain
Ok. Thank you
Oh, there are also the open courses such as those from MIT on Youtube.
(If you prefer lectures)
hasty mountain
iron basalt
Please do not assume that because you struggled with math in school that it impl...
Well, that's reassuring
 untold flicker
I am having some issues reshaping my tensor. I am working on some time series data. currently have my data in the form of a 2D tensor of (samples, features) (10,000, 10) . My time data is the first column of my data. I want to add a third dimension and make that dimension time to make it (samples, time, features) (10,000, 10,000, 9). I have been struggling to figure out how to do this properly. Can anyone help me?
hasty mountain
untold flicker
I am having some issues reshaping my tensor. I am working on some time series da...
Try this:
sequence_size = 10
sequence_data = []

for i in range(sequence_size, len(data)):
    sequence = data[i-sequence_size:i]
    sequence_data.append(sequence)
 bold timber
Hello guys, I have a question: I have 6851 data for training and not batching the data. But why when I run the model we have 215/215, which refers such as using 32 for each batch?

 serene scaffold
bold timber
Hello guys, I have a question: I have 6851 data for training and not batching th...
serene scaffold
bold timber
Hello guys, I have a question: I have 6851 data for training and not batching th...
other people might be willing to answer this, but I won't read screenshots of text. so just keep in mind that if you ask any questions in this channel, and you only show the code and text output as a screenshot, I won't attempt to help.
bold timber
serene scaffold
other people might be willing to answer this, but I won't read screenshots of te...
So what should I do? I capturing that because the result of training model makes me wondering
 lapis sequoia
what do all the kids use vscode notebook or the browser version?
the really smart kids
 remote pollen
hey everyone. I am annoyingly new to python and running A.I stuff. I really want to have less frustration and I get told quite a lot to use linux to do all of this. I really don't want to spend too much trouble installing linux dual boot all that stuff. I figure it would be a lot easier for me to run a virtual machine using virtualbox. I am just wondering though. If I do run a virtual machine for Linux will it make full use of my GPU and will it run comparibly as fast as if I was just running it normally. Or is using a Virtual Machine going to be just a stupid idea because it will run slow as heck because it is being virtualized. Hope that all makes sense.
 true scaffold
Hey guys, hope all are doing well, actually I need some advice/suggestions, here goes my problem -> I'm working on a similarity problem, a user will upload a csv of documents (patents) which will have a title, abstract column, and the user will also enter his query against which we have to provide the most similar docs/patents from the csv that he just uploaded, so for that i'm right now using patentSBert from huggingface (sentence-similarity task -> supposed to be fine-tuned on google patents data), i think it's working fine, but when i compare the result to the cited patents, we only cut off like 50%, meaning, only 50% of the resulted similar patents matches the cited patents (cited by examiner), so i mean how can i improve this approach? do i fine-tune this model? because any way this model is already fine-tuned on patent docs data...?
Anyone? If you have any doubts, feel free to ask me!
 frigid lion
Hey guys i wonder is it a bad practice to use to_numpy() on dataframe
Ive been implementing knn without sklearn and i suppose you could do it without converting it to numpy array but i want to know if its a bad practice to do so
 near oyster
Hi everyone. With all the hype lately about generative ai, I would like to create a prototype for my business's domain with a simple chatbot. What is the latest and easiest way to fine-tune a chatbot with an open-sourced solution?
 eager gull
Can i just make 20 layers same size as input layer, and then just output layer and train it for 1024 epochs?
(16, 16) - input
(256) - mid [x20]
(39) - output
Its sorting task
Classification*
hasty mountain
eager gull
Can i just make 20 layers same size as input layer, and then just output layer a...
Congratulations, you've just discovered ResNet-18
Add residual connections between the hidden layers and it should work well
eager gull
hasty mountain
Congratulations, you've just discovered ResNet-18
You like advancements announcement
hasty mountain
near oyster
Hi everyone. With all the hype lately about generative ai, I would like to creat...
Take a look at HuggingFace website. It's quite good for implementing ready-made models.
There might be a Seq2Seq model, or a classic Transformer...maybe even a GPT-2...
mild dirge
mild dirge
I'll just go with 100 csvs, and making sure they're ordered the same
It was actually 1000 text files since I save the result for every 5 epochs. got half a GB of csv files now lol
serene scaffold
frigid lion
Hey guys i wonder is it a bad practice to use to_numpy() on dataframe
using to_numpy is better than values, so that's fine. though I think some sklearn modules will play nicely with pandas anyway.
frigid lion
serene scaffold
using `to_numpy` is better than `values`, so that's fine. though I think some sk...
ye but for now im not using sklearn i gotta implement the algorithms by myself without using sklearn
serene scaffold
frigid lion
ye but for now im not using sklearn i gotta implement the algorithms by myself w...
there's nothing wrong with converting a dataframe to an array if you want to go from doing tabular data manipulation to arithmetic.
frigid lion
serene scaffold
there's nothing wrong with converting a dataframe to an array if you want to go ...
thanks a lot, also just one more thing do you know whats the diffrence in time it takes to operate on each record?
if there even is one significant
serene scaffold
frigid lion
thanks a lot, also just one more thing do you know whats the diffrence in time i...
depends on the operation. but dataframes are just a wrapper around numpy arrays, so for algebraic operations, it should be about the same.
 austere swift
bold timber
Hello guys, I have a question: I have 6851 data for training and not batching th...
austere swift
bold timber
Hello guys, I have a question: I have 6851 data for training and not batching th...
the default batch size is 32, so 6851/32 ~= 215
 fallow frost
anybody knows how to load a pyarrow.dataset() from an S3 bucket (with credentials)?
hasty mountain
Guys, about Transformer...
How much decisive is to have the correct initialization and the warmup steps?
I've seen that the original Transformer has a true ritual in order to make it start training in fact, but I'd prefer to simply let the Adam optimizer do its trick. Would it be too prejudicial?
hasty mountain
Oh... I suppose applying masks on the second self-attention layer in my decoder was a bit debilitating...
untold flicker
hasty mountain
Try this:
```py
sequence_size = 10
sequence_data = []
for i in range(sequence_s...
Thank you
I think I managed to get the code to work but now I'm having issues with my M1 chip and metal and tensorflow
lapis sequoia
How do I start with data science and AI?
untold flicker
Do the andrew ng course on coursera. I really like the deep learning with python book
bold timber
austere swift
the default batch size is 32, so 6851/32 ~= 215
Thank you so much for enlightening me! But, can you give me a resource of the default batch size which used in TensorFlow? because I need to make sure of my understanding of parameters in TensorFlow when I run the model.
lapis sequoia
untold flicker
Do the andrew ng course on coursera. I really like the deep learning with python...
Is this for me?
why bother calculating local derivatives at nodes and doing backpropagation to get to the leaf nodes derivative. when you could just do this version karpathy shows at the end for verification where you nudge some leaf node by h, compare to the unnudged version and calculate the derivative (L2-L1 / h)?
 wooden sail
lapis sequoia
why bother calculating local derivatives at nodes and doing backpropagation to g...
wooden sail
lapis sequoia
why bother calculating local derivatives at nodes and doing backpropagation to g...
because that's in general not equal to the derivative
lapis sequoia
I don’t understand why that is, is this something special about this example just using multiply and add operations?
wooden sail
right, it's only true for polynomials of order 0 and 1
austere swift
bold timber
Thank you so much for enlightening me! But, can you give me a resource of the de...
It’s an argument in model.fit
The default value is 32
So if you don’t specify a value it’ll be 32
bold timber
austere swift
It’s an argument in model.fit
but when I see the docstring, fit method tells batch_size = None. can you give me an explanation about this?
austere swift
TensorFlow
A model grouping layers into an object with training/inference features.
It's not technically the default value of the argument, but it's in the actual code that if it's unspecified it will be 32
 violet gull
What determines how many kernals are in a convolution layer
austere swift
That’s one of the parameters
wooden sail
violet gull
What determines how many kernals are in a convolution layer
you tell it
wooden sail
it is
violet gull
Show me
violet gull
Probably
But I’m working through testing my code with PyTorch and we have different number of kernals
wooden sail
out_channels is the number of kernels
violet gull
My current out channels is 2 but I have 6 kernals
In PyTorch
That don’t make no sense
wooden sail
show what you're doing
violet gull
wooden sail
show what you're doing
import torch.nn as nn
import torch
torch.manual_seed(0)

conv = nn.Conv2d(3, 2, 2)
input = torch.randn(3, 10, 10)
print("input")
print(input)
print("bias")
print(conv.bias)
print("weight")
print(conv.weight)
print("output")
print(conv(input))
and what makes you say there are 6
violet gull
wooden sail
and what makes you say there are 6
Parameter containing:
tensor([[[[-0.0022,  0.1549],
          [-0.2376, -0.2124]],

         [[-0.1112,  0.0774],
          [-0.0057,  0.2289]],

         [[-0.0256,  0.0764],
          [-0.0872, -0.0567]]],


        [[[-0.2758, -0.1912],
          [-0.1190,  0.0107]],

         [[ 0.1141,  0.1732],
          [-0.1957, -0.1257]],

         [[ 0.1049,  0.2397],
[-0.0594, 0.2160]]]], requires_grad=True)```6
wooden sail
your input image has 3 layers, so each of the 2 kernels also does
that's due to the group parameter defaulting to 1
violet gull
explain in dumb
wooden sail
conv2d, as the name implies, applies 2d convolutions
that means telling it to apply 2 convolution kernels to a single image with 3 layers is not well defined. it can be done in more than one way
pytorch's default behavior is to give extra layers to each filter
if you change the group parameter, you can change how many layers the filter has
violet gull
so there is 2 kernals there
violet gull
wooden sail
pytorch's default behavior is to give extra layers to each filter
but they are not 2x2
wooden sail
well, the operation is not well defined anyway
you can think of it as 6 filters if it helps you
violet gull
how do i change mine to make it work
wooden sail
it'll map all layers of the input to all layers in the output
and add up those results
violet gull
i guess i just dont understand where those extra parameters are coming from
i take 2x2 kernal and i slide it across an image
4 parameters
wooden sail
you have 3 input layers, you want 2 output layers. but you're only applying 2d convolutions to do this, so you immediately have a problem. a 2d convolution cannot do this
violet gull
last time u told me to average them
wooden sail
pytorch's solution is to do several and add them. addition is the same as averaging, sure
division by N isn't really important
violet gull
how is "several" calculated
wooden sail
3 inputs x 2 outputs = 6
violet gull
so there is 6 kernals
wooden sail
i would call them 2 3-layer kernels, but as i said, the difference is moot
think of it as 6 if it helps you
violet gull
so each image is getting 3 kernals applied to it
then it is adding the 3 up
for both inputs
wooden sail
what are you calling "each image" here
violet gull
the 2 input channels
wooden sail
aren't there 3?
wooden sail
that makes it easier to digest, doesn't it 😛
and each layer of each kernel gets applied to the corresponding layer of the input image
violet gull
so each input channel gets a total of 2 kernal layers applied*
wooden sail
violet gull
so each input channel gets a total of 2 kernal layers applied*
precisely
wooden sail
indeed
well, same minimizer, but it will affect the numbers you see in the gradients. so if you're off by a factor of 3, you know why 😛
violet gull
wooden sail
well, same minimizer, but it will affect the numbers you see in the gradients. s...
just when i was starting to understand it
bold timber
austere swift
https://www.tensorflow.org/api_docs/python/tf/keras/Model#fit:~:text=per%20gradi...
Aahh I see. Thank you so much!
 undone ocean
how do i get started with ai
serene scaffold
undone ocean
how do i get started with ai
what do you know about calculus, statistics, probability, and linear algebra?
 silent spade
Oh cool, I did not know that. That will make this much more simple.
bold timber
I see from another source that said when we fine-tune the transformers model, we actually end up training all the weights in the neural network, not just new untrained weights. Is it correct?
To my knowledge, we should do retain the weight of the pre-trained model because it already has good parameters.
Anyone can enlighten me for this?
 tacit basin
bold timber
I see from another source that said when we fine-tune the transformers model, we...
tacit basin
bold timber
I see from another source that said when we fine-tune the transformers model, we...
You can train only the newly added layers first for a epoch or so (frozen weights) then unfreeze weights and train all weights, early layers with lower learning rate than later (closer to head) layers. This is default approach for fastai fine_tune method.
https://docs.fast.ai/callback.schedule.html#learner.fine_tune
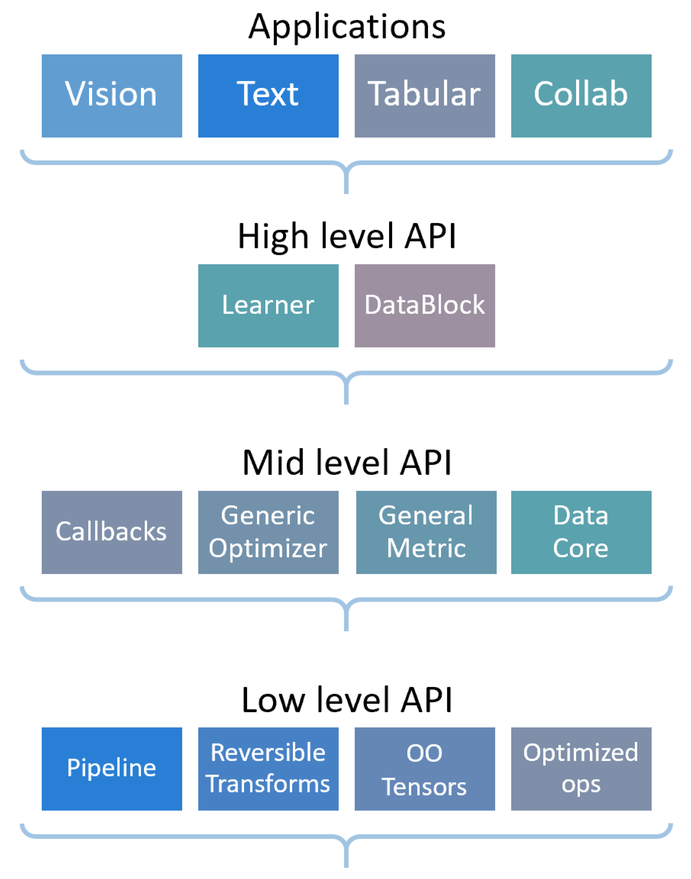
Callback and helper functions to schedule any hyper-parameter
bold timber
So does it mean we use all the parameters in training even though they were previously already owned from a pre-trained model?
Actually, I'm a beginner at using the Hugging Face library. In this case, I try to fine-tune the DistilBERT model in TensorFlow format for sentiment analysis. But I'm confused why the summary of the model has a lot of parameters to be trained.
And then I found another source that said when we fine-tune the transformers model, we actually end up training all the weights in the neural network, not just new untrained weights.
To my knowledge, we do not necessarily train all the parameters when we use a pre-trained model (such as DistilBERT ) because they already have well parameters which could be leveraged in another task.
Can you make me clear about this?
@tacit basin
tacit basin
bold timber
So does it mean we use all the parameters in training even though they were prev...
Yes all are used. It's called transfer learning .
All pre trained params will most likely need some adjustments to your task. As it's most likely different than to the pretraining.
Although if your task is somewhat similar to pretraining then freezing initially may help
You can train only the untrained layers and compare results
It's up to you if you want to train all or zero layers. Training zero layers doesn't make sense for sure 😃
bold timber
tacit basin
It's up to you if you want to train all or zero layers. Training zero layers doe...
But why do some people use all layers (including pre-trained model layers) to training the model instead of just a few last layers?
tacit basin
bold timber
But why do some people use all layers (including pre-trained model layers) to tr...
Because the model was pretrained on different training set so weights will need adjustment.
It's a lot better starting point compared to using random weights
bold timber
tacit basin
Because the model was pretrained on different training set so weights will need ...
Is this case only just for the transformers model or for all the transfer learning pre-trained models?
I'm confused because when I learned pre-trained models for food image classification, such as ResNet or EfficientNet, we didn't necessarily train all the parameters because their models already have good parameters which is could be leveraged in my model.
And then, when I learned the transformers model with the Hugging Face library, many people use all the weight of the pre-trained model to be trained from scratch instead retain that weight.
tacit basin
bold timber
Is this case only just for the transformers model or for all the transfer learni...
Do you have source for training only added head for vision?
Did you also train all weights for comparison when training only head?
I mean if training head only gives good enough results then why not. I suspect training all weights in discriminative LR way will give better results
At a cost of more longer compute
If using just pretrained model gives good enough results like for example yolov8 object detection then no need for any training at all
bold timber
tacit basin
Do you have source for training only added head for vision?
I mean not just training on the head, but the last few layers of the pre-trained model.
So does it means we can use many techniques to improve the model, right?
tacit basin
bold timber
So does it means we can use many techniques to improve the model, right?
Yes!
bold timber
tacit basin
Yes!
alright! thank you for the explanation
 sullen pollen
Not sure if this is the right channel to post this but I can't find a better one. I am a newbie building a Flask web app that will make a 3D interactive spin plot using plotly/matplotlib/pandas. This function will take a 'selected_file' (csv) and find the 'RefX', 'RefY', and 'RefZ' column names and use them for the plot. These column names could be in different rows and column numbers (no more than the first 20 rows) in other selected files, so I do not want to specify a static row number or column number.
After attempting my code, this error comes up.
"KeyError: 'RefX'"
After reading the documentation, I thought I could use the 'loc' accessor so it can find the string 'RefX' no matter what row. But apparently this doesn't work.
In summary, I'm asking how do I access a column's data while only specifying the column name, while the column name's location can be random throughout the CSV?
Yes, I am 100% certain the column name syntax is correct and it's in my CSV file.
__
My code:
import plotly.graph_objs as go
import pandas as pd
def generate_plot(selected_file):
# Load data from CSV file
df = pd.read_csv(f'static/files/{selected_file}', skiprows=range(20))
# Create data
x = df.loc[:, 'RefX'].tolist()
y = df.loc[:, 'RefY'].tolist()
z = df.loc[:, 'RefZ'].tolist()

# Create trace
trace = go.Scatter3d(
    x=x,
    y=y,
    z=z,
...
I didn't think I would be stuck on such a simple issue. This is my first post in this community so hopefully I don't get banned just for asking for help like I did in others. Would appreciate any help! Thanks!
tacit basin
sullen pollen
Not sure if this is the right channel to post this but I can't find a better one...
Can you share example of data?
hasty mountain
Ugh... I hope once I figure out how to pretrain my Transformer, I can stay at ease in relation to the ritual that is done to initialize the Transformer...that learning rate warmup and updates are annoying. And Glorot initialization breaks my model.
Fun fact: I asked ChatGPT how the GPT loss works during pre-training stage, and it described me the BERT's pre-training losses
mild dirge
Pretty low probably
I read it at some point, but only when you asked the question I searched up what a harmonic mean actually is
 mint palm
yeah, he actually also didnt had clear explanation for it and adviced me to look it up after interview, maybe he was expecting me not to have an answer for it.
 limber grotto
Hello
Is this possible to print dataframe without carriage return on Google colab ?
I would like have each line complete even if I have to scroll horizontally
Thank you
mild dirge
pd.set_option('display.max_rows', None) can be used to print all dataframes fully @limber grotto
limber grotto
mild dirge
`pd.set_option('display.max_rows', None)` can be used to print all dataframes fu...
Thank you @mild dirge ! I will try
 boreal gale
since you mentioned scrolling horizontally, i would also check/set these settings https://pandas.pydata.org/docs/user_guide/options.html#:~:text=display.max_columns %3A int,50] [currently%3A 50]
limber grotto
boreal gale
since you mentioned scrolling horizontally, i would also check/set these setting...
Thank You
limber grotto
it seems these two lines don't work on google colab
pd.set_option("display.max_rows", None)
pd.set_option("display.max_columns", None)
I stil have carriage return in the middle of the lines
 lusty lotus
ive made a chess ai using reinforcement learning and genetic algorithm, the catch is that it's kinda bad. yk conventionally chess AIs have like a minimax/negamax/alpha-beta pruning system where it evaluates moves to a certain depth and assign a score.
the problem is that for my ai i don't have it because i felt that assigning arbitrary values (eg pawn=1, knight=3...) will create a certain prejudice for the AI and I want the AI to start and think for itself, which leads to this chicken-or-egg scenario of whether should I assign values to it first or let it play against itself first and think of what's good and what's not
 gilded bobcat
Hello hello.... I have an NLP question.... I made embeddings of animal breeds using BERT. Some animals have two breeds (lab and german sheppard). Is it permissible to take the average of the embeddings (sum each element and divide by 2) for mixed breeds?
sullen pollen
tacit basin
Can you share example of data?
A1,B1,C1,D1,E1,F1,G1,H1,,,,,,,,,
asdf,qwer,zxcv,uiop,hjkl,vbnm,1234,5678,,,,,,,,,
,,,,,,,,,,,,,,,,
{TEST RESULTS},,,,,,,,,,,,,,,,
A,B,C,D,E,RefX,RefY,H,I,J,K,L,M,RefZ,O,P,Q
4128C11,2432,1,4128C11,1,202183,-141223,6.508,N/R,-6.7,8.5,13.7,33.4,-8.9,O/R,N/R,N/R
4128D10,2435,1,4128D10,1,204215,-139191,3.491,N/R,8.3,-5.2,28.5,28.1,3.6,O/R,N/R,N/R
4128C08,2437,1,4128C08,1,208279,-141223,7.002,N/R,7.7,-4.6,38.2,14.3,-9,0.738,N/R,N/R
4128A11,2438,1,4128A11,1,202183,-145287,0.705,N/R,-6.7,1.1,23.1,39,-9,0.813,N/R,N/R
4128D07,2441,1,4128D07,1,210311,-139191,2.939,N/R,4.7,-2,22.4,16.5,-9,O/R,N/R,N/R```
Here's a view of it in XLXS for a better view tacit basin
sullen pollen
```{GENERAL INFORMATION},,,,,,,,,,,,,,,,
A1,B1,C1,D1,E1,F1,G1,H1,,,,,,,,,
asdf,q...
tacit basin
sullen pollen
```{GENERAL INFORMATION},,,,,,,,,,,,,,,,
A1,B1,C1,D1,E1,F1,G1,H1,,,,,,,,,
asdf,q...
What's the source of the data? Excel? Or CSV file?
sullen pollen
tacit basin
What's the source of the data? Excel? Or CSV file?
CSV
tacit basin
sullen pollen
CSV
Data we care about is under section 'test results'?
sullen pollen
tacit basin
Data we care about is under section 'test results'?
Yes
tacit basin
Once we extract that. The RefX RefY and RefZ are in columns always?
lapis sequoia
is it better to use year column as one-hot encode or integer encoded
 sleek harbor
Is it just me or is something up with Google Colab? I can't connect, and I've been having this problem for days.. it's always "connecting", "allocating" or "initializing", but it never gets connected.. anyone else having this problem?
tacit basin
sullen pollen
```{GENERAL INFORMATION},,,,,,,,,,,,,,,,
A1,B1,C1,D1,E1,F1,G1,H1,,,,,,,,,
asdf,q...
for this example reading csv with skiprows=5 would work, are we saying that 5 should be hardcoded? why?
then selecting columns for plot is like that
x = df['RefX']
y = df['RefY']
z = df['RefZ']
I got this to work now. Your help made me think of other stuff wrong with my code. Thank you.
 lavish kraken
hasty mountain
Fun fact: I asked ChatGPT how the GPT loss works during pre-training stage, and ...
lavish kraken
hasty mountain
Fun fact: I asked ChatGPT how the GPT loss works during pre-training stage, and ...
Lmao 🤣😅🤣🤣
mint palm
here, when i did
zeros.cuda(device=7)
and checked zeros.device() it showed cpu and i had to do sim.cpu() to make it work, but why can .device() fail?
 lavish kraken
mild dirge
`pd.set_option('display.max_rows', None)` can be used to print all dataframes fu...
lavish kraken
mild dirge
`pd.set_option('display.max_rows', None)` can be used to print all dataframes fu...
Won't work unless you specify the number of rows
Pd.set_options('display.max_rows',100)
mild dirge
@lavish kraken
display.max_rows : int
    If max_rows is exceeded, switch to truncate view. Depending on
    `large_repr`, objects are either centrally truncated or printed as
    a summary view. 'None' value means unlimited.
 odd meteor
lapis sequoia
is it better to use year column as one-hot encode or integer encoded
odd meteor
lapis sequoia
is it better to use year column as one-hot encode or integer encoded
Honestly, when it comes to encoding technique, there's no one-size-fits-all solution. So it depends on the task you're trying to solve.
Try both and see what works best. But usually, I don't ohe my year column. After engineering new features from it, I'd subtract the column from the current year.
odd meteor
sleek harbor
Is it just me or is something up with Google Colab? I can't connect, and I've be...
Resolved this yet?
 heavy crow
just checked and works great for me
verbal venture
how much of loss functions should I know in ML
should I know the math, should I know what each one does, etc.
what is the suggestion
heavy crow
most of them are mathematically very simple, anything else you can learn when you need it 🙂
wooden sail
you should know when to use each one
each one makes different assumptions about the data, and enforces different conditions on the network
verbal venture
wooden sail
you should know when to use each one
yeah how do I know when to use each one
or how should I go about learning that
wooden sail
you'd have to read about them
you can probably find this info without learning all the math. idk where, cuz i usually check the math, but it should be somewhere
undone ocean
serene scaffold
what do you know about calculus, statistics, probability, and linear algebra?
- no calculus
- bit of statistics
- bit of probability
- if they're linear equations, yeah, if you're talking about something else, i don't even know what it is
serene scaffold
undone ocean
1. no calculus
2. bit of statistics
3. bit of probability
4. if they're linear e...
you should probably learn what derivatives are. and for linear algebra, I'm talking about array/matrix arithmetic.
undone ocean
serene scaffold
you should probably learn what derivatives are. and for linear algebra, I'm talk...
oh wait matrices?
i know a decent bit
serene scaffold
undone ocean
oh wait matrices?
i know a decent bit
do you know what shapes two matrices have to be multipliable?
undone ocean
maybe
do they have to have the same dimensions
serene scaffold
undone ocean
maybe
do they have to have the same dimensions
no. so you'll need to read about matrix multiplication.
then try watching the 3blue1brown video about neural networks.
sleek harbor
odd meteor
Resolved this yet?
Nope. Been having the problem for days, I have no idea what's causing the problem. Sometimes it even says "Busy", whatever that means..
hasty mountain
Uuuh... @wooden sail ? You said that backpropagating and optimizing my model per batch applies some error to my model, but this error has nice statistical properties...
80/100
Control Model Loss: 0.498676847666502    Control Model Accuracy: 91.55217742919922
Attention Model Loss: 3.893865793943405    Attention Model Accuracy: 85.35515594482422
Control Gradients: 0.014274598099291325    Attention Gradients: -2.3863913156674244e-07

90/100
Control Model Loss: 170.37092984467745    Control Model Accuracy: 43.34989547729492
Attention Model Loss: 3.6467398405075073    Attention Model Accuracy: 85.41361999511719
Control Gradients: 0.4731532037258148    Attention Gradients: 8.373864801569653e-08
What happened to my Control model?
class Control(nn.Module):
    def __init__(self):
        super(Control, self).__init__()

        self.conv1A = nn.Conv2d(3, 100, kernel=3, stride=1, padding=1, bias=True) # 28x28
        self.conv1B = nn.Conv2d(100, 100, 3, 1, 1, bias=True)
        self.conv1C = nn.Conv2d(100, 100, 2, 2, 0, bias=False) # 14x14
        self.conv2A = nn.Conv2d(100, 200, 3, 1, 1, bias=True)
        self.conv2B = nn.Conv2d(200, 200, 3, 1, 1, bias=True)
        self.conv2C = nn.Conv2d(200, 200, 2, 2, 0, bias=False) # 7x7
        self.neuron_out = nn.Linear(7*7*200, 8, bias=True)

        #self.sigmoid = nn.Sigmoid() # ---> Included in BCEWithLogits (in log version)
        self.LRelu = nn.LeakyReLU(0.2)
I got curious. This usually happens to my Discriminator in my GANs. I wasn't expecting a simple classifier to also have this problem
I mean...overfitting shouldn't blow up my loss like that, should it?
 little patio
I have a homework question and have no idea where to start with it. any advice would be appreciated. Thank you. Hyperion is an irregularly shaped moon of Saturn notable for its chaotic rotation. Its motion may be modeled as follows.
The orbit of Hyperion (H) about Saturn (S) is an ellipse with semi-major axis a and
eccentricity e. Let its point of closest approach (periapsis) be P. Its distance from the
planet, SH, as a function of its true anomaly (orbital angle, φ, measured from the line
SP) is therefore
r =(a(1 − e2))/(1 + e cos φ).
Define the angle θ to be that between the axis of the smallest principal moment of inertia (loosely, the longest axis of the moon) and SP, and the quantity Ω to be a scaled
rate of change of θ with φ (i.e. the rate at which Hyperion spins as it orbits Saturn) as
follows:
Ω = ((a^2)/(r^2))(dθ/dφ).
Now, it can be shown that
dΩ/dφ= −((B − A)/C)(3/2( −e^2)*(a/r)*sin[2(θ − φ)],
where A, B and C are the principal moments of inertia.
Use scipy.integrate.odeint to find and plot the spin rate, Ω, as a function of φ
for the initial conditions (a) θ = Ω = 0 at φ = 0, and (b) θ = 0, Ω = 2 at φ = 0. Take
e = 0.1 and (B − A)/C = 0.265. Make one figure with two panels (top and bottom) for parts a and b. Show ϕ out to 200 radians.
I edited. It was easier for me to post it and then edit as needed. Sorry for any confusion.
untold flicker
My code just stops compiling after 8/20 epochs. My other architecture did the same thing, but I ran it again and it worked. There's no error message or anything, it just stops.
I'm processing a lot of data to be fair but I don't get why it would just stop
 clever summit
Hello
I need help.
This time i wrote down the code: https://paste.pythondiscord.com/onumoqekiq
And it throws error:
---------------------------------------------------------------------------
IndexError                                Traceback (most recent call last)
~\AppData\Local\Temp\ipykernel_2976\3071694660.py in <module>
     72     #print(outputs[2].shape)
     73
---> 74     findObjects(outputs,img)
     75
     76     cv2.imshow('try',img)

~\AppData\Local\Temp\ipykernel_2976\3071694660.py in findObjects(outputs, img)
     49     #print(indices)
     50     for i in indices:
---> 51         i=i[0]
     52         box=bbox[i]
     53         x,y,w,h=box[0],box[1],box[2],box[3]

IndexError: invalid index to scalar variable.
i[0] is probably already the tuple bbox that you desire.
Scalar variable = single item.(like an array of shape [1,])
 visual marsh
i wanna get into ai, but have no idea where to start. any recommendations?
 winged bane
Hi all, do you share any problems/limitations you face while using Jupyter Notebook with your team?
serene scaffold
winged bane
Hi all, do you share any problems/limitations you face while using Jupyter Noteb...
if you try to use notebooks for things other than experimentation or demonstration, you will probably have problems, since notebooks aren't intended for things other than that. and anything that you do with a notebook that matters needs to be reproducible by running each cell in order once with a fresh kernel.
 nova vessel
winged bane
Hi all, do you share any problems/limitations you face while using Jupyter Noteb...
nova vessel
winged bane
Hi all, do you share any problems/limitations you face while using Jupyter Noteb...
I was working on a project in a jupyter notebook and merge conflicts are such a nightmare to deal with as a warning
you'll get a merge conflict if you have run the notebook and had different outputs in a cell, and you have to resolve them in the actual format of notebooks, which looks like this

instead of the nice rendered output
boreal gale
have you checked out nbdime?
i have used it before when i actually worked in a team, it's useful at times.
alternatively don't persist your notebook in *.ipynb with outputs unless absolutely necessary and use jupytext to store a *.py representation of your notebook for super easy git diff/conflict resolution.
 sterile wyvern
Several AI methods/models can be used to approach a grid search using supervised learning:
Random Forest: It can be used to perform a grid search by setting up a range of values for the hyperparameters and then testing each combination of hyperparameters on the training data.
Support Vector Machines (SVM): To perform a grid search using SVM, you can set up a range of values for the hyperparameters and then test each combination of hyperparameters on the training data.
Neural Networks: To perform a grid search using neural networks, you can set up a range of values for the hyperparameters, such as the number of hidden layers, the learning rate, and the activation functions, and then test each combination of hyperparameters on the training data.
Gradient Boosting Machines (GBM): You can set up a range of values for the hyperparameters, such as the learning rate, the number of trees, and the maximum depth of each tree, and then test each combination of hyperparameters on the training data.
K-Nearest Neighbors (k-NN): You can set up a range of values for the hyperparameters, such as the number of nearest neighbours to consider and the distance metric to use, and then test each combination of hyperparameters on the training data.
However, the choice of which method/model to use depends on the specific problem at hand and the characteristics of the data.
These are better than bayes optimisation?
 jovial glen
Hello everyone I have a question,(totatal noob in python and in ML) I tried googling this but no answers. I have images split into folders, how can i use the folder names as labels for the images that are contained in those folders for a CGAN?
jovial glen
mild dirge
What library are you using?
Tensorflow
mild dirge

TensorFlow
Generic image classification dataset created from manual directory.
That will save you a lot of work probably
tacit basin
Is loading large language model as much as possible into GPU memory and the rest into CPU for inference a standard thing to do?
mild dirge
Someone was just in the python help channels, and was running a 700GB model on a 3090. I think it's probably more conventional to split the model into multiple bins and load them in 1 by 1.
austere swift
tacit basin
Is loading large language model as much as possible into GPU memory and the rest...
there's a concept called cpu offloading which entails moving parameters that are lower priority to the cpu so larger models can fit on the gpu
but if your model is so large that only a small portion can fit on the gpu, the copy operations from gpu to system memory are so time consuming that it wouldn't be worth doing so
it's most commonly used in ZeRO-Offloading, which moves the optimizer and loss algorithms to the CPU
but the model itself should be kept on the GPU since the forward and backward operations would be far too slow on CPU
 dense fractal
want to install jupyter in my environment but it got stuck at 74%, any help
 tacit basin
austere swift
but the model itself should be kept on the GPU since the forward and backward op...
tacit basin
austere swift
but the model itself should be kept on the GPU since the forward and backward op...
Thanks. Are they functions for that say in transformers?
 tall tulip
I have one column with float datatype it have alot of NaN values but when I tried to check It doest recognized it.
data[data['comfort'] == 'NaN'] and
data[data['comfort'] == np.nan]
but it won't give me that values, this is the first time I'm facing this error. kindly can anyone tell me what's the reason?
 mild dirge
df[df['column name'].isna()]
 open storm
Hey guys. I am doing a project that does a document image processing to put labels on tokens in the same image as output. It uses LILT. Can some NLP pro here please help me ? Im on a deadline and I would be indebted if someone could help
serene scaffold
tall tulip
I have one column with float datatype it have alot of NaN values but when I trie...
as PcCamel alluded do, NaN always compares as False, even to itself.
austere swift
tacit basin
Thanks. Are they functions for that say in transformers?
Yes, that's what they're primarily used for. Microsoft's deepspeed framework (which is based on pytorch) already integrates the ZeRO offloading that I mentioned previously
DeepSpeed
ZeRO-3 Offload consists of a subset of features in our newly released ZeRO-Infinity. Read our ZeRO-Infinity blog to learn more!
Although this is just for offloading the optimizer states
offloading the actual model parameters is more complicated and I wouldn't recommend it since it would basically cripple your performance
tacit basin
austere swift
Yes, that's what they're primarily used for. Microsoft's `deepspeed` framework (...
That's great. Will read the tutorial. Thank you 💖
 wheat snow
Guys, could u give me an recommendation for like project direction ideas where to go next. I am currently really bored since im stuck with a project for a long time right now. I wanna start something new, but cant really get the hang on, off theese websites with their 15 Data analsys projects and stuff.
i mean analyzing personal data was quite interessting tbh, i think analyzing data that comes from you/ impacts you is more interresting than a random kaggle csv
 untold cliff
If i have a feature with values in a certain range like 0-1000, and i wanna scale it to the range 0-1, but i know that it can actually go up to 1200 for example, should i scale it to 0-1200 and then 0-1 ? or 0-1 directly and clip out of range values? or leave them be ?
 tranquil juniper
As a bachelors student studying statistics/economics what would be the best way of building competency for working in data science?
kaggle competitions? make up my own projects based on inspiration or tuts? Oreilly type books for python(these helped me with R)? Just improve my python skills?(leetcode, learn more bout datastructs, algos etc). I've already done some of these just felt like my focus was spread and maybe i could improve more if i knew which one/few to focus in on and where time is best spent. Any tips would be preciated
mild dirge
untold cliff
If i have a feature with values in a certain range like 0-1000, and i wanna scal...
It depends on what model you are using. It will likely not matter a lot, normally you normalize/standardize on the basis of your training data alone
If that means some test data will be a bit above 1, then most models can handle that just fine
untold cliff
Ok. Thanks!
hasty mountain
Uh... guys... can someone help me understand why my Transformer is having such a poor performance?
2/100    Current Iteration: 9000
Last Batch Loss: 0.0    Total Epoch Loss: 0.0
Gradients Average: -1.4872265470158506e-24

Generating Text...

Input Text: 'Quit my presence !' cried Montoni .
Target Text: 'Obey my order ,' repeated Montoni .
Generated Text: , , , , , , , , , , , , , , , , , , , , , , , , , , , , , , , ,
The input text have each word encoded, as well as the punctuation, but I'm having this problem with the loss...and apparently the gradients might be vanishing as well...
The code for training I'm using:
target, target_length = model.preprocess_dialogue(targetext, target_text=True)
target = target.squeeze(0)
words = targetext.split(' ')

possibilities = model(inputext, targetext) # (Batch, sequences, vocab_size)

possibilities = possibilities.squeeze(0)
possibilities = possibilities[0:target_length]

target = target[0:target_length]

loss = 0.

for i in range(len(possibilities)):
    loss += criterion(possibilities[i], target[i].long())

    loss = loss/len(possibilities)

    batch_loss += loss.item()

    loss.backward()

    optimizer.step()
any personal tips where i can learn from sources where i can validate my work by comparing to others more competent, i've heard bad things bout kaggle overfitting etc. Should i stick to the oreilly books and personal projects?
ok ty!, ive just heard that overfitting occurs sometimes and or other issues when people just try to get the highest accuracy score for the leaderboard, i was just curious if i would pick up any bad habits by picking up techniques etc from high scoring/rated notebooks on kaggle
untold flicker
If my models are losing to the baseline then it sucks right?
serene scaffold
untold flicker
If my models are losing to the baseline then it sucks right?
what do you mean by basline?
mild dirge
untold flicker
If my models are losing to the baseline then it sucks right?
Depends on what you use as baseline model
 grim patrol
I'm guessing if he's asking that question he's doing some assignment
in that case yes 🙂
untold flicker
I've made my first working model, I'm trying to figure out how much it sucks basically
I'm using mae as a loss function. Is there a way to get a percentage to see how far off the mark I am
Sorry If I'm being too vague about my problem. I'm doing a time series regression model
hasty mountain
I guess there's no way to get a percentage out of a regression task, the loss somehow does what you want by itself
Maybe you could play a bit with some distributions. Maybe mount a bell curve using as a central term the mean of the correct values, and then use the standard deviation of your predictions
Then you would be able to plot it and visualize it better
untold flicker
hasty mountain
Maybe you could play a bit with some distributions. Maybe mount a bell curve usi...
Thanks for this idea
hasty mountain
untold flicker
Thanks for this idea
You could also plot a line with your true values, and plot the scatter points with the predicted values...maybe even remark a band around the line to mark the margin-error, or something like that
Maybe this could be even better
 short talon
i got a question regarding pandas and dataframe manipulation.. i opened a python-help thread on it, is anyone on ?
 strong sedge
how do you reset the labels/column names ?

also how do I drop a particular row (not column) ?
strong sedge
nvm, found it
you can just set the column names
using
df.column = [] where [] is a list of column names
verbal venture
what determines the values inside a kernel filter for CNNs
wooden sail
verbal venture
what determines the values inside a kernel filter for CNNs
the data. the values are learned
verbal venture
how are they learned, through backprop?
wooden sail
yep
untold flicker
I've tried a bunch of different models on this massive data set and the simplest linear model performs so much better than any of the complicated ones. I don't get it
 molten delta
help i cannot change the token

 cedar sky
I have worked on a subtitle generator model using tensorflow in python. It is a model downloaded from tfhub and I run inference on it.
Now I need to deploy it as a docker container with gRPC API. It needs to input an uploaded video file and processes it through the model and return the subtitles. I need help with deploying it in docker. Especially on how to take the inputs from the user.
Can anybody here guide me about the same. Thank You!
 latent narwhal
Hi there
I'm building a recommendation system, for an eCommerce store, which sells beauty products, since we don't have enough selling data, we want to recommend the users data which fits them the best. for users have a quiz that they have to fill to about their skin, hair etc. And in the products, we have fields such as highlights and description which have information about those products.
I'm currently using TF-IDF Vectorizer to calculate cosine similarity between those fields and use that similarity to recommend products.
Is this the right way of doing this?
mild dirge
What would you call a dataset like Iris dataset, or a dataset that just has some features of a sample in each row? Just a numerical dataset or something?
As compared to for example an image dataset.
wooden sail
i wonder if there's a meaningful distinction. you can unwrap images and put them as rows in a matrix, then it's the same type of dataset as you described
people like splitting up the data into categories like "image" vs "tabular" data and group algorithms based on that, but nothing stops you from using image processing techniques on a table of data about flowers
bold timber
Can anyone enlighten me on what the difference between AutoModel and AutoModelForSequenceClassification in Hugging Face?
hasty mountain
Ugh... I really can't make my Transformer get out of Unga Bunga mode:
1/100    Current Iteration: 200
Last Batch Loss: 10.304804801940918
Gradients Average: -1.4432433204092376e-07

Generating Text...

Input Text: The Colonel 's brow darkened at this .
Target Text:  " You are not in debt , then ?

Generated Text: customer customer customer customer customer customer customer customer
The gradients average(the average value of all gradients in the first layer in my model, which is one attention head) has always the same value, no matter the input and the target, the batch_loss too, and the output is always the same word...rarely a second word that is also repeated without any logic.
I'm using a batch size of 1, but should the result be like this? I was expecting, at most, that at least the words being repeated would change in some cases.
 wide cosmos
is there anyone using tensorflow on m1 devices?
untold cliff
Does anyone here check for normality with qqplots and then applies a box-cox transformation to it for example depending on the results? Or do you think its unecessary to check for normality ?
jovial glen
mild dirge
https://www.tensorflow.org/datasets/api_docs/python/tfds/folder_dataset/ImageFol...
Thank you this saves me a lot of trouble, but i ran into an issue where it does not pick any images up, I have one data folder that is not split into train and validate folders, but the images are split into different folders depending on what they are depicting. Can that be the issue? the structure is like this: data/swords/fire_swords ; data/swords/ice_swords ; data/swords/light_swords etc.
mild dirge
Yeah each class should be in a separate folder
I don't think it will support nested folders
You could maybe try to unnest them to make it work
jovial glen
mild dirge
I don't think it will support nested folders
Yep i just split them same issue i believe its the nested folder problem , but if I want to do the CGAN then is the only option to go about is to label them by hand?
hasty mountain
hasty mountain
Ugh... I really can't make my Transformer get out of Unga Bunga mode:
```py
1/10...
Apparently I was commiting the heresy of not following the ritual of initialization... Xavier uniform init + warmup steps
Why does the model have to be so simple yet so complicated? It feels like Reinforcement Learning, with this suboptimal thing...
 undone ocean
how would i have a machine learning algorithm learn to play a game
 scarlet kite
@charred egret
undone ocean
undone ocean
how would i have a machine learning algorithm learn to play a game
with like wasd and all that
 young granite
scarlet kite
<@303873532863971330>
young granite
scarlet kite
<@303873532863971330>

Stack Overflow
How do I increase the space between each bar with matplotlib barcharts, as they keep cramming them self to the centre. (this is what it currently looks)
import matplotlib.pyplot as plt
import matp...
young granite
undone ocean
with like wasd and all that
works better with 3d coordinates i would assume
undone ocean
young granite
works better with 3d coordinates i would assume
what if i can't make the player go to coordinates
i mean like roblox or something
young granite
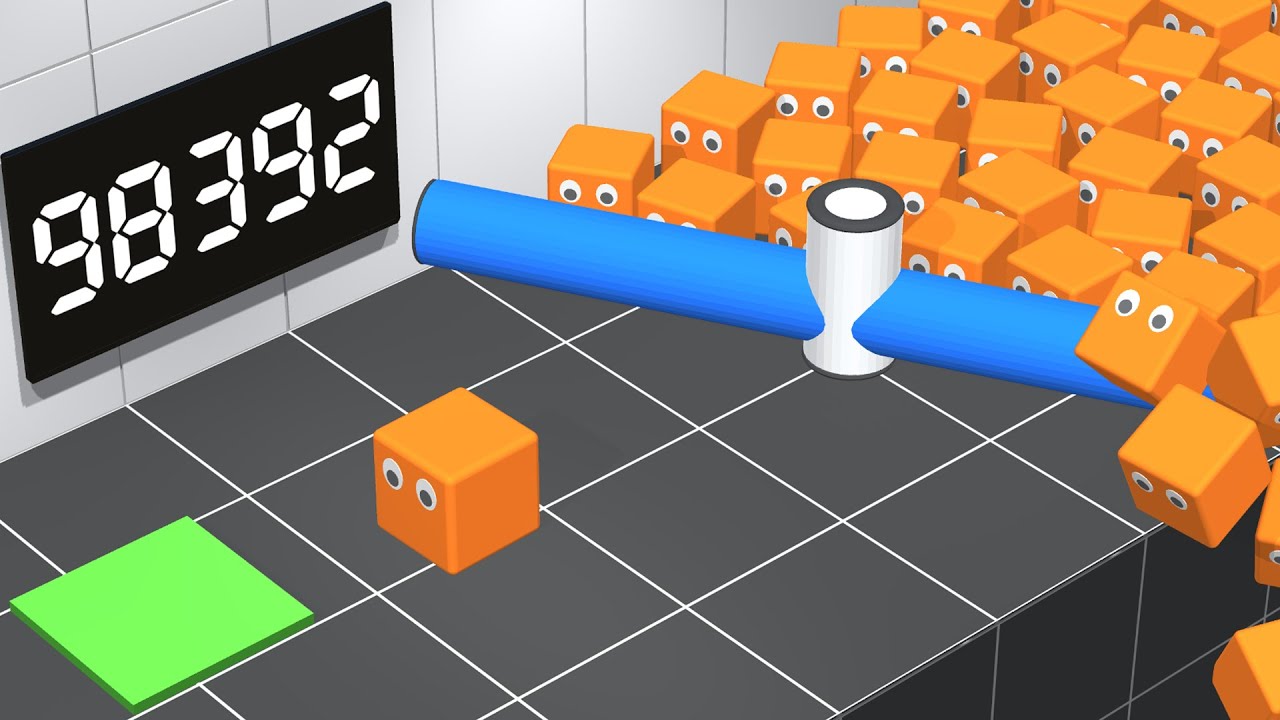
AI Teaches Itself How to Escape!
In this video an AI named Albert learns how to escape 7 rooms I've designed. The AI was trained using Deep Reinforcement Learning, a method of Machine Learning which involves rewarding the agent for doing something correctly, and punishing it for doing anything incorrectly. Albert's actions are controlled by a N...
im too old to know roblox but if u want an aimbot/bot which will be against their ToS noone on this sever will help u doing so
undone ocean
young granite
im too old to know roblox but if u want an aimbot/bot which will be against thei...
i don't want an aimbot
i want it to just play the game
young granite
botting is violating ToS
lapis sequoia
Hi
young granite
undone ocean
hm, so how would i do something like he did
if u know nothing about coding (thats what i assume, cause he stated his method in the headline) u need to start with basics
young granite
lapis sequoia
Hi
ola
undone ocean
young granite
if u know nothing about coding (thats what i assume, cause he stated his method ...
i know what deep reinforcement learning IS
just not how to code it
young granite
all pepes should use plotly cause of superiority 🗿
does one know if python has a 3D builder for something similar to this? (or do i need to use powerpoint)
 undone ocean
i know what deep reinforcement learning IS
just not how to code it
undone ocean
undone ocean
i know what deep reinforcement learning IS
just not how to code it
so how would i code something like it
young granite
how many nodes weights etc.
undone ocean
the worse part is there's rarely any tutorials that i see that actually are what i want
young granite
but as stated u need to know basics
undone ocean
i can code a bit i have python basics down for the most part
young granite
there will prob. be no tut. for ur 1:1 usecase
scarlet kite
thanks
undone ocean
young granite
there will prob. be no tut. for ur 1:1 usecase
so what do i do
young granite
undone ocean
so what do i do
i answered that question now plenty of times...
wooden sail
young granite
does one know if python has a 3D builder for something similar to this? (or do i...
you can probably build this yourself in matplotlib with a lot of effort. you'd have to do a fair amount of math to compute the projections on the xz and xy planes, and to offset the plots correctly
young granite
wooden sail
you can probably build this yourself in matplotlib with a lot of effort. you'd h...
yeh i want the shady copy&paste approach so its fits my plot scheme, thought there might be a lib for that similar to PS or PP
 scarlet kite
import numpy as np
import scipy.stats as stats

mean = np.mean(true_count_for_graph)
std = np.std(true_count_for_graph)

plt.hist(true_count_for_graph, bins=100, density=True)
plt.title(f'True count occurences ({num_decks} decks)')
plt.xlabel('Count')

x = np.linspace(mean - 4*std, mean + 4*std, 100)
pdf = stats.norm.pdf(x, mean, std)
plt.plot(x, pdf, color='purple', linewidth=2, label='Std Bell Curve')

plt.legend()
plt.show()

is it possible to make this more visually appealing
scarlet kite
its more because the data is so spread out that the graph seem weird
scarlet kite
yeah just saw that thx
wooden sail
scarlet kite
its more because the data is so spread out that the graph seem weird
that's because you're using the wrong distribution as a reference
that data looks laplace distributed, not gaussian
young granite
wooden sail
that's because you're using the wrong distribution as a reference
i think he refers to the bar charts not being separated
at least that was his prior question
scarlet kite
@wooden sail didnt know that how do i plot the lapalce distribution
 young granite
edd reads people like comics
wooden sail
with great pleasure?
scarlet kite
👍
wooden sail
hardly, but i do enjoy it
young granite
might helping me clarify a thought regarding FT?
wooden sail
fourier transforms? go ahead
young granite
im currently studying the Fourier Series and Transformation's:
In my textbook i read that FT is for non-periodic functions but in the example they use a cosine function.
So i understand the integral is from -inf to inf and therefore i "can" use all freq. but not necessarily have to.
I thought non-periodic functions are for DFT only.
young granite
and FFT
wooden sail
FFT is DFT, just implemented cleverly
young granite
+1
wooden sail
so yes, fourier transforms are for non-periodic functions
as you noted, there's an integral from -inf to inf involved. that integral has to converge
young granite
so for finite functions?
wooden sail
functions that extend infinitely do not have fourier transforms
the condition is technically called "square-integrable"
you might find this in your book as having "finite energy" or "finite power"
finite energy means the function goes down to zero eventually
young granite
for me a cosine of a given freq. and a given time is a finite function which would be discrete data?
thats the main point where i struggle
wooden sail
cosines extend infinitely in time
young granite
cause i dont see diff in a finite dataset and a finite cosine
young granite
wooden sail
cosines extend infinitely in time
ofc but if i set parameters accordingly
wooden sail
there is no parameter of a cosine that will make it finite
you can only achieve that by multiplying it by something else
young granite
but the resulting data would be
wooden sail
yeah, because you multiplied it by something else
a cosine extends infinitely. if it's finite, you did something else to it and it's no longer just a cosine
young granite
i mean a cosine like this is ranged from 0 to 2
 wooden sail
yeah, that's no longer just a cosine
wooden sail
depends on which transform you want to apply
young granite
in the textbook they use the FT
wooden sail
dft actually enforces periodicity both in time and frequency domain
young granite
but thats where i struggle to catch
wooden sail
can you show how they write it in your book?
there's a trick using distributions to do all 4 transforms with the same integral
but my bet is that they multiply the cosine by a rectangular window function
then the spectrum is no longer a dirac delta, but rather a delta convolved with a sinc
young granite
But this means that we now need for the description and representation of a non-periodic function f(t) all harmonic oscillations in the angular frequency range from
w= -inf to w= inf. The frequency spectrum is therefore no longer discrete as with a periodic function, but continuous!
wooden sail
young granite
But this means that we now need for the description and representation of a non-...
exactly
and that is exactly what happens
the spectrum of a chunk of a cosine extends infinitely
that was my point. it's no longer a cosine
the spectrum is a continuous function and it goes on to infinity
young granite
this however starts and ends at 2
 wooden sail
if you take a fourier transform of exactly what you have there, representing it as a continuous function, then you have a non-periodic continuous function
no showing it in the graph is the same as setting it to 0
the only way of representing a continuous cosine correctly is to treat it as a cosine. then it is periodic, and we can exploit that in a fourier series
if you do a fourier transform and you take a finite time duration, it's equivalent to saying the rest of the signal is zero
the definition of the fourier transform integrates either from -inf to inf or from 0 to inf if you do a 1-sided transform. the only way this is equivalent to an integral from 0 to some value T (for the 1-sided case) is if the function you're integrating is 0 for all t > T
i.e. taking a finite duration and integrating that is equivalent to taking your f(t) and multiplying it with a rectangular window w(t). then you can use the convolution theorem to see the spectrum is the convolution of the spectrum of the cosine (a dirac delta) and the spectrum of a rectangular window (a sinc)
young granite
i mean i did the graphical approach like 3blue1brown but its still not clear to me
 wooden sail
what am i looking at
young granite
i understand the principle
young granite
wooden sail
what am i looking at
the cosine function from above wrapped around a unit circle
wooden sail
ok. well, already there you see it's not periodic
there's a jump with no signal
so that's not a cosine anymore
young granite
edd i do get that 😄
my problem is that why i use a non periodic function for FT when its stated to be for periodic functions
wooden sail
FT is for non-periodic funcs
young granite
FS is for periodic correct?
wooden sail
yep
young granite
ok and DFT for Datapoints where i think it could be something with sin/cos
wooden sail
but if you're doing this on the computer, you're using the DFT. so this will take your signal and make it periodic for you, whether you like it or not
young granite
wooden sail
but if you're doing this on the computer, you're using the DFT. so this will tak...
u mean when i call np.fft or something?
wooden sail
yep
it's never done explicitly, it's just an implication of the procedure the fft does. it uses a finite set of discrete frequencies
young granite
im aware of that yes but thanks
wooden sail
what's the problem then?
young granite
misleading book phrase
wooden sail
what does the book say?
young granite
i questioned why that cosine function wouldnt be finite...
wooden sail
that'd depend on the wording of the book around it
maybe the plot is just a sample of the continuous function that can be evaluated at all t
what exactly does the book say
wooden sail
where does the book come into play
young granite
wooden sail
where does the book come into play
always 😄
i do read and try to code it for visual explanation
wooden sail
is the book talking about fourier transform or dft
you can't do fourier transforms on the computer using ffts
you need special CAS software for that
young granite
wooden sail
is the book talking about fourier transform or dft
f = 3.0
t = np.arange(0,2.001,0.001)
cos_wave = np.cos(2*np.pi*f*t) + 1
#cos_wave = 2*np.cos(2*np.pi*f*t) + 5*np.cos(2*np.pi*f*2*t)

# position on circle as complex number
r_cord = []
min_freq_range = 0.0
max_freq_range = 10.0
# circle frequencies
sf_list = np.arange(min_freq_range, max_freq_range, 0.1)
for sf in sf_list:
    r_cord.append([(cos_wave[i], -t[i]*sf*2*np.pi) for i in range(len(t))]) # eulers function

# for each circle position split in real and imag part -> complex coordinates
x_cord , y_cord = [], []
for l in range(len(r_cord)):
    x_cord.append([amp*np.cos(theta) for (amp, theta) in r_cord[l]])
    y_cord.append([amp*np.sin(theta) for (amp, theta) in r_cord[l]])

# first only take x coodinate for position and leave y aside for simplicity
mean_list = []
for l in range(len(r_cord)):
    x_mean = np.sum(x_cord[l])
    mean_list.append(x_mean)
this is a snipped of my code
wooden sail
is the book talking about fourier transform or dft?
young granite
FT
wooden sail
ok. your plot will never look like what the book shows
young granite
young granite
this however starts and ends at 2
so this could be done by FT but is processed by DFT?
wooden sail
FT and DFT are different things
young granite
i know
wooden sail
you still haven't told me what exactly the book says
young granite
FT is from inf to inf
young granite
wooden sail
you still haven't told me what exactly the book says
in which aspect
wooden sail
ok, let's take a step back.
wooden sail
young granite
this however starts and ends at 2
what about this plot confuses you
young granite
for me its non periodic and finite
wooden sail
indeed, if you only take that part of the signal, that's true
young granite
and if i do a finite FT its a DFT
wooden sail
no
young granite
why is that 😄
wooden sail
FT and DFT are different things
young granite
but i have a discrete set
wooden sail
then you can't do a fourier transform 😛
young granite
mhhh
wooden sail
you can do a DFT, but not an FT
technically, you can also do a discrete time fourier transform here
so you get sampled time, but continuous frequency
young granite
f = 3.0
t = np.arange(0,2.001,0.001)
cos_wave = np.cos(2*np.pi*f*t) + 1
so this is the origin for the plot
which means i got an array size of 2001
and thats a discrete dataset isnt it?
 strong meadow
hi
wooden sail
yep, in time
strong meadow
i would like to start in data science
what do you recommend I follow to start
some roadmap?
young granite
wooden sail
yep, in time
and cause DFT isnt a time function its FT?
i dont get where the difference is made
wooden sail
young granite
and cause DFT isnt a time function its FT?
what?
young granite
DFT is time discrete data so my function
wooden sail
FT is for continuous time domain signals with finite energy. this yields a continuous spectrum
FS is for periodic, continuous time domain signals. yields a discrete spectrum
DTFT is for discrete time domain signals. yields a continuous, periodic spectrum
DFT is for discrete time domain signals. this makes the spectrum periodic and discrete, and ALSO makes the time domain periodic implicitly
you have discrete time domain data, so you can apply the DTFT or DFT
young granite
but i could increase the freq. range instead of [0,10] to [0,5] thats only possible for FT isnt it?
In DFT i got same amount of Freq. as n of datapoints
wooden sail
the spectrum in the FT and FS goes off to infinity, you can evaluate it wherever you want
for the DTFT and DFT, the spectrum is periodic. the largest value you can represent is the sampling frequency/2 (the nyquist frequency)
young granite
wooden sail
the spectrum in the FT and FS goes off to infinity, you can evaluate it wherever...
indeed and thats what i do with the cosine function i showed u
wooden sail
young granite
indeed and thats what i do with the cosine function i showed u
not if you do a DFT 😛 the spectrum will wrap around, as it becomes periodic
young granite
ah this part:
min_freq_range = 0.0
max_freq_range = 10.0
# circle frequencies
sf_list = np.arange(min_freq_range, max_freq_range, 0.1)
for sf in sf_list:
    r_cord.append([(cos_wave[i], -t[i]*sf*2*np.pi) for i in range(len(t))]) # eulers function
that you get this plot is already tell-tale sign that something went wrong. look at all the sidelobes. your spectrum got convolved with a sinc function
young granite
wooden sail
that you get this plot is already tell-tale sign that something went wrong. look...
its a pseudo FT with a center of mass
wooden sail
from the moment you're using samples of a cosine, anything you do will be a DFT or a DTFT
it's a consequence of the sampling operator
even if you TRY to do a fourier transform, the result will be periodic in the frequency domain, since you multiply your function with a train of dirac deltas
this immediately turns the spectrum into a sum of complex exponentials, and it is therefore periodic
wooden sail
i would suggest the alternative, then
forget that there are 4 transforms. there is only 1
the fourier transform
but the caveat is: if your function is discrete in time, it has been multiplied by a train or delayed dirac deltas
you have to use the sifting property of the dirac delta and the shifting property of the fourier transform
if you're also careful about continuous time - periodic signals by averaging over all periods, the same integral gives you all 4 transforms
it's just a consequence of the process of sampling
young granite
🤯 i wanted to nicely layout that topic in all 4 parts... guess im too stupid for that hahaha
iron basalt
It's important to remember that a lot of math has continuous stuff, but your computer is discrete (unless we are talking about a CAS).
And that changes things.
wooden sail
you can only build an approximation to the FT by using the DFT, sadly. and to get this approximation right, you already need to know the math, which is what you're trying to understand right now. so trying to make plots with the FFT is only going to confuse you
iron basalt
The input / type of input to a function changes its behavior / type of output.
wooden sail
if you wanna do fourier transforms of simple signals, i suggest you try wolfram alpha, because you will need CAS to do this. otherwise, as squiggle says. as soon as you consider an array of samples instead of a continuous signal, you IMMEDIATELY changed its behavior and how it transforms
young granite
wooden sail
if you wanna do fourier transforms of simple signals, i suggest you try wolfram ...
i see what u mean by that thanks for ur time and effort!
iron basalt
When the behavior is changed, we catalog these "new" functions with different names (hence the many different Fourier Transform related functions).
Because programming requires precise terminology to make sure we are talking about the exact same thing we use these different terms or our understanding of the spec. will mismatch (what input and output do we expect?).
wooden sail
in the pdf i linked, the first equation shows this definition, which is admittedly a hand-wavy trick. it illustrates the point though. if you try to forget that you should use DTFT or DFT for discrete-time signals, you can't get away with it anyway. the discrete time signal is NOT the original signal - it has been multiplied by something else
 wheat snow
wooden sail
in the pdf i linked, the first equation shows this definition, which is admitted...
wheat snow
wooden sail
in the pdf i linked, the first equation shows this definition, which is admitted...
im already afraid seeing Sigma again
 young granite
wooden sail
https://tenor.com/view/megaman-stare-sigma-gif-11538164
young granite
wooden sail
https://tenor.com/view/megaman-stare-sigma-gif-11538164
i could just swap title of my FT chapter to DFT and be good to go right 😄 🗿
wooden sail
i suggest you take your time to slowly digest this
if you plan on doing any processing of signals in the future, this is the sort of stuff you need to be able to do with your eyes closed
young granite
im so burned out for today hahaha
lusty lotus
how can i perform one-hot encoding for a chess board? im using python-chess
 frozen girder
Hi! If in Pandas i use astype() in a column with a bunch of ints, every 0 will become a false and every other number will be a true right? Is this how it works?
 agile cobalt
um, have you tried testing it yourself?
!e ```py
import pandas as pd
import numpy as np
se = pd.Series(np.arange(-5, 5), index=np.arange(-5, 5))
print(se.astype('bool'))
@agile cobalt :white_check_mark: Your 3.11 eval job has completed with return code 0.
001 | -5     True
002 | -4     True
003 | -3     True
004 | -2     True
005 | -1     True
006 |  0    False
007 |  1     True
008 |  2     True
009 |  3     True
010 |  4     True
011 | dtype: bool
... (truncated - too many lines)
Full output: https://paste.pythondiscord.com/uxefokumiy.txt?noredirect
frozen girder
Yes i've tried it but maybe there was a case were that didnt worked like that. Thanks!
hasty mountain
hasty mountain
Why does the model have to be so simple yet so complicated? It feels like Reinfo...
Now I just have to discover how many warmup steps my model require to not fall into suboptimal after this warmup ends...
but what if I simply apply a certain optimizer to the self-attention layers and another one to the output layer? 
verbal venture
so is the difference between the testing and training set the testing set is 100% validated data, while the training set should have a mix of data + noise within the data? for the model to fit best to?
scarlet kite
what are the differences in the Laplace curve vs bell curve.
basically what do they each say about the data?
serene scaffold
scarlet kite
basically what do they each say about the data?
what do you think?

 vocal fractal
anyone intrested in kmean clustering algo in think or swim here is a link - Support and Resistance On Price (1 variable) with K means clustering using 3 clustershttp://tos.mx/nTxO0Mm
scarlet kite
serene scaffold
what do you think?
one has more tails with less data near the mean?
 hidden patrol
hi
 plucky bolt
Just came here to tell you guys thanks for the suggestions and recommendations weeks ago. I am enjoying learning Data Science/Machine Learning along with Python. I still am motivated and looking forward to learning more.
 proven vector
Anyone ever run into a python algorithm or package for ranking job applicants against ideal candidates?
queen cradle
untold cliff
Does anyone here check for normality with qqplots and then applies a box-cox tra...
My opinion (only an opinion) is that you should avoid normality assumptions when possible. Real data is never perfectly normal. It may be that you don't have enough data to distinguish its distribution from normal, but it's never going to be quite right. If you can use non-parametric methods, this problem goes away.
If you really do want to check for normality, I think Q-Q plots are a great way to do it.
My opinion is that, if you are interested in explaining your data, then you should usually avoid Box–Cox transformations, and in fact most transformations, unless there is a good reason why that transformation makes sense for your data. (E.g., you might want to convert amplitudes to decibels.) But if you want to predict new data and don't care about interpretation, then they're fine. Occasionally it even happens that such a transformation greatly improves your model for reasons you can't explain.
 mild moth
 flint gull
anyone wants to help this poor animal?
flint gull
anyone wants to help this poor animal?
go ahead and ask your question ~ you'll have a better chance of getting answers that way
flint gull
mild moth
go ahead and ask your question ~ you'll have a better chance of getting answers ...
Here is the csv file for the question
The question asking to plot 3 axis with x=Temperture, y = luminosity and third axis = color base on the stars
I tried and tried and can't figure out how to change the color axis base on the stars type
 thorn swift
i made a little interactive jupyter notebook widget for a model demo using sklearn, does anyone know any cheap or free service for hosting it to the public?
austere swift
you can put it in colab and give people the link so they can run it
thorn swift
austere swift
you can put it in colab and give people the link so they can run it
i forgot about that, thanks!
wooden sail
scarlet kite
one has more tails with less data near the mean?
yep. that'd be the gaussian
lusty lotus
despite the (relatively) clear description of the warning i can't seem to fix it.
https://pastebin.com/Ktx8ptQR
/Library/Frameworks/Python.framework/Versions/3.11/lib/python3.11/site-packages/torch/nn/modules/loss.py:536: UserWarning: Using a target size (torch.Size([1])) that is different to the input size (torch.Size([832])). This will likely lead to incorrect results due to broadcasting. Please ensure they have the same size.
Pastebin
Pastebin.com is the number one paste tool since 2002. Pastebin is a website where you can store text online for a set period of time.
lapis sequoia
I am a normal distribution
hidden patrol
hi
mint palm
lapis sequoia
I am a normal distribution
what are your properties?
lapis sequoia
mint palm
what are your properties?
I have about 68% of my data within 1 standard deviation from the mean.
I am cool
Wish everyone could be like me
open storm
Is there a way to do processing faster? I am using GPU but free resource gets depleted and my processed files go because runtime is over
 untold cliff
If i have a dataset with 50 features for example but my final model uses only 30 of them, when in production, should i write a code to select only those 30 features? Or the model should be feed the relevant features only ?
 real anchor
Hello guys, I have some kind of problem with Tensorflow. She says that I do not have Nvidia, but I know that I have it, I also installed (CUDA, cudnn). But it still says that it is not there and does not find the video card.


 mild dirge
Did you do what I asked in #algos-and-data-structs @real anchor are they added to path?
mint palm
lapis sequoia
I have about 68% of my data within 1 standard deviation from the mean.
i want to know more about you. Can you tell how i can identify you? from graphs or other methods?
real anchor
Yes


 winter drift
Is anyone experienced in openai gym
lapis sequoia
Guys how does string works?
 teal epoch
zsh: illegal hardware instruction python3 -c
what does this error mean
i can't install tensorflow
serene scaffold
winter drift
Is anyone experienced in openai gym
ask your actual question; don't ask to ask.
serene scaffold
lapis sequoia
Guys how does string works?
this is a general python question, but strings are just sequences of characters. try asking your complete question in #1035199133436354600
teal epoch
could someone please help me, i've asked in #1035199133436354600 as well
winter drift
serene scaffold
ask your actual question; don't ask to ask.
I'm trying to get my pygame test game into an open ai gym and I can't figure out how to get the event loop in the main loop to be actions
serene scaffold
winter drift
I'm trying to get my pygame test game into an open ai gym and I can't figure out...
sounds like this is more about #game-development than data science
winter drift
serene scaffold
sounds like this is more about <#660625198390837248> than data science
The game development is already done
The ai part is the part I need help prepping for
I need the game to be incorporated to a gym environment
And a step function is essential but my code says```
while self.RUNNING:
for event in pygame.event.get():
print(event)
if event.type == pygame.QUIT:
pygame.quit()
sys.exit()
pressed = pygame.key.get_pressed()
if (pressed[K_w]):
self.lp_y -= 3
elif (pressed[K_s]) :
self.lp_y += 3
if (pressed[K_UP]) :
self.lp_y -= 3
elif (pressed[K_DOWN]) :
self.lp_y += 3
)```
Instead of if action == key press it's event for pygame
However I know for a fact it can be done
 quartz thicket
I'm really off the deepend here. I'm trying to figure out an equation based on a few sample points and have discovered scipy's curvefit and am going to give that a shot. However, the 'error bars' I have aren't expressed in terms of sigma. What I instead have is a min and max for each sample. So I might have a sample at .5 with a min of .2 and a max of .6 (the sample isn't always right in the middle) does scipy have a function that can convert that sort of data into a value I could plug into curve_fit's sigma variable?
wooden sail
not really, unless you know the distribution of the error
the min and max are not enough to statistically characterize the error
quartz thicket
That's what I was afraid of. This project is not anything really important, so I would be totally satisfied with using something that could give an approximate value.
Like, I'd be willing to just assume a normal distribution and use that rule of thumb, but I don't think I can do that unless the value I have is the midpoint beteween min and max?
wooden sail
well
if all you have is the 3 points, there's more than one curve that could pass through them 😛
you can make a lot of assumptions
quartz thicket
Oh yeah. I have more than 3 points. But each point has a min and max, not a min and max for the whole range of points
wooden sail
e.g. let's say the min and max are each 1 or maybe 2 standard deviations away from the mean. this already gives you sigma
no, i mean, for each point on the curve
 twilit dove
hi
wooden sail
every single point on the curve has a statistical distribution
those are the sigmas you give to scipy. you ideally pass the covariance matrix, which includes the variance for every single point on the curve, which in general is different for each point
this means there's a probability distribution for every single point on the curve
this is what scipy expects from you: second order statistics for the whole curve (for every single point you have data at)
wooden sail
wooden sail
no, i mean, for each point on the curve
going back to this. on second thought, if the min and max are true, so that the data really can't exceed those values. we can assume something like "those values are 5 or 6 sigma from the mean"
then wave your hands and yell "central limit theorem" and assume the data is normally distributed at each point
you can't construct a full covariance matrix, so you'd have to add in the extra condition that the noise for each sample is independent, so that the covariance is diagonal
quartz thicket
I was following up until covariance 😆 Been years since I took stats.
quartz thicket
I think one of the issues is that my sample isn't centered between the min and max. If I assume one of them is 5 sigma away, the otherone wouldn't be, would I average those assumptions, or could I assume something like a skew-normal distribution instead?
wooden sail
quartz thicket
I think one of the issues is that my sample isn't centered between the min and m...
that's ok because the data is random. you have no guarantee that the samples you measure are at the mean. in fact, that happens with probability 0
that's the whole point of what curve fit does and why you pass the covariance to it. you tell it how the data is distributed and show it examples of what the data looks like. it computes a curve that best explains the data
if all of the data was at the mean, that would be the same as having no noise. then you don't need the sigma at all 😛
what i would do is take (max - min)/10 = sigma for each sample. this is equivalent to saying the data is normal distributed, and the min and max values are at 5 standard deviations from the mean (so that values outside that range happen less than 1% of the time). you have one sigma per sample, and in general they're all different. so you compute all of the (max-min)/10 and put them in a numpy array, call it sigmas. then pass this to scipy
(this is a pretty strong assumption, but you don't have much else. you could alternatively assume the data is uniformly distributed and use that to compute the variances or standard deviations instead)
quartz thicket
wooden sail
what i would do is take (max - min)/10 = sigma for each sample. this is equivale...
Oh yeah, that's like the uh... range rule right? And I could experiment with different values in the denominator if I'm getting strange reults
wooden sail
i had never heard of the "range rule", but cool
apparently 4 is more commonly used. that's a less strict condition, makes sense
how did you get this min and max?
quartz thicket
It's a different method for each sample.
To improve my python skills I'm attempting to recreate a more modern version of that ancient 1970s star trek terminal game. I thought writing a function to convert warp speed to au/hr would be simple, but it turns out the data for warp speed is very inconsistent. So a lot of my samples are coming from places like star trek wikis. It's just a good excuse to get better at python and scipy
quartz thicket
Right, that's why I'm willing to make some assumptions, so long as I get a nice smooth curve in the end
Thanks for the help!
 tidal bough
wooden sail
what i would do is take (max - min)/10 = sigma for each sample. this is equivale...
tidal bough
wooden sail
what i would do is take (max - min)/10 = sigma for each sample. this is equivale...
and the min and max values are at 5 standard deviations from the mean (so that values outside that range happen less than 1% of the time).
I'm pretty sure you missed some zeros here 😛
>>> 1-scipy.stats.distributions.norm.cdf(5)+scipy.stats.distributions.norm.cdf(-5)
5.733031438027284e-07
i forgot the square, i guess
i was thinking e^-5 lol
tidal bough
ah, makes sense
undone ocean
are there resources i should check out to learn the data stuff
quartz thicket
So I've got a list of X, Y and Sigmas that match up and are ready to be fed into curve_fit. However, some of my samples have no sigma value, and I don't even have a min/max to use to estimate for them. What should I set their sigma to so that I can still use the other data? The docs aren't clear about it. Will None work?
And to be clear, I don't mean that these samples are 100% accurate. I don't expect the final curve to pass through them.
tidal bough
Why don't they have a sigma value? Are they the only sample in their "dataset", so you can't estimate their variance?
quartz thicket
tidal bough
Why don't they have a sigma value? Are they the only sample in their "dataset", ...
essentially yes
tidal bough
You could use the average sigma of the entire dataset (maybe multiplied by some constant like 2 so that scipy pays these weird points less attention), or just drop them
quartz thicket
I can't drop them. I have so little data to work with to begin with.
They're just educated guesses so to speak.
wooden sail
as reptile says, you can give them a scaled value
maybe the worst one time some factor
that's like saying "consider this data point, but maybe not too much..."
tidal bough
As an intuition pump, when you don't pass sigmas to curve_fit at all, that's equivalent to considering all points to have the same sigma 🙂
wooden sail
are you familiar with inner product spaces?
quartz thicket
What if I have 2 points at the same X value? Can I use that to narrow it down any?
wooden sail
you could use a scaled up version of the distance between the two y values for that x
quartz thicket
tidal bough
As an intuition pump, when you don't pass `sigmas` to curve_fit at all, that's e...
Yeah. The issues I'm dealing with are that I don't have a lot of data, and some of it I'm much more confident about than others. And I'm tryin to use these intuitions to get a better result of of curve_fit
tidal bough
wooden sail
you could use a scaled up version of the distance between the two y values for t...
Yeah, e.g. replace them with their average and use ~half their difference as the sigma for that point
quartz thicket
wooden sail
are you familiar with inner product spaces?
Not yet. 🙂
wooden sail
well. the sigma we're suggesting you pass to scipy is a vector. what scipy will do with this is consider the reciprocal of each entry in that vector (1/sigma), and use this to weight how good the fit is
values divided by a larger sigma are less important, and can be allowed to have mistakes because of this
hence why reptile suggests you take a known sigma and scale it up
in the degenerate case, you let sigma go to infinity. that's the same as what reptile also suggested earlier: drop the point cuz we know nothing about it
quartz thicket
Ok, thanks again. I'll use a known sigma (The average of the whole list I guess] and scale it up by some factor(Probably just guesswork here?), except where I do have X values that line up, I'll do the difference and divide by 2.
wooden sail
this sounds like a super fun project btw. i like it
you could do cool stuff like see how the fit changes if we change the assumptions. scale up the variances, maybe choose different distributions instead of gaussian
very nice
quartz thicket
wooden sail
you could do cool stuff like see how the fit changes if we change the assumption...
I'm still in the data gathering stage, but will likely get to start tweaking that sort of stuff down the line
scarlet kite
I've got a distribution like this probably because I've got a lot of data points that equal 0. is there a better way of showing the data?
 tidal bough
You could look at the ECDF, and compare to the Laplace CDF.
That, unlike a histogram, wouldn't be sensitive to how the bin edges are placed.
scarlet kite
thx ill try it out
I get this error when using scipy for ecdf
AttributeError: 'Stats' object has no attribute 'ecdf'
quartz thicket
tidal bough
Yeah, e.g. replace them with their average and use ~half their difference as the...
Should I instead use DOUBLE the difference, if the values I'm working with are between 0 and 1?
tidal bough
quartz thicket
Should I instead use DOUBLE the difference, if the values I'm working with are b...
No, half the difference is equal to the distance between the resulting averaged point and its two parents.
A way to show this is right is noting that a fair coinflip distribution (Bernoulli distribution, if you want to be fancy) (that is, a or b with equal probability) has a standard deviation of, indeed, |b-a|/2 (and, of course, a mean of (a+b)/2) - so these should be the parameters of the normal distribution you replace it with.
quartz thicket
tidal bough
A way to show this is right is noting that a fair coinflip distribution (Bernoul...
Ah I see, thanks, that does makes sense. Great example!
wooden sail
undone ocean
?
you can check through the pinned messages. a handful of books are referenced there
for data science, the bread and butter is statistics, linear algebra, and calculus on the theory side, and modules like numpy and pandas on the python side
hasty mountain
Can someone give me an idea on how to visualize 1-D data?
The outputs of my model are vectors that measure the information entropy of the inputs, but I'd like to visualize them somehow...preferably without having to reshape them into 2-D arrays
tidal bough
perhaps a bar chart?
hasty mountain
How would I organize it? What would be in the X axis?
The ideas I have are providing some strange results...

Oh...this one seems better...I guess...

You know what? I think I figured it out. Thanks!
quartz thicket
Ok here's a long shot. I'm still working on collecting data for my curve_fit, but I have one piece of data that I'm not sure if I can use but would really really be helpful. My X and Y values start at (0,0) and end at 1,1) but at (1,1) I also know what the slope or 1rst derivative is. (because I'm connecting it piecewise up to a different curve that goes from 1-9. Is there any way I can pass that information into curve_fit()?
young granite
what are good job keywords to filter for data science job offers?
frigid lion
hey guys i wonder how much of math i need to think of finding some job related to machine learning
i'm studying computer science
im not the best of the best at math but i pass all exams without much problems but still not sure if it will be enough for me
just how important is actually understanding deeply the mathematics to be good at it
serene scaffold
frigid lion
just how important is actually understanding deeply the mathematics to be good a...
you do need to understand the math, including calculus, probability, statistics, and linear algebra. but you do not need to do the calculations by hand. you should also take as many AI-related as you can while you are in school.
frigid lion
serene scaffold
you do need to understand the math, including calculus, probability, statistics,...
ai related what?
serene scaffold
frigid lion
ai related what?
sorry, AI-related courses.
frigid lion
oh im at the moment doing one on udemy and find it quite good
also like im always able to do the calculations im not bad at doing the math but sometimes i have problems with actually understanding the background of some things
how problematic could it be
also maybe if i can do the calculations do you think that this is something that just may need just a bit of training to understand it more deeply
serene scaffold
keep at it. you are not incapable of understanding how the math works.
frigid lion
i just never really bothered to try and understand the math so deeply but for past year and half whole data science field started to impress me a lot and im very interested in how all of it works
i just know that even doe i already passed the exams from for example calculus or linear algebra i would definitely need some revision of these things to use them again
serene scaffold
then you should review it
frigid lion
im also corious how much of it i actually need to know or just like have some idea of what these things are so i can understand the machine learning concepts
 pastel verge
guys, i have a question. I'm building an application based on streamlit and pydeck. When I run the code on jupyter nb just trying to show the pydeck chart, it goes well, no errors. But when I do it on a python script, trying to run on streamlit localhost, it gives an BIG ERRR like "Cannot"
frigid lion
serene scaffold
then you should review it
so u think im quite good to go for it?
serene scaffold
frigid lion
im also corious how much of it i actually need to know or just like have some id...
All of machine learning is just math.
frigid lion
hmm i wonder now ;d
like its very interesting to me i love hearing about these algortthms and concepts but jsut scared i may get lost further down the path
ive never been so interested in sth before but just a bit scared i will not handle the math at some point
but i guess its not sth thats impossible to learn right? hah
hasty mountain
just stay away from diffusion models
 warm copper
Reeee
Pyspark needs updating
It’s not fully supporting python 3.11
Wtf

Meanwhile 👀👀👀
queen cradle
scarlet kite
I've got a distribution like this probably because I've got a lot of data points...
For visualization purposes it's just fine to remove zero. You should remove the zeros when fitting your Laplace distribution, too.
queen cradle
quartz thicket
To improve my python skills I'm attempting to recreate a more modern version of ...
If you're excited and want to try something sophisticated, you might want to look into Gaussian process regression. There's an implementation of this in scikit-learn.
quartz thicket
queen cradle
If you're excited and want to try something sophisticated, you might want to loo...
I'll look into it, thanks!
 viral juniper

can someone please explain in the solution why are they distinguishing between two cases i.e. p-1 > 0 and p-1 < 0?
wooden sail
viral juniper
as they explain in the text, if you multiply by a negative, the inequality reverses
viral juniper
@wooden sail got it
i was assuming mutiplying by just a number like -5 but eassentially p - 1 < 0 would imply that p has to be less than 0
which would be negative number
wooden sail
well, p-1 is what matters, not p
if you had p + 10 in thw denominator, you'd still need to consider p < -10 and p > -10. here there are positive p values that also reverse the inequality
tacit basin
Trying to follow the huggingface tutorial on big model inference with accelerate. https://huggingface.co/docs/accelerate/usage_guides/big_modeling
But i get Cannot copy out of meta tensor; no data! error. Here's the colab notebook if anyone wants to help 😅:
https://colab.research.google.com/drive/1myTU_kTkSaLGI50wXwh3_GZ9O6CLSfx0?usp=sharing

 viral juniper
wooden sail
if you had p + 10 in thw denominator, you'd still need to consider p < -10 and p...
viral juniper
wooden sail
if you had p + 10 in thw denominator, you'd still need to consider p < -10 and p...
in this case the inequality would only be reversed for p > 10 when we multiply
by say -5
wooden sail
viral juniper
in this case the inequality would only be reversed for p > 10 when we multiply
for p < -10
i had a typo, i meant p < -10 and p > -10
forgot the minus
viral juniper
lol
wooden sail
did you understand why?
 quick heath
Oh
lapis sequoia
Hi everyone! Just say that this is my first encounter about this. Anybody can help me about this matter? I dont know anything about data cscience and I want to learn. There are many courses. Im from Barcelona, so If someone can recommended some place or studing by my self for free, tell me, im all ears. Thanks a lot!
wheat snow
lapis sequoia
Hi everyone! Just say that this is my first encounter about this. Anybody can he...
data science has a lot of different fields, you would first have to decide in what field you want to start, but a general start would be, to learn about pandas which is a libary for data manipulation. I have learned this via a personal project ( analyzing my netflix data) and a free course from theese guys https://www.freecodecamp.org/learn/data-analysis-with-python/
Learn to Code — For Free
 upper sierra
I'm iterating over rows in an Excel sheet with Pandas and need to print the column name of a corresponding cell, is this possible?
 ripe arrow
Hello, everyone. I need some help with Kalman filter.
I need to use Kalman filter for filtering data that comes from sensor (check the image below to see the dataset that I need to apply the filter). For implementing that method, I'm using a Python's library called pykalman (https://pykalman.github.io/).
I'm getting very confused about all of these paremeters that Kalman filters have (check https://pykalman.github.io/#mathematical-formulation), that's why I don't know how to apply it.

That dataset comes from this article: https://arxiv.org/pdf/1705.08506.pdf
 leaden steeple

Void Platform is a cutting-edge AI-powered platform designed to revolutionize the way you live your life. It offers a range of features and tools that can help you achieve your goals, simplify your daily routine, and stay informed about the world around you.
One of the most exciting features of the Void Platform is its built-in AI functionality...
check out my own ai made with py, and ml.net
 earnest shell
anyone can help me with vision transformer
any code for vit with resnet50 for image classification
hasty mountain
earnest shell
any code for vit with resnet50 for image classification

Use the ResNet-50 as a feature extractor to output the Linear Projection, then pass it to the Transformer Encoder and so on...
||Upgrade tip: after your code works smoothly, consider pretraining the ResNet-50 in semi supervised learning configuration||
earnest shell
can you help me in my code just one thing
hasty mountain
earnest shell
can you help me in my code just one thing
Send it here, then
bold timber
Hello guys, do you know why I get an error when I try to set num_labels like TFAutoModelForSequenceClassification.from_pretrained(checkpoint, trainable=False, num_labels=2)
I get an error like this:
ValueError: cannot reshape array of size 2304 into shape (768,2)
Why did it happen? Is that mean the model is only suited for the same number of labels?
hasty mountain
Hey @wooden sail can you give me some help with some mathmagics?
I'm thinking about trying to make a GAN for texts. Problem is: GANs, as far as I've seen, are mostly used for image generation, thus, continuous variables, while texts, as you teached me, are discrete variables.
So, I was thinking about how to proceed. The first option would be using a vectorizer model + KNN, so the KNN would try to roughly convert the number outputted(?) from my GAN to the nearest vector in my vocabulary, making it generate a word.
The second option would be make the Generator of my GAN a model to generate data + encode it into a linear vector. Then, I'd use the minimal information entropy (the argmax...or argmin?) of this linear vector to get the index of my vocabulary in order to generate a text output. The idea would be that, since each word is a different class(a different "group"), then each word would correspond to a different information entropy degree>
Does these way of thinking make sense at all?
wooden sail
i honestly don't know much at all about GANs nor natural language processing
wheat snow
quik question. Im in a tutorital rn ( about building an model to predict stuff) and i wonder, why exactly we need in the bottem lines that copy.
import pandas as pd
from sklearn.model_selection import train_test_split

# Read the data
X_full = pd.read_csv('../input/train.csv', index_col='Id')
X_test_full = pd.read_csv('../input/test.csv', index_col='Id')

# Obtain target and predictors
y = X_full.SalePrice
features = ['LotArea', 'YearBuilt', '1stFlrSF', '2ndFlrSF', 'FullBath', 'BedroomAbvGr', 'TotRmsAbvGrd']
X = X_full[features].copy()
X_test = X_test_full[features].copy()

# Break off validation set from training data
X_train, X_valid, y_train, y_valid = train_test_split(X, y, train_size=0.8, test_size=0.2,
                                                      random_state=0)
that was a givin code btw
 rotund cove
hey! looking for some help/tips/research papers about solving kakuro with genetics algorithms
any kind of help would be appreciated because i don’t have an idea how to start at all
 wanton vessel
Hello! I am looking into using the Lasso tool for an assignment however I have not been able to find anything out there that has worked within my Jupyter Notebook. Are there any good resources for using the Lasso tool that anyone knows about?
What I have been given so far is this
# 1. after reading the above article, you decide to keep only one feature to represent
# all the features that have correlation higher than 0.9 to it.
##################################################################################
## modify the following code to remove the features you feel necessary
X = vpn_df.drop('RemoteAccess', 1)
#################################################################################


# 2. we use Lasso to further penalize models with more features
from sklearn.linear_model import Lasso

# in Lasso, the score is still R squared
best_score = 0

# Lasso has a parameter alpha used to adjust the level of penalizing the
# number of features. A bigger alpha will produce less features.
# We initiate the best alpha to 0
best_alpha = 0

# let's fine tune alpha to find the model we need
for alpha in np.linspace(1,0.2, 1000):

    #create a linear regression (Lasso) model from linear_model package
    model=Lasso(alpha=alpha,normalize=True, max_iter=1e5)

    #Train the model with our data (X, y)
    model.fit(X,y)

    #type your code here #############################################
    #Find a model that uses exactly 3 features. ######################
    #Output the score of this model (R squared) and  #################
    # corresponding alpha value. #####################################
    ##################################################################


print("The best R of my 3-feature model is:\t\t", best_score)
print("The alpha I used in Lasso to find my model is: \t", best_alpha)

    #use R squared to see how much variation is explained by the trained model
    #print('R_squared: \n', model.score(X,y))
 tropic shore
hello any suggestions for good and interesting dataset ? Just trying to find some topics for my data visualization project
hasty mountain
wooden sail
i honestly don't know much at all about GANs nor natural language processing
No need to worry. I just want to know the math part. If it makes sense at all.
My problem is more around converting continuous spaces to discrete spaces.
 main pelican
currently i can't even install tensorflow on my m1 macbookpro. here is an ss
 jovial glen
Hello, the thing I am trying to build is A CGAN that generates 2D sword sprite according to user request (like user requests demon sword and he gets one). I made the generator(tested all good) and discriminator if i run code no errors all good. But if i try to test the discriminator with fake images i get an error: ValueError: Layer "model_93" expects 2 input(s), but it received 1 input tensors. Inputs received: [<tf.Tensor 'IteratorGetNext:0' shape=(None, None, 32, 32, 3) dtype=float32>] . Didint wanna sink the chat with 140 lines of code so the code is on the link https://pastecode.io/s/t5qyas17
Error:
ValueError: Layer "model_93" expects 2 input(s), but it received 1 input tensors. Inputs received: []
 twilit oracle
Anyone have any good resources to get started with machine learning, preferably youtube
verbal venture
`optimizer.step()
_, pred = torch.max(outputs, 1)` Can someone explain what that line of code is doing?
Can you explain what the shape of outputs is, and what that shape represents?
verbal venture
serene scaffold
Can you explain what the shape of outputs is, and what that shape represents?
outputs is the output of a CNN, outputs = model(inputs)
a lenet architecture CNN
shape of outputs if [100, 10]. There's 10 classes
serene scaffold
verbal venture
shape of outputs if [100, 10]. There's 10 classes
What does the 100 mean
verbal venture
the fully connected layer shape I think
serene scaffold
Does it represent the number of instances?
verbal venture
instance of?
serene scaffold
Whatever object you're predicting the class of
verbal venture
it's possible
training_loader = torch.utils.data.DataLoader(training_dataset, batch_size=100, shuffle=True)
the network ```py
class LeNet(nn.Module):
def init(self):
super().init()
self.conv1 = nn.Conv2d(1, 20, 5, 1)
self.conv2 = nn.Conv2d(20, 50, 5, 1) # input is output from previous layer
self.fc1 = nn.Linear(4450, 500)
self.fc2 = nn.Linear(500, 10) # output is # of classes
def forward(self, x):
x = F.relu(self.conv1(x))
x = F.max_pool2d(x, 2, 2) # kernel is 2x2
x = F.relu(self.conv2(x))
x = F.max_pool2d(x, 2, 2) # kernel is 2x2
x = x.view(-1, 4450) # num cols, num rows. Rows = dimension of flattened
x = F.relu(self.fc1(x))
x = self.fc2(x)
return x```
for inputs, labels in training_loader:
      outputs = model(inputs)
      loss = criterion(outputs, labels) # cross entropy loss between outputs (trained) and labels (outputs)

      optimizer.zero_grad() # set historical gradients to zero to prevent accumulation of previous gradients
      loss.backward() # backprop through network
      optimizer.step()
_, pred = torch.max(outputs, 1)```The batch size is 100
verbal venture
yeah
serene scaffold
So taking the max along the 1 dimension gives you a tensor of what shape?
verbal venture
1
serene scaffold
Why
serene scaffold
You said the shape is (100, 10), did you not?
verbal venture
ya
serene scaffold
When you do an operation along a specific dimension, you collapse that dimension.
serene scaffold
We're getting to that.
verbal venture
ok
serene scaffold
If the shape is (100, 10), then the 0 dimension has length 100. The 1 dimension has length 10.
What is the shape if you collapse the 1 dimension, taking the max along that dimension?
verbal venture
taking the max of dimension 0?
serene scaffold
No. Taking the max of dimension 1.
verbal venture
I have no idea. either 10 or 0 yeah
serene scaffold
It would be (100,)
Because you collapse the 1 dimension.
And now you have a one-dimensional array of length 100, where each element is the max of each row in the prior array
verbal venture
ok
serene scaffold
100 appears to be 100 training instances.
serene scaffold
out (tuple, optional) – the result tuple of two output tensors (max, max_indices)
torch.max returns two values. You are using only one of them. Are you using the first, or the second?
verbal venture
no idea
serene scaffold
Look at your code
serene scaffold
What does the second value represent?
verbal venture
not sure
serene scaffold
Look at what I copied from the docs.
verbal venture
max_indices
serene scaffold
serene scaffold
out (tuple, optional) – the result tuple of two output tensors (max, max_indices...
.
serene scaffold
verbal venture
max_indices
Max index tells you which index had the maximum value. There were how many values to pick from, when you took the max of (100, 10) along the second dimension?
verbal venture
100
serene scaffold
No.
verbal venture
there were 100 rows
serene scaffold
You took the maximum along the 1 dimension. Which is the second dimension.
verbal venture
,
serene scaffold
So you picked the max of ten values, 100 times
verbal venture
okay, 10 was representing 10 values within each array?
ohhhhhh
the 10 are the classes yeah? so I'm taking the highest value of each class (the prediction)?
serene scaffold
There was only one array. Outputs. Which has 100 rows and 10 columns
serene scaffold
verbal venture
the 10 are the classes yeah? so I'm taking the highest value of each class (the ...
The index of the max for each row tells you with which class the highest value was associated.
I have to drive now, so I will leave you with that.
verbal venture
okay so it returns the classification yeah?
serene scaffold
Yes.
verbal venture
thank you
verbal venture
hey @serene scaffold did you get home/wherever you needed to be safe
serene scaffold
verbal venture
hey <@253696366952316929> did you get home/wherever you needed to be safe
Yes
verbal venture
I'm assuming this line is the inputs (my transposed data) with the labelled outputs yah?
for inputs, labels in training_loader:
I'm just wondering if those are the training labels or the testing ones
serene scaffold
sounds like inputs are the X data and labels are the y data.
verbal venture
yeah, the y data of the training batch yeah?
serene scaffold
and it says training_loder
so if it's not loading training data, then the variable naming was questionable.
verbal venture
okay, dumb question but higher level what is going on between training and testing
I thought at first one compares the training results with the validation results, but in this code the author split the two
what is the purpose of splitting the two exactly? does one compare the results at the end to see how well the training model is compared to the testing one?
because his final prints functions are epoch loss + accuracy within each dataset (training_loader and validation_loader), but I'm not seeing the relevance of splitting the 2 unless a comparison would be done in the end
serene scaffold
@verbal venture "testing" and "validation" are not synonyms.
the training, validation, and testing data are three disjoint subsets of the whole data.
there is not always a validation set.
queen cradle
verbal venture
what is the purpose of splitting the two exactly? does one compare the results a...
An important question when building a model is how well it does. Maybe you need to compare several models; maybe you need to report accuracy to someone else. One way to test a model is to see how it performs on real data. You might naively think that you could just use the same data that you trained the model on. However, this will not give you an accurate picture of how the model really performs: The model was trained on the training data, so it will perform well on that data; it will be evaluated on new data which it was not trained on, and you should not expect it to perform as well.
There is more than one solution to this. Holding out a test set is one possibility. The model doesn't see the test set during training. After training, you evaluate the model on the test set. Because this is data the model has never seen before, the model's performance on that data should predict its performance on new data.
In classical statistics, the usual method is k-fold cross-validation. In this, you divide your data into k subsets. You train ("fit" in classical terms) k models. In each model, you leave out one of the subsets and train on the others; you use the left out subset as a test set. Doing this k times gives you more information about your test performance than just doing it once. (The extreme is leave-one-out cross-validation, where k is the number of data points.) However, it requires training k models. This is no problem for models with very few parameters (like classical linear regression). For machine learning models, however, it's prohibitively difficult, so it doesn't get used for them.
serene scaffold
queen cradle
In classical statistics, the usual method is k-fold cross-validation. In this, y...
I'll have you know that I once waited two weeks for my 10-fold CV
lapis sequoia
!paste
arctic wedgeBOT
Pasting large amounts of code
If your code is too long to fit in a codeblock in Discord, you can paste your code here:
https://paste.pythondiscord.com/
After pasting your code, save it by clicking the floppy disk icon in the top right, or by typing ctrl + S. After doing that, the URL should change. Copy the URL and post it here so others can see it.
hasty mountain
serene scaffold
I'll have you know that I once waited two weeks for my 10-fold CV
If try something like that, the energy company takes my home away
lapis sequoia
serene scaffold
I'll have you know that I once waited two weeks for my 10-fold CV
Didn't someone come and interrupt the kernel. Lol
sleek harbor
If I were to only analyze one dataset in kaggle, which would you recommend?
And can you put kaggle into ur portfolio for ur resume?
serene scaffold
lapis sequoia
Didn't someone come and interrupt the kernel. Lol
No, I don't use notebooks for that.
lapis sequoia
Thanks admin stelercus
violet gull
how are pytorch conv2d biases and weights seeded?
queen cradle
I want to make sure I understand the question. Is the data you have as follows: There's a sequence of records. Each record is a pair (year, x) where x is either 0 or 1. You want to predict information about the coming year. Is that right? I'm not sure whether you want to predict the number of records for the coming year, the fraction of x in the coming year that will be 1, or both.
lapis sequoia
Hi
Quick question
Could you calculate discriminatory importance of each of the variables in splitting the clusters
What does it mean?
 zenith plover
ModuleNotFoundError: No module named 'tensorflow.python' i loaded but this is error
vs code
queen cradle
@lapis sequoia Also, could it be that some or all of the data is stationary?
Okay, so they're independent?
That's good. It's much simpler.
"appear" = 1?
And it sounds like there are patterns, like appearing every three years. So it's not just a coin flip each year.
Okay. First the ones that are coin flips. Are the coins the same every year? I.e., is it something like, "Every year there's a 60% chance this happens, regardless of year"? Or is it more like, "It used to be a 30% chance every year, but it's trended upwards and is now 60% every year"?
Okay. So when you can identify one of those columns, your task is easy. Just count the fraction of ones. That's the maximum likelihood estimate for whether you'll have an appearance each year. If it's > 50%, then you should predict there will be an appearance in the coming year.
(Depending on what you're trying to do, there may be slightly better things to do. For instance, if you really really really care about predicting 1 when the answer is 1, and you care less about getting the prediction wrong when the answer is 0, then you might want to cut off at something other than 50%.)
Now, the patterned columns. What kinds of patterns do you expect? Is it things like, "Every other year there's an appearance", "every fourth year there isn't an appearance," "two years on, three years off", that sort of thing?
Sure, I understand. Next question: If there is a pattern, how regular is it? Could it be that the pattern is, "two years on, one year 50% chance, two years off"?
So if there's a pattern, it's probably pretty regular? Maybe a little bit of error, but not much?
violet gull
how are pytorch conv2d biases and weights seeded?
queen cradle
This is related to a problem called learning parity with errors. In general it's NP hard or something like that. But you have a pretty limited amount of data, and the fact that there's only a little bit of error suggests that you are probably not in a hard case.
In order to get really good results, it would help to have some kind of domain knowledge. If you knew that certain patterns were more likely than others, or weren't possible, etc., then you would have an easier time.
But are all patterns equally likely?
(I should add that this problem isn't exactly learning parity with errors. It's just reminiscent.)
Well, here's my issue. The sample data you showed above had one data point for each year between 2001 and 2022. So you have 22 data points. Is it possible that the pattern is 12 years long?
If it's 12 years long then you don't have enough data to confirm that you've found it.
E.g., maybe "appear" means "emergence of 17-year cicadas". Then the problem you posed is hopeless: You'll get one or two appearances in 22 years, but that's not enough to see the pattern.
Okay. So you need to detect whether the pattern exists, and assuming it exists, you need to predict the cycle's length, which seems to be at most 7 years, and you need to predict where you are in the cycle and the probability of appearing for where you are in the cycle. Is that right?
My feeling is that you should use a Fourier transform. Interpret your data as samples of a function that takes the values 0 and 1. Pad the data with zeros on either end, and compute a discrete Fourier transform (e.g., using SciPy). Now look for peaks in the transformed data. These peaks will correspond to possible cycles.
When you have a very strong cycle, meaning the probability of an appearance depends almost completely on where you are in the cycle and has very little randomness, then you will see a strong peak at that cycle length. You'll also see peaks at the integer multiples of the cycle length (a cycle of five years is also a cycle of ten years, fifteen years, etc.). Knowing that the cycles are usually 5 years long and max 7 tells you to focus your attention on potential peaks around no more than 7 years and perhaps to upweight the frequency at 5 years.
If none of the peaks are very strong, then you're probably in the case where the year-to-year behavior is random. Then you can revert to the method I described earlier, where you predict based on the fraction of times an appearance happens.
Suppose instead there's a strong peak. That means you've identified a potential cycle length. At this point there's a simple thing you can do: Assume that the years within the cycle are independent. E.g., if the cycle has length 2, then the assumption is that year 1 is like years 3, 5, 7 etc., but their behavior has nothing to do with years 2, 4, 6, etc.