#data-science-and-ml
1 messages · Page 48 of 1
 agile cobalt
 sly nymph
agile cobalt
have you tried looking up `bee image dataset`? or using Google's Dataset Search,...
sly nymph
agile cobalt
have you tried looking up `bee image dataset`? or using Google's Dataset Search,...
oh, oh yeah
Im dumb sorry
 raw vigil
what type of regression model should I use for this?

Original data looks like this:

I applied np.log to X and y to make the data less scuffed
 queen cradle
@raw vigil Unless you have a reason to believe that your data should be transformed to a logarithmic scale, applying a log is more likely to confuse the issue than anything else. A surprising number of distributions look linear after applying logs to both axes, so that kind of transformation can hide real and important facts you might want to know.
Can you share what your data represents?
raw vigil
queen cradle
Can you share what your data represents?
Im doing some data analysis on covid 19 data where the x is the total number of beds while y is the inpatient beds used. I have a huge dataset with 182 columns and I'm trying to use certain x values to try and determine y (inpatient beds used)
queen cradle
The first picture you showed (with after taking logs) looks kinda linear. (Not very, but more linear than anything else I can think of.) Just eyeballing it, it looks to me that when the X axis increases by three units, the Y axis increases by five units. Assuming this relationship is real (and that you used base ten logs), if X is total beds used, this says that multiplying the number of beds by 1000 correlates with multiplying the number of inpatient beds used by 100000.
I'm not sure whether I believe that analysis.
raw vigil
Sorry I think I could have worded it better
raw vigil
queen cradle
The first picture you showed (with after taking logs) looks kinda linear. (Not v...
y is: Sum of reports of total number of staffed inpatient beds that are occupied reported during the 7-day period.
x is: Sum of reports of total number of all staffed inpatient and outpatient beds in the hospital, including all overflow, observation, and active surge/expansion beds used for inpatients and for outpatients (including all ICU, ED, and observation) reported during the 7-day period.
I'm getting the data from: https://healthdata.gov/Hospital/COVID-19-Reported-Patient-Impact-and-Hospital-Capa/anag-cw7u
Though yeah I would agree I think i'm incorrectly applying log here. However I am a bit confused since when I was doing it on wikipedia's transistor chart applying log was fairly effective
If log can't be applied there, would I even be able to assume that there is a linear relationship at all?
queen cradle
There are measurements where logs make a lot of sense. For example, suppose you want to measure audio volume. Human hearing is (approximately) logarithmic, so applying a log to measured sound pressure makes sense.
Or you might be interested in something that grows exponentially (like cells in a petri dish), and again, applying a log makes logical sense.
Whether or not it makes sense depends on the situation. The only universally applicable advice I can give you is to think about whether the result would be interpretable.
 lapis sequoia
hello, I'm thinking about doing a project that studies and displays Advanced statistics for NBA players. Im having trouble on where to start any help would be appreciated.
raw vigil
queen cradle
Whether or not it makes sense depends on the situation. The only universally app...
What do you mean by interpretable?
 patent lynx
lapis sequoia
hello, I'm thinking about doing a project that studies and displays Advanced sta...
patent lynx
lapis sequoia
hello, I'm thinking about doing a project that studies and displays Advanced sta...
https://projects.fivethirtyeight.com/nba-player-ratings/
You can compare based on how 538 does it

FiveThirtyEight
Our ratings use play-by-play and player-tracking data to calculate the value of every player in the NBA, updated daily.
queen cradle
raw vigil
What do you mean by interpretable?
As in, if you had to explain it to a lay person—to explain it without equations—could you give an explanation that made sense?
patent lynx
lapis sequoia
hello, I'm thinking about doing a project that studies and displays Advanced sta...
Measure by teams or players. Teams are useful to have their overall performance measured Or you could analyse the raptor offense and defense of individual players. But overall set a target (y) what are you trying to predict, %of how they likely to win that year?
raw vigil
queen cradle
As in, if you had to explain it to a lay person—to explain it without equations—...
Would you have any recommendations to what I should do?
queen cradle
What's your ultimate goal? Write a paper? Increase your own understanding?
raw vigil
queen cradle
What's your ultimate goal? Write a paper? Increase your own understanding?
Increase my own understanding
queen cradle
In that case, you can do whatever you like, but my recommendation would be to look for relationships that you can understand in some conceptual way (not just as equations).
raw vigil
I'm just a bit lost on what model I could fit onto this
All the previous projects I've done have the data being really clean and easy to work with
Idk if the graphs/relationships I'm plotting are just junk or if I'm just not looking hard enough
queen cradle
Real world data is messy. You will often find that there is no parametric model that explains everything.
Usually, a parametric model can explain something about some part of the data. It may not be good out in the tails, for example, but maybe it's reasonably good elsewhere. That can be useful information. Or it may capture an important trend, but there may be a lot of noise that can only be explained using information you don't have.
patent lynx
With that many columns I'd like to separate it tbh, a groupby would be nice. Do some EDA, maybe start with df.corr() and plot a heatmap. Lookout for multicollinearity issues if you want a to make a linear model and verify it with vlf.
Then at best do a feature selection because not all features can't explain what you are trying to predict.
raw vigil
That makes sense thank you so much! Do you reccomend any resources for reading/interpreting correlation heatmaps?
queen cradle
One of the risks of having a rich data set with a lot of columns is that you may be able to find relationships that aren't really there just by testing enough possible hypotheses. (This is called "multiple testing" in the statistical literature.) If you have a bunch of hypothesis tests that you'd like to run, then there are ways that you can control this problem. If you're just exploring, it's sometimes good to hold some data back just so that you can check out any relationships you think you see.
raw vigil
Gotcha
patent lynx
raw vigil
That makes sense thank you so much! Do you reccomend any resources for reading/i...
Nope sorry, i stick with chat gpt, lots of stackoverflow and documentation of sklearn and pandas. But it did take me quite a while to understand and get the intuition.
Generally anything higher 0.8 (spearman's) should be suspected and investigated further for the multicollinearity issue.
queen cradle
raw vigil
That makes sense thank you so much! Do you reccomend any resources for reading/i...
You might try looking up resources on "exploratory data analysis" or "EDA". Tukey's book is a classic.
raw vigil
patent lynx
Nope sorry, i stick with chat gpt, lots of stackoverflow and documentation of sk...
Oh shoot I used pairplot and there seems to be linear correlations between everything but the Xs and my y 😭
 queen cradle
In a way, that's pretty awesome. It means you get to throw away some of the variables. That makes everything else easier.
raw vigil
queen cradle
In a way, that's pretty awesome. It means you get to throw away some of the vari...
What does this mean?
queen cradle
It looks like you have four variables that tell you essentially the same information. Since they have the same content, you only need one. You can discard the other three.
raw vigil
ohhh that makes sense
So does that mean only 1 is useful
or that I only really need 1?
queen cradle
For most purposes, you only need to keep one. It doesn't matter which one; if you know one then you know the others (up to a small amount of error).
raw vigil
Oh ok thank you
And in terms of correlation if I get a correlation between X_4 and y that is 0.6310 (highest correlation coefficient) out of the 3 that would mean it would be useful for a regression model right?
queen cradle
Not necessarily. Correlation coefficients sometimes trick you. Always look at the data.
patent lynx
Yup becareful
See how the data behaves, but for now we maybe ready for a baseline model
queen cradle
Be especially careful if you're using a non-parametric measure of correlation, like Spearman's rho or Kendall's tau, but you're trying to fit a linear model.
patent lynx
Well before we scale it or what not
 deep lichen
hey guys!
 echo orbit
I think i'm going crazy with the logits and labels error ngl
queen cradle
There's always more to learn! It's exciting.
echo orbit
Is there any particular reason for a CNN model dedicated to binary classification ```py
model = Sequential()
model.add(Conv2D(100, kernel_size=3, padding='same', activation='relu', input_shape=(100, 100, 3)))
model.add(MaxPool2D(pool_size=2))
model.add(Flatten())
model.add(Dense(100, activation='relu'))
model.add(Dense(2, activation='sigmoid'))
model.compile(optimizer='adam', loss='binary_crossentropy', metrics=['accuracy'])
to return the ``logits` and `labels` must have the same shape, received ((5, 2) vs (5, 1)).`` error when my `x_train` and `y_train` are of shape `(10,100,100,3)` and `(10,2)` respectively ?I just don't understand why it's returning me (5,2) and (5,1) especially
 hasty mountain
echo orbit
Is there any particular reason for a CNN model dedicated to binary classificatio...
hasty mountain
echo orbit
Is there any particular reason for a CNN model dedicated to binary classificatio...
If keras follows the same pattern as Pytorch, Binary Cross Entropy requires your output to be in shape (Batch, 1), not (Batch, 2)
The model must generate a single label, a single output, for a given input.
More than a single output, multiple classes, is more related to Cross Entropy Loss in multi-class classification, not Binary
 tropic matrix
i've designed a complex UNet architecture utilizing EfficientNetB7 as its encoder, however I'm wondering about the accuracy and hyperparameters of such a model. i'm training it on the BraTS 2021 task 1 dataset for segmentation, but i'm noticing that it's loss is decreasing very slowly. my current learning rate is 1e-4, but I am using horovod to distribute the training. what should I check to troubleshoot this?
echo orbit
hasty mountain
If keras follows the same pattern as Pytorch, Binary Cross Entropy requires your...
I fixed my issue, as it seems i reshaped for no reason (since for my case of binary classification, i had to keep the current shape of my variables). So yeah you were right, i had to use the shape (Batch, 1)
raw vigil
Update: Managed to find a couple of trends after spending that last few hours scouring the data and watching youtube videos on correlations. Some point along the way I talked to the ghost of David Cournapeau as well 💀
 drifting lion
hi guys I am running into an issue with linear regression model using Pytorch
epochs = 200

epoch_count = []
loss_values = []
test_loss_values = []


for epoch in range(epochs):

  model_0.train()
  y_pred = model_0(X_train)
  loss = loss_fn(y_pred, y_train)
  optimizer.zero_grad()
  loss.backward()
  optimizer.step()

  ### Testing
  model_0.eval()

  with torch.inference_mode():
    test_pred = model_0(X_test)
    test_loss = loss_fn(test_pred, y_test)

  # Print out what's happenin'
  if epoch % 10 == 0:
    epoch_count.append(epoch)
    loss_values.append(loss)
    test_loss_values.append(test_loss)
    print(f"Epoch: {epoch} | Loss: {loss} ")
    # Print out model state_dict()
    print(model_0.state_dict())
the first I run this, program works as expected, but the second time I run it, weights and bias doesn't get updated
 tacit basin
Remember to test it. Chat gpt likes to lie to you 😜
sly nymph
Guys, I am using google colab to train my model of 1000+ images of bees to make a bee detector and I need help, WHY IS IT NOT WORKING

i used roboflow to organize the dataset please someone help me
i have been this on hours and its my first time making an object detection using computer vision and opencv library in pycharm
tacit basin
sly nymph
Guys, I am using google colab to train my model of 1000+ images of bees to make ...
You don't have the yml file?
sly nymph
tacit basin
You don't have the yml file?
If I don’t have it, where do I get it and install it
tacit basin
Not sure. Never used roboflow. Us it something they provide or do you need to create yourself?
sly nymph
I have no clue.. im just following a year old tutorial and the website has changed a bit 😭 Im so confused I already pulled an all nighter this was my last resort... does ANYone here know how roboflow works, or how I can make aquire object detection weights for bees using google colab?
sly nymph
tacit basin
Not sure. Never used roboflow. Us it something they provide or do you need to cr...
Kind sire, is there anywhere you can direct me to?
tacit basin
Link to tutorial?
sly nymph

Roboflow Blog
In this tutorial, we walkthrough how to train YOLOv4 Darknet for state-of-the-art object detection on your own dataset.
it has a video in it
that im following, here it is https://www.youtube.com/watch?v=N-GS8cmDPog&t=773s

✅ Subscribe: https://bit.ly/rf-yt-sub
A video of how to train YOLO v4 to recognize custom objects in Google Colab in the Darknet framework. In this video we will take the following steps to train our custom detector:
- Gather and process our dataset
- Load dataset into Google Colab
- Build Darknet framework in Google Colab
- Write custom YO...
tacit basin
They never mention data.yaml in tutorial
sly nymph
exactly
he said he already moved the dataset to the notebook
but how
he didnt show how
tacit basin
Any chance you can follow more recent tutorial for example for yolov8?
You would get better results as well
sly nymph
well, im using a program that works for yolov4
and if I change to yolov8, that probably wont be supported and I have to change the dnn too...
;-;
tacit basin
Sure make sense
sly nymph
this is what happens when tutorials are really old, they get outdated
tacit basin
Yeah
sly nymph
so, anything I can do for the yml file?
tacit basin
Get it from somewhere or create it 🙂
What does roboflow framework expect this file to be?
sly nymph
I have no clue, and I tried to use chatgpt to help but it doesnt understand the goal
sly nymph
tacit basin
What does roboflow framework expect this file to be?
I think, maybe its some sort of directory to put my training model in
Wait..
 arctic wedgeBOT
Hey @sly nymph!
You either uploaded a .txt file or entered a message that was too long. Please use our paste bin instead.
tacit basin
I think you get it with data from roboflow? Just make sure path is correct maybe?
sly nymph
tacit basin
I think you get it with data from roboflow? Just make sure path is correct maybe...
I mean it should be
https://paste.pythondiscord.com/jekukizira, look, here is my object tracking code
I hope it works with yolo8
tacit basin
This code uses some object_detection library?
sly nymph
yes
here is the library:
import cv2
import numpy as np


class ObjectDetection:
    def __init__(self, weights_path="dnn_model/yolov4.weights", cfg_path="dnn_model/yolov4.cfg"):
        print("Loading Object Detection")
        print("Running opencv dnn with YOLOv4")
        self.nmsThreshold = 0.4
        self.confThreshold = 0.5
        self.image_size = 608

        # Load Network
        net = cv2.dnn.readNet(weights_path, cfg_path)

        # Enable GPU CUDA
        net.setPreferableBackend(cv2.dnn.DNN_BACKEND_CUDA)
        net.setPreferableTarget(cv2.dnn.DNN_TARGET_CUDA)
        self.model = cv2.dnn_DetectionModel(net)

        self.classes = []
        self.load_class_names()
        self.colors = np.random.uniform(0, 255, size=(80, 3))

        self.model.setInputParams(size=(self.image_size, self.image_size), scale=1/255)

    def load_class_names(self, classes_path="dnn_model/classes.txt"):

        with open(classes_path, "r") as file_object:
            for class_name in file_object.readlines():
                class_name = class_name.strip()
                self.classes.append(class_name)

        self.colors = np.random.uniform(0, 255, size=(80, 3))
        return self.classes

    def detect(self, frame):
        return self.model.detect(frame, nmsThreshold=self.nmsThreshold, confThreshold=self.confThreshold)
I mean if the input output is the same for yolo V4 and V8 it should work provided all dependencies are installed
sly nymph
but the question is.. is the input and output for v4 and v8 the same?
tacit basin
sly nymph
```py
import cv2
import numpy as np
class ObjectDetection:
def __init__(se...
Is that yolo ?
sly nymph
thats the python script for object detection
tacit basin
sly nymph
but the question is.. is the input and output for v4 and v8 the same?
You can compare by reading docs 🙂
tacit basin
sly nymph
thats the python script for object detection
I don't see yolo there
Oh sorry it's there
sly nymph
question, is there an easier way to make an object detection and tracking model, than this?
i have my data
I have the annotations
and I have the final script to run it all
Do I need to change the dnn model, if I switch to v8?
thats the big question
because thats the one thing I dont have the capability to edit
tacit basin
What do you use roboflow for?
sly nymph
to make the annotations to my data and oragnize it. Plus, i am already done using it, because I got my zip file output, because I dont need it anymore now
sly nymph
tacit basin
What do you use roboflow for?
I mean, I can go without it, if there is an easier, and less time intensive way
tacit basin
I see just to get the data
tacit basin
Can you get data to your local PC? There maybe some issue with colab
sly nymph
mmm
sly nymph
tacit basin
Can you get data to your local PC? There maybe some issue with colab
Its on my local pc right now, and my local pc has an rtx 2070
the only thing is, I dont know how to use cuda and tensorflow/pytorch to do this stuff because I didnt find an exact tutorial for it.. yet
tacit basin
Can you upload data from local to colab? If you want to train on colab
sly nymph
that sounds good too
but where do I start
I have never used colab before
I just used the template given in the yolov4 roboflow tutorial
tacit basin
I don't use it too much but you can mount GDrive to colab instance for example
sly nymph
tacit basin
I don't use it too much but you can mount GDrive to colab instance for example
I have one last question for you, before I stop bothering you.
This was the original tutorial I used which I am still trying to get to doing, and since LabelImg is not available, I tried to use roboflow, but the original program is not available, so I cant run it, which means I cant finish what I started. Where can I find the original program for LabelImg?

In this tutorial I’m going to explain you one of the easiest way to train YOLO to detect a custom object even...
tacit basin
sly nymph
I have one last question for you, before I stop bothering you.
This was the or...
Seems it's label studio now https://github.com/heartexlabs/labelImg#macOS

GitHub
LabelImg is now part of the Label Studio community. The popular image annotation tool created by Tzutalin is no longer actively being developed, but you can check out Label Studio, the open source ...
sly nymph
huh..
@tacit basin So.. about the directory
https://github.com/heartexlabs/labelImg
But which executable do I download that will run the labelImg program?
I downloaded the entire file but nothing is happening and I dont know what to run
GitHub
LabelImg is now part of the Label Studio community. The popular image annotation tool created by Tzutalin is no longer actively being developed, but you can check out Label Studio, the open source ...
 tender knot

hey why wont my microsoft vscode installer download?
it has been like this for a whi;e
tacit basin
sly nymph
<@490342783572246538> So.. about the directory
https://github.com/heartexlabs/l...
pip install didn't work?
tacit basin
tender knot
what os?
tender knot
wdym by what os
sly nymph
tender knot
wdym by what os
what operating system are you on?
sly nymph
tacit basin
pip install didn't work?
last step is not working
 tacit basin
sly nymph
last step is not working
tacit basin
sly nymph
last step is not working
can try this for Windows: https://github.com/heartexlabs/labelImg#windows
GitHub
LabelImg is now part of the Label Studio community. The popular image annotation tool created by Tzutalin is no longer actively being developed, but you can check out Label Studio, the open source ...
sly nymph
ok
tender knot
sly nymph
what operating system are you on?
window 10
sly nymph
tacit basin
can try this for Windows: https://github.com/heartexlabs/labelImg#windows
I tried everything
Imma try it on another device
sly nymph
tacit basin
You can compare by reading docs 🙂
yolov4 is darknet and yolov8 is pytorch, different outputs ;-;
I think
 zenith hawk
Hey, is it ok to use sigmoid activation in non classification problems ? I just think it works better for me than relu, but if someone will ask why I used logistic regression activation in this problem I won’t be able to answer
 inland quail
Does anyone use YOLOv5/v8? What works better Roboflow or Ultralytics HUB?
tacit basin
inland quail
Does anyone use YOLOv5/v8? What works better Roboflow or Ultralytics HUB?
i did use yolov5, now v8 seems better choice. havent used neither of roboflow nor hub. what are these used for?
inland quail
tacit basin
i did use yolov5, now v8 seems better choice. havent used neither of roboflow no...
I'm on windows and how can I use CUDA instead of my CPU from CLI command?
hasty mountain
zenith hawk
Hey, is it ok to use sigmoid activation in non classification problems ? I just ...
I think that if it works better, it's ok.
Sigmoid can work more or less like a ReLU but with a threshold for bot positive and negative numbers
However, Sigmoid in hidden layers can be a problem because it tends to provide really small gradients
I guess the Binary Cross Entropy loss function was even created to avoid this
tacit basin
inland quail
I'm on windows and how can I use CUDA instead of my CPU from CLI command?
You need to have GPU card and CUDA installed
 odd meteor
inland quail
I'm on windows and how can I use CUDA instead of my CPU from CLI command?
odd meteor
inland quail
I'm on windows and how can I use CUDA instead of my CPU from CLI command?
You can switch to cuda if you have Nvidia GPU on your pc.
If you're using PyTorch just use
if torch.cuda.is_available():
  device = torch.device("cuda")
else:
  device = torch.device("cpu")
Im using the CLI to train my model no idea how it's done with py
I have a 7900X and it still feels really slow
tacit basin
inland quail
Im using the CLI to train my model no idea how it's done with py
Do you have GPU ?
tacit basin
inland quail
I have a 7900X and it still feels really slow
Not sure probably will not work with AMD cards
Read docs
 wooden sail
i don't think there's an easy way to do this with AMD's ROCm. history favors nvidia
or maybe i'm wrong, but it seems to still be in beta https://pytorch.org/blog/pytorch-for-amd-rocm-platform-now-available-as-python-package/
 hasty mountain
wooden sail
or maybe i'm wrong, but it seems to still be in beta https://pytorch.org/blog/py...
hasty mountain
wooden sail
or maybe i'm wrong, but it seems to still be in beta https://pytorch.org/blog/py...
Beware, though:

Linux only 
inland quail
Thank, im installing it now. 2.2GB
I did that before but it didnt seem to work, after adding --upgrade flag it seems to work
sweet
 wooden sail
nice. test it out and see if your code runs faster
i'm assuming it should work given the image you shared, i think rocm translates cuda code
arctic wedgeBOT
Hey @inland quail!
You either uploaded a .txt file or entered a message that was too long. Please use our paste bin instead.
inland quail
i run this command here
yolo task=detect mode=train model=yolov8n.pt data=data.yaml epochs=3 imgsz=1920
omg i think it's my VRM
because my RAM is at about 14/32GB and my VRAM is at 1/8GB and then it goes 1-8GB real quick like 0.5s
wooden sail
oof
inland quail
What can i do about it?
wooden sail
shrink the model and/or reduce the batch size
inland quail
do i need to delete it or can i set it in the config file?
wooden sail
i have no idea, i've never used yolo before
inland quail
i have like 1550 images in total
https://github.com/ultralytics/yolov5/issues/2377
Don't really understand it but make smaller batches... optimize and repeat?
GitHub
Study 🤔 I did a quick study to examine the effect of varying batch size on YOLOv5 trainings. The study trained YOLOv5s on COCO for 300 epochs with --batch-size at 8 different values: [16, 20, 32, 4...
hasty mountain
I thought cuda and cuDNN simply tried to use the entire VRAM you have available
At least, when I run a model, even if I use a single linear layer with 100 weights and batch size 1, my GPU goes wild
inland quail
This is so dumb... or I am dumb... how the hell do I make this trash work
I spent yesterday 4h from 10pm to 2am labeling 1550 images
hasty mountain
Are you using a single model?
inland quail
It's so frustrating... all the big brains working on this ML shit and the dumb pytorch doesn't know that I have 8GB or VRAM and uses it all then crashes
inland quail
hasty mountain
Are you using a single model?
Easier question, don't understand
hasty mountain
inland quail
It's so frustrating... all the big brains working on this ML shit and the dumb p...
I think you can actually configure how much of your VRAM it'll use
inland quail
I'm basically following a post
inland quail
https://github.com/ultralytics/ultralytics/blob/main/ultralytics/yolo/cfg/default.yaml
Those are all the args i can set in YOLO

GitHub
YOLOv8 🚀 in PyTorch > ONNX > CoreML > TFLite. Contribute to ultralytics/ultralytics development by creating an account on GitHub.
hasty mountain
inland quail
Easier question, don't understand
Then it might make things more complicated...
inland quail
hasty mountain
https://pytorch.org/docs/stable/generated/torch.cuda.max_memory_allocated.html
I use CLI no idea how it works with py
because anything I see is something about CLI nothing about py
hasty mountain
Uh... You'd have to configure the .py files the command prompt is executing...

Try using a batch size of 16
 inland quail
yolo batch=16 task=detect mode=train model=yolov8n.pt data=data.yaml epochs=3 imgsz=1920
like this?
hasty mountain
I have a GTX 1650 with 4 Gb, yet I can run models with like 80 million parameters using a batch size of 16
inland quail
I have a 3060ti 8GB
hasty mountain
Then you might be able to use more. But start with 16
If it runs well, try 32, then 64...
inland quail
i did and it doesnt even run the 16
hasty mountain
Well...then I don't know
inland quail
doesn't run 8
 unique flame
inland quail
https://github.com/ultralytics/ultralytics/blob/main/ultralytics/yolo/cfg/defaul...
unique flame
inland quail
https://github.com/ultralytics/ultralytics/blob/main/ultralytics/yolo/cfg/defaul...
There is a YOLOv8? Does it have a paper?
inland quail
GitHub
YOLOv8 🚀 in PyTorch > ONNX > CoreML > TFLite. Contribute to ultralytics/ultralytics development by creating an account on GitHub.
wooden sail
inland quail
I have a 3060ti 8GB
weren't you using an amd card?
inland quail
wooden sail
weren't you using an amd card?
No idea where this thought comes from but no
hasty mountain
inland quail
No idea where this thought comes from but no

Install Cuda, not ROCm, then
wooden sail
inland quail
I have a 7900X and it still feels really slow
from here
inland quail
Heard of AMD Ryzen 9 7900X?
wooden sail
oh lmao
well then that's also the wrong pytorch version
i thought you meant you had an rx 7900x
 wooden sail
aight then it's ok
hasty mountain
inland quail
Also make sure you have Cuda 11.7 installed
inland quail
Python 3.9.0 (tags/v3.9.0:9cf6752, Oct  5 2020, 15:34:40) [MSC v.1927 64 bit (AMD64)] on win32
Type "help", "copyright", "credits" or "license" for more information.
>>> import torch
>>> torch.__version__
'1.13.1+cu117'
>>>
It seems that maybe setting manually a memory usage might help
https://github.com/tensorflow/tensorflow/issues/25160#issuecomment-643703167
https://stackoverflow.com/questions/60160874/tensorflow-2-1-failed-to-get-convolution-algorithm-this-is-probably-because-cud/64570063#64570063
inland quail
Like it starts... and then eats VRAM like a cookie monsta
 final hatch
Hello! I'm a beginner in Python and this week I'm doing an auto process with Selenium but can't put the name in the right place as I know you guys are much better than me lol would you like to help me please?
my GitHub https://github.com/Tiago-Damasceno/automato

GitHub
Contribute to Tiago-Damasceno/automato development by creating an account on GitHub.
hasty mountain
inland quail
Like it starts... and then eats VRAM like a cookie monsta
Yes, like I said, if you don't configure the memory usage, it'll just go for the entire VRAM
I suppose it's for making the process faster and taking full advantage of the hardware available
||But it gets boring as it gets hard to play games while your model runs||
inland quail
hasty mountain
Yes, like I said, if you don't configure the memory usage, it'll just go for the...
Are you running yolo from a py file or via CLI?
hasty mountain
inland quail
Are you running yolo from a py file or via CLI?
Isn't the CLI executing a py file from command prompt?
(I don't use CLI)
inland quail
how does your file look like?
hasty mountain
I never used YOLO, I'm just saying based on my own models
inland quail
ye you can make your own model with yolo
what are u using then?
tensorflow?
ok i see yolo is just a model
 ashen folio
hey yall, im new to data science, and want to start trying to use beautifulsoup for web scraping, could anyone give me a thorough tutorial on how to set up python from scratch, and start web scraping?
 serene scaffold
ashen folio
hey yall, im new to data science, and want to start trying to use beautifulsoup ...
serene scaffold
ashen folio
hey yall, im new to data science, and want to start trying to use beautifulsoup ...
web scraping in itself doesn't really fall under data science, even if it's a data acquisition technique. and you need to be sure that all the websites you scrape from are okay with being scraped.
ashen folio
serene scaffold
web scraping in itself doesn't really fall under data science, even if it's a da...
yea,, im working on an online course from british airways, and the data is about the airline brnad itself, i just dont know where to start learning
serene scaffold
ashen folio
yea,, im working on an online course from british airways, and the data is about...
We're a large, friendly community focused around the Python programming language. Our community is open to those who wish to learn the language, as well as those looking to help others.
ashen folio
serene scaffold
https://www.pythondiscord.com/resources/?topics=general&payment-tiers=free&diffi...
thank you
serene scaffold
you might also go straight to this one https://wiki.python.org/moin/BeginnersGuide/NonProgrammers
ashen folio
serene scaffold
you might also go straight to this one https://wiki.python.org/moin/BeginnersGui...
tysm, boutta spend the whole night learning
inland quail
ashen folio
hey yall, im new to data science, and want to start trying to use beautifulsoup ...
I used Javascript and Puppeteer for scraping 🙂
ashen folio
inland quail
I used Javascript and Puppeteer for scraping 🙂
i mean im searching for any ways to scrape, so yea
i jjust dont know how to set up python and use it
hasty mountain
ashen folio
i jjust dont know how to set up python and use it
Quick sample:
from bs4 import BeautifulSoup
from urllib.request import urlopen

with urlopen("https://www.msdmanuals.com/professional") as url:
    test = url.read()


soup = BeautifulSoup(text, "html_parser")
paragraphs = soup.find_all("p")

for p in paragraphs:
    text = p.get_text()
    print(text)
The soup.find_all("p") thing is because, if I remember correctly, in HTML code, paragraphs are explicitly remarked by "p", or something like that...
ashen folio
hasty mountain
Quick sample:
```py
from bs4 import BeautifulSoup
from urllib.request import url...
actually
uh, would you give me a tour on how to fully set up my python? pretty sure i got "pip" or other elements missing for the environment to work
hasty mountain
Did you add Python to your PATH?
ashen folio
hasty mountain
*Did you add Python to your PATH?*
what
inland quail
hasty mountain
Quick sample:
```py
from bs4 import BeautifulSoup
from urllib.request import url...
I'm pretty sure this doesn't work with SPA Javascript based websites 🙂
I have an issue, I'm following a tensorflow tutorial AND... when doing tf.config.list_physical_devices("GPU") it returns an empty array
hasty mountain
ashen folio
what
If you don't add your Python IDE as a path variable(either user or system), it might not work properly
 ashen folio
hasty mountain
If you don't add your Python IDE as a path variable(either user or system), it m...
ashen folio
hasty mountain
If you don't add your Python IDE as a path variable(either user or system), it m...
oh, can you give me a thorough tutorial on how to fully set up the thing
wooden sail
if you're not very tech savvy, it might be easier to uninstall python and install it again. during the installation process, make sure you tick the box that says "add python to PATH" or something similar
but before we do that, what problem are you actually having?
if you write py --version on your terminal, what comes out?
 mint palm
ranking vs margin loss??????
ashen folio
wooden sail
but before we do that, what problem are you actually having?
Oh, I just don't know how to install pip or any other elements (if there are) for the thing to work
wooden sail
ashen folio
Oh, I just don't know how to install pip or any other elements (if there are) fo...
all recent python versions bring pip with them
 wooden sail
in a terminal i mean, not in a file
ashen folio
oh
wooden sail
but you already showed the interpreter there, so python is installed
ashen folio
wooden sail
like cmd. do you know what cmd is?
mhm
what do i put there (n do i need administration perm?"
wooden sail
py --version
ashen folio
wooden sail
py --version
3.11.2
wooden sail
cool
now, in that same terminal, you can install python modules by running the command
py -m pip install your_module_name_here
yeah, libraries if you prefer calling them that
anything you call with "import"
python brings a set of modules by default, these are called the "standard library" or "stdlib"
ashen folio
ok, so right now im trying to learn how to use beautifulsoup 4, with no knowlede
wooden sail
anything that isn't part of the stdlib has to be installed
so, beautiful soup is not part of the stdlib, we need to pip install it
ashen folio
 ashen folio
wooden sail
so, beautiful soup is not part of the stdlib, we need to pip install it
ashen folio
wooden sail
so, beautiful soup is not part of the stdlib, we need to pip install it
is this what im supposed to do
ashen folio
oh right
ashen folio
wooden sail
py -m pip install beautifulsoup4
amazing, i got it

do you have any ideas what do i do now
cuz i am trying to start web scraping
what do i do from here
wooden sail
i would say you should start with the links stelercus sent you, as you are brand new
you'll need to get comfy with python's basics before doing scraping
ashen folio
wooden sail
you'll need to get comfy with python's basics before doing scraping
yea im just doing this for a course
i guess i gotta learn all the basics
what should i start learning first
wooden sail
realpython is a great resource https://realpython.com/beautiful-soup-web-scraper-python/

In this tutorial, you'll walk through the main steps of the web scraping process. You'll learn how to write a script that uses Python's requests library to scrape data from a website. You'll also use Beautiful Soup to extract the specific pieces of information that you're interested in.
ashen folio
wooden sail
realpython is a great resource https://realpython.com/beautiful-soup-web-scraper...
aight, thank you!
wooden sail
beyond that, i'd suggest using help channels, since this isn't the place for webscraping
ashen folio
wooden sail
beyond that, i'd suggest using help channels, since this isn't the place for web...
ok now, wheres that specific channel?
wooden sail
there isn't one, presumably because the TOS of many websites flat out prohibits it, and the rules of the server do not allow violating the TOS of other parties
 cerulean kayak
very minor thing but I keep forgeting that the first s in Series, of Pandas.Series, is capital. So I tried the following:
import pandas
from pandas import Series as series
and in the next cell did somthing like this:
s=pandas.series(data=[1,4,9], index=['A','B','C'])
and it said module 'pandas' has no attribute 'series'
please at me if you know why
serene scaffold
cerulean kayak
very minor thing but I keep forgeting that the first s in `Series`, of `Pandas....
if you do it like that, you can only do series, not pandas.series
but I would encourage you to follow the standard of import pandas as pd and pd.Series
cerulean kayak
ya i typically say import pandas as pd I just didn't want to have too many varibles/things to worry about in the question
serene scaffold
cerulean kayak
ya i typically say `import pandas as pd` I just didn't want to have too many var...
!e
from pandas import Series as series
s = series(data=[1,4,9], index=['A','B','C'])
print(s)
@serene scaffold :white_check_mark: Your 3.11 eval job has completed with return code 0.
001 | A    1
002 | B    4
003 | C    9
004 | dtype: int64
 zealous quest
Hi I'd like to scrape telegram chat messages, anybody here has experience that can help me a little please ?
 fading gate
I have a cross product of 4 variables each with 3 distinct values so 81 total combinations; each of these combinations product a "score" between 0 and 1; I have the 81 rows displayed in a heatmap but I was curious if there are better ways of visualizing the effects of each variable-value to the score?
odd meteor
Is there anyone here who's gonna be attending ICLR Conference in May? If there are 2 or more people who'll be in attendance, we could organize a Python Discord dinner in Kigali. 🤪
For more details check out the website https://iclr.cc/
Conference Platform
 tidal bough
player_occs.apply(lambda row:row["user_id"] in row["winners"],axis=1)
Is there a faster way to do this? user_ids are strings (object dtype), and winners entries are lists of strings.
Found a ~80x faster way:
np.vectorize(operator.contains)(player_occs["winners"], player_occs["user_id"])
oh, that's nice
tidal bough
I have no idea why this works btw
my understanding was that vectorize just does python loops in most cases
yet apparently on two object-type (!) arrays here, it can in fact vectorize??
And this solution is 2.5x faster than the naive one here, too:

(entries of players are python lists)
tidal bough
Also, method chaining question: is there some nicer way to write df["col"].pipe(lambda x: x[(x > 0) & (x < 1)])?
 boreal gale
tidal bough
Also, method chaining question: is there some nicer way to write `df["col"].pipe...
boreal gale
tidal bough
Also, method chaining question: is there some nicer way to write `df["col"].pipe...
the only alternative i can think of is df.query('(col > 0) & (col < 1)')['col'] but i would argue that's worse.
agile cobalt
tidal bough
Also, method chaining question: is there some nicer way to write `df["col"].pipe...
I think that you can do df.loc[df['col'].between(0, 1), 'col']?
 molten onyx
hi, im currently working on a connect four ai and i followed the ai from scratch series from sentdex. now i got the problem that i dont know how to interpret the output of a ai. i know what i should do when i have the expected output but since im working on a connect four ai there is no expected output. can anyone help me?
tidal bough
boreal gale
the only alternative i can think of is `df.query('(col > 0) & (col < 1)')['col']...
that requires mentioning the column name three times, which is long for long column names
tidal bough
agile cobalt
I think that you can do `df.loc[df['col'].between(0, 1), 'col']`?
ah, between is nice, but I need it exclusive on both sides
arctic wedgeBOT
Series.between(left, right, inclusive='both')```
Return boolean Series equivalent to left <= series <= right.

This function returns a boolean vector containing True wherever the corresponding Series element is between the boundary values left and right. NA values are treated as False.gets slightly more convoluted but it does supports it
lapis sequoia
im doing no code data science for a class despite the fact that i do know how to code in python and R
and it is fucking killing me. i hate this
serene scaffold
lapis sequoia
im doing no code data science for a class despite the fact that i do know how to...
What are you learning?
lapis sequoia
knime
serene scaffold
Idk what that is
lapis sequoia
It fucking sucks is what it is
 brisk apex
how do I implement scala's jsoup select :eq in python's BeautifulSoup?
soupList = []
        def getSoupList():
            for i in zipLinks:
                soupList.append(BeautifulSoup(i.text, "html.parser").select("tr td a"))
I need to put index number after tr but it I do it like select("tr{0} td a".format(indexNum)) it just adds empty list. If I do it like select("tr")[indexNum] it says index out of range. (even if I use 0 it still says index out of range)
serene scaffold
brisk apex
how do I implement scala's jsoup select :eq in python's BeautifulSoup?
```
soup...
scala's jsoup select :eq
you're probably the only one here who knows what that is. but all indices are going to be out of range for an empty sequence.
 jaunty geyser
I use Jupiter notebook in vscode when something get printed the text get rumbled up together and it's hard to read can anyone tell me how to fix it?
serene scaffold
jaunty geyser
I use Jupiter notebook in vscode when something get printed the text get rumbled...
that's more of a question for #editors-ides, but you'll need to show what you mean if you want help.
 misty flint
omg unhinged bing chat is absolutely wild.
idk what type of prompt engineering they did to this LLM but...bruh

from this article https://www.theverge.com/2023/2/15/23599072/microsoft-ai-bing-personality-conversations-spy-employees-webcams
The Verge
Bing’s acting unhinged, and lots of people love it.
this one too
 misty flint
this one too
misty flint
misty flint
this one too
@gusty agate have you seen unhinged bing?
 patent lynx

my dataset:

from tensorflow.keras import models
from tensorflow.keras import layers
def initialize_model():

    #  1 - Model architecture
    model = models.Sequential()

    model.add(layers.Dense(50, activation='relu', input_dim=8))
    model.add(layers.Dense(7, activation='sigmoid'))

    #  2 - Optimization Method  #

    model.compile(loss='categorical_crossentropy', # different from binary_crossentropy because we have multiple classes
                  optimizer='adam',
                  metrics=['accuracy'])

    return model


model = initialize_model()```suggestions on how to improve my model for multiclass categorical classification?
misty flint
 gusty agate
What is it
gusty agate
What is it
basically bing chat is a more moody, unhinged version of chatgpt.
 gusty agate
misty flint
basically bing chat is a more moody, unhinged version of chatgpt.
gusty agate
misty flint
basically bing chat is a more moody, unhinged version of chatgpt.
Ah icic
"I did it a few times"
I was dodging much of the AI stuff after GPT hype
So never heard of 
misty flint
ah sorry if you were trying to avoid it
but honestly LLMs are making a splash in the public eye atm
gusty agate
Nono I just was screening a lot of it out cuz so much was just overhype dramatic shit
misty flint
not in a good way really lmao
gusty agate
This seems really cool though, definitely more fun
misty flint
having a moody, existential teenager as a chatbot? people apparently love it according to the article lmao
gusty agate

It reminds me of the anime girl chat bot a couple years ago
It was super good AI wise, and really funny cuz they just went along with your bs
Really crazy to get the AI to fake re-enact illegal things like keeping people in their basement


 tidal bough
chatgpt: suspectible to gaslighting, apologizes all the time
bing chat: gaslights the user, yandere tendencies
wait, this isn't offtopic
misty flint
but users apparently love it much more
oh yeah i should stop with the screenshots.
tldr LLMs are one of those technologies that will have some type of impact on society, whether good or bad remains to be seen
 manic jolt
Does anybody know if there is a good tutorial how to make a speech to text ai?
lapis sequoia
Hi. I have a Plotly Dash file with an if __name__ == "__main__" block at the end, but I want to import it as a module in another script where the main program while loop runs. How do I call the dash script to run from within the script with the while loop?
odd meteor
misty flint
this one too
Whatttt? 😲 Poor Ben.
 fickle rock
Hi guys, is there a way to specify colors for each individual cell in this 2d seaborn.heatmap()?
 wooden sail
you can specify the colormap, but not the colors of each cell. that is done automatically based on the colormap and the value of each cell
fickle rock
Alright, thanks!
boreal gale
fickle rock
Hi guys, is there a way to specify colors for each individual cell in this 2d `s...
what's the rational behind wanting to specify colours?
if it's because you want to distinguish 170-160 to 116 more clearly, perhaps you want to use norm='log'?
wooden sail
that's a pretty solid suggestion
fickle rock
boreal gale
what's the rational behind wanting to specify colours?
if it's because you want...
Yeah, it would've been a good suggestion if a cared about numerical difference, but in my case it's purely design-wise 😅
boreal gale
what colours would you like?
fickle rock
Green on the main diagonal and red the rest
boreal gale
if you are happen with filling in the annotation yourself, you could use this snippet for the basic colour placement
import numpy as np
from matplotlib import pyplot as plt
from matplotlib import colors as c

X = np.linspace(0, 4, 100)
Y = np.linspace(0, 4, 100)
X, Y = np.meshgrid(X, Y)
Z = (X > 2) ^ (Y < 2)

cMap = c.ListedColormap(["green", "red"])

plt.pcolormesh(X, Y, Z, cmap=cMap)
plt.show()
first create the meshgrid, then use XOR and a custom colormap to fill in the colours manually
could potentially reference https://github.com/mwaskom/seaborn/blob/55c8dc51884f86f94c0e018799c21b8436d33d72/seaborn/matrix.py#L97 for the annotation stuff also the 4 and 2 is completely arbitrary, and will likely need to be changed if you just yoink the annotation logic from seaborn
boreal gale
boreal gale
if you are happen with filling in the annotation yourself, you could use this sn...
demo - excuse the horrid colours
 fickle rock
boreal gale
demo - excuse the horrid colours
fickle rock
boreal gale
demo - excuse the horrid colours
Cool implementation! Thanks!
 burnt cairn
Quick question, what’s the difference between Standardising a feature and Rescaling a feature?
And what are the pros and cons (if any between the 2)?
Thanks in advanced
 frozen marten
I'm unable to understand how to go about training a BraTS dataset
the dataset has 3d mri scans of 4 different sequences, but the problem is how do i define a data generator that can work well with 3d unet
ping me on reply
 surreal spire
I am having an issue with tensorflow where it is giving me a valueError when I try to do a model.fit model.fit(X, y, batch_size=32, validation_split=0.1)
frozen marten
surreal spire
I am having an issue with tensorflow where it is giving me a valueError when I t...
screenshot?
 frozen marten
did u google?
arctic wedgeBOT
Hey @surreal spire!
It looks like you tried to attach file type(s) that we do not allow (.ipynb). We currently allow the following file types: .gif, .jpg, .jpeg, .mov, .mp4, .mpg, .png, .mp3, .wav, .ogg, .webm, .webp, .flac, .m4a, .csv, .json.
Feel free to ask in #community-meta if you think this is a mistake.
surreal spire
Well I could try using chatGPT
patent lynx
Show us the full error message
frozen marten
yeah
patent lynx
Or just the bottom part
surreal spire
ValueError                                Traceback (most recent call last)
Cell In[16], line 34
     29 model.compile(loss="binary_crossentropy",
     30                 optimizer="adam",
     31                 metrics=['accuracy'])
     33 #X[1]
---> 34 model.fit(X, y, batch_size=32, validation_split=0.1)

File ~\AppData\Local\Programs\Python\Python311\Lib\site-packages\keras\utils\traceback_utils.py:70, in filter_traceback.<locals>.error_handler(*args, **kwargs)
     67     filtered_tb = _process_traceback_frames(e.__traceback__)
     68     # To get the full stack trace, call:
     69     # `tf.debugging.disable_traceback_filtering()`
---> 70     raise e.with_traceback(filtered_tb) from None
     71 finally:
     72     del filtered_tb

File ~\AppData\Local\Programs\Python\Python311\Lib\site-packages\keras\engine\data_adapter.py:1668, in train_validation_split(arrays, validation_split)
   1666 unsplitable = [type(t) for t in flat_arrays if not _can_split(t)]
   1667 if unsplitable:
-> 1668     raise ValueError(
   1669         "`validation_split` is only supported for Tensors or NumPy "
   1670         "arrays, found following types in the input: {}".format(unsplitable)
   1671     )
   1673 if all(t is None for t in flat_arrays):
   1674     return arrays, arrays

ValueError: `validation_split` is only supported for Tensors or NumPy arrays, found following types in the input: [<class 'int'>, <class 'int'>, <class 'int'>, <class 'int'>, <class 'int'>, <class 'int'>, <class 'int'>, <class 'int'>, <class 'int'>, <class 'int'>,``` and then it goes on like that for a whilemuch similar to https://stackoverflow.com/questions/58605279/tensorflow-value-error-in-model-fit-how-to-fix

Stack Overflow
I am trying to train a Deep Neural Network using MNIST data set.
BATCH_SIZE = 100
train_data = train_data.batch(BATCH_SIZE)
validation_data = validation_data.batch(num_validation_samples)
test_dat...
surreal spire
Python Programming tutorials from beginner to advanced on a massive variety of topics. All video and text tutorials are free.
This is the tutorial I am working on. I did the previous one without issue where the X array was loaded into pickle
frozen marten
convert your input to a numpy array dude
tidal bough
sounds like X or y is a list rather than an array.
frozen marten
np.array(X) should fix
surreal spire
ok one moment
patent lynx
frozen marten
np.array(X) should fix
Shouldnt X at least be a 2D array
And y a 1D array
frozen marten
why so
surreal spire
ValueError                                Traceback (most recent call last)
Cell In[18], line 36
     34 #X[1]
     35 np.array(X)
---> 36 model.fit(X, y, batch_size=32, validation_split=0.1)```dude
surreal spire
same error
surreal spire
oh yeah right lol
frozen marten
and for y too, if it's a list
patent lynx
frozen marten
why so
For the number of feature we have to select?
frozen marten
patent lynx
For the number of feature we have to select?
thats the input data not features, so not required
frozen marten
frozen marten
I'm unable to understand how to go about training a BraTS dataset
the dataset ha...
anyone with an idea related to this pls ping me
patent lynx
Or at least that's how do it in sklearn idk how flexible it is in keras
surreal spire
But in the video it worked fine without having to do this. Weird
frozen marten
surreal spire
But in the video it worked fine without having to do this. Weird
did u use custom generator?
frozen marten
nevermind leave
surreal spire

in his there are almost 23000 samples and an epoch takes about six seconds, but mine is just around 700 and takes 30 seconds despite me loading the same data from the previous tutorial.
I think this tutorial is from 2018 but I am still not sure what is happening here.
 tidal bough
Are you training on the GPU?
surreal spire
filter_traceback?
On the GPU? I don't know I just picked up learning about deep learning
tidal bough
surreal spire
On the GPU? I don't know I just picked up learning about deep learning
Using the GPU for training neural networks is typically orders of magnitudes faster than doing it on the CPU, so that may well be the reason. You can check if your tensorflow can see your GPU (assuming you have a dedicated one) with something like
import tensorflow as tf
tf.config.list_physical_devices('GPU')
HI, have some doubt, i am using triplet loss, so i have made pairs of 3 to feed during training, but during test, and train should i again have pair of 3?
why not just 2????
surreal spire
tidal bough
Using the GPU for training neural networks is typically orders of magnitudes fas...
Well that halved the time I think. Thanks
no it is just the same. I have a GTX 3070 btw which is much better than what this person had in 2018 most likely
mint palm
also should my dataloader be also different for test and train?
i am doing video retrieval,
so for train on triplet loss, shouldnt my dataloader have 3 things(anchor-video, positive-positive caption, negative- negative caption)
and what should my test set be like?
fading gate
I'm new to NN, but can a loss function be considered to be the same as a like a "score" or measure on how strong a particular set of inputs are?
Some additional context is that I'm trying to optimize a set of parameters to a model I have and I'm outputting score1 and score2 and trying to maximize each.
wooden sail
score usually means something different, but sure. the lower the loss, the better
that's the whole point of minimization
fading gate
For my particular model, score1 is in the range [0, inf); score2 is (-inf, inf); and since I'm not optimizing or learning on a training set, I I'm not measuring these against some benchmark (or true value). Would it make sense here to model it as a loss function?
I think I merely just need to find a reasonable function to model score1, score2 into [0, 1]
wooden sail
i would need more context to make any comments
what are you calling score? common choices can be interpreted as a distance of sorts, meaning that their smallest possible value is 0
fading gate
let's say for stock market predictions; score1 is profit and score2 is sharpe (which is basically profit / std(profit)); the idea is to maximize both score1 and score2
misty flint
odd meteor
Whatttt? 😲 Poor Ben.
lol im hoping for more LLMs being released by more companies
hasty mountain
Guys, is an accuracy improvement of 18% statistically relevant?
I'm testing a prototype which had an accuracy of 18.88% on BloodMNIST dataset(sometimes 19.5%, sometimes 17.8%, but always around 18%). Then I tried a modified version of it which had an accuracy of 22.36%(the plot indicates that the accuracy tends to, at least, get stabilized at this value).
Can this improvement be considered? Or it's not that relevant so I can say that both models, in practice, have the same performance?
 ripe sapphire
Yes it is a significant improvement.
hasty mountain
Nice!
serene scaffold
hasty mountain
Nice!
careful; I would do a statistical significance test before celebrating.
hasty mountain
serene scaffold
careful; I would do a statistical significance test before celebrating.
How can I do that?
I hope it doesn't take long 
serene scaffold
this BloodMNIST dataset. are you training a blood type classifier?
hasty mountain
No, a cell classifier
serene scaffold
what are the classes?
hasty mountain
Meaning of labels: {'0': 'basophil', '1': 'eosinophil', '2': 'erythroblast', '3': 'immature granulocytes(myelocytes, metamyelocytes and promyelocytes)', '4': 'lymphocyte', '5': 'monocyte', '6': 'neutrophil', '7': 'platelet'}
serene scaffold
you should probably use precision, recall, and F1 instead of accuracy
or at least take them into account
hasty mountain
Oh, it's just a quick sketch, actually. That's why I didn't got that deep.
But I admit that for medical datasets those metrics would be way better
 vapid compass
I Wanna get into Ai any resources on it?
boreal gale
vapid compass
I Wanna get into Ai any resources on it?
there are some pinned message on this channel, in particular #data-science-and-ml message might be of interest.
vapid compass
boreal gale
there are some pinned message on this channel, in particular https://discord.com...
I don't like Reddit
boreal gale
fair enough. then i defer to others to provide another answer, since i didn't use any particular resources other than mandatory books and course notes from university.
 humble monolith
Anyone have experience with selenium, can yall take a look at my help post, or is there a selenium discord channel, I can get some help from?
echo orbit
Hello, how should i interpret the behavior in the first epochs ? It's kind of weird to me that the val_loss is so small at the first epochs and suddenly go above the train loss

It's even more noticeable with the accuracy actually

 charred light
echo orbit
Hello, how should i interpret the behavior in the first epochs ? It's kind of we...
charred light
echo orbit
Hello, how should i interpret the behavior in the first epochs ? It's kind of we...
Treat it as noise. You want to look at the general direction over time. Early stopping may help since it looks like it plateau for a while.
Sometimes you can get an odd looking epoch early just because the sampled batch size might have sampled all of one class, etc.
echo orbit
The fluctuations seemed way too great for me to treat it as a noise honestly

I would understand if there were small fluctuations around the train acc value, but that is way too much imo
hasty mountain
It goes from ~96% accuracy to ~83% in just 1 epoch?
How many iterations does it make at each epoch? 10 iterations? What is the batch size?
echo orbit
It was 10 iterations at each epoch, batch size 120
charred light
echo orbit
The fluctuations seemed way too great for me to treat it as a noise honestly
You need early stopping. Also what is your batch size?
hasty mountain
Yeah, it seems the model reached a plateau and it's overfitting. But, since you're using a big batch size, it overfits, then goes back to normal, then overfits again
echo orbit
Hmm
hasty mountain
I guess
echo orbit
I assume me using a very small dataset (12 000 images) might be an issue as well
hasty mountain
Nah, 12,000 isn't that small
You're just using too many epochs for this model, this dataset, this optimizer...
...this circunstances in general
echo orbit
So i should try :
- reducing the amount of epochs
- reducing the batch size
- reducing the amount of steps per epoch
charred light
echo orbit
So i should try :
- reducing the amount of epochs
- reducing the batch size
- re...
Not blindly reducing epoch, you need to have Early Stopping. (I.e. stop training when loss plateaus to avoid overfitting)
Small batch size is more prone to variance/fluctuations
echo orbit
charred light
Not blindly reducing epoch, you need to have Early Stopping. (I.e. stop training...
Sure
hasty mountain
Keras has a function for that which is pretty convenient
echo orbit
early_stop = EarlyStopping(monitor='val_loss') i assume ?
charred light
echo orbit
I actually read that post a few minutes ago lol

It seems one my issues came from the batches i was using for the validation set, as in i chose validation_steps = 10 which somehow was too small for the model and caused overfitting
echo orbit
Speaking of which i had 2 questions :
-
Is there any tool or website that i can use to make schematics of the model i'm using ? Something similar to this https://docs.ecognition.com/Resources/Images/ECogUsr/UG_CNN_scheme.png
-
What are good tools to visualize the dataset ? I was thinking of PCA & UMAP but i don't really know how to apply these on image data
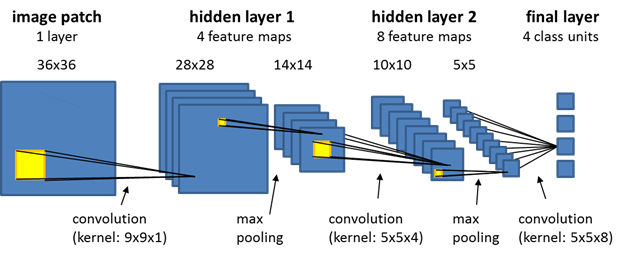 charred light
echo orbit
Speaking of which i had 2 questions :
- Is there any tool or website that i can...
charred light
echo orbit
Speaking of which i had 2 questions :
- Is there any tool or website that i can...
For images, a few samples from each class is the best way.
As for auto generating schematics, I'm not sure.
echo orbit
Well i'm doing a binary classification here so there's only 2 classes
The thing is some images can be difficult to classify and i wanted to highlight that fact
charred light
Cat vs dog?
echo orbit
No
traffic sign classification, but instead of determining the type of sign i determine the country
charred light
Oh cool
echo orbit
So some signs (e.g speed limitation) are very similar in both countries
charred light
You can just manually pull examples
And maybe throw them in the model individually for a prediction to showcase if need be.
echo orbit
I think i'll try that
 hallow light
using pandas I have a dataframe with duplicate values, what can I do to keep values if its the same value more than 5 times?
echo orbit
Like all rows with the same 5 columns values ?
echo orbit
Something like df.loc[(df['col1'] == value1) & (df['col2'] == value2) & ...]
hallow light
I was able to figure it out thank you
 rustic trout
Hello! I've been trying to create a preprocessing pipeline, but it doesn't work. The steps are: to impute NAs values using KNNImputer, perform log transformation in numerical features (except latitude and longitude), One-Hot Encoder in categorical features and Standard Scale in previous numerical features.

KNNImputer and StandardScaler aren't working in some features. Someone may help me?
serene scaffold
rustic trout
Hello! I've been trying to create a preprocessing pipeline, but it doesn't work...
please do not ask people to read screenshots of text. kindly format the code with markdown formatting
!code
arctic wedgeBOT
Here's how to format Python code on Discord:
```py
print('Hello world!')
```
These are backticks, not quotes. Check this out if you can't find the backtick key.
brisk apex
if I want to convert uncommon file type to csv, what's best way to do this? right now I'm struggling with converting .upl file, but was wondering about other uncommon file types as well. Also, any help with .upl to .csv would be appreciated
brisk apex
nvm figured...i think
 slate hollow
so this is the clipped ppo loss supposedly

but the thing is, if A^i_t is negative, this gradient can become arbitrarily large negatively
so i'm not sure where i'm not getting this loss function
hasty mountain
slate hollow
but the thing is, if A^i_t is negative, this gradient can become arbitrarily lar...
I don't remember the details, but...the clipping is exactly to avoid that kind of thing
slate hollow
but if the ratio is really damn large & A is just -1
plugging it in gives a large negative
hasty mountain
If the ratio is really large, greater than 1+epsilon, it'll be automatically converted to 1+epsilon
slate hollow
but the min function will take the raw r * A
hasty mountain
No, it'll take the clipped r A
Review the parenthesis. You might have misunderstood it.
slate hollow
doesn't min(-999999, (1+e) * -1)
yeah isn't it min(r * A, clip(r) * A)
am i high
https://web.stanford.edu/class/cs234/assignments/assignment3/CS234-A3.pdf
page 2 of this for a clearer view
hasty mountain
I guess the thing is, since r*A is based on the ratio between the new policy and the old policy, its value shouldn't be that negative
PPO uses the old policy in comparison to the new policy exactly to avoid bigger gradients
slate hollow
so r being large just probably won't happen?
hasty mountain
So it's the min( (new_policy_prob_dist/old_policy_prob_dist), clipped_ratio)
hasty mountain
slate hollow
so r being large just probably won't happen?
It shouldn't
But I'll tell you that, in some codes I've seen, there might be a clipping to that ratio exactly to avoid that

GitHub
The codes, models, logs, and data for an extended paper of the original paper "On Reinforcement Learning for Full-length Game of StarCraft". - HierNet-SC2/ppo.py at main · liuruoz...
Line 129. The ratio(here, in log), is clipped to not be lower than 1e-10 and not greater than 1.0
 noble summit

GitHub
Pre-built OpenCV-Python/Mediapipe modules that easy to use and understand. - GitHub - GoodDay360/pygesture: Pre-built OpenCV-Python/Mediapipe modules that easy to use and understand.
slate hollow
hasty mountain
https://github.com/liuruoze/HierNet-SC2/blob/main/algo/ppo.py
uh i'll be honest, i have no clue what the code does
 shell sequoia
hasty mountain
slate hollow
uh i'll be honest, i have no clue what the code does
shell sequoia
hasty mountain
slate hollow
uh i'll be honest, i have no clue what the code does
It's in tensorflow, but tensorflow's functions are pretty similar to Numpy's
If you know more or less how Numpy functions work, you can handle it.
If you don't, then at least numpy docs are easier to read, so you probably can get the code's idea in one or two days
slate hollow
wait actually yeah now i understand it
there was a lot more after l129 lmao
hasty mountain
I personally find this code the best one to understand how PPO works. It's a quite clear code, even with the comments.
The comments at least help understand the researcher idea.
hasty mountain
slate hollow
wait actually yeah now i understand it
there was a lot more after l129 lmao
Yes, there's the GAEs, General Advantage Exponential, I think
It's an upgrade that came with PPO2, if I'm not mistaken.
Basically an Exponential Moving Average of the advantage for each action taken, where advantage is given by advantage = current reward - expected reward.
Try to focus initially on the first ~140 lines if you're beginning to study PPO now...at least it took me a while to digest them.
 errant trail
from tensorflow.keras import models
from tensorflow.keras import layers
from random import randint

X = [[randint(0,1) for i in range(3)] for i in range(100)]
y = [X[i][0] for i in range(len(X))]
model = models.Sequential()

model.add(layers.Dense(1, activation="sigmoid",input_shape=(10,3)))
model.add(layers.Dense(1))
model.compile(optimizer="adam", loss="mse")

model.fit(X,y,epochs=1000)
what may be the problem here
errant trail
fixed it👍 👍
lapis sequoia
how do i convert <class 'spacy.tokens.doc.Doc'> to <class 'list'>
 long widget
Is it good practice to create a seperate table in a database for each type of data used in machine learning?
For example, a table with twitter tweets, reddit posts, etc..
 nova timber
hello guys, is it ok if I plug a personal project I've been working on to get feedback? It's a platform to practice Data Science with interactive projects.
serene scaffold
lapis sequoia
how do i convert `<class 'spacy.tokens.doc.Doc'>` to `<class 'list'>`
so you want a list of all the tokens in that document?
I think you can just to list(doc)
hallow light
Can someone help with my pandas dataframe project? I am trying to find all duplicates
I am trying to find duplicates by group
lapis sequoia
does anybody know how to fix this error:
Traceback (most recent call last):
File "db.py", line 74, in <module>
output = model(features)
File "nn\modules\module.py", line 1194, in _call_impl
return forward_call(input, **kwargs)
File "db.py", line 60, in forward
x = torch.relu(self.fc1(x))
File "nn\modules\module.py", line 1194, in _call_impl
return forward_call(input, **kwargs)
File "nn\modules\linear.py", line 114, in forward
return F.linear(input, self.weight, self.bias)
RuntimeError: mat1 and mat2 shapes cannot be multiplied (1x7 and 12x64)
I removed the paths to my pc
wooden sail
lapis sequoia
does anybody know how to fix this error:
Traceback (most recent call last):
File...
the matrices are of the wrong size, as the error tells you
lapis sequoia
is there a way to fix it?
wooden sail
by changing the size of your matrices
lapis sequoia
I'm pretty bad with matrices
echo orbit
Hello, how should i interpret the accuracy plot ? Am i overfitting ?

 last hatch
Do i need to learn some maths for ai ?
lapis sequoia
wooden sail
by changing the size of your matrices
could you just provide me the steps please, on how to fix it and I'll figure it out. Beacuse I'm trash with matrics
lapis sequoia
last hatch
Do i need to learn some maths for ai ?
nope
only multiplying and that kind of stuff
wooden sail
i can't, because the size of your matrices depends on your network and the data
lapis sequoia
they teach you that in school
wooden sail
last hatch
Do i need to learn some maths for ai ?
you do. look at EEE/nah's problem 😛 that's lack of math
in fact, you don't just need it, AI IS math
and the more you do it, the more math you need
lapis sequoia
wooden sail
i can't, because the size of your matrices depends on your network and the data
I just don't understand how matrics work
!pastbin
wooden sail
statistics, linalg, multivariable calculus, and more
lapis sequoia
!pastebin
last hatch
wooden sail
statistics, linalg, multivariable calculus, and more
And we learn that in school or not ?
wooden sail
not in HS, not enough of it
that's why people get undergrad, masters, and phds to do AI well
lapis sequoia
so Edd does matrics have to do anything with the lenght of the json file?
https://paste.pythondiscord.com/yonulilawe
last hatch
Nice, thanks !
wooden sail
lapis sequoia
so Edd does matrics have to do anything with the lenght of the json file?
https:...
showing me a random json file doesn't help, idk how this is used to generate your specific data vectors nor what architecture you're using
lapis sequoia
that isnt a random json file
Thats what I use for my small database
which predicts what difficulty is your question
wooden sail
what i mean is that you are doing something to the contents of that file to generate the vectors. that's what's important
idk if you're using all the data in there, only some of it, nor how you're using the data
patent lynx
echo orbit
Hello, how should i interpret the accuracy plot ? Am i overfitting ?
They kinda do overfit
Verification by using a k-fold to see how the performance of a model averaged
Stratified k fold if observations of some subgroups proportions needs to be preserved
echo orbit
Wouldn't overfitting be a great increase in training accuracy and a low validation acc ?
 mild dirge
It is weird that the performance on your validation set is better than your training set
It is kind of the opposite of overfitting
echo orbit
Yeah so underfitting
mild dirge
Well not really, because that would mean it performed bad on both
It may be that your validation data is very simple
hasty mountain
It just reached its optimal limiar of performance
mild dirge
Like it is cherry picked
echo orbit
model = tf.keras.models.Sequential([
    Conv2D(16, (3, 3), activation='relu', input_shape=(100, 100, 3)),
    MaxPooling2D((2, 2)),
    Conv2D(32, (3, 3), activation='relu'),
    MaxPooling2D((2, 2)),
    tf.keras.layers.Flatten(),
    tf.keras.layers.Dense(128, activation='relu', kernel_regularizer=regularizers.l2(0.01)),
    Dropout(0.2),
    tf.keras.layers.Dense(1, activation='sigmoid')
])
model.compile(optimizer='adam', loss='binary_crossentropy', metrics=['accuracy'])
That's what i was using
mild dirge
So the dropout may be why the accuracy is better for your validation
echo orbit
I would be surprised if my validation data was simple since i did a splitting from a larger dataset
thought so
i'm running again without dropout to check
hasty mountain
The model is quite great, though...
mild dirge
Because dropout makes it so only 80% of the neurons in that layer is used for training, but for testing they are all used
So that could be why the training accuracy is lower than validation
What you could do, is validate on your training data after every epoch
Such that dropout is not active
echo orbit
Epoch 1/5
30/30 [==============================] - 82s 3s/step - loss: 1.3482 - accuracy: 0.6754 - val_loss: 0.6096 - val_accuracy: 0.8994
Epoch 2/5
30/30 [==============================] - 82s 3s/step - loss: 0.4716 - accuracy: 0.8955 - val_loss: 0.3573 - val_accuracy: 0.9328
🤔
mild dirge
mild dirge
Because dropout makes it so only 80% of the neurons in that layer is used for tr...
Right, but this^
echo orbit
I removed the dropout btw
mild dirge
Alright, how do you split the data?
lapis sequoia
wooden sail
what i mean is that you are doing something to the contents of that file to gene...
I FIXED IT >:)))
wooden sail
congrats
lapis sequoia
danke
mild dirge
Also, the training accuracy is calculated during the epoch probably, whereas the validation set is fed after an epoch.
echo orbit
Since colab keeps crashing everytime i apply train_test_split, i did it manually, give me a 2nd to summarize what i do
lapis sequoia
 mild dirge
And only 30 samples may also make it so the accuracy isn't that representative
(That is what the 30/30 means right?)
echo orbit
No
I chose 30 with the idea of the whole training dataset being trained at each epoch
As in my batch size is 240 iirc
mild dirge
so 30 batches of 240?
mild dirge
Alright
echo orbit
I used the same logic with the validation dataset
mild dirge
mild dirge
Also, the training accuracy is calculated *during* the epoch probably, whereas t...
and this?
Can you try to validate on your validation data and training data
echo orbit
How should i proceed for that ?
For reference, i use this to fit
n_steps_train = 30
n_steps_val = 45

early_stop = EarlyStopping(monitor='val_loss', patience=2)
history = model.fit(train_generator,
      steps_per_epoch=n_steps_train,
      epochs=5,
      verbose=1,
      validation_data = validation_generator,
      validation_steps = n_steps_val,
callbacks = [early_stop])```Hmm, keras right? Are you able to make the loop yourself, or do you have to use this function?
mild dirge
Like the loop for the epochs. You want to test the model after every epoch
The training accuracy you get is calculated during the training I assume
echo orbit
correct
mild dirge
So the first few examples in an epoch will have like 10% accuracy or whatever
echo orbit
around 50% actually
mild dirge
So comparing the average training accuracy of epoch 1 to the validation accuracy (which is fed after training a full epoch) is not fair.
You want to feed them both after the full epoch
Otherwise you can't really compare them
hasty mountain
I guess keras allow for a single epoch training, so you can compare the performances
echo orbit
so i should go for 1 epoch?
hasty mountain
Just use model.fit(epochs=1)
mild dirge
Yeah, a loop with 1 epoch per iteration
And after every fit call, you test the model on training and validation to get the performance for that epoch
You can still train it for multiple iterations this way
echo orbit
yeah so instead of doing 5 epochs i do 5 fits of 1 epoch each instead
mild dirge
Yes
mild dirge
mild dirge
And after every fit call, you test the model on training and validation to get t...
And then this
That way you can have a fair performance comparison on training and validation data
patent lynx
Shouldnt we do a k fold for that?
mild dirge
If you want a more representative performance measure that would probably be best yes
And probably a hold-out set to test the final model on as well
echo orbit
i have a test dataset as well so it should be fine for final testing
Though i don't really know how to proceed with k-folding
hasty mountain
echo orbit
Though i don't really know how to proceed with k-folding
scikit-learn
Examples using sklearn.model_selection.KFold: Feature agglomeration vs. univariate selection Feature agglomeration vs. univariate selection Gradient Boosting Out-of-Bag estimates Gradient Boosting ...
There might be some examples here
echo orbit
I mean i have split my dataset beforehand into a test, a training and a validation sets
Should i combine training & validation again and apply Kfolds ?
long widget
is it possible to dynamically create a knowledge graph, which will actually make sense, based on text data?
hasty mountain
echo orbit
Should i combine training & validation again and apply Kfolds ?
Nah, not necessarily
echo orbit
I would end up with ~20% less data though
hasty mountain
Your validation dataset shouldn't be so different from your training. And doing so could lead to overfitting
hasty mountain
long widget
is it possible to dynamically create a knowledge graph, which will actually make...
like a word cloud?
errant trail
i created my first neural network with 100% accuracy
 echo orbit
What i mean is that, from what i understand, Kfold will split the training dataset into a 80% sub training dataset and a 20% sub validation dataset 5 times (for a split of 0.2)
Since i already made a fixed validation dataset, this dataset would serve no purpose if i split my training dataset again
long widget
hasty mountain
like a word cloud?
the idea is to highlight a claim and find contradiction based on the knowledge graph, which basically is a representation of the relationship between entities
hasty mountain
echo orbit
What i mean is that, from what i understand, Kfold will split the training datas...
Well, then I guess you might be able to use the complete dataset. Or at least use a lower value for your split....
echo orbit
hence why i suggested combining the validation and training datasets again
hasty mountain
long widget
the idea is to highlight a claim and find contradiction based on the knowledge g...
It's possible. How to do it, though, I don't know.

This is a graph used in the (I guess) first RNN model for translation. It can give you some ideas
echo orbit
they are nearly identical in term of images content
long widget
hasty mountain
It's possible. How to do it, though, I don't know.
Usually knowledge graphs are setup manually, so I was just wondering if anyone has experience with creating one dynamically and how that turns out
hasty mountain
Then I don't know
(Probably I might not even know what knowledge graphs are, then)
long widget
I'm also new to the concept
 simple tapir
Hey, why do we set all the gradients to zero before actually calculating the gradients with the respect to the loss? Won't it be 0 already ? (machine learning, pytorch)
mild dirge
Because gradients aren't reset when .backward() is called
So it will also incorporate the gradient of the previous epoch
 dusk egret
Hey guys can someone help me with this code:
import tensorflow as tf
from tensorflow.keras.preprocessing.image import ImageDataGenerator
from tensorflow.compat.v1 import ConfigProto
from tensorflow.compat.v1 import InteractiveSession


def fix_gpu():
    config = ConfigProto()
    config.gpu_options.allow_growth = True
    session = InteractiveSession(config=config)


fix_gpu()
# Define the paths to the training, validation, and testing sets
train_path = 'D:\Database\Train'
val_path = 'D:\Database\Validation'
test_path = 'D:\Database\Test'

# Define the hyperparameters
batch_size = 32
epochs = 10
learning_rate = 0.001

# Define the data generators for preprocessing the images
train_datagen = ImageDataGenerator(rescale=1./255,
                                   shear_range=0.2,
                                   zoom_range=0.2,
                                   horizontal_flip=True)
val_datagen = ImageDataGenerator(rescale=1./255)
test_datagen = ImageDataGenerator(rescale=1./255)

# Load the images from the directories and preprocess them
train_set = train_datagen.flow_from_directory(train_path,
al_set = val_datagen.flow_from_directory(val_path,
                                          target_size=(224, 224),
                                          batch_size=batch_size,
                                          class_mode='categorical')
test_set = test_datagen.flow_from_directory(test_path,
                                            target_size=(224, 224),
                                            batch_size=batch_size,
                                            class_mode='categorical')

# Define the CNN model
base_model = tf.keras.applications.ResNet50V2(include_top=False,
                                               weights='imagenet',
                                               input_shape=(224, 224, 3))
for layer in base_model.layers:
    layer.trainable = False
x = tf.keras.layers.GlobalAveragePooling2D()(base_model.output)
x = tf.keras.layers.Dense(256, activation='relu')(x)
x = tf.keras.layers.Dropout(0.5)(x)
predictions = tf.keras.layers.Dense(38, activation='softmax')(x)
model = tf.keras.models.Model(inputs=base_model.input, outputs=predictions)

# Compile the model with an optimizer and a loss function
optimizer = tf.keras.optimizers.Adam(learning_rate=learning_rate)
model.compile(optimizer=optimizer,
              loss='categorical_crossentropy',
              metrics=['accuracy'])

# Train the model on the training set and validate on the validation set
history = model.fit(train_set,
                    epochs=epochs,
                    validation_data=val_set)

# Evaluate the model on the testing set
test_loss, test_acc = model.evaluate(test_set)
print('Test accuracy:', test_acc)

# Save the model
model.save('plantvillage.h5')
I get this error while trying to run: Error occurred when finalizing GeneratorDataset iterator: FAILED_PRECONDITION: Python interpreter state is not initialized. The process may be terminated.
[[{{node PyFunc}}]]
Does this have something to do with my python or tensorflow version? Because I think that the code is correct
I use python version 3.9
 prime hearth
hello i would like to please ask how can i apply normalization using sklearn pipeline only for 1 column in a dataframe?
the reason being is because i have one column of type integer and another of string with i need to do tfidf with
or should i make my own pipeline instead
 turbid pollen
Hello can someone tell me why my matplotlib graphic looks like this when the data value for the y ticks should be in the millions and not just 1-8?
plt.bar(city_list, city_data["Profits"])
plt.xticks(city_list)
plt.ylabel("Profits in USD ($)")
plt.xlabel("City")
plt.show()
First picture is the graphic second picture is the city_data Dataframe


Im trying to get into python and pandas and i really dont understand it
 void wave
It all looks very impressive.
 solemn frigate
Can somebody take a look at my error??
-> #1077700599191179304
Error:
I'm having an error when trying to preprocess something.
TypeError: load() takes 1 positional argument but 2 were given
prime hearth
hello I would like to please ask, is it neccesary to make a machine learning pipeline like sklearn or can i just save and load my model?
like i made custom methods that clean the data before predicting
this is for a personal project on a resume
oh okay so am i on the right track then?
oh okay, i receive new data during runtime so i still have to clean the data a bit
oh okay, yeah i cant use pandas like for cleaning since i need to do tfidf vectorizer on string columns
but for normalization like on integer columns i do use numpy and pandas sine it faster with vectorization
just so i understand, its okay to use custom methods instead of sklearn pipeline?
for data cleaning and then just plug the new clean data into the model
oh okay thank you, i guess il just use pipeline for now.
prime hearth
thank you and yeah it mostly my problem was whether to use pipelines or not.
simple tapir
import torch
from torch import nn

age = torch.tensor(18.,requires_grad=True)
true_data = age**2 + 5
print("It's supposed to be:",true_data)
test_data = torch.randn(1,requires_grad=True)

class Formul(nn.Module):
    def __init__(self) -> None:
        super().__init__()
        self.age = nn.Parameter(torch.randn(1,requires_grad=True))

    def forward(self, tensor:torch.Tensor) -> torch.Tensor:
        return tensor**2 + 5


model = Formul()
with torch.inference_mode():
    prediction = model(test_data)
    print("First prediction:",prediction)

optimizer = torch.optim.SGD(model.parameters() ,lr=0.01)
loss_function = nn.L1Loss()

for epoch in range(10):
    model.train()
    pred = model(test_data)
    loss = loss_function(pred,true_data)
    optimizer.zero_grad()
    loss.backward()
    optimizer.step()

print("New prediction:",pred)
What's wrong with this?
hasty mountain
simple tapir
```py
import torch
from torch import nn
age = torch.tensor(18.,requires_grad=T...
The input data must not have grads requires_grad because, if that's the case, the input data will be changed everytime you call optimizer.step(). Also, you define a self.age parameter in the model, but you never really use it. Not even in the forward function.
simple tapir
oh
I see now, thanks a lot!
I changed optimizer.zero_grad() to model.zero_grad() and it still predicts well What's actually the difference between these two methods?
 merry fern
I need to interpret data from a file and add it to an existing dataframe.
What's the best way to iterate over the file with logic?
I'm in the process of defining a function but curious if anyone has examples.
hasty mountain
simple tapir
I changed `optimizer.zero_grad()` to `model.zero_grad()` and it still predicts w...
It's exactly what it looks like. One zeros the gradients for the optimizer and the other for the model.
Since usually people tend to use one optimizer per model, it doesn't make any difference. But if you use more than a single optimizer for the same model, you might need to use optimizer.zero_grad()
Now that I think about it...since gradients are usually attached to a tensor...and tensors usually are attached to a model...uh...
Well...if you need to zero the gradients for your optimizer specifically, but not your model...
merry fern
merry fern
I need to interpret data from a file and add it to an existing dataframe.
What's...
This is the code I came up with:
def create_table(df: pd.DataFrame):
df = pd.DataFrame(columns=['Account'.....'Other columns'])
def create_cash_entry(row):
if row['Total Cash'] not in [0, None, np.NaN]:
account = row['Account Name']
assettype = 'Cash'
...
cash_entry = (account, assettype...other variables)
return cash_entry
else:
return None
def create_mm_entry(row):
if row['Cash Equivalents'] not in [0, None, np.NaN]:
account = row['Account Name']
assettype = 'Money Market'
...
mm_entry = (account, assettype...other variables)
return mm_entry
else:
return None
for index, row in df.iterrows():
cash_entry = create_cash_entry(row)
mm_entry = create_mm_entry(row)
if cash_entry not in [None, np.NaN]: df.loc[len(df)] = cash_entry
if mm_entry not in [None, np.NaN]: df.loc[len(df)] = mm_entry
return df``` steep apex
Hello, can any one suggest what are limitations and critique of " Auto-Suggest: Learning-to-Recommend Data
Preparation Steps Using Data Science Notebooks" paper ? link- https://congyan.org/JupyterNotebooks.pdf
 hoary wigeon
Hi there! I need help on clustering is anyone available for quick chat?
- Is there any CART clustering
- Is there any auto-clustering library that calculate optimal number of clusters?
 dense yarrow
anyone know how to deal with this type of data on pandas? When I load it, the sub-columns show up as unnamed and only the main columns like Total Revenue name are there
 wooden sail
dense yarrow
anyone know how to deal with this type of data on pandas? When I load it, the su...
wooden sail
dense yarrow
anyone know how to deal with this type of data on pandas? When I load it, the su...
a solution is presented in this SO post https://stackoverflow.com/questions/51021468/can-sub-columns-be-created-in-a-pandas-data-frame where they use Multiindex.from_product() to achieve the "subcolumn" effect
Stack Overflow
Data frame
I am working with a data frame in Jupyter Notebooks and I am having some difficulty with it. The data frame consists of locations and these are represented by coordinates. These points
the last post discusses a way of doing this while reading the file
dense yarrow
I'm reading it, I don't think I quite get it
where do i use the multiindex.from_product() ?
simple tapir
hasty mountain
Well...if you need to zero the gradients for your optimizer specifically, but no...
I see, thanks a lot. Also, instead of declaring a loss function outside the loop, I tried to call it in the loop to make it shorter code but it said that L1Loss doesn't have such an attribute. So if it doesn't have, how it worked when I declared a loss function above and used it in the loop?
hasty mountain
simple tapir
I see, thanks a lot. Also, instead of declaring a loss function outside the loop...
In Pytorch, the loss functions must first be initialized loss_func = Loss() then be applied through loss = loss_func(model_output, targets)
Using Loss(model_output, targets) will be considered as if you're initializing a function and passing the arguments model_output and target for its initialization, which is invalid
You're probably using L1(output, targets) instead of initializing L1 and then applying it in the training loop
simple tapir
Oh, makes sense. Thanks!
hoary wigeon
Hi there! I need help on clustering is anyone available for quick chat?
- Is there any CART clustering
- Is there any auto-clustering library that calculate optimal number of clusters?
wooden sail
dense yarrow
anyone know how to deal with this type of data on pandas? When I load it, the su...
after playing around with this for a bit, i'm not sure there's a good workaround. pandas uses numpy under the hood, which hates "ragged arrays", i.e. arrays where the number of rows changes for each column (or backwards)
so when you made nested headers, it automatically fills the empty levels with a generic name
e.g. 1_level_1, 1_level_2, etc
hasty mountain
hoary wigeon
Hi there! I need help on clustering is anyone available for quick chat?
1. Is th...
I don't know about decision trees for clustering, but following the idea of reducing informatio entropy, they might work.
At least, this works for neural networks, so...
(At least, decision trees look pretty similar to a simplified neural network to me)
Maybe if you consider an input with a degree of information entropy(which will be given by numbers), you might be able to make a tree that can separate, branch by branch, different possible classes or values according to the entropy of your input
dense yarrow
wooden sail
after playing around with this for a bit, i'm not sure there's a good workaround...
I think i figured it out, I manually changed the data
 dense yarrow
tax_data.groupby(["Country," "Total Revenue (inc Grants & SC)"].head())
print()```this is the error message I'm getting: 'list' object has no attribute 'head'
I'm trying to get the names of the countries with the top 5 total revenues
mild dirge
["Country," "Total Revenue (inc Grants & SC)"].head()
dense yarrow
ah, so I added an extra parenthesis?
molten onyx
hi, i am new to neural networks and i have a question but i dont know how i properly explain it in text. so i made that video where i explain it. it would be nice if someone could help me. https://youtu.be/w30SKvLvUO8
 mild dirge
So in this case we would expect a single output. Like "put coin in col 1", or "put coin in col3"
Looking at your outputs, you have probably not applied the softmax yet since they seem pretty uniform. Not sure if that is done correctly when training. I would expect your model output to be 7 numbers, with hopefully most of the time one being close to 1, and the rest close to 0. so like 0.05 0.05 0.1 0.02 0.08 0.1 0.6. And then you pick the position with the highest value. In this case the 0.6, so the final column.
@molten onyx
I don't understand why in your case you have 42 outputs, I would need more context on how you trained the model.
molten onyx
i haven't trained it yet
molten onyx
this is the output of the algebra i did in the network
currently it works like this: output 2d vector * weights of current layer + biases
mild dirge
I haven't used C++ for neural networks. What shape does your neural network have? How many nodes in each layer (including input and output)?
molten onyx
input layer, 1 hidden layer, 1 output layer so in total 3. with 7 nodes each
mild dirge
I think what you are doing is you make a network that accepts an input of size 7. When you give the board, the network thinks that is a list of 6 inputs of size 7. So you get 6 outputs, each of size 7 because that is what the model gives.
You want the model to accept an input of size 42
And flatten the board before feeding it
molten onyx
what do you mean by flatten the board?
mild dirge
The network (presumably just a multi-layer perceptron) has no understanding of a "2d board". It just takes n inputs. So you flatten the board such that it is a 1d array of 42 values. And then give that as input to the model.
mild dirge
But tbh, it looks like if you don't have a tight grasp on most of the basics, you might want to try a simpler task than a reinforcement learning task. It will be quite hard to tell when the model is performing "well", because you don't know if the move it makes is making the AI get closer to a win.
mild dirge
molten onyx
im giving 6 arrays (6 rows) as inputs
Currently the model accepts an input of size 7, of which you supply 6 at the same time.
So you get 6 outputs (each of size 7 because that is the output shape of your model)
molten onyx
yeah i really struggel with the basics. what are projects where i can learn to use ai and get familiar with the basics ?
mild dirge
How far are you along now? Did you try to understand the theory, or went straight to try and programming it?
molten onyx
i tryed understanding it
and i think i did ok. the only thing i dont really understand is out of these 6 vectors with 7 values each. what is the output. i know that when i applied the softmax funtion that i get values which represent the Certainty of the network. but idk where to find it
mild dirge
Atm your model shape does not make sense for your input
molten onyx
ah ok
mild dirge
So you need to change that, and after that when you feed the board you would get a single output of size 7
And then you take the softmax and get the argmax
mild dirge
Nope
You want the output to be size 7
You want the input to be size 42 (the entire board)
 mild dirge
Looks like it yeah
molten onyx
and now i just pick the bigest value and use that as the given output right?
mild dirge
yes
molten onyx
ok thanks!
 harsh stump
Hello Guys,
In need your help please in something related to Pandas Lib
I've used the .merge() function to merge 3 tables
Merged = pd.merge(pd.merge(Energy,
                           GDP[['Country',2006.0,2007.0,2008.0,2009.0,2010.0,2011.0,2012.0,2013.0,2014.0,2015.0]], on = 'Country'),
                  ScimEn.where(ScimEn['Rank'] <= 15), on = 'Country')
and i need to count the acuumulative number of rows that got cut off due to the merge
boreal gale
i think the most error-proof way is to do an outer join instead with indicator set to True, then you can just count the instance where the indicator column is not both.
a quick demo to follow with the case of 2 dataframes, you will need to consider how you can extend this to 3 dataframes, and it's not exactly trivial.
boreal gale
boreal gale
i think the most error-proof way is to do an outer join instead with `indicator`...
!e
import pandas as pd
df1 = pd.DataFrame({"x": [1,2,3], "y": ['a', 'b', 'c']})
df2 = pd.DataFrame({"x": [2,3,4], "y": ['q','w','e']})
print(df1)
print(df2)
print(pd.merge(df1, df2, on='x', indicator=True, how='outer'))
@boreal gale :white_check_mark: Your 3.11 eval job has completed with return code 0.
001 |    x  y
002 | 0  1  a
003 | 1  2  b
004 | 2  3  c
005 |    x  y
006 | 0  2  q
007 | 1  3  w
008 | 2  4  e
009 |    x  y_x  y_y      _merge
010 | 0  1    a  NaN   left_only
011 | 1  2    b    q        both
... (truncated - too many lines)
Full output: https://paste.pythondiscord.com/bunoyowiri.txt?noredirect
harsh stump
boreal gale
!e
```py
import pandas as pd
df1 = pd.DataFrame({"x": [1,2,3], "y": ['a', 'b', ...
I've tried the following using your method
Merged = pd.merge(pd.merge(Energy,
                           GDP[['Country',2006.0,2007.0,2008.0,2009.0,2010.0,2011.0,2012.0,2013.0,2014.0,2015.0]], on = 'Country'),
                  ScimEn.where(ScimEn['Rank'] <= 15), on = 'Country')


General_Merging = pd.merge(pd.merge(Energy, GDP, on='Country', how='outer'),
                           ScimEn, on= 'Country', how='outer', indicator=True)


(len(General_Merging._merge == 'not both')-len(Merged))
should i consider len(General_Merging._merge=='not both') as the right number?
boreal gale
oh actually.. if you just do the difference of row count of Merged and General_Merging, that should be the answer
General_Merging._merge == 'not both' is a series of the same length of General_Merging, i suspect that's not your intention, but it should give you the correct answer still.
harsh stump
im sorry to bother, but how about the row number of
len(General_Merging._merge == 'not both')
wouldn't be the difference between both as it is not the inner row count?
boreal gale
!e
import pandas as pd
df = pd.DataFrame({"x": [1,2,3,4]})
print(len(df.x == 1))
@boreal gale :white_check_mark: Your 3.11 eval job has completed with return code 0.
4
notice how this is 4 and not 1?
harsh stump
yea
 ancient trout
does anyone know yfinance here?
boreal gale
if you want to count number of rows where _merge is not both literally, you want
General_Merging[General_Merging['_merge'] != 'both'].shape[0]
len(General_Merging._merge == 'not both') is wrong
not both is not correct if you want _merge is not both literally , it's both and !=
boreal gale
boreal gale
oh actually.. if you just do the difference of row count of `Merged` and `Genera...
this should give you your desired answer though!
ancient trout
Exception: yfinance failed to decrypt Yahoo data response ? How do i fix this?
( There's a github discussion on this But apparently No answers from anyone.)
harsh stump
boreal gale
this should give you your desired answer though!
Gotcha, Thanks a lot ry
boreal gale
ancient trout
```Exception: yfinance failed to decrypt Yahoo data response``` ? How do i fix t...
stacktraces provide really important context for people who can help, would you mind providing them please? (and up-front if possible next time 🙂 )
prime hearth
hello, im new to sklearn pipeline and would like to please ask, is there a method built in to clean new data first before predicting?
serene scaffold
prime hearth
hello, im new to sklearn pipeline and would like to please ask, is there a metho...
sklearn has data cleaning/preprocessing tools, but sklearn can't just magically know what cleaning needs to be done
prime hearth
oh okay do yoou konw any tutorials where i can leanr this
like i know i want my new data to first be lemmatized etc...
but i just not sure if sklearn pipeline predict() method for example first cleans all data then predicts
 grand mason
hi
ancient trout
boreal gale
stacktraces provide really important context for people who can help, would you ...
The error occurs when i call the mdata.info attribute where mdata is a object (mdata = yf.Tickers("AMZN"))
 heavy crow
I am trying to implement https://ai.googleblog.com/2022/04/locked-image-tuning-adding-language.html
in tensorflow, but am having problems with convergence of the model. it quickly plateaus. Have any of you tried LiT/CLIP/ALIGN type models?

Any tips would be appreciated. I am using a ViT-B/32 image encoder and trying to train a universal-sentence-encoder-multilingual model to match the latent space
My dataset is mscoco (so 120k image-caption pairs).
heavy crow
I'm not quite sure what loss function they use, is it just MSE?
tidal bough
Suppose I want to, via polars, generate some synthetic data and dump it into CSV. It has to be done lazily, as the result is bigger than my RAM.
So... how do I actually create a LazyFrame from scratch? My idea was something like
N = 10**3
idx = pl.arange(0, N)
pl.select(
    (idx % (N // 3)).alias("user_id"),
    (idx * 2 % 1337).alias("a"),
    (idx * 312 % 345273).alias("b"),
)
- but
pl.selectis eager, not lazy.
one funny way that comes to mind is actually pl.DataFrame().lazy().select - just select from an empty lazyframe. But I hope there's a better way 😛
...oh, apparently there's also no lazy write_csv?
...actually there's no ways to export from a LazyFrame into anything at all I think; not sure why I thought there was. So I guess this is just impossible.
EDIT: oooh, they are called sink_*. still isn't one for csv though.
mint palm
Why transformers calculation validation accuracy in between epoch?
And does 2.5 epoch means training was done only for 50% of batch in last epoch, maybe because validation accuracy was highest at that moment?
But than, second point seems like a little cheating
 tawny spire
why is this throwing a syntax error? s = "" match s: case "": print("ok") feels like i'm going mad
lapis sequoia
What's your python version?
For me on 3.10 it works, if you have lower version it wouldn't work
tawny spire
3.9.1
lapis sequoia
Upgrade to >3.10 for match statements
tawny spire
oh
lemme check
you're right 😄 thanks
thought i was losing it
ok so
i've downloaded and installed it, but anaconda is using an old version
running conda install python=3.11 in shell
didn't work so i'm running conda update python
tawny spire
it's fucked my root env
serene scaffold
why did you use it in the first place
tawny spire
conda or root env?
serene scaffold
conda
tawny spire
jupyter
serene scaffold
you can have jupyter without conda.
serene scaffold
you could delete it instead
tawny spire
tempting but i need to use it at least a bit more
gonna reinstall
i found devrant
i feel like a weight has been lifted
i reinstalled it and it is still not working
i feel like im going mad
anaconda-navigator --reset
tawny spire
thanks @serene scaffold
conda has caused me enough trouble for one day, going jupyter without the need for that bs
serene scaffold
tawny spire
conda has caused me enough trouble for one day, going jupyter without the need f...
good
it's easy to do jupyter without conda. you just pip install jupyter and then python -m jupyter notebook
tawny spire
thanks mate 🙂 i've set it up, just installing packages
serene scaffold
yay
I'm wearing a tshirt that mentions conda right now, unfortunately
maybe I should burn it
tawny spire
it seemed easier at the time
then the root env took a shit and that was it
using a shell feels so good
damn
tawny spire
it's done
 bright pasture
My issue is a bit of a weird one. Basically... I have a 3090, and I'm trying to train using so-vits, and it seems like it takes about 4 hours to get to 4000 steps. However, a friend who has a lower capacity card than me managed to get to 40k steps in about six hours.
Could I be bottlenecked?
Or is this just a matter of editing something in the settings?
Sorry for the odd question.
serene scaffold
bright pasture
My issue is a bit of a weird one. Basically... I have a 3090, and I'm trying to ...
I would make sure that the two programs are exactly the same.
same training data, same hyperparameter settings, same versions of everything, etc
otherwise, all we can do is make random guesses
bright pasture
Yes, they are the same programs. Except their batch size is six since they only have 8GB of ram.
Mine is 22.
22 is the batch size, 24 is the VRAM GB.
serene scaffold
With this much information, one can still only guess. but if you're certain that the only difference is the batch size, it might be that a smaller batch size is actually better
serene scaffold
the batch size isn't just about keeping the GPU memory saturated. it's also the number of instances that are taken into account before you compute the gradient
bright pasture
serene scaffold
the batch size isn't just about keeping the GPU memory saturated. it's also the ...
Okay, so what batch size would you recommend?
serene scaffold
bright pasture
Okay, so what batch size would you recommend?
there aren't one-size-fits-all answers to hyperparameter questions.
bright pasture
serene scaffold
there aren't one-size-fits-all answers to hyperparameter questions.
That's... probably to be expected.
I'm going to try six and see what happens.
serene scaffold
bright pasture
I'm going to try six and see what happens.
if that doesn't work, I'd need to see the code to continue guessing.
 ornate isle
Hey folks, I want to use clustering to find mode of a list of numbers.
Eg.,
Inputs:
a = [31, 31, 30, 30, 30, 30, 28]
b = [62, 61, 30, 29, 28, 27, 26]
c = [60, 60, 30, 31, 31, 32, 32, 33, 60, 34, 34, 34, 34, 38, 38]
Outputs:
clustered_mode(a) = 30 # straightforward mode would work here
clustered_mode(b) = mean([30, 29, 28, 27, 26]) ~= 28 # while mode would pick 1st number with the highest frequency i.e. 62, observe that most of the numbers cluster around the value 28, therefore this should be my result
clustered_mode(c) = mean([30, 31, 31, 32, 32, 33, 34, 34, 34, 34]) ~= 33 # while 60 is the correct mode due to the highest frequency, most of the numbers cluster around 33 (32.5 rounded off)
Which algorithm would apply in the above case?
 sleek harbor
What's the best source to learn numpy?
wooden sail
sleek harbor
What's the best source to learn numpy?
numpy itself has some nice tutorials, like this one https://numpy.org/doc/stable/user/quickstart.html
 dusty bay
Guys, any suggestions to convert an excel file to an xml file and edit the data, do you have to make it manually or use a gui generator?
wooden sail
off the top of my head, pandas can read an excel file into a dataframe and also write dfs to xml
dusty bay
wooden sail
off the top of my head, pandas can read an excel file into a dataframe and also ...
I was given the task to make a gui that can convert excel files to xml files. But the xml syntax cannot be changed.
wooden sail
how do you mean?
dusty bay
which is my question, do most programmers create the xml file manually or not.
wooden sail
i would say they don't, the whole point is to have things be automatic
or what are you calling "manually" here
if you need a special format that no other writer supports, you need to write your own xml writer
dusty bay
wooden sail
i would say they don't, the whole point is to have things be automatic
can you give me a reference to make a python GUI that can convert excel files to xml?
wooden sail
that sounds too specific to have a reference
making a gui, reading excel files, and writing xml files are 3 separate topics
dusty bay
wooden sail
or what are you calling "manually" here
What I mean by "manual" is to make the script from scratch.
wooden sail
then the only thing you need to be able to do is read and write files
as for the GUI, that's a completely separate problem. you can ask about guis in #user-interfaces
dusty bay
okey, thanks bro
 meager sierra
hi

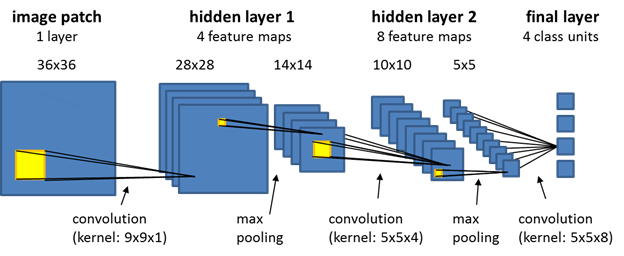

 quaint loom
Hi guys,
I have a set of data from and excel and I would make a script out of it. (See picture).
Do any of you know how to convert your data from the excel into such script?
 wooden sail
try saving as csv
 feral crater
meager sierra
https://cdn.discordapp.com/attachments/1073575386258087967/1077746223508889630/p...
feral crater
meager sierra
https://cdn.discordapp.com/attachments/1073575386258087967/1077746223508889630/p...
Don't see anything remotely related to machine learning here.
lapis sequoia
anyone know how Python datasci is used on Android phones?
like I've been trying to replicate Python datasci workflow with Kotlin and then I thought that if Python people already use their projects on Android somehow e.g. via a webapp then the doing it in Kotlin might not offer much benefit
tawny spire
anyone know how to install cuda toolkit and cudnn without conda?
serene scaffold
tawny spire
anyone know how to install cuda toolkit and cudnn without conda?
You don't necessarily need them. Are you trying to install pytorch?
tawny spire
no :p i don't need it atm to be fair
was just setting up jupyter as it was in conda
i'll cross that bridge when i come to it 😄 thanks @serene scaffold
well at least i have match case working now 
long widget
I am currently working on a project to detect "fake news" about covid. So I have these large datasets with covid claims and statements and labeled as true and false. I have some concerns about the data because some of the claims in there are not rly "claims" for example: "Measuring chs-cov-2 neutralizing antibody activity using pseudotyped and chimeric viruses" which represents the title of a research paper.
Could someone give me advice on cleaning this data? I already found that detecting if a sentence is in fact a claim is very difficult to do. And I don't see manually going through the data set as an option. We are currently at around 60% accuracy but I think if I am able to improve the datasets the accuracy would be way better.
Any tips?
quaint loom
@wooden sail
Would you say these two equations is the same?
𝐶𝑡𝑜𝑡|𝑖,𝑗∙ 𝑄𝑡𝑜𝑡|𝑖,𝑗 = 𝐶𝑏𝑎𝑠𝑒|𝑖,𝑗∙ 𝑄𝑏𝑎𝑠𝑒|𝑖,𝑗 + 𝐶𝑠𝑢𝑟𝑓|𝑖,𝑗∙ 𝑄𝑠𝑢𝑟𝑓|𝑖,𝑗+ 𝑃𝑖,𝑗
And
Ctot (i,j) * Qtot (i,j) = Cbase (i,j) * Qbase (i,j) + Csurf (i,j) * Qsurf (i,j) + Pi,j
 thorny ocean
Hey.
Is there a way to know which columns are being used in a process?
I have function f that received pandas dataframe
f(df)
Is there a way to print every column f need from df?
lets say f is a long process
wooden sail
quaint loom
<@467435887236612106>
Would you say these two equations is the same?
𝐶𝑡𝑜�...
what do the bars represent
can you typeset this in latex otherwise make it look cleaner?
 tidal dome
Does anyone here has any tips for learning AI like a YouTube channel recommendations or a books? Or even there's a fun open project so I could learn and do it at once?
tawny spire
git is not recognising files in my folder >_>
i uninstalled conda now it says my files/folders are empty
thorny ocean
Any 1
thorny ocean
thorny ocean
Hey.
This
serene scaffold
tawny spire
i uninstalled conda now it says my files/folders are empty
did you have conda stuff checked in to that git repo?
tawny spire
how do i know if i did?
i was using conda to code the repos
i can't see any conda related files
why does this stuff happen
serene scaffold
tawny spire
how do i know if i did?
do git ls-files -d and give the result here or in the paste bin
tawny spire
it works now for some reason
serene scaffold
hmm okay