#data-science-and-ml
1 messages · Page 45 of 1
 sick fern
 serene scaffold
how complicated is the python and C++ code that you have in mind?
sick fern
Not very. Just for loops, functions and oop
serene scaffold
you could probably do it with a neural network that leverages attention.
but you wouldn't want a "database". you want a dataset of pairs of programs in each language that mean the same thing.
@sick fern are you familiar with attention, and models like BERT?
sick fern
serene scaffold
but you wouldn't want a "database". you want a data*set* of pairs of programs in...
Yeah that's what I meant
sick fern
serene scaffold
<@538631811098738699> are you familiar with attention, and models like BERT?
Is it a transformer?
serene scaffold
sick fern
Is it a transformer?
that's what the T in bert stands for, yeah
sick fern
Ik its like GPT-3
sick fern
serene scaffold
that's what the T in bert stands for, yeah
I'm aware of it, but from what I heard it's just a sequence to sequence model
serene scaffold
sick fern
I'm aware of it, but from what I heard it's just a sequence to sequence model
isn't that what you're doing?
you're going from a sequence of Python symbols to a sequence of C++ symbols, or vice versa.
sick fern
Yes but I don't know how to do that
Are there any resources so I can learn about BERT?
serene scaffold
I don't have any that I especially recommend.
sick fern
Okay, well thank you for the advice. I'll be using BERT or GPT as my model.
Thanks a lot.
 hasty mountain
Guys, is it normal for a UNet Discriminator in GANs to be more unstable?
I really wanted to use a discriminator that provides feedback pixel-by-pixel to my generator, but I'm having the problem that, after some epochs, the discriminator loss(which oscillates between 1.3 and 1.8) explodes to 200 and stays there
 lapis sequoia
Hey I wanna make a ai bot with Python but I don't know anything we're should I start learning
 shell sequoia
which is the most extreme plot for data visualization?
 timber spoke
not really AI related but does anyone know how to process an image so that it matches the EMNIST dataset?
 azure mulch
hasty mountain
Guys, is it normal for a UNet Discriminator in GANs to be more unstable?
I reall...
azure mulch
hasty mountain
Guys, is it normal for a UNet Discriminator in GANs to be more unstable?
I reall...
More unstable than what? I don't think GANs are really known to be easy to train or stable just generally speaking.
When you said "is it normal for a UNet Discriminator in GANs to be more unstable" if you where comparing BigGANs to U-Net Based Discriminators then probably, although I think it was made to be an improvement over them..
https://arxiv.org/abs/2002.12655 <-- is this what you're going off of?

arXiv.org
Among the major remaining challenges for generative adversarial networks
(GANs) is the capacity to synthesize globally and locally coherent images with
object shapes and textures indistinguishable from real images. To target this
issue we propose an alternative U-Net based discriminator architecture,
borrowing the insights from the segmentation ...
 terse flicker
I need help installing something thats missing dependencies. Idk how to do this. I need assistance. https://github.com/tamarott/SinGAN

GitHub
Official pytorch implementation of the paper: "SinGAN: Learning a Generative Model from a Single Natural Image" - GitHub - tamarott/SinGAN: Official pytorch implementation of the ...
hasty mountain
azure mulch
More unstable than what? I don't think GANs are really known to be easy to train...
More unstable than a GAN with a VGG-Like discriminator.
And yes, that's the paper I'm using as reference.
I decided to use UNet Discriminator because of the Real-ESRGAN, where they do use a UNet Discriminator Relativistic.
But, I'm having this problem that, after some epochs, the discriminator loss blows up, something that doesn't happen with my VGG-like. And I have no idea why this is happening.
Hm...maybe that's why they used CutMix regularization. But that seems a bit complicated. I think I'll just add dropout layers and iterate 3 times and then penalize the discriminator for making different predictions
 tranquil anvil
Hi guys Its a very basic question, I am trying to delete duplicates in an excel sheet using python but it keeps saying that the column doesnt exist, i dont understand why because I have even printed the columns and it does show that it exists. the 1. screenshot shows the code I wrote, 2. shows the error message and 3. screenshot shows that the column does exist. any guidance would be appreciated.


 hasty mountain
tranquil anvil
Hi guys Its a very basic question, I am trying to delete duplicates in an excel ...
hasty mountain
tranquil anvil
Hi guys Its a very basic question, I am trying to delete duplicates in an excel ...
I think you're printing the original excel file, not the one which you dropped the duplicates
Note that you've saved the modified version into a new variable, that should be the one you want to print.
tranquil anvil
hasty mountain
Note that you've saved the modified version into a new variable, that should be ...
Have i not overwriten the existing file with the updated dataframe
hasty mountain
tranquil anvil
Have i not overwriten the existing file with the updated dataframe
No, because there's a KeyError there, so the action has been interrupted
 eternal hull
How do you plot correlation plot if you have large number of columns
tranquil anvil
hasty mountain
No, because there's a KeyError there, so the action has been interrupted
hmm, i am still confused. So basically what I think I did is, I imported the original excel file and told the program to delete duplicates in the column 'Keyword' and then overwrite the existing file. but you mean when I overwrite the existing file I have removed the duplicates but the new file no longer has the column named 'Keyword'?
hasty mountain
tranquil anvil
hmm, i am still confused. So basically what I think I did is, I imported the ori...
You didn't overwrite the existing file. The error canceled such action because of the column "Keyword"
tranquil anvil
hasty mountain
You didn't overwrite the existing file. The error canceled such action because o...
alright so i tried simplfying my thought process but I am still unable to understand how to fix the error, sorry i am still new to using python for data related stuff. maybe you can provide me with a hint.
 tranquil anvil
hasty mountain
You didn't overwrite the existing file. The error canceled such action because o...
tranquil anvil
hasty mountain
You didn't overwrite the existing file. The error canceled such action because o...
i even printed the data in the excel sheet that I have.
 hasty mountain
tranquil anvil
i even printed the data in the excel sheet that I have.
hasty mountain
tranquil anvil
i even printed the data in the excel sheet that I have.
It seems that there's no "Keyword" column in your excel sheet, so the command won't work
tranquil anvil
hasty mountain
It seems that there's no "Keyword" column in your excel sheet, so the command wo...
but the print df.columns does output 'Keyword'
tranquil anvil
hasty mountain
But xlsx doesn't
yea but I am importing the excel file using the pandas library and when I use df.columns doesnt it give the output that the excel file has these columns. Let me read through the docs link that you provided, maybe i find the answer there, thanks
 odd dagger
I am dealing with a project of mine which requires me to update famous companys data available publicly like name, some short description about them, headquarters, CEO and MDs, etc
what could be the best source that I could scrape from without being at the risk of getting banned or rate limited?
the more the data I have about various companies the better
 mild dirge
Giving another go at reading Bischop's Machine learning and pattern recognition (2006), but already finding some terms that aren't explained too in-depth like Lagrangian multipliers. Anyone recommend some good reads as pre-requisite to this book? Or maybe a book that covers similar topics but maybe a bit more modern?
Also feel like I understand most of the very basic of linear algebra and have applied it to make some machine learning models from scratch, but topics like Hessian matrices have not been covered very well by my uni, any book that covers the more intermediate topics of LA?
odd dagger
mild dirge
Giving another go at reading Bischop's *Machine learning and pattern recognition...
Oreilly series is very nice
for Data science or machine learning
latest editions are bit updated that bischops
mild dirge
Seems like the books on the topics I'm interested in are from about 2009. But I've found another book on linear algebra and optimization that I'll give a go.
 wooden sail
mild dirge
Also feel like I understand most of the very basic of linear algebra and have ap...
wooden sail
mild dirge
Also feel like I understand most of the very basic of linear algebra and have ap...
lagrange multipliers and hessian matrices are topics covered more often in (convex) optimization, not usually in linalg
or maybe in a vector calculus course as well, as they're involved in multivariate taylor expansions and the like
maybe one of steven boyd's optimization books would help you out
 tacit galleon
Hi everyone
Someone can help to visualize the images created with the generator

I found a function to do that, but my images look so dark
So Idk if its the ImageGenerator
 hasty mountain
tacit galleon
I found a function to do that, but my images look so dark
hasty mountain
tacit galleon
I found a function to do that, but my images look so dark
Is matplotlib displaying a warning that the values have been clipped?
 tacit galleon
Someone can help to visualize the images created with the generator
tacit galleon
tacit galleon
Someone can help to visualize the images created with the generator
It could be the rescale factor?
hasty mountain
Check the images values, perhaps you got something wrong in the rescale argument
That usually occurs to me when matplotlib clips the pixels values
tacit galleon
okay let me check the augmented_images

I think it coulbe the ````rescale```
if i remove that parameter
the values from my image are this ones

and if I just load the image the values from the pixels are from 0,255
So the flow_from_directory is not working properly at the moment to load the images?
 manic oyster
hasty mountain
It seems that there's no "Keyword" column in your excel sheet, so the command wo...
manic oyster
hasty mountain
It seems that there's no "Keyword" column in your excel sheet, so the command wo...
'Keyword " not "Keyword"
lapis sequoia
how to get good at problem solving data science problems

 stuck shard
tacit galleon
Hi guys any advice to improve my training time?
stuck shard
tacit galleon
Hi guys any advice to improve my training time?
Have you tried using the Colab GPU to train?
What kind of data is it? Does it need to be 224x224x3 or can you apply some methods to reduce the amount of features/data?
odd dagger
lapis sequoia
how to get good at problem solving data science problems
Kaggle is the world’s largest data science community with powerful tools and resources to help you achieve your data science goals.
tacit galleon
stuck shard
What kind of data is it? Does it need to be 224x224x3 or can you apply some meth...
According to mobilNet, that the input shape that I need to use
tacit galleon
stuck shard
Have you tried using the Colab GPU to train?
Yes Is running on th gpus
mild dirge
wooden sail
maybe one of steven boyd's optimization books would help you out
Ill give this a look as well. The book I was referring to seems to have a lot of unexplained mathematical definitions, but I want a more intuitive understanding as well.
I want to understand the stuff I was talking about the other day with those anti-symmetric weight vectors and explaining that kinda stuff.
wooden sail
if you have a particular question in mind, i can take a stab at it
mild dirge
Appreciate it, but I'd rather read a book on the topic so I can look at some figures of examples and just formal proofs etc.
wooden sail
for that antisymmetric weight stuff, i do think the best approach is asymptotics. some linearization in the neighborhood of one of the weights. the taylor theorem is very powerful, and the multivariate form includes differential forms like the jacobian and the hessian (and higher order ones that are not often considered)
so stuff like gradients, jacobians, hessians, taylor expansions and finite difference approximations are related to each other, as well as to gradient-based optimization methods and (quasi-)newton methods
mild dirge
So what kind of a topic does that fall under you think?
If I were to look for a book explaining those topics
wooden sail
linear algebra towards the end of the book, multivariate calculus, and convex optimization
you'd need books on all 3 because none of them tell the whole story
mild dirge
Had a course on LA and multivariate calculus, but it didn't go too deep. Maybe I could check the book for that course again.
wooden sail
gilbert strang's linalg should have applications toward the end, which should include optimization problems as well
boyd's convex opt is good, but i think it assumes you're familiar with many concepts already
mild dirge
linear algebra and applications, that book?
mild dirge
And yeah I did AI Ba, and now doing AI ma but it's more practically oriented, and some courses go really theoretical, but on very specific little topics.
And bunch of overlap between courses, so there's not often that much new info
wooden sail
that's less than ideal, the depth and masters level should be a lot greater
mild dirge
Other time my teacher used Lagrangian multipliers, but we have never had that kinda stuff explained
So I try to read up on those things that aren't well explained
wooden sail
lagrange multipliers are often seen first in univariate calculus
if you have a calculus book that covers constrained optimization, it shows up there for the first time
then in convex opt or multivar calc, you see the multivariate flavor
usually goes hand in hand with karush-kuhn-tucker conditions
mild dirge
Have you read the bischop book by any chance? (the 2006 one)
wooden sail
i haven't, sadly
mild dirge
Ah. It seems a little formal in the way it explains stuff, as it expects already some intuition and understanding in topics like statistics, probability and La
And it also already mentions Langranian in chapter 1, expecting the reader to know it already
wooden sail
i see
here's boyd's explanation on it https://web.stanford.edu/~boyd/cvxbook/bv_cvxbook.pdf page 216
 heavy crow
I want to finetune an effnet backbone with a smaller embedding dimension (effnetb0 has a 1280dim final layer) while retaining the spacial clustering capabilities of effnet. If i just train the network in an encoder/decoder fashion i loose the spatial meaning of the embeddins. (i.e effnet -> dense (512) -> 1280, with a l2 loss between effnet output and final output)
any tips?
 tropic matrix
anyone?
 fiery dust
guys I'm writing a summary of ai and rn I'm writing about ML, do you think this is enough in order to understand what ML is?
Machine learning is a type of artificial intelligence that enables computers to learn from data without being explicitly programmed. Instead, you feed data to an algorithm to gradually improve outcomes. Machine Learning can do two things, classify data, and/or predict.
First, you need to collect data, and clear it. The second step is to separate the data in two, the training set and the test set. The training data is fed into an algorithm to build a model, then the testing data is used to validate the accuracy or error of the model. The end result of a machine learning process is a file that takes data in the same shape that it was trained on, and spits out a prediction that tries to minimize the error that it was optimized for.
am I missing important things? please point them out so that I can add them to my summary, thanks a lot!
wooden sail
tropic matrix
anyone?
you can try this https://github.com/battlesnake/neural/ to make neural network diagrams with latex
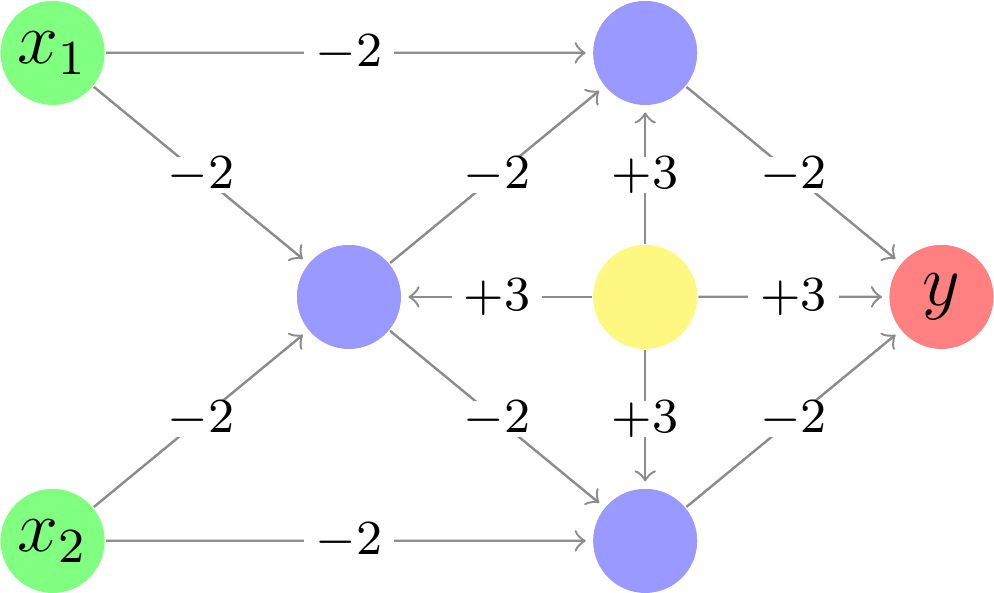
GitHub
LATEX: TikZ package for drawing neural networks. Also available on CTAN at http://www.ctan.org/tex-archive/graphics/pgf/contrib/neuralnetwork - GitHub - battlesnake/neural: LATEX: TikZ package for...
or this, if you don't use latex http://alexlenail.me/NN-SVG/LeNet.html
this one also looks nice https://github.com/HarisIqbal88/PlotNeuralNet
GitHub
Latex code for making neural networks diagrams. Contribute to HarisIqbal88/PlotNeuralNet development by creating an account on GitHub.
tropic matrix
wooden sail
this one also looks nice https://github.com/HarisIqbal88/PlotNeuralNet
i'll try this out and see, but it looks to be exactly what i needed. thank you so much
@wooden sail on another note, would it be possible to have a visualization like what you just gave that works for models like EfficientNetB7, Xception, etc? I've used transfer learning with those models, and I would like to display them without:
A. the display being too large and complicated (somewhat simplifying it/grouping certain repeating layers together like it was done in this image
B. having too much overhead on my part writing some code for each specific layer
is this possible?
 wooden sail
you'd probably have to write it yourself
the easiest solution i see is to replace the entirety of the networks you mentioned with a single block, and then connect that to a diagram of your own layers you used for transfer learning
then you can simply cite the papers where the architectures of those networks are defined
tropic matrix
wooden sail
the easiest solution i see is to replace the entirety of the networks you mentio...
hm, okay. are you able to identify what the person in this article used? was it something like draw.io
https://towardsdatascience.com/illustrated-10-cnn-architectures-95d78ace614d

Medium
A compiled visualisation of the common convolutional neural networks
wooden sail
i can't tell from that image, sorry
tropic matrix
wooden sail
i can't tell from that image, sorry
alright, thank you. i appreciate your help though
fiery dust
what's a weight exactly.

I understand that a weight is a parameter that represents the strength of the connection between two neurons, but how can I visualize it? I mean, how is the strength determined?
wooden sail
those are two very different questions
a weight is a number you multiply by
the bigger its absolute value, the "stronger" the connection
as to "how" to pick the weights, that's what your network learns from the data through optimization
fiery dust
so isnt the weight the same as the activation of a neuron?
or this has to be between 2 neurons, making it different from activation
wooden sail
what are you calling "activation"
 wheat snow
i have a lil problem
i currently work on a Netflix data analystics project
my own personal data
and i wanna find out what my Account's Top Ten Series is
To cancel out movies i first thought doin this:
 df_vd['Duration_seconds']= df_vd['Duration'].dt.total_seconds()
 df_series= df_vd[df_vd['Duration_seconds'] < 4000]
``` But it wont cancel out movies that havent been watched in ONE Gofor example:

we got multible sessions of a user watching Aquaman
and some of them get cut out via the 4000 second mar
limit*
but the most stuff stays which isnt good
I now need to clear my data in a way that no movies show up anymore
Sadly my dataset doesnt have a column like Videotype: which says its either a Series or a Movie
fiery dust
wooden sail
what are you calling "activation"
3Blue1Brown said that the activation is the number that the neuron stores
and its a number between 0 and 1. the higher the activation, the higher the number
wooden sail
fiery dust
3Blue1Brown said that the activation is the number that the neuron stores
i checked out one of his videos really quick, and no
the notation 3b1b uses is that he calls "activation" the values the output or input has at a given layer
the weights connect 2 layers in his notation
some people refer to inputs/outputs as layers, as 3b1b does, and he also calls those "activation"
other people instead refer to the weights as layers, which perform transformations on the inputs and yield outputs
i would say neither are very clear and since there's inconsistency, the easiest and clearest way is to look at the math instead
sick fern
Hey guys does anyone know good resources for any seq2seq model (lstm gpt bert)
I want coding resources in tensorflow and I can't find good ones anywhere
fiery dust
wooden sail
i would say neither are very clear and since there's inconsistency, the easiest ...
I see what you mean. Okay I think I kinda got what a nn is, at least I think I've a relatively decent understanding of what a nn knowing that I just watched half of 3b1b video, next step would be getting into the maths behind nn's?
wooden sail
mhm
fiery dust
cool, any book or video you would recommend? Thanks in advance.
tacit galleon
Hey guys I was using this generator
                                                color_mode='rgb',
                                                target_size=(224,224),
                                                batch_size=10,
class_mode='categorical')```have any know how create a confussion matrix from there
I was testing with this
num_of_test_samples = 1
batch_size=100
Y_pred = model.predict_generator(test_batches, num_of_test_samples // batch_size+1)
y_pred = np.argmax(Y_pred, axis=1)
print('Confusion Matrix')
print(confusion_matrix(test_batches.classes, y_pred))
print('Classification Report')
target_names = list(train_batches.class_indices.keys())
print(classification_report(test_batches.classes, y_pred, target_names=target_names))```And i have this error

 hollow kettle
wheat snow
hollow kettle
wheat snow
only works if the episodes of your series have different titles, but you could try adding up all the watch durations with the same title, which would only sum up the movies, that then can be filtered out
 oak cosmos
hollow kettle
only works if the episodes of your series have different titles, but you could t...
oak cosmos
hollow kettle
only works if the episodes of your series have different titles, but you could t...
I mean the titels are similar but not the same: e.g. ```
Brooklyn Nine-Nine Season 3 Episode 4: "..."
Brooklyn Nine-Nine Season 2 Episode 1: "..."
so part of the series is ofc the samethen this approach would work
oak cosmos
hollow kettle
then this approach would work
maybe by str.contain()?
but how would i cut out the movies
saying i will add every title together
i will now have some top series but also movies ig
hasty mountain
Hey @wooden sail , tell me something...
What would you expect from a classification model that receives an image as input, multiply that image by 2 different arrays(one with weights for each row, another for each column), passed those products through a softmax(to make each value within a row/column receive a value within [0,1]), multiplied the output of each softmax between each other(softmaxX * softmaxY) and then multiplied this product by the input image to finally generate the output?
Do you think it makes sense in a mathematical thinking?
lapis sequoia
df["Datetime"] = df["Datetime"].astype(int).tolist()
print(type(df['Datetime'][0])) # <class 'numpy.int64'>
print(type(df["Datetime"].astype(int).tolist()[0])) # <class 'int'>
    ```
im trying to convert this `numpy.int64` to `int`, but it wont persistassume you have an iteration loop where you go over the table
and a dictionary where you save the sum of the watchtimes for each title
if watchtime[title]:
watchtime[title] = watchtime[title] + duration
else:
watchtime[title] = duration
afterwards you can filter out the movies because the sessions of one movie are now added up, so they reach over 4000s, but the episodes of the series are not added up because they got slightly different titles
oak cosmos
hollow kettle
assume you have an iteration loop where you go over the table
and a dictionary w...
Thats Bigbrain³
oak cosmos
hollow kettle
assume you have an iteration loop where you go over the table
and a dictionary w...
bad thing is.... in my 12 hour python beginner corse... i skipped dictionary's
 tidal bough
lapis sequoia
```py
df["Datetime"] = df["Datetime"].astype(int).tolist()
print(type(df['Dateti...
tidal bough
lapis sequoia
```py
df["Datetime"] = df["Datetime"].astype(int).tolist()
print(type(df['Dateti...
int as a dtype is just an alias for int32 or int64 depending on system details. Try .astype(object).
lapis sequoia
tidal bough
`int` as a dtype is just an alias for `int32` or `int64` depending on system det...
it gave me <class 'numpy.float64'>
oak cosmos
@hollow kettle look what i found
Elvira’s blog
How to get the data I recently learnt that one can request from Netflix all personal data that they store about you, more about this on Netflix Help Center or go to Get My Info page directly. It took me one day from the data request to receiving the data.
As you may have noticed, I have more than two profiles – Home and Family. I wanted to check if hourly activity, genres and countries preference are different for them. Unfortunately, Netflix doesn’t show movies metadata in their datasets, but you know who does? IMDb :)

I found a handy IMDbPY Python package to retrieve the data about a movie based on its ID or title. I wrote a function that takes movie title, looks for it in the IMDb database, takes ID from the first search result and returns metadata based on it.
!e It works for me:
import numpy as np
arr = np.array([1.,2.,3.])
print(arr, type(arr[1]))
arr = arr.astype(object)
print(arr, type(arr[1]))
 arctic wedgeBOT
@tidal bough :white_check_mark: Your 3.11 eval job has completed with return code 0.
001 | [1. 2. 3.] <class 'numpy.float64'>
002 | [1.0 2.0 3.0] <class 'float'>
well it does but as soon as u insert this into Dataframe it gets converted
to np.<>
tidal bough
!e hmm, it seems to work on Series too:
import pandas as pd
arr = pd.Series([1.,2.,3.])
print(arr, type(arr[1]))
arr = arr.astype(object)
print(arr, type(arr[1]))
@tidal bough :white_check_mark: Your 3.11 eval job has completed with return code 0.
001 | 0    1.0
002 | 1    2.0
003 | 2    3.0
004 | dtype: float64 <class 'numpy.float64'>
005 | 0    1.0
006 | 1    2.0
007 | 2    3.0
008 | dtype: object <class 'float'>
Ah, you're doing tolist()? That might be the reason; try just assigning a Series to some column.
lapis sequoia
tidal bough
Ah, you're doing `tolist()`? That might be the reason; try just assigning a Seri...
with pd.Series and Dataframe, it get converted to numpy types
arr = df["Datetime"].astype(int)  # numpy.int64
arr = df["Datetime"].astype(int).tolist() # int
df["Datetime"] = arr
print(type(df["Datetime"][0]))```Like I said, don't do tolist. Dataframes convert lists to arrays, converting to numpy types in process. But if you set a column to something that's already a Series, no conversion is made.
tidal bough
that's because you're not doing .astype(object)
lapis sequoia
tidal bough
that's because you're not doing `.astype(object)`
life saver
fiery dust
I've a question about what's the difference between classification (supervised learning) and clustering for unsupervised learning
so basically, arent those the same?
What I understand is:
Classification: Talks about whether the output is a discrete class label (e.g: spam or not spam).
Examples of classifiers are Linear Classifiers, Support Vector Machines, Decision Trees, Random Forests.
Clustering: Groups similar experiences together. Example, a business groups their clients based on their location, age, spending habits, etc.
So isnt spam and not spam clustering?
tidal bough
fiery dust
What I understand is:
```
Classification: Talks about whether the output is a di...
Clustering isn't supervised learning - you don't get to decide what the clusters represent. You just put the data through an algorithm and get the result that e.g. your clients can be pretty well separated into 3 groups centered on such-and-such parameters.
If you were to cluster a set of emails, you'd just get, well, some clusters, which probably aren't just "spam" and "not spam".
fiery dust
okay I think I see. So in supervised learning, the model can only tell me if its spam or not
I decide the output
fiery dust
I've a question, which youtube series or perhaps a book, you recommend for people that want to learn pytorch or scikit learn (havent decided what to learn tbh)?
serene scaffold
fiery dust
I've a question, which youtube series or perhaps a book, you recommend for peopl...
if you want to do deep learning, you need to learn both. but you can do a lot with sklearn without pytorch
and the non-neural models in sklearn are probably easier to wrap your head around anyway, so I would start with those. but keep in mind that you're learning about the different models, and sklearn is just a means to that end.
fiery dust
serene scaffold
if you want to do deep learning, you need to learn both. but you can do a lot wi...
I'd like to do supervised learning, regression to be precise - idk if this is an accurate answer though
serene scaffold
fiery dust
I'd like to do supervised learning, regression to be precise - idk if this is an...
supervised learning, for what?
because you can have supervised learning that's neural and that's non-neural
fiery dust
I see. So I've a function that has multiple parameters. The function returns multiple values also.
serene scaffold
is this multi-label classification?
fiery dust
based on what the function returns, I want to predict possible parameters that can give better results when passed into the function
does this make sense?
fiery dust
serene scaffold
is this multi-label classification?
I think no
I mean it's not classification at all.
serene scaffold
fiery dust
based on what the function returns, I want to predict possible parameters that c...
what is the point of this function?
fiery dust
Its somewhat related with finance. Not a 100% but somewhat.
serene scaffold
so how do you know if the value returned by the function is good or not?
fiery dust
It's not predicting price or something like that, that's why I say it's not 100% related with finance.
fiery dust
serene scaffold
so how do you know if the value returned by the function is good or not?
the function returns a dictionary, so the keys of the dictionary would be something like: effectiveness, tested_cases, etc
serene scaffold
fiery dust
the function returns a dictionary, so the keys of the dictionary would be someth...
so you want to figure out the optimal parameters for both of those, effectiveness and tested_cases?
and you want a model that can learn those optimal parameters?
fiery dust
Okay, this is when it could get complicated. Even though effectiveness is what matters at the end of the day, the higher the number tested_cases has, the better.
serene scaffold
fiery dust
Okay, this is when it could get complicated. Even though `effectiveness` is what...
what types are effectiveness and tested_cases?
like, is effectiveness a float between 0 and 1?
fiery dust
thats correct
tested cases is an int
I forgot to add the key final_balance, could also name it net_profit?
serene scaffold
can you show the code for the function?
fiery dust
the function is written in another language and wasnt written by me
serene scaffold
interesting
fiery dust
anything else i could tell you??
serene scaffold
fiery dust
anything else i could tell you??
you might look into multivariate regression
fiery dust
will do so 🙂
thanks a lot! 🙂
serene scaffold
I'll ask Edd what he thinks next time we're both active in this channel 😛
fiery dust
ok hahaha, he was helping me like an hour ago
thanks again 🙂
wheat snow
YO guys
def Avg_time_per_day_of_week(Username): # Average time of watching per day of week


    user= df_vd[ (df_vd['Profile Name']== Username) ].copy()
    user['Duration']=user['Duration'].dt.total_seconds()/3600#.sum()


    user['Date']= user['Start Time'].astype(str).str[0:11]
    user['Date']= pd.to_datetime(user['Date'])

    user['Date']=user['Date'].dt.to_pydatetime()
    user['Weekday']= user['Date'].dt.day_name().copy()
    print(user)
    #monday=user[    user(['Weekday']=='Sunday') & (user['Duration'].mean()) ]

    data_week=user.groupby(user['Weekday']).mean()
i got this right here
it shall give me the average Watchtime per DAY of the WEE
WEEK
i think my groupby function is missing something
and how do i sort that index?
          Duration
Weekday
Friday     0.309623
Monday     0.313131
Saturday   0.346661
Sunday     0.341212
Thursday   0.287057
Tuesday    0.295335
Wednesday  0.314962
for the user['Duration'].dt.total_seconds()/3600#.sum() part, you can do user['Duration'].dt.total_seconds().div(3600).sum(). But mathematically, it's the same as doing user['Duration'].dt.total_seconds().sum() / 3600.
For user['Date'].dt.day_name().copy(), you do not need the .copy(), because user['Date'].dt.day_name() creates an entirely new Series.
I assume you want to sort the days of the week by their week order, not alphabetically. but Python will do it alphabetically.
You can do days_category = pd.Categorical(['Monday', 'Tuesday', 'Wednesday', 'Thursday', 'Friday', 'Saturday', 'Sunday'], ordered=True) to create a category type with special ordering.
And then you can do user['Weekday'] = user['Date'].dt.day_name().astype(days_category), so that the values are elements of that category, rather than strings.
And then user.groupby(user['Weekday']).mean().sort_index()
wheat snow
serene scaffold
for the `user['Duration'].dt.total_seconds()/3600#.sum()` part, you can do `user...
i have some problem with the Weekday statement now
user= df_vd[ (df_vd['Profile Name']== Username) ].copy()
    user['Duration']=user['Duration'].dt.total_seconds()/3600

    days_category= pd.Categorical(user['Weekday'], categories=['Monday', 'Tuesday', 'Wednesday', 'Thursday', 'Friday'], ordered=True)

    user['Date']= user['Start Time'].astype(str).str[0:11]
    user['Date']= pd.to_datetime(user['Date'])

    user['Date']=user['Date'].dt.to_pydatetime()
    user['Weekday']= user['Date'].dt.day_name().astype(days_category)

    data_week=user.groupby(user['Weekday']).mean().sort_index()
Weekday is used before its aligned
if i turn it arround, days category is used before beeing aligned
serene scaffold
days_category= pd.Categorical(user['Weekday'], categories=['Monday', 'Tuesday', 'Wednesday', 'Thursday', 'Friday'], ordered=True)
This is not what I said.
@wheat snow
 merry wadi
Anyone familiar with graph neural networks? Specifically temporal
serene scaffold
merry wadi
Anyone familiar with graph neural networks? Specifically temporal
sort of, but you should just ask your actual question, rather than asking to ask.
 novel acorn
Hello everyone, anyone knows how to fix this related to the y labels and the colors that seaborn assigns to each bar?
https://prnt.sc/mj21Nsba_ktL
link to the screenshot because I cannot upload images here

fig, ax = plt.subplots(4,1, figsize=(10,8))

# Capital federal
g1 = sns.countplot(data = capital_federal, y = "property_type", ax = ax[0])
g1.set(title="Tipo de propiedades en Capital Federal",
       ylabel = None,
       xlabel = None)

# Gran Buenos Aires
g2 = sns.countplot(data = gba, y = "property_type", ax = ax[1])
g2.set(title = "Tipo de propiedades en GBA",
       ylabel = None,
       xlabel = None)


# Cordoba
g3 = sns.countplot(data = cordoba, y = "property_type", ax = ax[2])
g3.set(title="Tipo de propiedades en Cordoba",
       ylabel = None,
       xlabel = None)

# Santa Fe
g4 = sns.countplot(data = santa_fe, y = "property_type", ax = ax[3])
g4.set(title="Tipo de propiedades en Santa Fe",
       ylabel = None,
       xlabel = None)


fig.text(0.02, 0.5, 'Tipo de Propiedad', va='center', rotation='vertical')

plt.tight_layout()
plt.show()
This is the code I used
More specifically, there're different colors for the same label. Tried using sharey but the count was wrong after I checked using value_counts(). Been looking in google but I was not able to find anything useful
novel acorn
fixed it lol, ended up setting a color palette that matched the labels
merry wadi
serene scaffold
sort of, but you should just ask your actual question, rather than asking to ask...
I was wondering if I’m looking at time series data of minutes within days, if the appropriate structure to feed into the data loader was nested lists for each day and time
 errant hazel
hello
fiery dust
serene scaffold
you might look into multivariate regression
based on this:
Multivariate regression is a statistical technique for modeling the relationship between multiple independent variables (also known as predictors or inputs) and a single dependent variable (also known as the response or output). It allows you to analyze the combined impact of multiple factors on a dependent variable, and it can provide a more nuanced understanding of the relationships between variables than simple linear regression, which only models the relationship between a single independent variable and a dependent variable.
i can only choose 1 variable, so it would be either effectiveness, tested cases or netprofit. not the 3 of them right?
serene scaffold
fiery dust
based on this:
```
Multivariate regression is a statistical technique for model...
hmm, I'd have to look into it more
fiery dust
oki doki
Just to confirm I explained this correctly.
         Inputs                                  Outputs
uts
| input1 | input2 | input3 |    | net_profit | tested_cases | effectiveness
``` I want to get the model to predict the values for the inputs to get the highest net_profit (it has the most importance) but also a high effectiveness and tested_cases makes the inputs better for me.I think I found what I need: multi-output regression model
 odd meteor
fiery dust
Just to confirm I explained this correctly.
```
Inputs ...
odd meteor
fiery dust
Just to confirm I explained this correctly.
```
Inputs ...
This appears to be case where you have to model a regression problem with predicting multiple dependent variables.
Make your input1, input2, and input3 your multiple response variables and every other columns your explanatory variables.
Unfortunately, I haven't personally worked on this kind of problem but I know it does exist from my stats class.
Try checking online for example on predicting multiple dependent variables.
fiery dust
will do so, for the moment im familiarizing with everything I can that related with AI
ill probably start doing some pytorch or scikit learn this week so will defo check on multi output models
wooden sail
i'm not sure the distinction is very important, the three things you mentioned are special cases of "linear regression"
the most general case of linear regression being done with a matrix, so it accepts multiple inputs and outputs
lapis sequoia
why is the graph showing incorrect values, 41745 should be above 41274


in fact the graph is not supposed to be straight line
oh the values were in string nevermind

 rose heath
Hello there, I am trying to detect a fraud detection model which outputs risk as Low Medium or High, I have a customers id in one data frame and in another data frame i have their data that from which customer (source) id to which (target) how much money 'emt' is being transferred. Now I want to drop customer id from the initial data frame and add a new column containing a series of transaction for both sources and targets. How do i do this and is there a better way to do this?
 agile cobalt
lapis sequoia
How can i use inplace in the first line
agile cobalt
lapis sequoia
How can i use inplace in the first line
Do not use inplace, neither in the first line nor anywhere in your code - the general advice is to avoid it
it is not actually any more efficient than non-inplace operations
 flat cobalt
Hey guys. I am really new to NLP and I have a question that is rather long.
I have a professor who has given me a bunch of blogs written by students. In the blogs, the students have written about how ChatGPT has helped them with assignemnts and studies. The students were given a template to write off. They were asked to write about their feeling before writing an assignment, while writing the assignment, immediately after writing, and feelings while reflecting on writing an assignment in which they have used chatgpt.
I wanted to know if there is any nlp technique or model out there, that can scan the whole blog, and pick out portions of the blog where the students talk about the 4 points I had mentions. I can easily do sentiment analysis on each of the returned portions, but idk how to fetch these portions from the blog in the first place. Ik the message is rather long, but I wanted to be clear in the first place. Thank you
lapis sequoia
agile cobalt
Do not use inplace, neither in the first line nor anywhere in your code - the ge...
Alright will keep that in mind but any specific reason why?
 ripe sapphire
flat cobalt
Hey guys. I am really new to NLP and I have a question that is rather long.
I...
ripe sapphire
flat cobalt
Hey guys. I am really new to NLP and I have a question that is rather long.
I...
you can use entity recognition (NER), which can be used to identify the specific entities in text.
lapis sequoia
crossposting from #algos-and-data-structs:
is DPV good enough book to learn enough about algorithms for a data science career? or is it too much / too little (requiring more graduate stuff)? I'm asking because I already have some basic knowledge about DP and graphs but looking at something like DPV with a lot of exercises feels like a lot of work that maybe I'd rather spend studying data science instead
I already have somewhat decent knowledge within Python, but in desparate need of doing some data science projects. but I wonder if it is worth it to take a break to study algorithms before fully commiting to data science or is the knowledge I have enough
http://algorithmics.lsi.upc.edu/docs/Dasgupta-Papadimitriou-Vazirani.pdf
 mint palm
can we use parameters of a architecture which is completely different for transfer learning?
mint palm
i came across a paper, "where to transfer" but it seems to much.
One more question, is my architecture is like a combination of A, B.
Can i use to seperate pre trained A and pre trained B, to initialise my model? What if dataset for pre-train is same/different.
hasty mountain
mint palm
can we use parameters of a architecture which is completely different for transf...
Yes. If you have some layers that are compatible with the "donor model", you might be able to do that without any problem.
If the layers aren't compatible, you might still be able to do that through some manipulation.
hasty mountain
mint palm
i came across a paper, "where to transfer" but it seems to much.
One more quest...
If the dataset is different, the model will simply try to adapt to the new dataset. Using pretrained weights can make the optimization faster than training from scratch
This is basically what is done for Stable Diffusion and Text-to-Speech models. People use pretrained weights from HuggingFace and then train on their own dataset.
 thorn trench
tacit galleon
Hi guys any advice to improve my training time?
thorn trench
tacit galleon
Hi guys any advice to improve my training time?
1- Use GPU for training (there is a free option)
2- With GPU, use multiprocessing=True in model.fit()
3- Are you reading the images from your drive unit? It's faster if you zip your data, unzip it in the root folder of Colab server you're using for and read it there instead on your Drive.
tacit galleon
thorn trench
1- Use GPU for training (there is a free option)
2- With GPU, use `multiprocessi...
I'll try today
 haughty ingot
does someone know the best way to learn cnn
 rain temple
Does anyone know how to launch a pre trained model onto a website?
I am trying to make it so that the model summarises user inputs. Any help would be apprecitated. Thanks

 queen cradle
lapis sequoia
Alright will keep that in mind but any specific reason why?
queen cradle
lapis sequoia
Alright will keep that in mind but any specific reason why?
The inplace argument is well-intentioned but mostly confusing. Many Pandas operations are not done in place even when called with inplace=True; instead, they secretly make a copy of the data and point the original data frame to the copy. In order to know whether inplace=True actually improves performance, you have to dig into the Pandas source code (and of course that changes from version to version). There are other disadvantages, too: inplace can lead to subtle bugs (when you have two references to the same data, use one reference to mutate the data, and don't realize the other reference has been changed too), and it prevents method chaining (and because of this also inhibits type checking).
For those situations where in-place operations are possible (and provide worthwhile benefits), I think I would like it if Pandas DataFrame objects supported an out= keyword like the corresponding argument on a NumPy array. Just like NumPy, if the output argument is somehow incompatible, then it could raise an error. But I haven't thought through all the details of this; it's probably hard to get it all correct.
lapis sequoia
queen cradle
The `inplace` argument is well-intentioned but mostly confusing. Many Pandas ope...
Thanks a lot, this is very helpful!
 slim perch
rain temple
Does anyone know how to launch a pre trained model onto a website?
I am trying t...
slim perch
rain temple
Does anyone know how to launch a pre trained model onto a website?
I am trying t...
Create an API endpoint using something like flask/fastapi and call it from the front end? You could also use Django to avoid creating an api
rain temple
slim perch
Create an API endpoint using something like flask/fastapi and call it from the f...
thanks a lot. I'll try this out
queen cradle
Yes, that's what linear regression produces for you.
fiery dust

 daring basin
I'm using diffusers and trying to get the seeds from every image since you can specify an amount, but there doesn't appear to be a way to do that with StableDiffusionPipeline. Does anyone have any idea how I could get the seed from every single image without calling generation multiple times?
Right now I'm getting the Generator instance and getting initial_seed but that only returns one seed
 late shell
Hello, can someone help me with this please?
fiery dust
print(accuracy)
0.2120515116029139
😭
wooden sail
fiery dust
linear regression is a linear function? 🤔
linear regression refers to finding the parameters of a linear function. linear in the sense that, for a transformation T acting on vectors u and v and scalars a and b, T(au) = aT(u) and T(au + bv) = T(au) + T(bv)
a common way of representing such functions is as a matrix or vector of some sort
serene scaffold
@wooden sail suppose you have three input parameters a, b, and c, and you want to find the optimal three values to get the highest harmonic mean of outputs x and y, how would you go about that?
wooden sail
serene scaffold
<@467435887236612106> suppose you have three input parameters `a`, `b`, and `c`,...
what's the relationship between a,b,c and x,y
serene scaffold
wooden sail
what's the relationship between a,b,c and x,y
some black-box function
wooden sail
is it unknown so it cannot be differentiated explicitly?
serene scaffold
wooden sail
is it unknown so it cannot be differentiated explicitly?
right
wooden sail
i would do something like this https://ieeexplore.ieee.org/stamp/stamp.jsp?arnumber=8771184
serene scaffold
thanks 🙏
wooden sail
stochastic approximations of the gradient by perturbing the inputs following some schedule
serene scaffold
those are big words 🙊
wooden sail
there are other flavors of the solution to this problem. the overall problem is called "stochastic approximation", and it deals with having unknown functions and/or only noisy observations of the function
so one does statistics to obtain something that converges to the true gradient in expectation. gradient descent falls in the category of stochastic approx too, where the function can be observed with noise
serene scaffold
wooden sail
so one does statistics to obtain something that converges to the true gradient i...
.bm
 strange elbowBOT
Click the button to be sent your very own bookmark to [this message](#data-science-and-ml message).
wooden sail
ah, i forgot to mention this assumed the black box is differentiable in the first place. if it isn't, i only know heuristics for this kind of problem
if it's not differentiable but anyway behaves "nicely", you can do things like simulated annealing or the nelder-mead method
 rigid bronze
Can anyone please suggest me some advanced data science projects that I can work on for final year projects ??
hasty mountain
@wooden sail can you give me some help with a project I've been working recently?
I've been testing the possibility of using an attention mechanism which tries to assign a relevancy to each value within the given row and column in the input array. So the operation is something like:
output = softmax(weightsX * input) + softmax(weightsY * input)
Where each variable here is an array, the softmax is applied, in the first case, through each row("X axis"), and, in the second, through each column("Y axis").
Do you think this method could be efficient somehow?
I've been testing this and it really worked. But...it has the problem that, adding more layers doesn't make for better performance, nor adding more weights. So I'm trying to think on what might be causing this "performance cap"
wooden sail
probably that you're skimping out on the parameters 😛
hasty mountain
But even when I add more and more layers(aka "more weights"), the performance doesn't benefit that much
wooden sail
if adding more layers, more data, more epochs doesn't help, then you probably can't do much about it, that's the limit of your model
hasty mountain
Oh, I see...
wooden sail
what i meant was that you would probably get better performance by applying a coefficient to each entry of the data separately
but ofc it's a jump from 2n to n^2 memory
hasty mountain
Hm... How's that different from an element-wise multiplication?
wooden sail
it isn't
wooden sail
well, that comes at the cost of worse performance here since you lose granularity
hasty mountain
Less memory, but trying to keep a decent performance
hasty mountain
wooden sail
well, that comes at the cost of worse performance here since you lose granularit...
Surprisingly, it doesn't
Not that much
I've been conducting many tests on this. It's for a paper I'm writting. And it works...surprisingly well
wooden sail
did you compare it to elementwise mult?
hasty mountain
Without softmax, you mean?
wooden sail
no, still with softmax, just with n^2 params
hasty mountain
Hm... Then I don't get what you're saying
wooden sail
you are using 2n weights instead of n^2
hasty mountain
The mechanism is based on arrays multiplications, so it should be element-wise mult, isn't it?
wooden sail
you're doing a broadcasted multiplication
your input is a matrix but weightsX and weightsY are vectors, yes?
wooden sail
then you're not really scaling the rows and columns
hasty mountain
What adds the "relevancy classification" is the softmax
hasty mountain
The softmax is applied through each row, through each column.
So each row/column will be scaled to be within range [0,1]
In the end, this softmax output is multiplied to the input again
(I still don't know how to explain it clearly)
wooden sail
ok, then i had misunderstood what you were doing
hasty mountain
Too bad I don't know how to use the LaTeX bot...
Can you see if this makes it more clear?

This is trying to illustrate how to get the weights for each row(or "X axis")
The same is done to the Y axis, but changing the "i" and "j" in the softmax
wooden sail
mhm
hasty mountain
In the end, the output of those softmaxes is multiplied together, so you can get the "XY weights", and this array is multiplied to the input array, applying the attention mechanism
wooden sail
multiplied or added?
hasty mountain
Multiplied
wooden sail
hasty mountain
<@467435887236612106> can you give me some help with a project I've been working...
so with * instead of + here?
hasty mountain
Yes
wooden sail
ok
and my question is, why should this be better than directly learning the weights end to end? you now have 2x the number of parameters to learn
i would wonder if there's any optimality to doing it this way
hasty mountain
Because I want the process to consider many pixels at once, not a single one. I want it to be...let's say... "relativistic"
The idea is to make something comparable to a convolution, but faster and less expensive
The convolution takes into consideration neighbouring pixels(a kernel), so I thought that maybe it would be interesting to consider a single axis, taking advantage of the built-in softmax function
wooden sail
while that is true, you could also learn the weights based on the task you want to do with the pixels. that would also include all pixels and probably perform better
hasty mountain
Wouldn't it overfit? I mean...for that, I would simply create a single array of weights and apply a single multiplication, right?
hasty mountain
Yes, but that's a bit mitigated, since the weights array is multiplied through each element in a single batch
So they must be a bit generalist
They have the same height, width and channels as the input, but not the same batch size
wooden sail
overfitting has to do with the data and the number of examples though, not only the model
hasty mountain

wooden sail
in general the more parameters you have, the higher the risk of overfitting
hasty mountain
Also... tell me.
If, for my single element outX within the outputX array is(before softmax):
outX = input * weightX
Would my derivative in relation to the weight be:
d(outX)/d(weightX) = input?
I can consider the derivative as if it would just a normal function, disregarding the fact that each element is from an array?
wooden sail
that'd be the derivative of the single element, sure
for the matrix, it'd be a matrix of zeros except for that one entry
hasty mountain
I see
wooden sail
that's also why i said to do it end to end/task based. if you were to optimize this part alone, then that wouldn't make sense as the weights would be local
hasty mountain
Pytorch's autograd does the trick 
wooden sail
it certainly does
hasty mountain
Strange...then I still don't get why using 4 layers doesn't provide a relevant performance gain as using 2 layers...
wooden sail
that would depend on the properties of your cost function
hasty mountain
In fact, I think it provides the same performance. The model with 2 layers got a loss of 7.59, accuracy of 81.46%, while the one with 4 layers got 7.48, 81.33% 
wooden sail
blindly adding layers doesn't always improve performance
it does always make the training slower though
hasty mountain
It's a cross entropy loss. I tested it for classification
FashionMNIST and CIFAR10
Well, thanks for the help!
wooden sail
i would try a simpler model with task-based training and see if that performs better
always good to have a reference of some sort
hasty mountain
Oh, I did. I used a VGG-like model
wooden sail
and how did that fare
hasty mountain
It did well. In fact, the attention model didn't get too behind.
With 6 conv layers + FCC, the VGG-like got a loss of 4.50 and accuracy of 88.29%
However, it had more than 900,000 parameters, while the 4 layers attention model(+FCC) had less than 60,000
wooden sail
pretty nice
hasty mountain
I just got a bit surprised because...when I asked my teacher more or less how the math could be explained, he said that he doesn't know if it makes sense in linear algebra, but...since it got empirical results...
wooden sail
well, you're making up an architecture and asking questions later 😛 the analysis of why it's doing what it's doing is fairly difficult
i would still wanna see a flavor that only multiplies, without the softmax, trained end to end 😛 i'm curious
hasty mountain
Now that you've mentioned it... I think the first attention mechanisms were more or less like that, weren't they?
wooden sail
sounds about right
the main question that arises is, why would there be any benefit to grouping columns and rows together as opposed to something else
hasty mountain
wooden sail
sounds about right
Yes, it was a weight factor defined by a feedforward layer, independent from the main network
wooden sail
you could possibly choose a different grouping that is more similar to a convolution
hasty mountain
wooden sail
the main question that arises is, why would there be any benefit to grouping col...
I thought about this as a way to simplify an image into small problems. Instead of trying to see, between all those 784 pixels(MNIST) which ones are the most relevant, why not check 7 by seven each time?
hasty mountain
wooden sail
you could possibly choose a different grouping that is more similar to a convolu...
I also wanted something faster than a convolution...using many channels in a convolution makes the process so slow...
wooden sail
but why not check all of the neighbors of the pixel instead? one convolutional layer could be used to make the mask
convolutions are also about as fast as it gets tbh
they're implemented via FFTs or otherwise crazy optimized algorithms
hasty mountain
I know, but they're still slow. My GANs take too much time to train because of them
In fact, I thought about this mechanism because of my GANs
Of course, it didn't work for my GANs because GANs are sociopath networks
wooden sail
and a single conv layer is still too much?
hasty mountain
Depending on the number of channels
If it's 3, 10, 100, or even 400, it shouldn't bother me. But if I have to use 600, 800, 1000...
wooden sail
i'm calling it a convolution, but what i have in mind is more like taking your approach and instead of considering rows and cols, considering squares around each pixel
i would expect that to give more useful info
hasty mountain
But how would I use all squares in the input without having to use the entire image and without having to, in the end, transform this into a convolution?
wooden sail
it's not a convolution since the filter would the spatially variant
it's the same kind of operation though
hasty mountain
Unless I decompose my input image in N different squares, and assigned a single different weight for each N
wooden sail
hasty mountain
Unless I decompose my input image in N different squares, and assigned a single ...
this is exactly it
hasty mountain
Like...if my input has 28x28 pixels, I could use 4 weights that have 7x7 pixels...
wooden sail
apply a mask to each block and softmax it to get one thing out
you could also use overlapping blocks
hasty mountain
You know...that's an interesting idea...but the softmax would be applied through each row or through each column, fatally
Perhaps if I remove the softmax, then
wooden sail
should be able to apply it to the whole thing
hasty mountain
How would I apply softmax to an entire array?
wooden sail
idk the pytorch API so i couldn't say. it probably has a parameter for the axis to apply it along, which should be able to receive a tuple. otherwise you can flatten
hasty mountain
Oh yes...indeed!
wooden sail
at any rate, the motivation behind this is the same as behind convolutions: you expect neighboring blocks to be related to each other in some way, as images often change slowly
hasty mountain
The dimension argument must be an integer, but if I flatten it...
wooden sail
we do lose the spatial invariance property, which is convolution's strongest benefit though
hasty mountain
However, if I flatten the weight array...how would I recompose it, again?
hasty mountain
wooden sail
it either stacks rows or columns depending on the order you tell it to flatten in
hasty mountain
Good idea 
wooden sail
it could also just not work, i'm not promising anything 😛 but if you think it's worth a shot, try it out and lemme know how it goes
 iron basalt
hasty mountain
If it's 3, 10, 100, or even 400, it shouldn't bother me. But if I have to use 60...
iron basalt
hasty mountain
If it's 3, 10, 100, or even 400, it shouldn't bother me. But if I have to use 60...
For all your sizes, try multiples of 64 or some other power of 2.
GPU kernels have faster versions for sizes that come in the preferred multiples.
(They all use powers of 2)
sick fern
Hey guys, do u have any ideas for an ml project that I could add to my college resume?
fiery dust
fiery dust
`print(accuracy)`
`0.2120515116029139`
😭
this is horrible right?
iron basalt
iron basalt
For all your sizes, try multiples of 64 or some other power of 2.
Example: ```
The most dramatic optimization to nanoGPT so far (~25% speedup) is to simply increase vocab size from 50257 to 50304 (nearest multiple of 64). This calculates added useless dimensions but goes down a different kernel path with much higher occupancy. Careful with your Powers of 2.
GPUs are finicky.
hasty mountain
iron basalt
GPU kernels have faster versions for sizes that come in the preferred multiples.
Or...so that explains a lot of things... 
Thanks
 tender venture
Hey guys, I'm trying to train a custom data set, however when I run it in visual studio code it give me the warning about cuda and uses cpu, not gpu:
from ultralytics import YOLO

# Load a model
model = YOLO("yolov8l.yaml")  # build a new model from scratch
model = YOLO("yolov8l.pt")  # load a pretrained model (recommended for training)

# Use the model
results = model.train(data="DataSets/Cars/data.yaml", epochs=10)  # train the model
Before it starts training I'm getting the following message:
warnings.warn('User provided device_type of \'cuda\', but CUDA is not available. Disabling')
I installed following + CUDA Toolkit:
py -m pip install --upgrade setuptools pip wheel
py -m pip install nvidia-pyindex
py -m pip install nvidia-cuda-runtime-cu12
 gritty estuary
If anyone is interested in AI similar to ChatGPT, check out Open Assistant.
open-assistant.io
https://www.youtube.com/watch?v=64Izfm24FKA

#openassistant #chatgpt #ai
Help us collect data for OpenAssistant, the largest and most open alternative to ChatGPT.
https://open-assistant.io
OUTLINE:
0:00 - Intro
0:30 - The Project
2:05 - Getting to Minimum Viable Prototype
5:30 - First Tasks
10:00 - Leaderboard
11:45 - Playing the Assistant
14:40 - Tricky Facts
16:25 - What if humans had...
hasty mountain
Guys, if my dataset is composed of images that are too similar to each other, and my model isn't able to properly differ those images...there's no option rather than making the model more complex by extracting more features, right?
I have a dataset which is composed of a recorded gameplay, so each image is a frame. Thus, each image is roughly similar to each other. The labels are rewards according to each situation expressed in the image.
However, my VGG-like model is not being able to properly differ those images, so it's assigning more or less the same reward for all images.
(Not exactly the same reward, but they're quite close to each other even when the situations are different. However, even at different situations, the image is similar because it's the same game, in the same phase)
Oh... I got an idea... I think I'll use a hierarchical net for the reward model.
Here I go again...having to label a dataset sigh...
merry wadi
How do I train a GNN with very large training data? Do I use a for loop and batch the data?
 hidden mist
hasty mountain
Guys, if my dataset is composed of images that are too similar to each other, an...
hidden mist
hasty mountain
Guys, if my dataset is composed of images that are too similar to each other, an...
It may be worth identifying significant differences in frame data themselves algorithmically rather than attempting to identify data from each frame at least during training; the granularity with which you do this obviously varies on what your endgoal is, but there doesn't seem to be a compelling reason to train on data for 60 frames of the same image.
 unique vale
👋 I'm looking for advice on what I can use to solve the following problem:
I want to build a demo that runs an ML model (inference) in a container, but I want to auto-scale it to 0 instances, when there is no traffic.
I had success with CPU only workloads using GCP Cloud Run, works great, but they don't offer GPU instances.
I looked into AWS offerings for lambdas today and I just hated every second I spent trying to make it work and finally gave up.
Does anybody know what else I should try?
 slate hollow

Artificial Intelligence Stack Exchange
I am reading Reinforcement Learning: An Introduction by Sutton & Barto. According to this textbook, as far as I understood, the authors claim that the policy and value iteration methods conver...

why isn't pi_{t+1} the exact same as pi_{t}?
 wind ledge
why when i put my openai api key in a .env file it does not detect it and says i need a the key
api_key =os.getenv("OPENAI")```openai.error.AuthenticationError: No API key provided. You can set your API key in code using 'openai.api_key = <API-KEY>', or you can set the environment variable OPENAI_API_KEY=<API-KEY>). If your API key is stored in a file, you can point the openai module at it with 'openai.api_key_path = <PATH>'. You can generate API keys in the OpenAI web interface. See https://onboard.openai.com for details, or email support@openai.com if you have any questions.
it gives this error
i tried using this openai.api_key = os.getenv("OPENAI_API_KEY")
stll does not work
slate hollow
slate hollow
https://ai.stackexchange.com/questions/34244
nevermind, coded something up myself and figured it out.
 deft spire
wind ledge
why when i put my openai api key in a .env file it does not detect it and says i...
deft spire
wind ledge
why when i put my openai api key in a .env file it does not detect it and says i...
Just rename the variable to OPENAI_API_KEY, load dotenv and openai module should automatically find the variable
wind ledge
yeah in the env file right? i did that same error
deft spire
wind ledge
yeah in the env file right? i did that same error
What IDE do you use?
wind ledge
visual studio code
wind ledge
import openai
import os
load_dotenv()
openai.api_key = os.getenv('CHATGPT_API_KEY')
def chat_reponse(prompt):
response = openai.Completion.create(
model="text-davinci-003"
prompt=prompt,
temperature=1,
max_token=100
)
response_dict = response.get("choices")
if response_dict and len(response_dict) > 0:
prompt_response = response_dict[0]["text"]
return prompt_response
``` raw garnet
is this a poor heatmap of predicted/true (using RandomForestClassifier on sklearn)
 ripe sapphire
@wind ledgeWhat do you mean by temperature = 1
 polar portal
raw garnet
is this a poor heatmap of predicted/true (using RandomForestClassifier on sklear...
polar portal
raw garnet
is this a poor heatmap of predicted/true (using RandomForestClassifier on sklear...
It seems like you have some problems with your dataset. Is it okey to share your dataset with us? Maybe we can help you.
 clever owl
How can I group_by the date and whether or not the value in values is positive or negative. Then, sum the positives and negatives each.
import pandas as pd

data = {
    'date': ['1/1/2020','1/1/2020','1/1/2020', '1/1/2021', '1/1/2020'],
    'values': [10,-10,10,50,-80]
}

df = pd.DataFrame(data)
i.e
           values
date
1/1/2021       50
1/1/2020       20
1/1/2020       -90
Just point me in the right direction with which methods I should read up on
serene scaffold
clever owl
How can I group_by the `date` and whether or not the value in `values` is positi...
you can groupby df['values'] > 0
(but you have to decide which size 0 falls on.)
@clever owl actually, you can groupby both date and "positiveness" at the same time. I already have the solution, so if you can't figure it out, lmk.
clever owl
easy easy ill let u know in a bit bro thanks
@serene scaffold
sort of got it, but I got a middle row that ill have to drop
import pandas as pd

data = {
    'date': ['1/1/2020','1/1/2020','1/1/2020', '1/1/2021', '1/1/2020'],
    'values': [10,-10,10,50,-80]
}

df = pd.DataFrame(data)

df = df.groupby([df["date"],df['values'] > 0]).sum()
Mind showing what you did?
serene scaffold
clever owl
<@253696366952316929>
sort of got it, but I got a middle row that ill have to d...
In [5]: df.groupby([df['date'], df['values'].gt(0)]).sum()
Out[5]:
                 values
date     values
1/1/2020 False      -90
         True        20
1/1/2021 True        50

In [7]: df.groupby([df['date'], df['values'].gt(0)]).sum().droplevel(1)
Out[7]:
          values
date
1/1/2020     -90
1/1/2020      20
1/1/2021      50
pretty sure what you mean is that there's a middle column that you wanted to drop. but it's actually a level of indexing
if you group by two groups, you get two index levels.
serene scaffold
yep! one for df['date'] and one for df['values'] > 0
 wild crystal
Hello channel
I did Lasso and ridge regression on a dataset about CO2 emissions. I want to optimise the hyperparameters with GridSearchCV to find out which one is the best for this exercise.
I use this:
parameters = {'C':[0.1,1,10,50], 'kernel':['rbf','linear', 'poly'], 'gamma':[0.001, 0.1, 0.5]}
and when I try to fit it gives me this error:
Invalid parameter C for estimator Ridge(alpha=50). Check the list of available parameters with estimator.get_params().keys()
[13:09]
what did I do wrong?
hasty mountain
Hm... Is it my impression or GANs are so crazy that sometimes they optimize in a way that they end up collapsing, sometimes they optimize in a way that they can keep going?
I'm testing a ResNet-like generator with VGG-like discriminator and...on my first attempt, it went fine and collapsed after 40 epochs. On my second attempt, it collapsed right at the 2nd epoch. Now, in my third attempt, it's running smoothly way so far(50 epochs, though the generator loss has decreased dangerously)
Do I also have to rely on luck, besides everything?
 versed gulch
Hi I have been training my AI segmentation 3D-UNet on image sizes of 128x128x128 and wanted to know why I am unable to use the same model to predict the mask of an image of size 20x708x732 in the testing phase?
I'm getting this error

 warm wyvern
can anyone help me with linear regression? I always getting those wierd number for the prediction, like -1.77635684e-15
serene scaffold
warm wyvern
can anyone help me with linear regression? I always getting those wierd number f...
the e-15 is just scientific notation, if that's the "weird" part
warm wyvern
serene scaffold
the `e-15` is just scientific notation, if that's the "weird" part
how can I turn it into presentable result ?
serene scaffold
warm wyvern
how can I turn it into presentable result ?
you can round to three decimal places, I guess.
which would basically make that 0
warm wyvern
Sorry I am newbie...really struggle with the concept
serene scaffold
warm wyvern
Sorry I am newbie...really struggle with the concept
No problem
In [7]: f'{-1.77635684e-15:.50f}'
Out[7]: '-0.00000000000000177635684000000011167290497728110361'
so, -0.00000000000000177635684000000011167290497728110361 is what that number is
warm wyvern
serene scaffold
No problem
```py
In [7]: f'{-1.77635684e-15:.50f}'
Out[7]: '-0.00000000000000177...
Tks for you help, maybe I dont grasp the concept of linear regression, i need to dig in more
serene scaffold
warm wyvern
Tks for you help, maybe I dont grasp the concept of linear regression, i need to...
linear regression isn't really about getting individual numbers. it's about figuring out what the best-fit curve is.
We can see with our eyes that the points basically follow this curve. but linear regression is about figuring that out when you're a computer, and you just have the coordinates for the points.

 charred light
serene scaffold
linear regression isn't really about getting individual numbers. it's about figu...
charred light
serene scaffold
linear regression isn't really about getting individual numbers. it's about figu...
I think you mean regression instead of linear regression (Or Simple Linear Regression).
Linear regression technically defined as fitting the best line (or hyperplane in 3d+). The particular graph would fall under quadratic/polynomial regression.
serene scaffold
yeah, I may have overgeneralized.
 nocturne eagle
hardly, he just quoted the definition and the regression you showed is most definitely not linear
serene scaffold
this is true
nocturne eagle
you "overspecified" 🙂
wooden sail
i was gonna make that comment as well, but the problem of polynomial regression is isomorphic to fitting a hyperplane if you use a vandermonde matrix that represents the powers of the polynomial
from that standpoint, it's anyway a linear regression 😛
the distinction between the terms is kinda moot there
 tawny spire
do i include target/label column(s) when exploring data
my data cleaning techniques don't seem to offer much improvement, even when removing rows with values outside the 2nd standard deviation (for non-target/label columns)
i was getting higher accuracy, but some data points were being removed by target which brought the length of the set of targets from like 7 to 3 or 4, which turned it from a wine classifier into a bad wine classifier [it removed high scoring wines from the dataset because they were underrepresented]
maybe it's not meant to be a 'good wine classifier' if the data is weighted so heavily towards bad ones
raw garnet
polar portal
It seems like you have some problems with your dataset. Is it okey to share your...
import nfl_data_py as nfl
import pandas as pd
from sklearn.model_selection import train_test_split
from sklearn.preprocessing import LabelEncoder
from sklearn.ensemble import RandomForestClassifier
from sklearn.metrics import classification_report, confusion_matrix
import seaborn as sns
import matplotlib.pyplot as plt


pbp = nfl.import_pbp_data([2022], downcast=True, cache=False, alt_path=None)
df = pd.DataFrame(pbp)

df = df[['score_differential', 'yardline_100', 'ydstogo', 'down', 'half_seconds_remaining', 'play_type']]
df = df.dropna()

df = df[df['play_type'] != 'None']
df = df[df['play_type'] != 'no_play']

df = df.reset_index(drop=True)

le = LabelEncoder()
df['play_type_encode'] = le.fit_transform(df['play_type'])
# train test split
X_train, X_test, y_train, y_test = train_test_split(df.drop(['play_type', 'play_type_encode'], axis=1), df['play_type_encode'], test_size=0.3, random_state=42)

rfc = RandomForestClassifier(n_estimators=100)

rfc.fit(X_train, y_train)

rfc_pred = rfc.predict(X_test)

print(classification_report(y_test, rfc_pred))

plt.figure(figsize=(10,6))
sns.heatmap(confusion_matrix(y_test, rfc_pred), annot=True)
plt.xlabel('Predicted')
plt.ylabel('True')
Hey @deep spire!
It looks like you tried to attach file type(s) that we do not allow (.pdf). We currently allow the following file types: .gif, .jpg, .jpeg, .mov, .mp4, .mpg, .png, .mp3, .wav, .ogg, .webm, .webp, .flac, .m4a, .csv, .json.
Feel free to ask in #community-meta if you think this is a mistake.
wild crystal
I will try it. Thank you so much
wheat snow
Hi there!, i got a part of my df here:
         Weekday   Duration
23107     Sunday  32.033333
16418    Tuesday   3.600000
18674     Friday   6.216667
14913   Thursday  18.250000
19839    Tuesday   7.016667
16245     Sunday  36.983333
21140   Thursday  33.733333
16766     Sunday  26.950000
17099     Sunday  14.483333
22851   Saturday   8.183333
14701  Wednesday  19.150000
13240     Sunday   5.833333
16937   Saturday   5.883333
22322     Friday   8.600000
13473   Saturday   6.033333
18158   Thursday   8.533333
What you see here is some data about my netflix account, the Weekday column states at what weekday i made an session (multible sessions at the same day is possible) and on the right you can see the watchtime duration in minutes....
Now i want to implement a function that shows me the average watchtime PER weekday of that df... Im still thinking about how to do it...
Group the dataframe by weekday and then take the mean was my idea...
days_category = ['Monday', 'Tuesday', 'Wednesday', 'Thursday', 'Friday', 'Saturday', 'Sunday']
data_week_mean = user.groupby(user['Weekday']).mean().reindex(days_category)
this was my first idea and the code works... but i think an average watchtime on monday arround 17 min is VERY low for my watching habits
serene scaffold
@wheat snow days_category = ['Monday', 'Tuesday', 'Wednesday', 'Thursday', 'Friday', 'Saturday', 'Sunday'] isn't the code that I gave you. why did you remove the pd.Categorical part?
oak cosmos
serene scaffold
<@763828494060355654> `days_category = ['Monday', 'Tuesday', 'Wednesday', 'Thurs...
oi, u again, i didnt worked when i tried to plot it so i changed it
 long widget
If I want to use research papers to train an AI, what would be a good way to store these? Should I put them in a database with the most important information extracted or how else can I approach this?
serene scaffold
long widget
If I want to use research papers to train an AI, what would be a good way to sto...
you usually don't put machine learning training data in an actual database. you can just have a directory on your computer with all the papers as plain text.
(but converting an academic paper, which is often a PDF, to plain text, is a pain.)
oak cosmos
serene scaffold
for the `user['Duration'].dt.total_seconds()/3600#.sum()` part, you can do `user...
i mean i already have the data but it seems wrong, so i asked here to be sure that the idea is indeed correct... i wasnt satisfied with the values i ogt as an average time, 17min on monday cant be right
serene scaffold
@oak cosmos @wheat snow are you the same person?
oak cosmos
serene scaffold
<@1070132973132845156> <@763828494060355654> are you the same person?
ye sry im currently on a account to talk with some friends in a server
thats why im typing from here
wait i hope that isnt forbidden?!
serene scaffold
this was my first idea and the code works... but i think an average watchtime on monday arround 17 min is VERY low for my watching habits
try doingdf['Weekday'].value_counts(), because there aren't even any Monday rows in your df sample.
oak cosmos
i didnt red smth about other accounts in the rules
long widget
serene scaffold
you usually don't put machine learning training data in an actual database. you ...
No benefits to modify the paper what so ever, for example removing some 'useless' information?
serene scaffold
@oak cosmos if you get banned on one account, we'll ban all your accounts, is all.
oak cosmos
serene scaffold
<@1070132973132845156> if you get banned on one account, we'll ban all your acco...
well okay, i have no need to slur or do anything else
serene scaffold
long widget
No benefits to modify the paper what so ever, for example removing some 'useless...
not sure what you mean by "useless" information. but you need the papers as text to work with them, not as PDFs.
rain temple
any ideas on how to embed a pretrained model into a django web app?
oak cosmos
Monday 106
Sunday 101
Wednesday 93
Friday 84
Saturday 80
Thursday 72
Tuesday 66
i got enough @serene scaffold
long widget
serene scaffold
not sure what you mean by "useless" information. but you need the papers as text...
why do u usually not put machine learning training data in a database?
serene scaffold
long widget
why do u usually not put machine learning training data in a database?
when you say databases, you're talking about like SQL, right?
long widget
yea or MongoDB for example
serene scaffold
long widget
yea or MongoDB for example
the point of databases is to be able to query them. what queries do you need to do?
long widget
serene scaffold
the point of databases is to be able to query them. what queries do you need to ...
this way you could keep track of the research paper source, publish data, if I would want to do anything with that. But I might be looking at it wrong?
serene scaffold
long widget
this way you could keep track of the research paper source, publish data, if I w...
you can have each file as a JSON
long widget
serene scaffold
you can have each file as a JSON
instead of the plain text?
serene scaffold
long widget
instead of the plain text?
one of the keys would be the plain text of the document. but then the JSON file would still be plain text.
long widget
{
text: (the whole research paper text),
publish_date: ..,
source: ...,
}
and I can then use the text key to train the ai?
serene scaffold
long widget
and I can then use the text key to train the ai?
you'd need to tokenize it and stuff, but yeah.
long widget
serene scaffold
you'd need to tokenize it and stuff, but yeah.
can u recommend any tools or libraries that help with tokenizing?
serene scaffold
long widget
can u recommend any tools or libraries that help with tokenizing?
spacy
long widget
serene scaffold
spacy
thanks!
 soft badge
is it reliable to make a chat bot application using openai?
in question of the answers it can generate for a certain niche?
long widget
serene scaffold
you can have each file as a JSON
should I find a way to automate this? extracting the text, publish date and source and putting them together in a json
I assume it's not efficient to do this manually
serene scaffold
long widget
I assume it's not efficient to do this manually
doing it manually would be the worst thing you've ever experienced.
serene scaffold
long widget
should I find a way to automate this? extracting the text, publish date and sour...
what kind of documents are you trying to get?
long widget
serene scaffold
what kind of documents are you trying to get?
I was looking at some cdc and pubmed papers, still looking for some other sources
serene scaffold
long widget
I was looking at some cdc and pubmed papers, still looking for some other source...
I think you can download dumps of pubmed? but they'll only have the abstract.
long widget
serene scaffold
I think you can download dumps of pubmed? but they'll only have the abstract.
yea u can
serene scaffold
also I think their dumps are in xml.
long widget
serene scaffold
also I think their dumps are in xml.
I don't see neither xml nor json
serene scaffold
long widget
I don't see neither xml nor json
they're in some compressed format.
and when you decompress it, you get xml
long widget
this is the compressed format?
 serene scaffold
long widget
this is the compressed format?
serene scaffold
long widget
this is the compressed format?
no. compressed data looks like random garbage unless you decompress it.
 brisk cobalt
Anyone with experience using YOLO?
serene scaffold
nope. I'm buddhist.
long widget
brisk cobalt
Anyone with experience using YOLO?
I have used it before, for very simple stuff though
hasty mountain
Does it exist a GAN version where the Generator tries to choose the best outputs generated by its convolution layers?
I'm currently testing one that does this, and it seems interesting...but it would be interesting to see if a researcher has already done it
Too bad that it seems to provide a lower diversity of outputs...the same result I would get if, in a normal GAN, I use a learning rate that is too low
(Perhaps this doesn't even make sense at all, but still...)
 latent estuary
Best Python library for data visualization?
I am looking for a Python library for data visualization. I've done dataviz mostly in Excel, but Python seems more performant for million-line CSVs. The easier to use, the better.
So far, I've found ones like:
- Dash
- Redash
- Plotly
- Atoli
serene scaffold
latent estuary
Best Python library for data visualization?
I am looking for a Python library f...
There's also matplotlib and seaborne.
I dislike both for different reasons.
latent estuary
serene scaffold
I dislike both for different reasons.
I see. Why do you dislike them?
brisk cobalt
long widget
I have used it before, for very simple stuff though
have you train using your own data?
 silver flax
Hi, could someone help me with some code i generated with chatgpt?
serene scaffold
silver flax
Hi, could someone help me with some code i generated with chatgpt?
well, what is the code? it's best to give enough information for people to start helping right away.
silver flax
i'm trying to input the microphone of my pc to a ml
stream = pa.open(format=pyaudio.paFloat32,
channels=1,
rate=44100,
output=True,
frames_per_buffer=1024)
if i put input it gives me an error that it should be an output, and for output it says input
the full code is 100 lines... cannot post here
it might have something to do with this
stream.write(result.tobytes())
stream = pa.open(format=pyaudio.paFloat32,
channels=1,
rate=44100,
output=True,
frames_per_buffer=1024)
all_memory = []
data = []
result2 = []
interior_output = []
Define the decay rate and half-life
DECAY_RATE = 0.95
HALF_LIFE = np.log(0.5) / np.log(DECAY_RATE)
Start button callback function
def start_callback():
while root.state() == "normal":
try:
# Update the memory weight based on the decay rate
weight = DECAY_RATE**(time.time() / HALF_LIFE)
# Read microphone data
data = stream.read(1024)
data = np.frombuffer(data, np.float32)
        # Machine learning on microphone data
        result = model.predict(np.expand_dims(data, axis=0))

        # Sound output on speakers
        stream.write(result.tobytes())
it's eitheir
An error occurred: [Errno Not input stream] -9975
Or
An error occurred: [Errno Not output stream] -9974
 azure socket
Guys, does anyone know how to modify pytesseract internally to read a predefined sequence of letters and numbers?
 alpine temple
Hi,
Anyone a part of a discord channel or online community that works with Hadoop components?
wind ledge
dataset = pd.read_csv('cancer.csv')

x = dataset.drop(columns=["diagnosis(1=m, 0=b)"])#other data
y = dataset["diagnosis(1=m, 0=b)"]#diagnosis data

from sklearn.model_selection import train_test_split

x_train, x_test, y_train, y_test = train_test_split(x, y, test_size=0.2) # 20% of data will go to the test set

import tensorflow as tf

model=tf.keras.models.Sequential()

model.add(tf.keras.layers.Dense(256, input_shape=x_train.shape, activation='sigmoid'))
model.add(tf.keras.layers.Dense(256, activation='sigmoid'))
model.add(tf.keras.layers.Dense(1, activation='sigmoid'))

model.compile(optimizer='adam', loss='binary_crossentropy', metrics=('accuracy'))

model.fit(x_train, y_train, epochs=1000)```my code does not work and it gives a bunch of errors but this is the ValueError
ValueError: Input 0 of layer "sequential" is incompatible with the layer: expected shape=(None, 455, 30), found shape=(None, 30)
ripe sapphire
I think the error is because of The error is occurring because the input shape for the first dense layer is specified as input_shape=x_train.shape, which is (None, 30), but the expected shape is (None, 455, 30).
model.add(tf.keras.layers.Reshape((455, 30), input_shape=x_train.shape))try this:
late shell
Hello, is it possible to generate new tokens from a list of unordered token in NLP?
Like Input: [labyrinth, suffering, out, way, only, of, the, forgive, to, is]
Output: The only way out of the labyrinth of suffering is to forgive. (or any other sentence that uses the words provided in the input only)?
 simple tapir
How can i detect multiple faces in face recognition?
serene scaffold
@late shell you can use a language model for that
versed gulch
If I train my AI segmentation model on images of sizes 128x128x128, can I evaluate it on images 20x512x512
or are the architectures that can be trained on different images sizes without compressing the image resolution
late shell
serene scaffold
<@594900402634227752> you can use a language model for that
Yeah I studied a little bit about n-gram models using markovs chain but it requires previous n words to predict the new word. Moreover it doesn't understand the various parts of a story such as intro, plot,climax etc. Can you tell me what technique/model would help me in this ?
serene scaffold
late shell
Yeah I studied a little bit about n-gram models using markovs chain but it requi...
it sounds like you want to find the most probable ordering for the input tokens, and then just keep generating new tokens as normal from there.
Moreover it doesn't understand the various parts of a story such as intro, plot,climax etc.
neither does ChatGPT. language models "know" all that stuff implicitly.
late shell
serene scaffold
> Moreover it doesn't understand the various parts of a story such as intro, plo...
Oh, well, okay.
late shell
serene scaffold
it sounds like you want to find the most probable ordering for the input tokens,...
Yeah ig. I'm sorry I just want to build this but have 0 knowledge in NLP. Im basically a noob rn.
 misty flint
serene scaffold
> Moreover it doesn't understand the various parts of a story such as intro, plo...
misty flint
serene scaffold
> Moreover it doesn't understand the various parts of a story such as intro, plo...
speaking of chatgpt...
 serene scaffold
misty flint
speaking of chatgpt...
serene scaffold
misty flint
speaking of chatgpt...
Welcome to LLM Hunger Games
misty flint

versed gulch
does anyone know anything wrong with my code?
from torch import nn
import torch, time

class conv_block(nn.Module):
  def __init__(self, in_channels, out_channels):
    super().__init__()

    self.conv1 = nn.Conv3d(in_channels = in_channels, out_channels = out_channels,
                            kernel_size = (3, 3, 3), padding = 1)

  def forward(self, inputs):
    x = self.conv1(inputs)

if __name__ == "__main__":
  x = torch.randn((2, 1, 32, 128, 128))
  b = conv_block(32, 64)
  print(x.shape)
  print(b(x).shape)
 serene scaffold
versed gulch
does anyone know anything wrong with my code?
```py
from torch import nn
impor...
serene scaffold
versed gulch
does anyone know anything wrong with my code?
```py
from torch import nn
impor...
your forward doesn't return anything
By the way, I won't look at screenshots of text--code or error messages.
 austere swift
versed gulch
does anyone know anything wrong with my code?
```py
from torch import nn
impor...
austere swift
versed gulch
does anyone know anything wrong with my code?
```py
from torch import nn
impor...
you should swap the 1 and 32 in your randn shape
conv3d takes shapes of NCDHW (batches, channels, depth, height, width)
so your channels (32) should be the second one
versed gulch
austere swift
you should swap the `1` and `32` in your `randn` shape
thanks
Thanks I've managed to solve my problem, the only thing now my 3D Unet accepts an input 128x128x128 during training but if I train on only 20x256x256 it doesn't work I get this error instead
"""
RuntimeError: Sizes of tensors must match except in dimension 1. Expected size 4 but got size 5 for tensor number 1 in the list.
austere swift
that means the first sample has a different shape than the other ones
 restive bronze
ImportError: cannot import name '_TPU_AVAILABLE' from 'pytorch_lightning.utilities' (/usr/local/lib/python3.8/dist-packages/pytorch_lightning/utilities/__init__.py) site:stackoverflow.com
how to fix this
this is a super weird error
it is coming when I am doing from aitextgen import aitextgen
serene scaffold
fiery dust
is 21% accuracy good or nah?
I wouldn't want to use something that's wrong most of the time.
fiery dust
I think that for my case it could work, let me explain and correct me if I'm wrong
let's imagine the model generates for you 100 values. obviously this is not exact but lets say 79 values wont be right. I think it doesnt matter much cause I'll test those 100 generated values and if 21 of those 100 are better than before, thats enough
like I don't need every single generated value to be better, with a few I'm ok.
idk if this makes sense 😭 hahaha
 lone vine
HI all, for those interested - I created a pypi package that allows you to access data from ETF DB, one of the large ETF data providers out there. https://github.com/lvxhnat/pyetf-scraper Will love some feedback and do give it a star if you like it. Also looking for contributors who can help maintain and improve on the current package. Do reach out to me if interested, thanks! 🙂
wooden sail
fiery dust
is 21% accuracy good or nah?
what's the task you're doing? accuracy in doing what
fiery dust
I have all the explanation here 🙂 #data-science-and-ml message
sorry I dont want to write it all over again haha but let me know if you want me to rephrase something
wooden sail
so it finds the parameters of a model?
fiery dust
it tries to find the best parameters for a function, yeah
wooden sail
21% is really bad
how are you measuring whether it's correct? you forward model the parameters again?
fiery dust
I dont know if I did it the right way btw. Do you want me to share the data I'm using to test and the code ? It's not much.
wooden sail
nah, just a high level discussion about it should be fine
what's your measure of accuracy
fiery dust
I think it's basing on the net_profit
X = df[["tp_percent", "sl_percent", "rsi_lenght", "num_div_pivots", "bars_to_change", "left_bars"]].values
y = df["net_profit"].values
this seems right to me. right?
wooden sail
idk, this is not high level enough for me to have any idea of what you're doing
say you have a model f, parameters x for f, and an output y
are you comparing x to some x_true, or f(x) to y? and with which metric
fiery dust
the higher the Y the better
but idk if the model is thinking that way
sorry I'm new to this I'm trying to be accurate with what I say but it doesnt seem to work hahaha
wooden sail
ok, so you're directly trying to maximize f(x)
fiery dust
yes
wooden sail
and how do you choose whether it was successful or not? how did you come up with this 21% number
fiery dust
wooden sail
and how do you choose whether it was successful or not? how did you come up with...
well that was the accuracy of the model
accuracy = model.score(X_test, y_test)
fiery dust
X_train, X_test, y_train, y_test = train_test_split(X, y, test_size=0.75)
 modest hazel
Hello, how can i calculate average values of variables for each month*year combination of dataframe on pandas?
Week Sales Brand price Average category price Press 04.01.2010 7092 55 104 0 11.01.2010 8664 52 100 0 18.01.2010 7526 53 97 50 25.01.2010 9165 55 103 56 01.02.2010 8713 52 101 6 08.02.2010 7489 53 101 0 15.02.2010 8595 53 104 6 22.02.2010 7798 53 100 0
serene scaffold
modest hazel
Hello, how can i calculate average values of variables for each month*year combi...
make sure that your Week column has the datetime64 data type, not strings.
can you do df['Week'].dtype and tell me what it is?
 ocean swallow
Is there a pretrained model for multi label image classification?
I am looking for general product labeling idea
so say given a scarf image, it should output labels like "scarf" "winter" "clothing" "{color and/or pattern}" etc. Anything good?
charred light
ocean swallow
so say given a scarf image, it should output labels like "scarf" "winter" "cloth...
You can look into ResNet (Trained on Imagenet). Although for multi-labels you probably have to train your own. https://vijayabhaskar96.medium.com/multi-label-image-classification-tutorial-with-keras-imagedatagenerator-cd541f8eaf24 https://sagemaker-examples.readthedocs.io/en/latest/introduction_to_amazon_algorithms/imageclassification_mscoco_multi_label/Image-classification-multilabel-lst.html
ocean swallow
charred light
You can look into ResNet (Trained on Imagenet). Although for multi-labels you pr...
does architecture even support it?
I have focused on visual genome ds, and conceptual captions dataset for it
But I am focusing on starting with something proven to ne working okayish
charred light
ocean swallow
does architecture even support it?
Yes, tensorflow does. You will need a decently labeled dataset though. That's the primary downside.
Link for img https://towardsdatascience.com/multi-label-image-classification-in-tensorflow-2-0-7d4cf8a4bc72
 ocean swallow
charred light
Yes, tensorflow does. You will need a decently labeled dataset though. That's th...
ocean swallow
charred light
Yes, tensorflow does. You will need a decently labeled dataset though. That's th...
okay thanks let me check it.
mild dirge
ocean swallow
okay thanks let me check it.
multi-label classification can basically just use the same CNN architectures as the more general multi-class, single label classification models. The big difference is that often a sigmoid activation is used for multi-label, to give a 0 or 1 for each class separately. Whereas for multi-class but single label, the softmax activation is used for the final layer.
ocean swallow
mild dirge
multi-label classification can basically just use the same CNN architectures as ...
but I don't want to risk just running the just changing the last layers activation function not being nearly enough. so that's why I asked was there any pretrained architectures.
I can't believe there isn't really but I think there actually isnt lol
I have the dataset.
mild dirge
Well pre-trained for multi-label with your exact labels probably not
But you can use transfer learning and then finetune it to your data and labels
ocean swallow
mild dirge
Well pre-trained for multi-label with your exact labels probably not
what is there?
I will most probably use conceptual captions which has basically tags
just need one good model
mild dirge
Oh hmm, seems that you wanted captioning, and not just multi-label classifcation
Not sure about that
There's plenty of just image classification networks that you can modify to work for multi-label, like resnet and mobilenet etc.
ocean swallow
mild dirge
Oh hmm, seems that you wanted captioning, and not just multi-label classifcation
no no no
it is just that dataset has labels associated with images
not that I want captioning per se
I am not interested in captioning
mild dirge
Oh, so just multi-label classification then?
ocean swallow
yep
mild dirge
And the labels are just whether a class is present in the image or not for each class?
I.e. an array of 0s and 1s
ocean swallow
Additionally, we provide machine-generated image labels for a subset of 2,007,528 image-URL/caption pairs from the training set. The image labels are obtained using the Google Cloud Vision API. Each image label has a machine-generated identifier (MID) corresponding to the label's Google Knowledge Graph entry and a confidence score for its presence in the image.
oh f....
Main reason I was looking for new model was that Google Vision API labels were terrible lol but this dataset was labeled by it as well
damn
mild dirge
But no non-ai generated labels?
mild dirge
ah. Well yeah, the dataset isn't super useful then. If you can use some other model to find labels then you've already found the model that can do the task.
So there would be little point in making one then.
ocean swallow
yeah. I want to implement this in business
it is just that. vue.ai does it for too expensive
but it is excellent
ocean swallow
30k a year
ocean swallow
mild dirge
Rent vue.ai for a week, generate labels, train your own model 😛
exactly what I thought but like they won't even let me a trial because my business doesn't have enough presence lol
it is one of those saas where they manually schedule a demo for you
mild dirge
yeah, probably not a great business model for them if they'd allow that
Is it necessary to use this dataset? there must be other datasets too
ocean swallow
I mean there is a lot of captioning dataset or just object detection ones
not exactly the ones I want
I couldnt find it if there was
mild dirge
Object detection will have a different format of labels, but it should def. include presence of a class or not
So you could reformat the target data to one that can be used for multi-label classification
ocean swallow
but my main goal is giving multiple labels to single objects
mild dirge
object detection will have the presence of the class and a location and size etc. But you can just remove the useless info
ocean swallow
so they are kinda useless
mild dirge
hmm, to a single object, or to 1 image?
ocean swallow
a ski pole? winter, sports, gear etc.
charred light
ocean swallow
Additionally, we provide machine-generated image labels for a subset of 2,007,52...
Most datasets have AI labeling. Manually labeling is expensive.
mild dirge
hmm right, but that's not just multi-label classification anymore then
charred light
Probably multi-object detection.
mild dirge
That's just object detection, and then given the object detected you can maybe use a word graph to find words connected/relevant to the object.
ocean swallow
mild dirge
That's just object detection, and then given the object detected you can maybe u...
that would partially work like you said but
the color of the image, the pattern of clothings etc would be appreciated too
so more like I want image to word graph I guess?
mild dirge
You would somehow need labeled data for patterns then (colors doesn't seem to need ai)
I get what you are going at here, but getting that kind of labeling seems unconventional, and therefore just hard to find
charred light
Why not have 2/3 models to do what you want?
ocean swallow
mild dirge
You would somehow need labeled data for patterns then (colors doesn't seem to ne...
yeah I tried it with no color labelings
it is still kind iffy
with color quantization and calculating distances to set of colors
charred light
Detect object
Get type
Get color.
ocean swallow
it is still a hefty amount of work
ocean swallow
charred light
>Detect object
>Get type
>Get color.
type?
charred light
"winter, sports gear"
ocean swallow
that's what I am doing currently btw
but vision AI is bad at labeling
so I was looking for an alternative. google vision actually finds objects very good\
charred light
Yes, but also 80/20 rule. Only needs to be good enough 80% of the time.
charred light
Apply 80/20 all the way down the line and you get 💩
ocean swallow
I don't know what it is but it just says sleeves for every fking clothing item
like wth bro
even when it doesn't have sleeves
charred light
Imbalanced class?
ocean swallow
probably.
mild dirge
Yeah multi-labeling can be difficult with imbalanced classes
ocean swallow
I didn't train it. it is a pretrained service that google also uses internally
maybe it is a watered down version of what they use
maybe I just put this service forward
charred light
ocean swallow
I don't know what it is but it just says `sleeves` for every fking clothing item
Obligatory image.

 charred light
Image projects are a great thing to do as an intern (Was my internship project) and to never touch again in reality.
ocean swallow
charred light
Image projects are a great thing to do as an intern (Was my internship project) ...
yeah I wish I was more experienced on other things
charred light
ocean swallow
this is my final target to reach
Lmao, in production this is going to be:
90% data for final output comes from scraping other websites for descriptions
9% on OCR
1% From images
Also, that image gives tech-start up vibes.
ocean swallow
charred light
Lmao, in production this is going to be:
90% data for final output comes from sc...
what even was OCR going to be used for honestly here
lol
hmmm
you don't think it checks image for most data?
charred light
ocean swallow
you don't think it checks image for most data?
OCR? Probably not much just off the image. Maybe pull a brand if visible from time to time.
As for using images for data:
I'm just basing it off what's actually in production for something similar in Insurance. (Essentially auto-filling data) Website claims to use images, but back end images input isn't the primary "source of truth".
Maybe in this case they are different. But they would need a lot of training data.
If this is off their website/demo, then that example is probably best case scenario. Solid color background, simple pose + high contrast between background+clothing. Imagine the same with a crowded picture. Similar colors background/clothing.
But for any model, success always depends on the final use case though.
ocean swallow
I managed to upload a couple images actually and results were good
but like you said this is for product images only
so they are somewhat in great condition
hmmm
ocean swallow
charred light
OCR? Probably not much just off the image. Maybe pull a brand if visible from ti...
the solution you describe is even more boring than it already is, then
lol
I am building scrapers still for similar projects
I always sigh deeply right before I open vscode for those projects
ocean swallow
charred light
OCR? Probably not much just off the image. Maybe pull a brand if visible from ti...
what do you suggest then? I have built an App in the App store of shopify (the most popular ecommerce platform I guess) that does this so like store owners can tag their products easily. however like I said, google vision is not that good. What ya think I should go for?
charred light
ocean swallow
what do you suggest then? I have built an App in the App store of shopify (the m...
I don't really know the project's scope or what data is available so I'm not sure I can really give an input. (e.g. Does all products have an EAN? Is an image the only input? etc. )
 reef osprey
where should i start to learn about making a chabtot
charred light
reef osprey
where should i start to learn about making a chabtot
You'll need to know NLP (nltk package) among others.
ocean swallow
charred light
I don't really know the project's scope or what data is available so I'm not sur...
what data definetly or surely available is 1 image (mostly 2), title and description.
as far as I know no EAN or SKU or anything is guaranteed
also platform usually puts one or two tags
and the category of the item ofc
charred light
Products here are any products or clothes as shown above?
ocean swallow
any
charred light
My initial thoughts are some layered process. Platform's Tags and Category will have a higher likelihood to be correct just based on pure resources. So, starting there having a main model per category would be a start.
With the provided tags, you could generate additional tags based on word similarity (Word2Vec).
ocean swallow
yeah I will definetly implement some NLP model
I was just busy with the breaking FE recently
because the platform sucks
okay thank you!
that makles sense
charred light
Side note, if it's a personal project: I would always start off small or it can get overwhelming and get abandoned. Totally not me
ocean swallow
haha totally not resurrecting the personal project
that I have abandoned for those reasons
wheat snow
Hey guys... i got some netflix title here in the left column you can see the title and on the right column i tried to filter it a bit
15351                    Staffel 2 (Teaser): Locke & Key                    Staffel 2 (Teaser): Locke & Key
16840       Paradise PD: Teil 3: Spitzenbeamte (Folge 2)       Paradise PD: Teil 3: Spitzenbeamte (Folge 2)
15384                 Ginny & Georgia: Season 1 - Clip 5                                    Ginny & Georgia
11760  Brooklyn Nine-Nine: Staffel 1: Wir fangen Verb...  Brooklyn Nine-Nine: Staffel 1: Wir fangen Verb...
11639  Brooklyn Nine-Nine: Staffel 3: Die Zwei sind e...  Brooklyn Nine-Nine: Staffel 3: Die Zwei sind e...
11666  Brooklyn Nine-Nine: Staffel 2: Es wird Zeit, d...  Brooklyn Nine-Nine: Staffel 2: Es wird Zeit, d...
i found the following code that says it could do it... sadly i have no plan what this code does or how it can split up the strings....
df_vd['Title clean']= df_vd['Title'].str.replace(': (?i)(part|season|volume|limited series|series|chapter)(.*)', '').str.strip()
the code is from this article
Elvira’s blog
How to get the data I recently learnt that one can request from Netflix all personal data that they store about you, more about this on Netflix Help Center or go to Get My Info page directly. It took me one day from the data request to receiving the data.
morover, i didnt understand how this dude used IMBd to enrich his netflix data
 wanton stone
Hey guys need some help plotting graph using matplotlib
I got a csv file with 8 columns and each column has about 500 rows
Need to plot 2 graphs.. i) 1st column with 5th column
ii) 1st column with 6th column
Could someone tell me how to go about it
 gilded kestrel
hey guys is anyone experienced with lime? I have 10 classes but the explanations are for not 1, 1. Is there a way to configure this?
 oak cosmos
@wheat snow @wanton stone @gilded kestrel now thats a hey guys moment fr lmao
wanton stone
?😂
oak cosmos
wanton stone
Hey guys need some help plotting graph using matplotlib
I got a csv file with 8...
so you wanna add the 5th and 1st column? or you wnat the 1st column to be x and 5th column to be y?
wanton stone
Ya I want the 1st to column to be x and 5th to be y
oak cosmos
wanton stone
Ya I want the 1st to column to be x and 5th to be y
line plot right?
wanton stone
Ya
oak cosmos
fig, ax= plt.subplots()
plt.plot(x= df['Column_1'], y= df['coulmn_5'], ...)
plt.show()
if im not mistaking you can simply assign the df columns as x and y values to the plot
Of copurse this only works if you have no NaN values and column 1 and 5 are int or floats
to be safe i would check for NaN's
wanton stone
Ya all the values in 1 and 5 r int
oak cosmos
good
df.isna(df['Column_1']).sum()
ok, now check if u have missing values
@wanton stone
should print 0 if you have none missing data
wanton stone
Df is using pandas right ?
oak cosmos
wanton stone
Df is using pandas right ?
well u define ur df first ofc
wanton stone
Ya
wanton stone
Ya whatever we want to name it we can right ?
oak cosmos
df_vd= pd.read_csv('C:\\Privat\\Python_VSC\\netflix_project\\Daten_Netflix\\CONTENT_INTERACTION\\ViewingActivity.csv')
``` for a project i named my df df_vd standing dor dataframe_videodataSorry just takin some time to process this.. new to programming and shit 😅
wanton stone
oak cosmos
```py
df_vd= pd.read_csv('C:\\Privat\\Python_VSC\\netflix_project\\Daten_Netflix...
Ooh
oak cosmos
wanton stone
Ya whatever we want to name it we can right ?
yes, but i would always recommend for good readability reasons to name your dataframe always smth with df
wanton stone
oak cosmos
yes, but i would always recommend for good readability reasons to name your data...
That makes sense
oak cosmos
if you show your code to somebody who doesnt know everything of your project he will just be confused if u say```py
bla_idk_variable[...]= ...
Ya so still kinda doubt with this u sent
One sec
I opened my code and this is the data I have gotten
Obviously since it's my csv file right
 wanton stone
oak cosmos
```py
fig, ax= plt.subplots()
plt.plot(x= df['Column_1'], y= df['coulmn_5'], ......
wanton stone
oak cosmos
```py
fig, ax= plt.subplots()
plt.plot(x= df['Column_1'], y= df['coulmn_5'], ......
Do I type this as it is or do I do some change to it
Cause what's that after coulmn 5 ....?
oak cosmos
wanton stone
Do I type this as it is or do I do some change to it
Cause what's that after cou...
extar code, like title color and basic key arguments u can use to customize your graph
wanton stone
Ah okay
oak cosmos
wanton stone
I opened my code and this is the data I have gotten
Obviously since it's my csv...
wait, so what did u run to see this? oir is this just a csv?
wanton stone
oak cosmos
wait, so what did u run to see this? oir is this just a csv?
That's just my csv file I printed out xD
oak cosmos
what IDE do u use if u dont mind me asking?
wanton stone
Visual studio code
oak cosmos
okay thats good
wanton stone
Ya xD
oak cosmos
install csv editor or excel viewer
wanton stone
Oh okay
oak cosmos
Than you can look ur csv without dying of eye cancer
wanton stone
😂😂😂fair
 wanton stone
I opened my code and this is the data I have gotten
Obviously since it's my csv...
wanton stone
wanton stone
I opened my code and this is the data I have gotten
Obviously since it's my csv...
So in this ya I want to plot a graph thags takes my very first column as x and takes 5th column as y with all those datas
oak cosmos
also you can sort that stuiff and recheck if ur code does what it was supposed to do
wanton stone
oak cosmos
Clean af eh
oak cosmos
wanton stone
Clean af eh
ye, just look up in extensions excel viewer or csv editor and use one of em
wanton stone
Yupp
oak cosmos
wanton stone
So in this ya I want to plot a graph thags takes my very first column as x and t...
ye, well, i already said you all necessary stuff try it now
wanton stone
oak cosmos
```py
fig, ax= plt.subplots()
plt.plot(x= df['Column_1'], y= df['coulmn_5'], ......
Using this ya
Plot the graph
oak cosmos
well ofc u cant just copy the pasta
wanton stone
Obviously 😂
oak cosmos
ye ok, did it work?
wanton stone
Nope
I mean am tryin something but it ain't working
To show this
I gotta define x and y right ?
Then append into them ?
oak cosmos
nah u simply say
plt.plot(x= df['column'], y= df['column'])
you dont need to append or define anything @wanton stone
maybe you forgot to place an
plt.show()
``` in the end?I did try that but some error
I got a conference to attend rn
Sorry for takin up ur time
If ur free later could I hit u up for some doubts
Would appreciate it alot
arctic wedgeBOT
Here's how to format Python code on Discord:
```py
print('Hello world!')
```
These are backticks, not quotes. Check this out if you can't find the backtick key.
 woven coral

Explore and run machine learning code with Kaggle Notebooks | Using data from multiple data sources
 fading gate
anyone here programmatically produce ipynb and html reports? Just curious if you use nbformat or if you use some kind of templating language on top of it to simplify the process?
I'm mostly interested in producing ipynb files that can directly be rendered to html using nbconvert but also allow one to open the ipynb for further analysis if they wanted
 brave sand
does a genetic algorithm work in an moving environment?
 worldly dawn
brave sand
does a genetic algorithm work in an moving environment?
worldly dawn
brave sand
does a genetic algorithm work in an moving environment?
why not?
brave sand
worldly dawn
why not?
but how would it work if every iteration the environment changes?
worldly dawn
brave sand
but how would it work if every iteration the environment changes?
If it's a faithful evaluation of their fitness that does not introduce bias, then how would it be a problem?
brave sand
worldly dawn
If it's a faithful evaluation of their fitness that does not introduce bias, the...
how do I guarantee the environment to be without bias?
as in a moving asteroid area
worldly dawn
brave sand
how do I guarantee the environment to be without bias?
that's hyper specific to what you are doing.
But here is a counter example:
Let's assume you use the same environment over and over and it is always the same, with a single asteroid coming from the same location and with the same velocity.
I would expect your ship (assuming your context is about ship shooting lasers at asteroids) to be optimized for asteroids coming only from that single and very specific direction and velocity. It would utterly fail if an asteroid was to come from any other direction
brave sand
worldly dawn
that's hyper specific to what you are doing.
But here is a counter example:
Let...
So the environment has to be "enriching" ?
worldly dawn
brave sand
So the environment has to be "enriching" ?
Can you expand on that?
brave sand
worldly dawn
Can you expand on that?
As in multiple asteroids coming from all directions. I wanna be able to train an agent to fly from point x to point y
worldly dawn
brave sand
As in multiple asteroids coming from all directions. I wanna be able to train an...
yeah, that's where it can be a bit like a deal with the devil. You have to be very explicit about what you are optimizing for or else you will have some surprises.
At the end of the day, there are 50,000 ways to measure a fitness. It could be done across one environment or even across multiple ones.
 grand belfry
what ai is used to make images like this? its a trollface buf its a cake

 gilded bobcat
thats just food duh
 pearl sorrel
Can someone help me understand what I'm doing wrong here? I only want to keep a certain kind of row from the "rules" table and I'm trying, but failing, to do that using a good old JOIN... (pandas.merge)


 arctic crown
please help
[[10 5 7 3 2 3]]
[[72000 60000 70000 62000 65000 50000]]
(6, 1)
(6, 1)
Traceback (most recent call last):
File "c:/Users/ashmi/Desktop/ML/ML.py", line 14, in <module>
model.fit(np.array([time_train]).reshape(1,-1), np.array([score_train]).reshape(-1,1))
File "C:\Users\ashmi\AppData\Local\Programs\Python\Python38\lib\site-packages\sklearn\linear_model_base.py", line 684, in fit
X, y = self._validate_data(
File "C:\Users\ashmi\AppData\Local\Programs\Python\Python38\lib\site-packages\sklearn\base.py", line 596, in _validate_data
X, y = check_X_y(X, y, **check_params)
File "C:\Users\ashmi\AppData\Local\Programs\Python\Python38\lib\site-packages\sklearn\utils\validation.py", line 1092, in check_X_y
check_consistent_length(X, y)
File "C:\Users\ashmi\AppData\Local\Programs\Python\Python38\lib\site-packages\sklearn\utils\validation.py", line 387, in check_consistent_length
raise ValueError(
ValueError: Found input variables with inconsistent numbers of samples: [1, 6]
from sklearn import linear_model
import pandas as pd
import numpy as np
import matplotlib.pyplot as plt
from sklearn.model_selection import train_test_split


dataset = pd.read_csv("hiring.csv")

time_train, time_terst, score_train, score_test = train_test_split(dataset.experience, dataset.salary, test_size=0.2)

print(np.array([time_train]).reshape(1,-1))
print(np.array([score_train]).reshape(1,-1))

print(np.array([time_train]).reshape(-1,1).shape)
print(np.array([score_train]).reshape(-1,1).shape)

model = linear_model.LinearRegression()
model.fit(np.array([time_train]).reshape(1,-1), np.array([score_train]).reshape(1,-1))
print(model.score(time_terst, score_test)) ```it prints dtype('<M8[ns]')
And df['Week'] is
0 2010-01-04 1 2010-01-11 2 2010-01-18 3 2010-01-25 4 2010-02-01 5 2010-02-08 6 2010-02-15 7 2010-02-22 Name: Week, dtype: datetime64[ns]
lapis sequoia
Anyone know a good Speech recognition to use? because I've had no reliable one so far
 woeful ridge
Hi all! I'm trying to plot volumetric data like this image. The problem is, I can't get my data into the right shape. Currently I have a pandas dataframe that has columns of x,y,z data and forth column of temperature data. I want to wrangle this dataframe into the right shape that that I can pass it to plotly and generate a plot like the one shown. Hoping someone can help. I've attached some example code.
Code used to generate plot I want: https://plotly.com/python/3d-volume-plots/
Code used to generate fake data in the shape of the dataframe I currently have:
df = pd.DataFrame({'x': [1, 2, 3, 4], 'y': [5, 6, 7, 8], 'z': [9, 10, 11, 12], 'value': [0.5, 0.7, 0.2, 0.9]})
 queen cradle
woeful ridge
Hi all! I'm trying to plot volumetric data like this image. The problem is, I ca...
queen cradle
woeful ridge
Hi all! I'm trying to plot volumetric data like this image. The problem is, I ca...
Your fake data doesn't enclose any volume, so there's nothing to render. If you simply give it a little more data, it works just fine:
import plotly.graph_objects as go
import numpy as np
import pandas as pd

import chromophile as cp

df = pd.DataFrame({
    'x': [1, 1, 1, 1, 2, 2, 2, 2],
    'y': [1, 1, 2, 2, 1, 1, 2, 2],
    'z': [1, 2, 1, 2, 1, 2, 1, 2],
    'value': np.linspace(0, 1, 8),
})

fig = go.Figure(data=go.Volume(
    x=df['x'],
    y=df['y'],
    z=df['z'],
    value=df['value'],
    isomin=0.1,
    isomax=0.8,
    opacity=0.1, # needs to be small to see through all surfaces
    surface_count=17, # needs to be a large number for good volume rendering
    colorscale=cp.palette.cp_dawn,
    ))
fig.show()
Thanks so much Kyle. I feel like an idiot for not figuring that out. However, when I try it with real data, I run into more problems. It seems like plotly isn't able to render the webpage and I get a spinning wheel of death in chrome. What's the best way to share you a csv file or a parquet?
here's a dropbox link:
reef osprey
charred light
You'll need to know NLP (nltk package) among others.
Alright thanks
lapis sequoia
It is good
but I think you should make line number 3 and y on line
and try using a good editor
like pycharm or slime
cool
clever owl
I have a column of date strings I know are from between January and February 2020. I want to sort them in ascending order. However, they are in different formats some in mm/dd/yy, some in dd/mm/yy. How can I sort them>
data = {
    'date': ['1/1/2020','20/1/2020', '1/1/2020', '1/28/2020','21/1/2020', '1/25/2020', '29/1/2020'],
}


df = pd.DataFrame(data)

print(df)
If your data doesn't really make a delineation between 12/1/2020 and 1/12/2020 within its structure (ie, it uses mm/dd/yy and dd/mm/yy) there's not a whole lot you can do to make that play nicely.
(I realize my canned API reference didn't answer that portion of the question, I apologize for that.)
clever owl
hidden mist
If your data doesn't really make a delineation between 12/1/2020 and 1/12/2020 w...
I know for a fact that regardless of if it is 12/1/2020 or 1/12/2020 its the 12th of January, since the dates are all between January and February
hidden mist
second just writing some stuff out.
clever owl
easy
hidden mist
What's your actual desired format, mm/dd/yy or dd/mm/yy
clever owl
dd/mm/yy
hidden mist
!e ```py
import pandas as pd
data = {
'date': ['1/1/2020','20/1/2020', '1/1/2020', '1/28/2020','21/1/2020', '1/25/2020', '29/1/2020'],}
newdata = []
for date in data['date']:
datearray = date.split('/')
if int(datearray[1]) > 2:
flip = datearray[1]
flop = datearray[0]
datearray[0] = flip
datearray[1] = flop
newdata.append(datearray[0]+'/'+datearray[1]+'/'+datearray[2])
df = pd.DataFrame(newdata)
print(df)```
arctic wedgeBOT
@hidden mist :white_check_mark: Your 3.11 eval job has completed with return code 0.
001 |            0
002 | 0   1/1/2020
003 | 1  20/1/2020
004 | 2   1/1/2020
005 | 3  28/1/2020
006 | 4  21/1/2020
007 | 5  25/1/2020
008 | 6  29/1/2020
I didn't test that for February, but it should work 🤷♂️ Just use pandas to_date and then sort and you're donezo! 😄
 charred wedge
What are the recommendations for an open source data catalog?
clever owl
hidden mist
!e ```py
import pandas as pd
data = {
'date': ['1/1/2020','20/1/2020', '1/1/...
Mm interesting, your approach was to manually parse it out, I wouldve thought there'd be some pandas way to do it
It does seem a bit fragile if you get to larger months tho, say I wanna do october e.g
!e
import pandas as pd

data = {
    'date': ['10/1/2020','1/10/2020'],}
newdata = []

for date in data['date']:
    datearray = date.split('/')
    if int(datearray[1]) > 11:
        flip = datearray[1]
        flop = datearray[0]
        datearray[0] = flip
        datearray[1] = flop
    newdata.append(datearray[0]+'/'+datearray[1]+'/'+datearray[2])

print(newdata)
@clever owl :white_check_mark: Your 3.11 eval job has completed with return code 0.
['10/1/2020', '1/10/2020']
Anything is going to get fragile if you get close to larger months.
10/1/2020 and 1/10/2020 are both valid dates.
And there's no way to distinguish whether or not its in the correct format.
That specific script will fail to distinguish 1/2 and 2/1 from each other.
clever owl
Ill probs end up writing something similar to yours, since I know that the month is gonna be october, check if the xx in, ../xx/.. , is a 10, then chill, else if the first .. is a 10 then flip, else if neither the first nor the middle is 10 then fail since it won't be october
hidden mist
Yeah, just gotta' get creative. You know which numbers are invalid, just work around that information. Anything other than that will depend on some further subset of data, or won't be distinguishable.
hasty mountain
grand belfry
what ai is used to make images like this? its a trollface buf its a cake
Generative Adversarial Networks
Probably one focused on Super Resolution, so it just changes the "texture" of the image, not the dimensions
I think the "Anime Filter" Tencent implemented in Tiktok that went viral is even from Real-ESRGAN
hidden mist
I'm reading Probabilistic Machine Learning by Kevin Murphy and he hits me with the phrase "Let us suppose, for simplicity..." before dropping the fattest equation on me I have ever seen in my life.
 boreal gale
hidden mist
I'm reading Probabilistic Machine Learning by Kevin Murphy and he hits me with t...
boreal gale
hidden mist
I'm reading Probabilistic Machine Learning by Kevin Murphy and he hits me with t...
out of curiosity, what's the equation?
and yes, us mathematician like to use phrases like that + "trivial" and "left as an exercise to the reader" 😂
hidden mist
I’m in bed now but if you’re truly curious I believe it’s around page 70-72 in the book. (Which is free from the author.)
 ruby depot
Hello! i'm building a feedforward model and I always get an Explained variance: 0.0 and the same value every time in my model. I know it could be under fitting or overfitting, i changed regularizers, dropout, neuron density and everytime i get the same results. waht to do next?
tidal bough
hidden mist
I’m in bed now but if you’re truly curious I believe it’s around page 70-72 in t...
this?

 copper umbra
Looking for opinions of best libraries to make highly format printable reports from pandas data. Texts headers, paragraphs, formatting, tables and charts etc. Perferred output is not dashboard format but more PDF word excel (customers are low tech).
I am converting a process what the previous employee manually transferred into an excel file with 20 tabs that had fancy formats, doesnt have to look the same but more professional than simple text
oak cosmos
wanton stone
Just got done with my work
U there <@1070132973132845156>
im here rn
oak cosmos
tidal bough
this?
hell nah i just had maths
 stoic bane
Has anyone here worked with "neat-python" library before? I have a rather simple yet specific question and couldn't find a straight answer yet.
So what I am wondering is, does neat-python library take into account intermediate values of fitness or only the final fitness value?
For example, I made simple Pong game. If I update genome.fitness every frame, eg. reward them for getting a score, vs. store the score in a seperate variable and change their fitness at the end of the match, will that make a difference in genome's performance or further offsprings? (considering the final genome fitness will be exactly the same at the end no matter which approach I take).
If anyone knows I would really appreciate it
I found this in the documentation:
To evolve a solution to a problem, the user must provide a fitness function which computes a single real number indicating the quality of an individual genome: better ability to solve the problem means a higher score.
So I suppose that means that NEAT-Python library takes into account only the final fitness value (and NOT intermediate values of fitness), meaning when the fitness value is changed (as long as it ends up the same) shouldn't affect genome's performance... i think? 😅
 novel python
guys, I wanted to make this code simpler:
df_no_zeros = df[(df['January'] > 0) & (df['February'] > 0) & (df['March'] > 0) & (df['April'] > 0) & (df['May'] > 0) & (df['June'] > 0) & (df['July'] > 0) & (df['August'] > 0) & (df['September'] > 0)].reset_index().drop('index', axis=1)
basically, I'm just creating a dataframe without 0s. But I'm afraid there might be an easier solution where I don't have to hardcode the columns in there, but I just can't find a solution to it. I thought this might work:
df_no_zeros = df[(df[df.columns[3:]] > 0)]
but it returns me the whole dataframe with NaN where this case isn't true, not a filtered df. Not sure if I'm overthinking, but I'll appreciate any insights. Thanks in advance!
boreal gale
novel python
guys, I wanted to make this code simpler:
```py
df_no_zeros = df[(df['January']...
need more info, what's the layout of your dataframe? what columns are there?
novel python
boreal gale
need more info, what's the layout of your dataframe? what columns are there?
columns are the months, rows are the usage of data for a variety of mobile lines
so pretty much just values ranging from 0 to whatever, I want to filter out the 0s
boreal gale
!e
import pandas as pd
df = pd.DataFrame({"jan": [1,2,0], "feb": [0,1,2]})
print(df[(df > 0).all(axis=1)])
@boreal gale :white_check_mark: Your 3.11 eval job has completed with return code 0.
001 |    jan  feb
002 | 1    2    1
this?
serene scaffold
.reset_index().drop('index', axis=1) this seems redundant?
unless you had a non-range index, I guess. but you can do .reset_index(drop=True)
novel python
boreal gale
!e
```
import pandas as pd
df = pd.DataFrame({"jan": [1,2,0], "feb": [0,1,2]})
p...
exactly that
ty very much, didn't know about .all
novel python
serene scaffold
unless you had a non-range index, I guess. but you can do `.reset_index(drop=Tru...
oh yea, I guess that too
thanks, guys!
boreal gale
novel python
ty very much, didn't know about .all
.all and .any are friends, and are well worth remembering
 serene scaffold
boreal gale
`.all` and `.any` are friends, and are well worth remembering
serene scaffold
boreal gale
`.all` and `.any` are friends, and are well worth remembering
na uh, I saw them fighting at a party last week
boreal gale
heh 😛
novel python
serene scaffold
```py
df[reduce(and_, (df[month].gt(0) for month in ['January', 'February', ...]...
what is that "and_"
serene scaffold
novel python
what is that "and_"
it's the same as lambda a, b: a & b
boreal gale
if i am not mistaken, it's functools.reduce and operator.and_ (this is same as lambda a, b: a & b as mentioned above)
 candid garnet
I have two columns of data inside an array waves. Each row contains two solutions to a quadratic equation for an associated frequency. Therefore, each column should be continuous.
However, occasionally the two quadratic equation solutions are returned 'swapped', and it's very easy to see by eye when this has happened:
 [1.87818391 +631.29563062j, 789.98518552+34.33014745j]
 [1402.82082129+84.79794406j, 2.40353116 +607.05689764j]
 [1602.45701021+4146.32391044j, 3.18701564 +575.16495683j]```

You can see here a very sudden shift in the real components and imaginary components of each element. I.e. the second element of row 3 has an imaginary component that corresponds with the first element of row 2, and should be swapped.

It's difficult to find the right words to convey this meaningfully, but essentially I have two columns of data that have randomly had their elements swapped within rows and I need to untangle that.

I've tried things like looping through:
condition_1 = abs(item[0].imag - previous[1].imag) < abs(item[0].imag - previous[0].imag)
condition_2 = abs(item[0].real - previous[1].real) < abs(item[0].real - previous[0].real)
    condition_3 = abs(item[1].imag - previous[0].imag) < abs(item[1].imag - previous[1].imag)
    condition_4 = abs(item[1].real - previous[0].real) < abs(item[1].real - previous[1].real)


    if (condition_1 and condition_2) or (condition_3 and condition_4):
        item = np.flip(item)
but some issues still slip through the cracks. Any ideas?occasionally the two quadratic equation solutions are returned 'swapped'
are you certain this swap doesn't happen too often such that there are more swapped entries than non-swapped entries?
visually speaking you can split these into two groups, by using a simple y=x equation, and you just need to flip the minority to the majority side - just a thought 🤷♂️
wooden sail
the easiest check would be to consider the squared distance and take the one that is closest
candid garnet
wooden sail
the easiest check would be to consider the squared distance and take the one tha...
squared distance between which elements? with the one in the previous row?
wooden sail
either of the two elements of the previous row and the two elements of the current row
but notice this test (and all other point-wise tests) will fail when the two waveforms cross each other
at that point you need a method of extrapolation
like considering a handful of previous points, doing a taylor expansion, and seeing which of the upcoming points fits the taylor polynomial the best
 atomic tide
How is the data generated? How do the values end up swapped?
candid garnet
    z_plus = (-a2 + np.sqrt(a2**2. - 4. * a0 * a4))/(2. * a0)
    z_minus = (-a2 - np.sqrt(a2**2. - 4. * a0 * a4))/(2. * a0)

    kya = np.sqrt(z_minus)
    kyb = np.sqrt(z_plus)

    waves = np.column_stack((kya,kyb))
a0, a2, a4 are all coefficients of shape (300,)
 stone glacier
am I in the right place?